THE EFFECTIVENESS OF THE CAUSE-MAP ... - Texas A&M …
70
THE EFFECTIVENESS OF THE CAUSE-MAP SYSTEM IN TEACHING INTERCONNECTED COMPLEX EARTH SYSTEMS IN A TEXAS PRIVATE SCHOOL A Thesis by PATRICIA ANN FORSHEE Submitted to the Office of Graduate Studies of Texas A&M University in partial fulfillment of the requirements for the degree of MASTER OF SCIENCE Approved by: Co-Chairs of Committee, John Giardino Carolyn Schroeder Committee Member, John Vitek Head of Department, John Giardino December 2012 Major Subject: Geology Copyright 2012 Patricia Ann Forshee
Transcript of THE EFFECTIVENESS OF THE CAUSE-MAP ... - Texas A&M …

THE EFFECTIVENESS OF THE CAUSE-MAP SYSTEM IN TEACHING
INTERCONNECTED COMPLEX EARTH SYSTEMS IN A TEXAS PRIVATE
SCHOOL
A Thesis
by
PATRICIA ANN FORSHEE
Submitted to the Office of Graduate Studies of Texas A&M University
in partial fulfillment of the requirements for the degree of
MASTER OF SCIENCE
Approved by:
Co-Chairs of Committee, John Giardino Carolyn Schroeder Committee Member, John Vitek Head of Department, John Giardino
December 2012
Major Subject: Geology
Copyright 2012 Patricia Ann Forshee

ii
ABSTRACT
The six subsystems of Earth (atmosphere, hydrosphere, lithosphere, biosphere,
cryosphere and anthroposphere) are complex and dynamic. Because all subsystems are
linked, study from an independent perspective and a composite perspective is
fundamental. Unfortunately, because of current instructional methods, students tend to
consider these systems unrelated and use linear cause and effect models where little to
no interaction occurs between different systems and the components. The simplistic and
incorrect view of systems is the fundamental reason more education about Earth systems
science is necessary in the K-12 curriculum.
In this study, the Cause-MaP system of studying complex Earth systems in a private
intermediate school in Texas was evaluated. The objective was to ensure that students
are more aware of how Earth affects them and vice versa. An added benefit of the study
was the opportunity to teach scientific reasoning. Students completed a pre-unit test to
measure a priori knowledge. The students then worked through a modified Cause-MaP
system in which they took notes in a structured table format; then each created a concept
map. Students completed these steps for two subsystems: hydrosphere and lithosphere.
The individual concept maps were used to assess knowledge and understanding of the
individual systems by each student. At the end of the unit, students created composite
concept maps which included each system they studied in this unit, to illustrate the
interconnectedness of Earth systems. Based on the number of components and processes
iii
included, the students’ maps were evaluated to determine their understanding of the
interactions between multiple Earth systems. The students’ maps were grouped based on
the number of components and processes included in the concept maps. A post-unit test
was also administered, which included two similar questions. The pre-unit test was
completed again to check the overall progress of the students involved in this study. The
students showed, with practice and encouragement from their instructor, that they
recognize intersystem connections in complex Earth systems. With more integration of
programs like these, students will become more proficient in recognizing system
interactions.

iv
To my wonderful family and friends who have encouraged me through pep talks, many
hugs, and unceasing prayer.

v
ACKNOWLEDGEMENTS
I would like to thank God with whom all things are possible. I would also like to thank
all of my family and friends for their constant prayer.
I would like to thank my committee chairs, Dr. Giardino and Dr. Schroeder, as well as
my committee member, Dr. Vitek who have taught me invaluable lessons, and cultivated
and encouraged my research topic and in turn my thesis. They have blessed my time as a
graduate student and for that I am grateful.
A special thanks to my friends, professors, and colleagues in the College of Geoscience
and the Department of Geology and Geophysics for being a part of my Aggie family.
Finally, thanks to my mother and father for their boundless encouragement and for
teaching me to work hard, my in-laws for their support and encouragement, and to my
husband for his constant love and support.
vi
TABLE OF CONTENTS
Page
ABSTRACT .............................................................................................................. ii
DEDICATION .......................................................................................................... iv
ACKNOWLEDGEMENTS ...................................................................................... v
TABLE OF CONTENTS .......................................................................................... vi
LIST OF FIGURES ................................................................................................... vii
LIST OF TABLES .................................................................................................... ix
INTRODUCTION ..................................................................................................... 1
OBJECTIVES ........................................................................................................... 4
METHODS ................................................................................................................ 7
DATA ANALYSIS ................................................................................................... 13
Student Population ........................................................................................ 13 Pre-test and Post-test ..................................................................................... 14 Rock Cycle .................................................................................................... 17 Composite Cycle Diagrams ........................................................................... 20 End of Unit Test ............................................................................................ 24 How These Students Compare to the Idealized Standard ............................. 29 How These Students Compare to Their Public School Peers ....................... 31 DISCUSSION AND CONCLUSION ....................................................................... 35 REFERENCES .......................................................................................................... 38 APPENDIX A ........................................................................................................... 39 APPENDIX B ........................................................................................................... 51 APPENDIX C ........................................................................................................... 54
vii
LIST OF FIGURES
FIGURE Page
1 Exam question used by Clark et al. (2009) in conjunction with question 2 above ................................................................................. 10 2 Question 14 from the end of unit test. ........................................................ 10 3 Question 15 from the end of unit test. ........................................................ 11 4 Question 15 from the pre-test. .................................................................... 15 5 Graph depicting the number of correct answers for each question on the pre-test vs. the number of correct answers on the post-test ........................................................................................... 17 6 Student number seven’s answers to the questions in step 1 of the Cause-MaP process. ......................................................................... 18 7 Student number ten’s answers to the questions in step 1 of the Cause-MaP process. ......................................................................... 19 8 Idealized version of the composite cycle diagram the the students were asked to draw. ................................................................ 21 9 The composite cycle diagram created by Group 3. .................................... 22 10 “The lithosphere can be moved into the mantle by slab-pull. Slab-pull is when two plates are converging and one slides under the other.” Student 10’s answer to question 14 from the end of unit test. ..................................................................................... 25 11 “The plates on “A” could shift causing an earthquake, which makes it go down to “B”.” Student 11’s answer to question 14 from the end of unit test. ....................................................................... 26

viii
weathering, erosion, sedimentation, cementation, and compaction occur to make it a sedimentary rock. Then the rock gets weathered again and becomes sediment.” Student 5’s answer to question 15 from the end of unit test. ..................... 28 13 “First, the volcano erupts then the lava goes towards the ocean. Next the water cools it. Finally, lava dries on the beach.” Student 3’s answer to question 15 from the end of unit test………………………………………………………..………. 29 14 An excerpt of the American Association for the Advancement of Science, Atlas of Science Literacy, Vol. 1, 2001, page 51, concept map which specifically addresses grades six through eight (Project 2061, 2001, pg 51). ....................................................................... 30 15 Question 23 from the 2009 fifth grade science TAKS test. ....................... 32 16 Question number 7 from the pre-test/post-test. .......................................... 33 17 Question 15 from the post-unit test. ........................................................... 34
12 ñThe lava cools and turns into igneous rock and the

ix
LIST OF TABLES
TABLE Page 1 Structured questions with example answers from step 2 of the Cause-MaP process(Clark et al., 2009). ................................ 8 2 Tabulation of the answers, from step 2 of the Cause-MaP process, into a structured argument table (Clark et al., 2009).. .................. 9 3 Amount of time each student involved in the study has been enrolled in the school as of the end date of this study. ............................... 13 4 Grading rubric for the composite cycle diagrams. ..................................... 23

1
INTRODUCTION
A system is a regularly interacting or interdependent group of items forming a unified
whole. A system can be defined as either open or closed. In a closed system, only energy
crosses the boundary of the system to influence variables in that system. Mass cannot
enter or depart the closed system. In an open system, energy and mass can cross the
boundary of a system such that variables outside the boundaries of a defined system can
interact with different aspects of the system.
Earth consists of six distinctive subsystems: the atmosphere, the hydrosphere, the
lithosphere, the biosphere, the cryosphere and the anthroposphere (Clark et al., 2009).
Although each subsystem can be studied independently of the other subsystems, one
must take into account that each component in a system not only affects every other
component in the subsystem but those in other subsystems as well. All the subsystems of
Earth are linked. These interactions are important because of the interconnectedness of
variables in all systems. As a result of these interactions, it is relevant to study the
systems from an independent perspective as well as a composite perspective. In Earth
Systems Science, Earth is considered a dynamic system with “interactive phenomena,
processes and cycles” (Schroeder, 2006; 19). In the systems of Earth, interacting
components include humans. Because of this, students must recognize how all variables
in a system impact each other, especially how humans affect their surroundings and vice
versa (Assaraf and Orion, 2005). Unfortunately, students tend to consider these systems

2
as conglomerates of unrelated parts using linear cause and effect models – where little to
no interactions occur between different systems and their components (Assaraf and
Orion, 2005; Raia, 2008; Clark et al., 2009).
The simplistic and incorrect view of systems, especially Earth systems, is the
fundamental reason more education about Earth systems science is necessary in the K-12
curriculum. Implementing Earth systems science in classrooms provides educators an
opportunity to integrate inquiry-based instruction into the classroom (Schroeder, 2006).
Approaching the instruction of Earth systems science from an inquiry-based approach
gives educators the opportunity to present ill-defined problems, which are typically
missing in public education, in place of well-defined problems that provide too much
information (Rostan, 1994; Schroeder, 2006). Introducing ill-defined problems, like
those in Earth science, is also an important step in increasing authentic inquiry in public
school classrooms in ways that are relevant to students (Schroeder, 2006). Ill-defined
problems include many independent variables and few dependent variables, they do not
have “correct” or “incorrect” answers, and no “correct” steps exist to solve the problem.
Well-defined problems do not leave room for scientific questions because strictly
structured steps exist to solve the problems and a right or wrong answer exists.
In this study, the Cause-MaP method is used to study how students learn Earth systems
science. Cause-MaP stands for ‘Cause, Matter, and Process’ and was originally designed
to “enhance non-science major undergraduates’ understanding of complex Earth

3
systems.” (Clark et al., 2009; 233). Cause-MaP provides a structured order for students
to work through individual systems and combinations of multiple systems, where
everything that affects the system is compiled to create a map showing how matter flows
through the system (Clark et al., 2009).

4
OBJECTIVES
This study examines the students’ abilities to solve and understand complex Earth
systems. The students learned and executed a modified Cause-MaP problem solving
method. At the beginning of the geology unit of the science curriculum, students were
administered an assessment test. The same test was administered as a post-test at the end
of the learning unit to assess the students’ progress and understanding of complex Earth
systems.
This study integrated the following TEKS (Texas Essential Knowledge and Skills) for
sixth grade science:
“(3) Scientific investigation and reasoning. The student uses critical thinking,
scientific reasoning, and problem solving to make informed decisions and knows
the contributions of relevant scientists. The student is expected to:
(A) in all fields of science, analyze, evaluate, and critique scientific
explanations by using empirical evidence, logical reasoning, and
experimental and observational testing, including examining all sides of
scientific evidence of those scientific explanations, so as to encourage
critical thinking by the student;
(B) use models to represent aspects of the natural world such as a model
of Earth's layers;

5
(C) identify advantages and limitations of models such as size, scale,
properties, and materials; and
(D) relate the impact of research on scientific thought and society,
including the history of science and contributions of scientists as related
to the content.
(10) Earth and space. The student understands the structure of Earth, the rock
cycle, and plate tectonics. The student is expected to:
(A) build a model to illustrate the structural layers of Earth, including the
inner core, outer core, mantle, crust, asthenosphere, and lithosphere;
(B) classify rocks as metamorphic, igneous, or sedimentary by the
processes of their formation;
(C) identify the major tectonic plates, including Eurasian, African, Indo-
Australian, Pacific, North American, and South American; and
(D) describe how plate tectonics causes major geological events such as
ocean basins, earthquakes, volcanic eruptions, and mountain building.
Private schools in Texas are not required to use the TEKS as their standards. The
teacher in this classroom chose to follow the TEKS because the school only included
grades kindergarten through eight, and many students move to the public school system

6
after the eighth grade. This study tested the students’ ability to transfer knowledge
between the different Earth systems. Many interconnecting variables exist between Earth
systems. Earth systems, however, are traditionally taught as isolated, stand-alone
systems, in turn teaching students to associate variables with specific systems (Clark et
al., 2009). The Cause-MaP method is designed to teach students about complex systems
in a way that will help them recognize dependent variables that are present in multiple
Earth systems and how each system affects other systems.
This research studied middle school students’ abilities to follow matter through a
dynamic system and to identify the relationships between different systems. This study
shows that with practice students will transfer knowledge from one system to the next
and from one problem to another in varying degrees. Students traditionally have
difficulty understanding dynamic systems because of the many dependent variables and
limited independent variables (Clark et al., 2009). These difficulties are evident in
students’ isolation and fragmentation of scientific concepts (Clark et al., 2009). The
students’ learning was evaluated based on the differences in their answers to the pre and
post-unit surveys, as well as the post-unit test and the sophistication of the students’
concept maps. Sophistication was assessed through constant comparative analysis.

7
METHODS
The two units, in which the students received instruction on the rock cycle and the
mantle convection cycle, lasted six school weeks. Students were recruited from one
intermediate, private school classroom in Texas. The students first took a pre-test. The
pre-test was created using the Geoscience Concept Inventory (GCI), included in
appendix C on pages 54 through 57, and was re-administered at the end of the unit as a
post-test. The GCI is designed for grades eight through twelve. The GCI format requires
15 questions to be included in the test. Only four questions were available which
directly related to the material presented in this study, and the remainder of the questions
were chosen to fill in the additional required questions on the test.
Students received instruction on the lithosphere and reviewed prior instruction on the
hydrosphere. The instruction was delivered in a lecture style with accompanying
PowerPoint™ presentations and videos from Discovery Education™ for visual aid.
Students also used charts to organize their notes. For each sphere, the students studied a
cycle contained in the sphere, such as the relationship between the water cycle and the
hydrosphere. They also analyzed how the water cycle and lithosphere interact. The
students completed a modified Cause-MaP analysis on each sphere, one sphere at a time.
The first step in the Cause-MaP process had the students answering a set of five
questions for each process in the system (Table 1). The first question (Question 1) states

8
“what matter is being traced” (Clark et al., 2009; 235)? Question 2 queried “what is the
process occurring” (Clark et al., 2009; 235)? Question 3 asked “what is causing the
process to occur” (Clark et al., 2009; 235)? Question 4 questioned “what is the scientific
terminology for the process” (Clark et al., 2009; 235)? Question 5 challenged “what is
changing or moving” (Clark et al., 2009; 235)? The students involved in this study did
not directly answer the questions; however they did answer these using a scaffolded
method. The scaffolded method used the chart from the second step to help the students
take notes. The second step in the process had students tabulate the answers into a
structured argument table, similar to the one shown in Table 2 below. This step has been
modified to fit in the curriculum as notes and to make the Cause-MaP analysis more age
appropriate. An example of an idealized table for each system is located in Appendix B
on pages 51 through 52. The last step is to create a box-and-arrow diagram.
Table 1: Structured questions with example answers from step 2 of the Cause-MaP process (Clark et al., 2009). Reprinted with permission from Clark et al, 2009 and the Journal of Geoscience Education volume 57 issue 4 http://nagt-jge.org/toc/jgee/57/4

9
Table 2: Tabulation of the answers, from step 2 of the Cause-MaP process, into a structured argument table (Clark et al., 2009). Reprinted with permission from Clark et al, 2009 and the Journal of Geoscience Education volume 57 issue 4 http://nagt-jge.org/toc/jgee/57/4
After completing the Cause MaP analysis on one of the spheres, the students used the
same method to analyze the second sphere. After the two spheres were analyzed,
students were tested on their content knowledge. On the test two questions were similar
to the ones, shown below, that Clark et al. (2009) used:
1. “Summer is upon us and it is frequently muggy (i.e., hot and sticky) outside. The
mugginess is due to heat and water vapor in the air. What is the main way for
the water vapor to leave the atmosphere? (include all necessary steps)” (Clark
et al., 2009; 237)
2. “Looking at the following figure [Figure 1], please show how water from the
swimming pool could end up in the neighbor’s carrot. Answer using the
structured argument table and a box-and-arrow diagram.” (Clark et al., 2009;
238)

10
Figure 1: Exam question used by Clark et al. (2009) in conjunction with question 2 above. Reprinted with permission from Clark et al, 2009 and the Journal of Geoscience Education volume 57 issue 4 http://nagt-jge.org/toc/jgee/57/4
The questions used on the final test for the test subjects are shown below, in Figures 2
and 3.
Figure 2: Question 14 from the end of unit test.

11
Figure 3: Question 15 from the end of unit test.
These questions were derived from the original questions used in Clark et al. (2009).
The root questions are the same. Question 15 above is derived from Question 1 from
Clark et al. (2009), while Question 14 above is derived from Question 2 from the same
paper. The questions from Clark et al. (2009) were not used verbatim because the water
cycle was not presented in detail in class. The water cycle was only presented as a
review, and, therefore, not included on the unit content knowledge test by the instructor.
The rock cycle and plate tectonics were the main focus of the curriculum during the six
weeks, so the questions were drawn from those two topics. Questions 14 and 15 were the
only information from the unit content knowledge test that was analyzed.
It was important that the topics specified by the Texas state objectives, the Texas
Essential Knowledge and Skills (TEKS), were covered as well as the integral
information the students needed to complete the analysis process. Because of time
constraints, however, the students did not complete all of the steps for all of the cycles.
For the rock cycle, the students did all three steps of the Cause-MaP analysis in a quiz
style. The quiz was completed over a two day period. The amount of questions and

12
white space on the paper overwhelmed many of the students and they took more time
than anticipated. These results led to rescaffolding the lesson plans so that step one was
combined with step two and integrated into the students note taking for the mantle
convection cycle. Scaffolding is the infrastructure through which a teacher provides
support for students. As students achieve learning goals their need for support decreases
and the scaffolding may be reduced accordingly. The curriculum schedule did not allow
time for the students to create a box-and-arrow diagram of the mantle convection cycle.
For the third cycle, the water cycle, the curriculum did not allow time for students to use
a notes chart or create a box-and-arrow diagram. The students were, however, able to
create a composite cycle diagram of all three cycles together. The students worked in
groups of three to create these diagrams; see Appendix A, pages 48 through 50.

13
DATA ANALYSIS
Student Population
The students included in this study attend a Christian, private school in south Texas
which serves students from pre-school through the eighth grade. The school teaches a
young-Earth creationism science curriculum. Ten students from the sixth grade science
class participated in this study. Table 3, below, shows the amount of time each student
involved in this study has been enrolled in the school as of the end date of this study.
Student # Years Months
1 2 1
2 5 4
3 0 9
5 3 8
6 5 4
7 5 4
9 2 4
10 5 4
11 3 9
12 0 1
Table 3: Amount of time each student involved in the study has been enrolled in the school as of the end date of this study.
14
This study did include the special needs students in the class. Modifications were made
to the study in accordance with their Individual Education Plans (IEPs). For this study,
the modifications consisted of giving the students extra time to complete the
assignments.
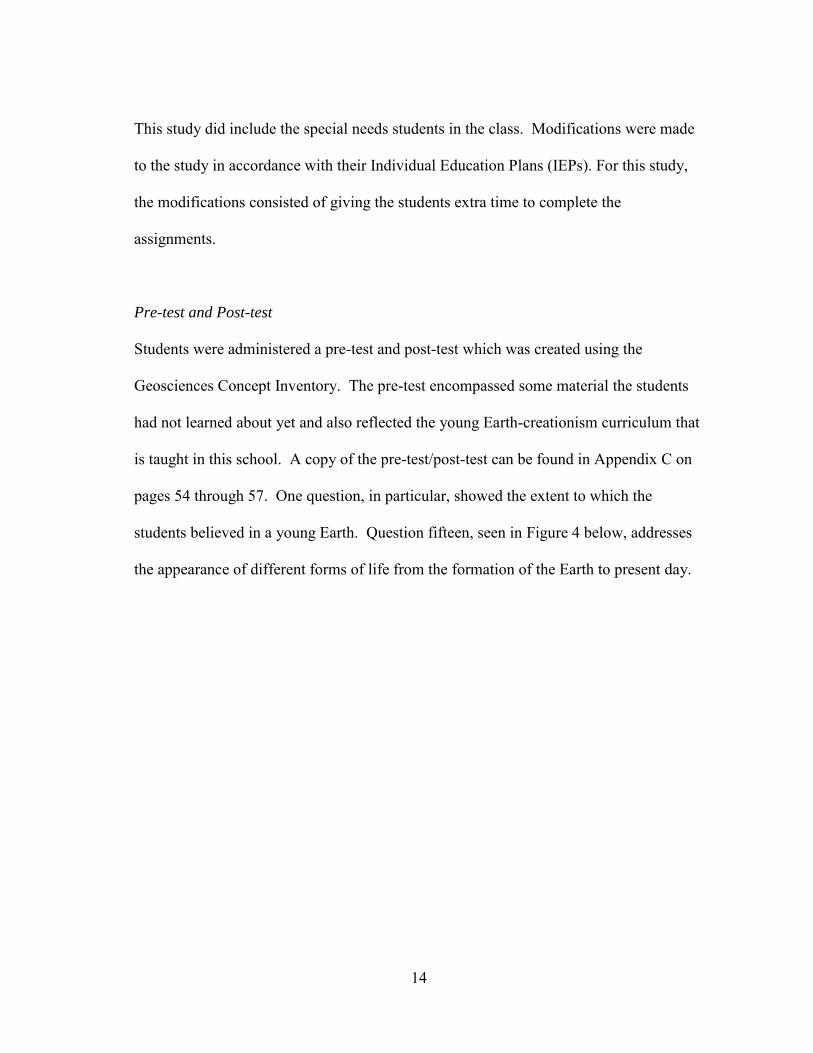
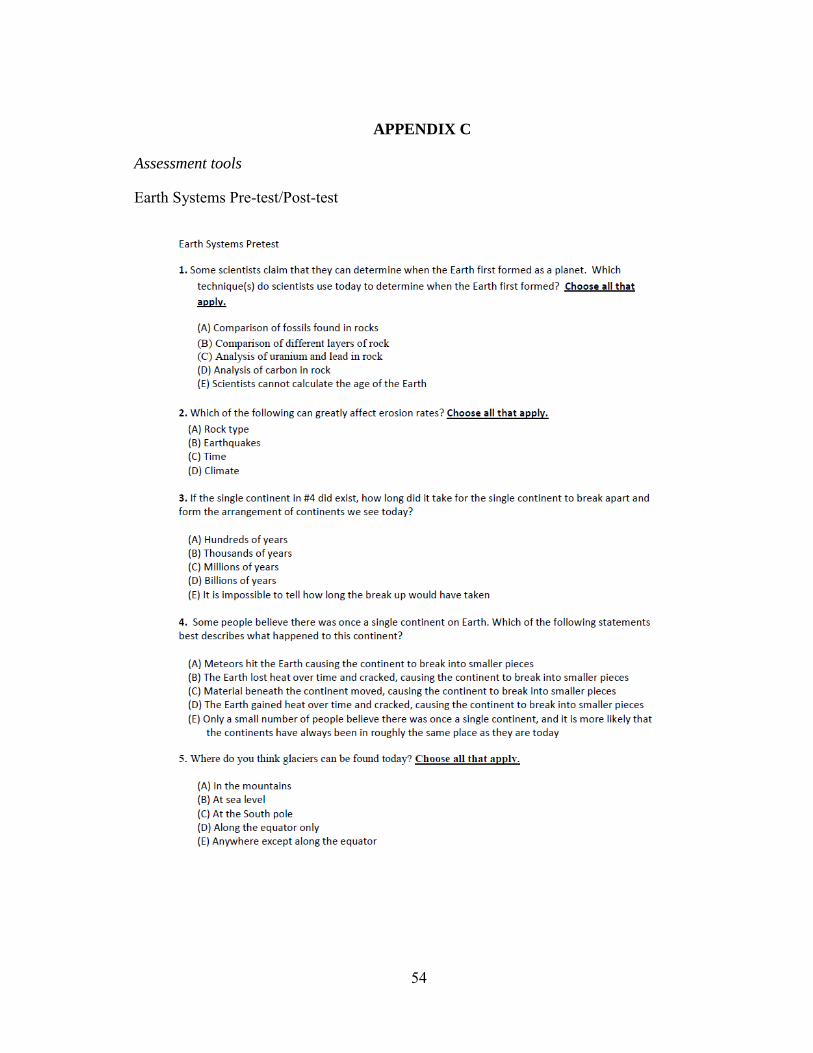
Pre-test and Post-test
Students were administered a pre-test and post-test which was created using the
Geosciences Concept Inventory. The pre-test encompassed some material the students
had not learned about yet and also reflected the young Earth-creationism curriculum that
is taught in this school. A copy of the pre-test/post-test can be found in Appendix C on
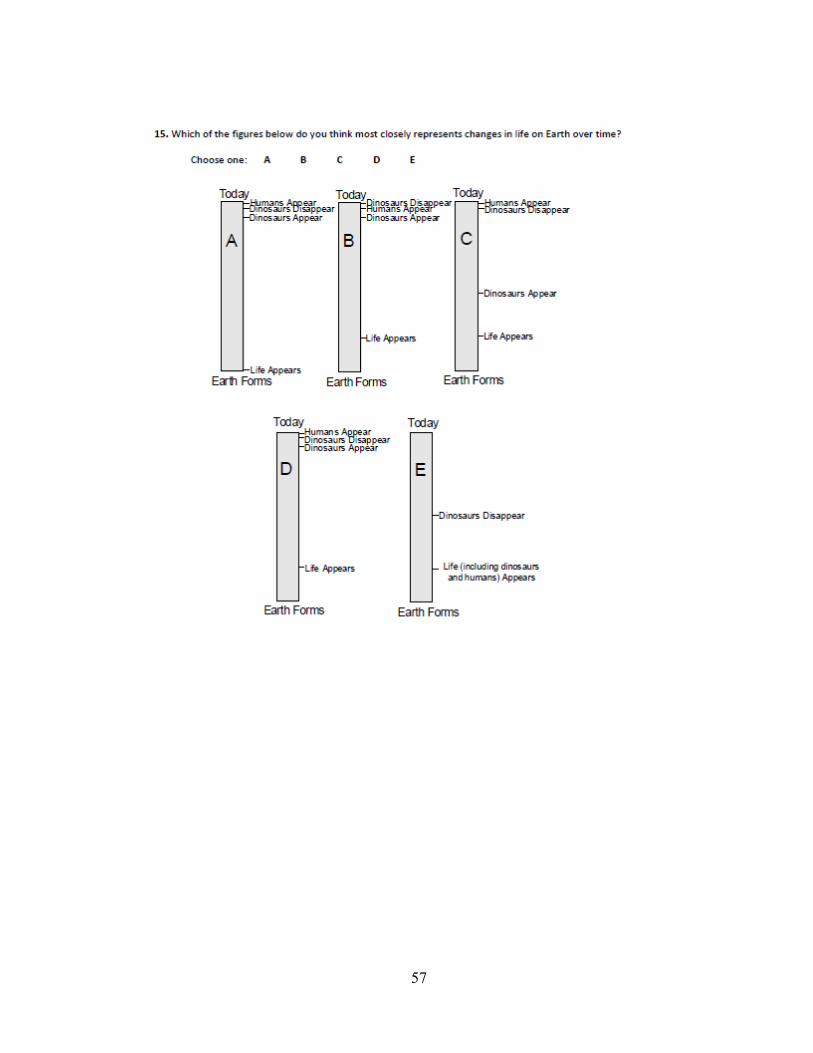
pages 54 through 57. One question, in particular, showed the extent to which the
students believed in a young Earth. Question fifteen, seen in Figure 4 below, addresses
the appearance of different forms of life from the formation of the Earth to present day.

15
15. Which of the figures below do you think most closely represents changes in life on Earth over time?
Choose one: A B C D E
Figure 4: Question 15 from the pre-test.
Three out of eight students, students 2, 3, and 9, answered “E” to this question. The
correct answer to this question is “D” and only one student out of eight answered the
question correctly. This is a direct reflection of the curriculum the students are taught at
Today
Earth Forms
Life Appears
Humans AppearDinosaurs DisappearDinosaurs Appear
D
Today
Earth Forms
Life (including dinosaursand humans) Appears
Dinosaurs Disappear
E
Today
Earth FormsLife Appears
Humans AppearDinosaurs DisappearDinosaurs Appear
A
Today
Earth Forms
Life Appears
Humans AppearDinosaurs Disappear
Dinosaurs Appear
C
Today
EarthForms
Life Appears
Humans AppearDinosaurs Disappear
Dinosaurs Appear
B
16
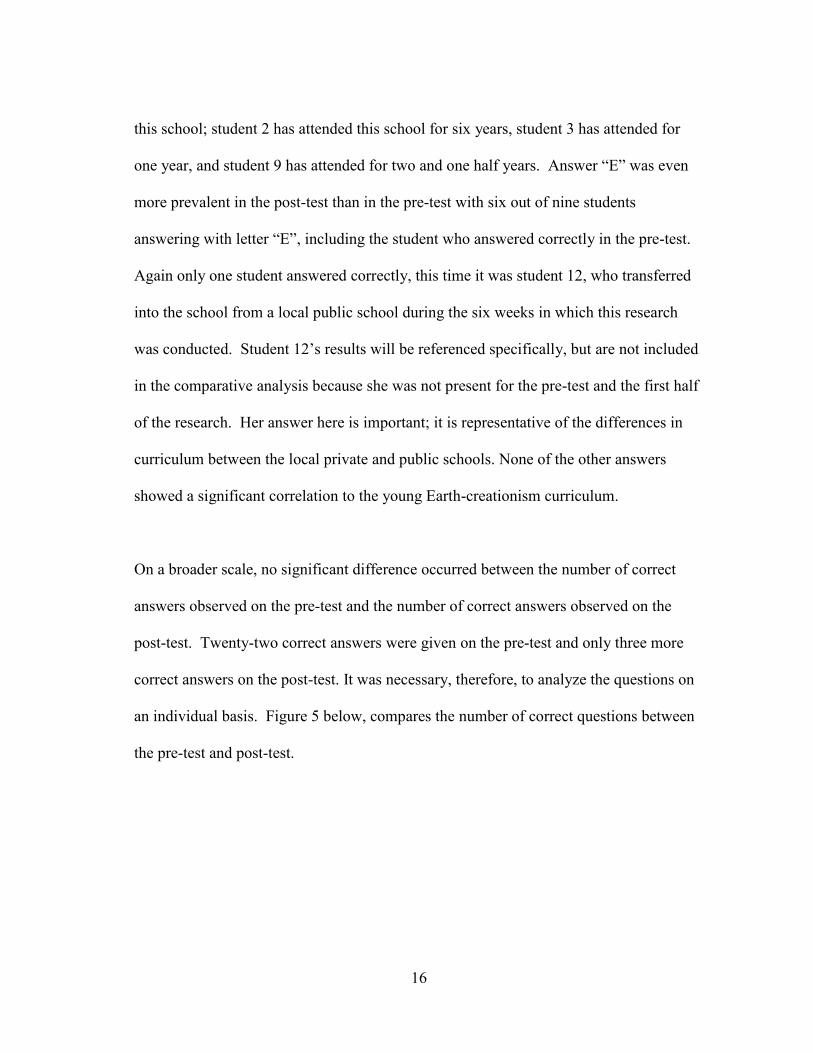
this school; student 2 has attended this school for six years, student 3 has attended for
one year, and student 9 has attended for two and one half years. Answer “E” was even
more prevalent in the post-test than in the pre-test with six out of nine students
answering with letter “E”, including the student who answered correctly in the pre-test.
Again only one student answered correctly, this time it was student 12, who transferred
into the school from a local public school during the six weeks in which this research
was conducted. Student 12’s results will be referenced specifically, but are not included
in the comparative analysis because she was not present for the pre-test and the first half
of the research. Her answer here is important; it is representative of the differences in
curriculum between the local private and public schools. None of the other answers
showed a significant correlation to the young Earth-creationism curriculum.
On a broader scale, no significant difference occurred between the number of correct
answers observed on the pre-test and the number of correct answers observed on the
post-test. Twenty-two correct answers were given on the pre-test and only three more
correct answers on the post-test. It was necessary, therefore, to analyze the questions on
an individual basis. Figure 5 below, compares the number of correct questions between
the pre-test and post-test.

17
Figure 5: Graph depicting the number of correct answers for each question on the pre-test vs. the number of correct answers on the post-test
Question number 3 was thrown out because of an error which may have led students to
answer incorrectly. In the pre-test and the post-test, no student answered questions 1, 5,
or 8 correctly. Questions 6, 12, 14, and 15 had decreased numbers of correct answers
from the pre-test to the post-test. It was thought for some time that a correlation might
exist between some of the incorrect answers and the curriculum taught at the school.
Upon further analysis, however, it appears that a correlation only exists between the
curriculum and the answers to question 15. Questions 2, 4, 7, and 11 showed
improvement from the pre-test to the post-test. All of the questions showing
improvement addressed topics that were definitively covered in the six week curriculum.
Rock Cycle
The rock cycle was the only cycle for which the students completed the entire Cause-
MaP process. After this, the process was modified based on the results of the rock cycle
for age appropriateness and classroom time constraints. The first step in the Cause-MaP
0
2
4
6
1 2 3 4 5 6 7 8 9 10 11 12 13 14 15
Nu
mb
er
of
corr
ect
an
swe
rs
Question Number
Pre-test vs. Post-test
Pretest
Posttest
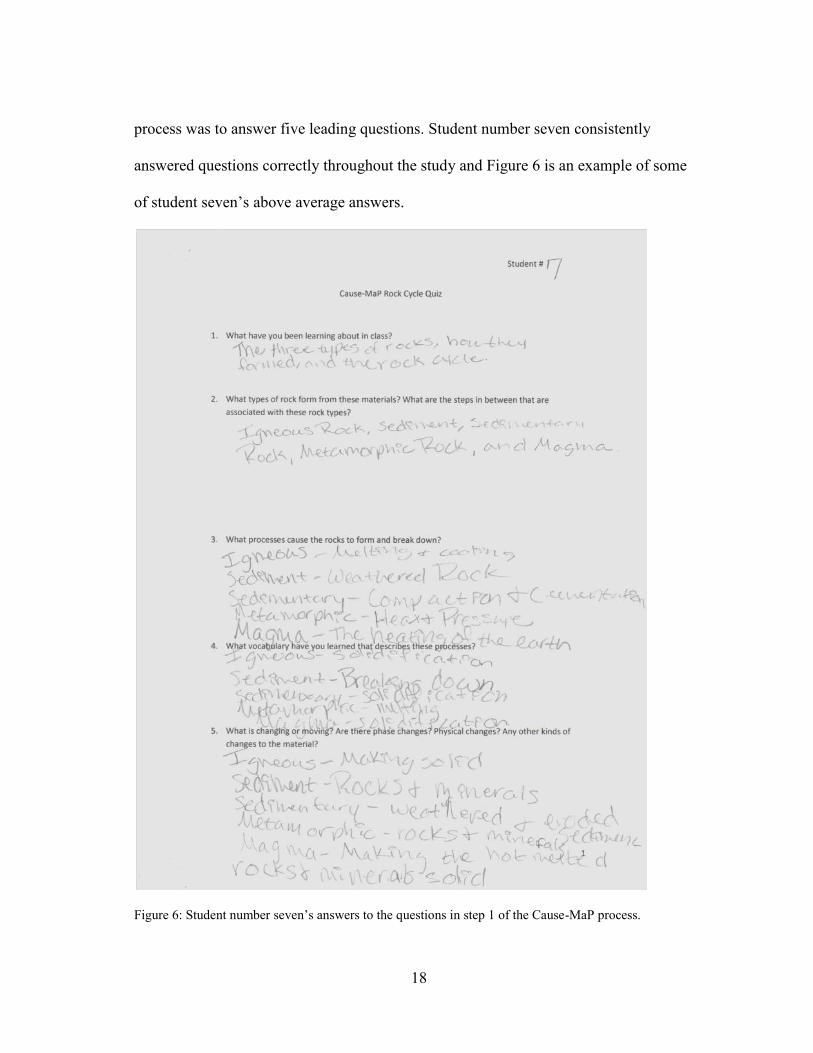
18
process was to answer five leading questions. Student number seven consistently
answered questions correctly throughout the study and Figure 6 is an example of some
of student seven’s above average answers.
Figure 6: Student number seven’s answers to the questions in step 1 of the Cause-MaP process.

19
Many students, however, were overwhelmed by the open-ended questions and the blank
space on the paper. This led to many answers similar to student number 10’s, in Figure 7
below, in which the student only partially answered the question.
Figure 7: Student number ten’s answers to the questions in step 1 of the Cause-MaP process.

20
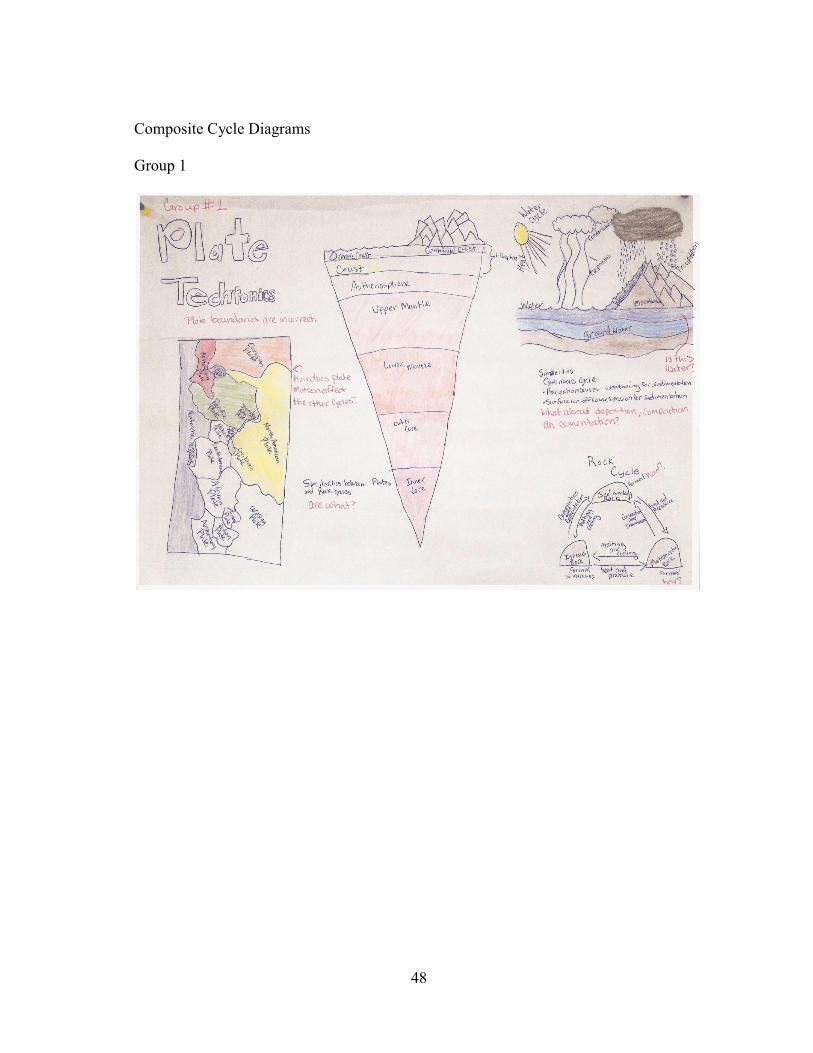
Composite Cycle Diagrams
The students were divided up into three groups. Group one included students 2, 9, and 6;
group two included students 1, 12, and 10; and group three included 11, 7, and 3. The
students worked in these groups and were asked to create a poster which incorporated
the rock cycle, plate tectonics/mantle convection cycle, and the water cycle. The
students were also asked to show where and how these different cycles interact. Figure 8
below is an example of an ideal diagram.
The students drew their diagrams on large pieces of butcher paper. For analysis
purposes, photographs were taken of the diagrams and then printed onto eight-and-a half
inch by eleven inch computer paper. On the printouts of the photographs of the entire
diagram some of the writing was too light to scan back in. To compensate for this, all of
the writing was traced in blue ink and then analyzed in red ink. The printouts were then
scanned to a PDF for use in this paper. None of the groups included the mantle
convection cycle in their diagrams. Two of the three diagrams included world maps
designating plate boundaries, and all three diagrams included the layers of Earth,
although some were not drawn with scale in mind. All three diagrams included the rock
cycle in one form or another. Only one diagram integrated the rock cycle with the water
cycle, as shown in Figure 9 below.

21
Figure 8: Idealized version of the composite cycle diagram the students were asked to draw.

22
Figure 9: The composite cycle diagram created by Group 3.
Group three shows extensive connections between cycles. The students included all
three main types of rock showing where they are formed, as well as one way in which
the water cycle affects sediment in the rock forming process and how igneous rock is
changed to sediment. Group one showed limited connections between the rock cycle
and the water cycle, where as group two showed no connections between any of the
cycles. All of these diagrams can be found in Appendix A on pages 48 through 50.
Each diagram was analyzed for the key aspects outlined in the rubric featured in Table 4,
on the next page. The completed rubrics for each group are located in Appendix C on
pages 59 through 61.

23
Table 4: Grading rubric for the composite cycle diagrams.
poor (1pt) below-average (2pt) average (3pt) above-average (4pt) excellent (5pt) Total
vocabulary used
uses no appropriate vocabulary
uses some appropriate vocabulary for 1 of the systems
uses some appropriate vocabulary for 2 of the 3 systems
uses some appropriate vocabulary for all 3 systems
uses most appropriate vocabulary for all 3 systems ___/5
figures used
includes very few elements involved in the systems
includes some elements involved in 1 of the 3 systems
includes some elements involved in 2 of the 3 systems
includes some elements involved in all 3 systems
includes most elements involved in all 3 systems ___/5
relationships between earth systems
shows no interrelationship between the 3 systems
shows only slight relationship between two systems
shows integration between two systems
shows some relations between all three systems
shows intricate relations between all three systems ___/5
rock cycle students' rock cycle is incorrect
students' rock cycle is partly correct with few to no big mistakes
students' rock cycle is mostly correct with no big mistakes
students' rock cycle is completely correct
students' rock cycle is completely correct and includes additional, unexpected, or outstanding features ___/5
water cycle students' water cycle is incorrect
students' water cycle is partly correct with few to no big mistakes
students' water cycle is mostly correct with no big mistakes
students' water cycle is completely correct
students' water cycle is completely correct and includes additional, unexpected, or outstanding features ___/5
mantle convection cycle
includes layers of the earth, both physical and chemical
the layers are depicted keeping in mind the scale of the separate layers
the depiction includes crust subduction
the depiction includes mantle convection
the depiction includes temperature differentials as a reason for mantle convection ___/5

24
The diagrams were then ranked based on the numerical results of the rubric. Groups one
and three had the highest numerical scores, with both receiving 19 points out of a
possible 30. Group two had the lowest score, receiving 17 out of a possible 30. The main
reason for such close scores was the absence of the mantle convection cycle in the
students’ diagrams. This mistake cost each group at least four points. The scores also
suffered because students had trouble showing how the systems interact. Group three
had the best understanding of how to illustrate the interaction between systems but lost
points because of the scale used to depict the layers of Earth.
End of Unit Test
In addition to the pre-test and post-test the students took an end of unit test as well. On
the test were two questions, shown in Figures 2 and 3 earlier on pages 19 and 20. The
results of these questions were varied; showing many degrees of knowledge. Students
were expected to answer these questions clearly and concisely. These questions were
designed to be more complex than what the students went over in class so they would
have to think through the problem critically and use higher level problem solving. As to
be expected, some students did very well while others had a more difficult time.
Question 14 was analyzed based on the following elements:
Vocabulary: Students were expected to correctly use the vocabulary they learned
in class to describe how rock in location “A” will eventually end up in location “B.” This
vocabulary includes: slab-pull, lithosphere, mantle, density, and subduction.

25
Content: The processes were expected to be in the correct order and it was
important for the students to mention that the oceanic crust in location “A” will subduct
beneath the continental crust and then be pulled down by gravity (slab-pull).
Figure 10 below shows the most correct and complete answer for question 14. This
answer shows comprehensive understanding of the slab-pull theory as well as an
advanced understanding of plate tectonics.
Figure 10: “The lithosphere can be moved into the mantle by slab-pull. Slab-pull is when two plates are converging and one slides under the other.” Student 10’s answer to question 14 from the end of unit test.
26
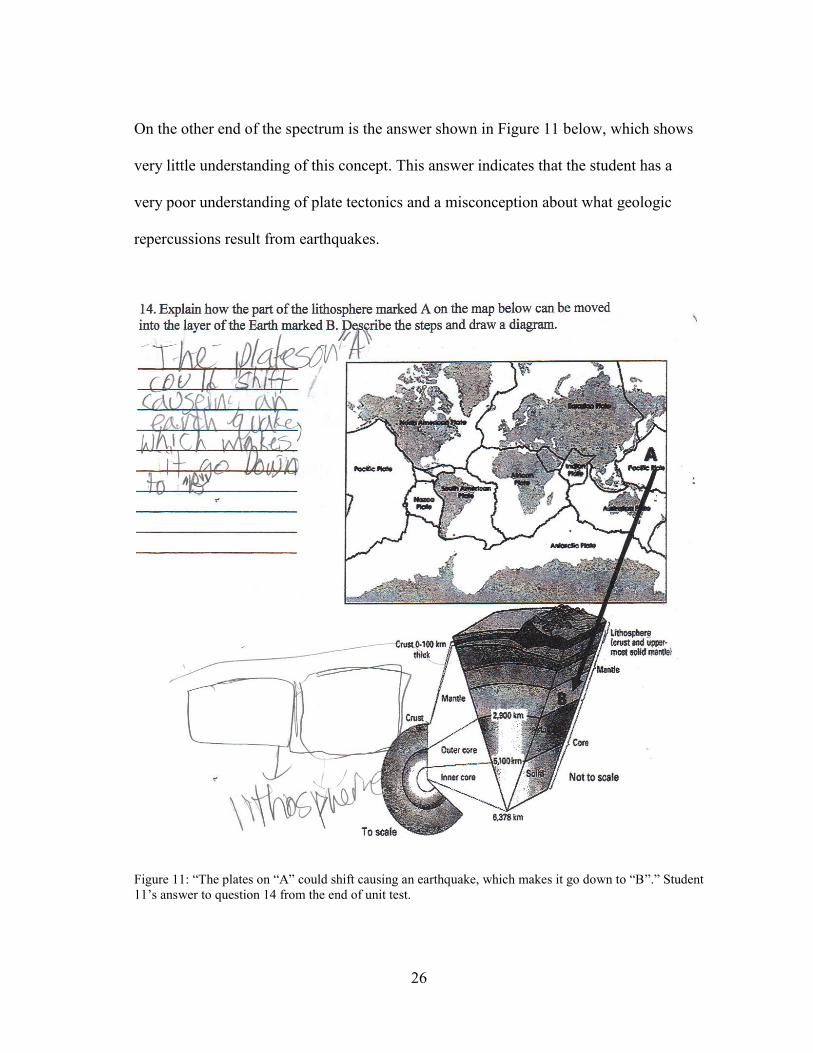
On the other end of the spectrum is the answer shown in Figure 11 below, which shows
very little understanding of this concept. This answer indicates that the student has a
very poor understanding of plate tectonics and a misconception about what geologic
repercussions result from earthquakes.
Figure 11: “The plates on “A” could shift causing an earthquake, which makes it go down to “B”.” Student 11’s answer to question 14 from the end of unit test.

27
Many answers fell in the middle and were correct but did not show the same
understanding as student 10; all of which can be found in Appendix A on pages 39
through 47. Question 15 also had a wide range of answers and was analyzed based on
the following elements:
Vocabulary: The students needed to correctly use the vocabulary describing the
different processes and phases. Lava, cooling, igneous rock, weathering, erosion, and
sediment were all words required for the answer to be complete and correct.
Illustration: Did the student’s rock cycle show how the materials move from lava
erupting from a volcano to sand on a beach?
Content: The processes were in the correct order. Students correctly
distinguished weathering and erosion.
To answer this question students needed to synthesize the information they learned
during their rock cycle lessons, as well as their own experiences and prior knowledge.
Students were expected to realize that lava from a volcano would most likely have a
higher elevation and be far enough from the ocean that it would need to be broken down
into smaller pieces (weathered); would then be transported to the beach (erosion), and
that these processes would result in the rock becoming sediment (sand). The answer in
Figure 12, below, is an example of a complete and correct answer.

28
Figure 12: “The lava cools and turns into igneous rock and the weathering, erosion, sedimentation, cementation, and compaction occur to make it a sedimentary rock. Then the rock gets weathered again and becomes sediment.” Student 5’s answer to question 15 from the end of unit test.
This answer is correct and shows that the student understood the processes that need to
occur in order for igneous rock to become sand; however, it also revealed a
misconception formed when the student learned the rock cycle. A sedimentary rock does
not need to form and then be broken down again in order to create sediment. Sediment is
created when any type of rock is broken down into smaller pieces. Figure 13 is an
example of an incorrect answer. The student did use some of the expected vocabulary
properly; however, his concept of what causes the lava to cool in this situation is
distorted. He also did not mention the sand (sediment), which is a key piece to this
question.

29
Figure 13: “First, the volcano erupts then the lava goes towards the ocean. Next the water cools it. Finally, lava dries on the beach.” Student 3’s answer to question 15 from the end of unit test.
How These Students Compare to the Idealized Standard
According to the American Association for the Advancement of Science, in their
publication Atlas of Science Literacy, students’ science education should follow the
concept map found in Appendix B, on page 53, an excerpt of which is located in Figure
14 below (Project 2061, 2001, pg 51).
Many of the students in this study mastered most of objectives found in the sixth through
eighth grade category, as well as some of the materials from the ninth through twelfth
grade category. Although not all of the objectives were mastered, the students were
familiarized with most of the others. The objectives, which include old-Earth science
(highlighted in red) were not emphasized in the young-Earth curriculum taught at this
school. Students also did not learn about glaciers and their effects on the surface of
Earth during this study.

30
Figure 14: An excerpt of the American Association for the Advancement of Science, Atlas of Science Literacy, Vol. 1, 2001, page 51, concept map which specifically addresses grades six through eight (Project 2061, 2001, pg 51). Adapted and excerpted with permission.
1
2
3
4 5
6
7
8
9

31
Students were introduced to the objective labeled “1” in Figure 14 above through the
mantle convection cycle. Based on the absence of the mantle convection cycle in the
students’ composite diagrams (see Appendix A, pages 48 through 50), this objective was
not mastered. Objectives “4” and “5” are very similar in that they both emphasize the
interaction between the rock cycle and the water cycle. Both the end of unit test and the
composite diagrams showed that the majority of students demonstrated their mastery of
these objectives. All of the groups included water induced weathering and erosion in
their composite diagrams. Question fifteen on the end of unit test also addressed the
interaction between the water cycle and the rock cycle. To answer this question
correctly, students needed to recognize that water and/or wind can cause weathering of
volcanic rock and subsequent erosion of the sediments. Eight students provided answers
to question fifteen on the end of unit test. Six out of eight students answered this
question correctly, with half of them specifically including wind or water generated
weathering and erosion in their answer.
How These Students Compare to Their Public School Peers
The Texas Assessment of Knowledge and Skills (TAKS) test is the Texas state
standardized test. Students take the science TAKS test in grades 5, 8, 10, and 11.
Because the subjects of this study were sixth graders, the fifth grade TAKS test was used
to determine what the students in the local public schools are expected to know when
they finish the fifth grade. This produced a minimum knowledge level at which the
students participating in the study should be compared to their peers. Below, in Figure

32
15, is the question from the fifth grade science TAKS test, administered in April of 2009
that best relates to the contents of this study.
Figure 15: Question 23 from the 2009 fifth grade science TAKS test.
Out of 3021 students in two large independent school districts located in the same
county as the private school in this study, 2311 (77%) students correctly answered the
question. Question 23 from the 2009 fifth grade science TAKS test provides the most
extensive comparison to the effectiveness of the curriculum in this study because of the
emphasis placed on the interaction between the rock cycle and the water cycle. The
participants in this study were asked many similar questions throughout the duration of
the study. The first was presented in the pre-test and post-test:

33
7. Which of the following best describes mountains? Choose all that apply.
(A) Old mountains are generally taller because they have had more time to grow than
young mountains (B) Old mountains tend to have gentler slopes than young mountains because there is
more time for rocks to get worn away (C) Old mountains have more vegetation than young mountains because there is more
time for plants to grow (D) Old mountains tend to have rougher surfaces than young mountains because more
time has passed and things crack as they get older (E) All mountains are roughly the same age Figure 16: Question number 7 from the pre-test/post-test.
In the pre-test, only one student (14% of the class) answered the question, shown in
Figure 16, correctly, whereas in the post-test the number jumps to three correct answers
(43%) of seven students, with three more students giving partially correct answers. This
question has a greater difficulty than the TAKS question because it asks the students to
synthesize more information. Instead of being told older mountains have a gentler slope
and then asking why, this question asks the student to know that older mountains have
gentler slopes and the reason why. With the question being more difficult, it is,
therefore, permissible to include the three partially correct answers in the total number of
correct answers. Including the partially correct answers in the total number of correct
answers yields a correct answer rate of eighty-six percent, which is nine percent higher
than these students’ public school peers.
The second occurrence of a similar question was in the post-unit test. The students were
given the question in Figure 17 below.

34
Figure 17: Question 15 from the post-unit test.
To answer this question correctly, students needed to include language regarding surface
runoff water causing weathering and erosion. Three out of the ten students answered this
question incorrectly. Five students answered this question correctly, with three of the
five specifically mentioning wind or water induced weathering and erosion. One student
did not answer the question, and one student gave a verbal answer, which was not
recorded in detail. Sixty-two percent of the students answering this question on the exam
answered correctly, which is fourteen percent less than their public school peers.
The third occurrence of a similar question is found in the students composite cycle
diagrams. Each group of students was asked to draw a cause and effect diagram of all
three of the systems studied in the unit (rock cycle, mantle convection cycle, and the
water cycle). The diagrams for each group can be found in Appendix A pages 48
through 50. All three groups included weathering, erosion, and surface runoff associated
with mountains or volcanoes in their diagrams.
35
DISCUSSION AND CONCLUSION
The students’ pre-tests revealed a few misconceptions which stem from the students’
limited subject knowledge and, in many cases, are logical results based on their
knowledge level. The results of the post-test reflected the students’ growth in the subject
areas addressed by this research, as well as an overall increase in subject matter
knowledge. The young-Earth-creationism curriculum that the students are taught does
affect the students’ answers to specific questions. The students who have been enrolled
in this school longer, however, display more advanced abilities to reason through
problems than students who have not been enrolled as long. This most likely is a result
of the more individualized instruction and not the curriculum content.
The end of unit test results revealed some misconceptions that students held, as well as
revealing which students were able to use higher level, critical thinking skills. The
critical thinking was especially tough for these students. Observations in this classroom
suggest that much of the students’ resistance to critical thinking results from being
overwhelmed when asked to do something they have never done before or to do
something by themselves, with which they have always received help. At this age,
scaffolding is critical and should be more structured than with older students. If the
lesson is over-scaffolded, it is as if the instructor has given the student the answers. If the
lesson is under-scaffolded, however, the students will be overwhelmed which will lead
to confusion. Therefore, it is critical for teachers to find the correct balance and to know

36
their students as well. Some students have always been given the answers and will
expect their current teacher to do the same. Teachers need to be able to distinguish
between these students and students who are truly struggling with the material as these
students need to be addressed differently.
Throughout the study students consistently showed a greater understanding for how the
rock cycle interacts with the water cycle, and how these processes affect Earth. The
mantle convection cycle, however, was not even included in the students’ composite
cycle diagrams. This shows a dichotomy between tangible science and conceptual
science. The students had a more difficult time learning what they could not see, the
mantle convection cycle. Whereas they mastered the science concept that they can see
on a regular basis, it would be interesting to see if this is consistent on a larger scale and
in other fields.
Many limitations exist in this study. In an idealized situation the sample size would be
much larger. Ten subjects are too few to define statistically significant results. In an
idealized situation multiple classrooms, schools, and possibly grades would be included
in the study. It is difficult to find a public school where multiple classrooms are
available to participate in a study like this because public schools must cover all of their
required standards in a set amount of time and prepare for the standardized test. Time
was also a limitation. It would be more beneficial to have more time to cover all of the
material in more detail, as well as to scaffold the study specifically to the group of

37
students. With more time, students would also become more familiar with the Cause-
MaP method, which would reduce their fear of the white space. Students would also
ideally complete all of the activities individually to better measure each, individual,
students’ progress. A pre-test and post-test, geared specifically toward the material
covered in this study, would also provide a better measure of the students’ progress. It
would also be beneficial if this study were completed across multiple science topics, i.e.
physics, chemistry, biology etc.
Overall, the students who participated in this study compare well to the idealized
standard, having mastered part of what is considered important material to include in
sixth through eighth grade curriculum. These students showed their education to be
comparable with the public schools in the area, even showing a more advanced
understanding of the integration between the water cycle and the rock cycle. The results
from this study show students who are encouraged to determine connections between
different systems are more able to synthesize material that involves multiple interacting
systems and answer question about it.

38
REFERENCES
Assaraf, O. B. Z., and Orion, N., 2005, Development of System Thinking Skills in The
Context of Earth System Education: Journal of Research in Science Teaching, v.
42, no. 5, p. 518-560.
Clark, S. K., Sibley, D. F., Libarkin, J. C., and Heidemann, M., 2009, A Novel Approach
to Teaching and Understanding Transformations of Matter in Dynamic Earth
Systems: Journal of Geoscience Education, v. 57, no. 4, p. 223.
Project 2061 (American Association for the Advancement of Science), 2001, Atlas of
Science Literacy. v.1: Washington, DC, American Association for the
Advancement of Science: National Science Teachers Association.
Raia, F.. (2008). Causality in Complex Dynamic Systems: A Challenge in Earth Systems
Science Education. Journal of Geoscience Education, 56(1), 81-94. Retrieved
March 31, 2011, from ProQuest Education Journals.
Rostan, S. M., 1994, Problem Finding, Problem Solving, and Cognitive Controls: An
Empirical Investigation of Critically Acclaimed Productivity: Creativity
Research Journal, v. 7, no. 2, p. 97-110.
Schroeder, C. M., 2006, Expert-novice interaction in problematizing a complex
environmental science issue using web-based information and analysis tools, Ph.
D. Dissertation. Texas A&M University, College Station.

39
APPENDIX A
Student Work
Students End of Unit Test Answers Student 1

40
Student 2

41
Student 3

42
Student 5

43
Student 5

44
Student 7

45
Student 9

46
Student 10

47
Student 11
48
Composite Cycle Diagrams Group 1

49
Group 2

50
Group 3

51
APPENDIX B*
Idealized Earth Systems Tables Idealized table for the rock cycle
Forming
Q2: 2. What types of rock form from these materials? What are the steps in between that are associated with these rock types?
Q3: 3. What processes cause the rocks to form and break down? Causes
Q4: What vocabulary word have you learned for this process?
Which is/ of
Q5: 5. What is changing or moving? Are there phase changes? Physical changes? Any other kinds of changes to the material?
Description of what this looks like
Forming Igneous Rock cooling Causes solidification Which is a phase change from liquid to solid
Forming Sediment weather/ climate Causes weathering of
a physical change of igneous, sedimentary, or metamorphic rock to sediment
Forming Sedimentary Rock
compaction and cementation Causes lithification of
a physical change of sediment to sedimentary rock
Forming Metamorphic Rock heat and pressure Causes metamorphism of
a physical change of sedimentary, igneous, or metamorphic rock to metamorphic rock
Forming Magma heating of rock Causes melting Which is
a phase change from solid to liquid
Forming Sedimentary Rock: example - Halite Evaporation Causes lithification Which is
forming of rocks by drying up water and leaving the minerals behind
*Part of this Chapter has been reprinted with permission from Atlas of Science Literacy, by Project 2061, 2001, American Association for Advancement of Science, Washington DC. Copyright 2001 by Project 2061.
52
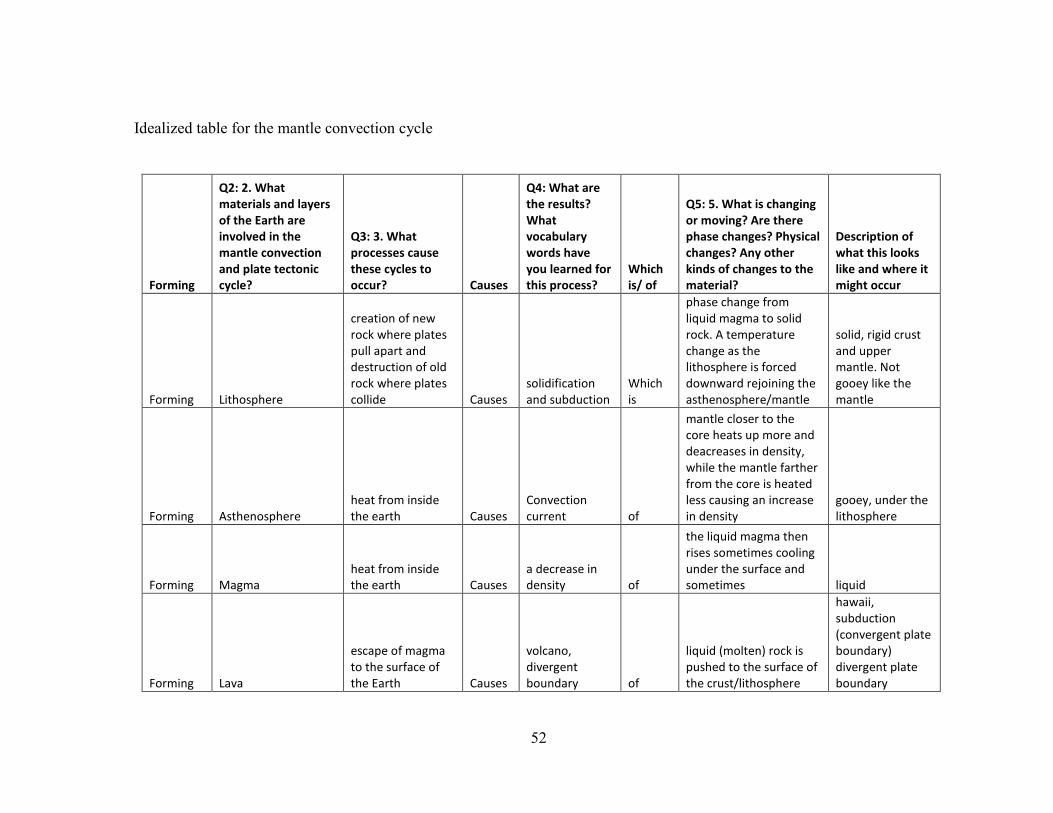
Idealized table for the mantle convection cycle
Forming
Q2: 2. What materials and layers of the Earth are involved in the mantle convection and plate tectonic cycle?
Q3: 3. What processes cause these cycles to occur? Causes
Q4: What are the results? What vocabulary words have you learned for this process?
Which is/ of
Q5: 5. What is changing or moving? Are there phase changes? Physical changes? Any other kinds of changes to the material?
Description of what this looks like and where it might occur
Forming Lithosphere
creation of new rock where plates pull apart and destruction of old rock where plates collide Causes
solidification and subduction
Which is
phase change from liquid magma to solid rock. A temperature change as the lithosphere is forced downward rejoining the asthenosphere/mantle
solid, rigid crust and upper mantle. Not gooey like the mantle
Forming Asthenosphere heat from inside the earth Causes
Convection current of
mantle closer to the core heats up more and deacreases in density, while the mantle farther from the core is heated less causing an increase in density
gooey, under the lithosphere
Forming Magma heat from inside the earth Causes
a decrease in density of
the liquid magma then rises sometimes cooling under the surface and sometimes liquid
Forming Lava
escape of magma to the surface of the Earth Causes
volcano, divergent boundary of
liquid (molten) rock is pushed to the surface of the crust/lithosphere
hawaii, subduction (convergent plate boundary) divergent plate boundary
53
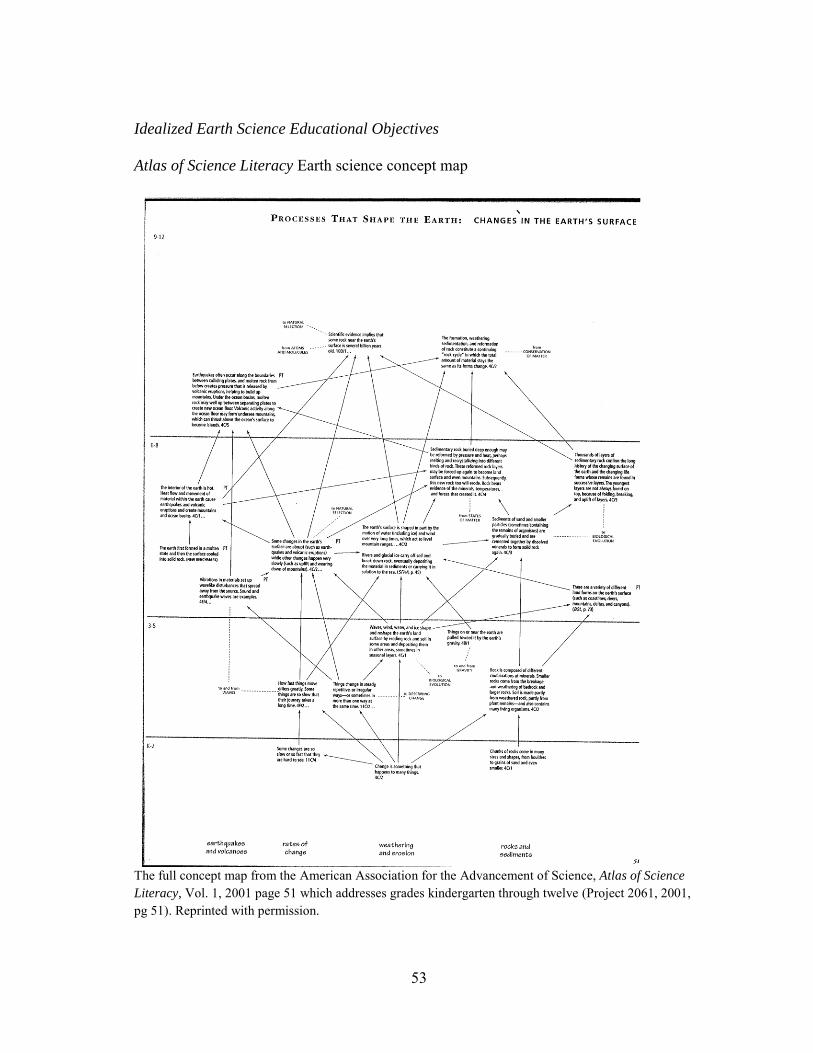
Idealized Earth Science Educational Objectives
Atlas of Science Literacy Earth science concept map
The full concept map from the American Association for the Advancement of Science, Atlas of Science
Literacy, Vol. 1, 2001 page 51 which addresses grades kindergarten through twelve (Project 2061, 2001, pg 51). Reprinted with permission.
54
APPENDIX C
Assessment tools
Earth Systems Pre-test/Post-test

55

56
57

58
End of Unit Test Questions

59
Grading rubric for composite cycle diagram Group 1

60
Grading rubric for composite cycle diagram Group 2

61
Grading rubric for composite cycle diagram Group 3