The effectiveness of pedometers to increase physical activity: a systematic review and...
24
The effectiveness of pedometers to increase physical activity: a systematic review and meta-analysis. Dan Mason (1), Laura Lamming, Ed Wilson, Vijay Singh GC, Sally Pears, Katie Morton, Maaike Bijker, Stephen Sutton, Wendy Hardeman. (1) The Behavioural Science Group, Institute of Public Health, C
-
Upload
hope-patrick -
Category
Documents
-
view
216 -
download
1
Transcript of The effectiveness of pedometers to increase physical activity: a systematic review and...
The effectiveness of pedometers to increase physical activity: a systematic review and meta-analysis.
Dan Mason (1), Laura Lamming, Ed Wilson, Vijay Singh GC, Sally Pears, Katie Morton, Maaike Bijker, Stephen Sutton, Wendy Hardeman.
(1) The Behavioural Science Group, Institute of Public Health, Cambridge, UK

Pedometers and physical activity
Small, inexpensive
Popular and usable
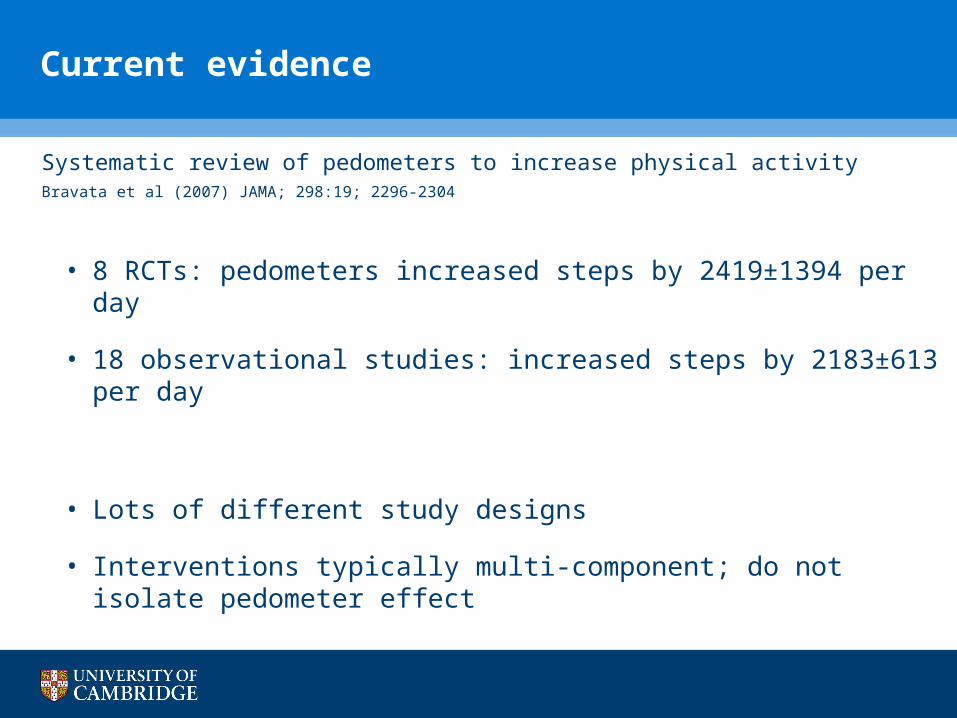
Current evidence
Systematic review of pedometers to increase physical activityBravata et al (2007) JAMA; 298:19; 2296-2304
• 8 RCTs: pedometers increased steps by 2419±1394 per day
• 18 observational studies: increased steps by 2183±613 per day
• Lots of different study designs
• Interventions typically multi-component; do not isolate pedometer effect
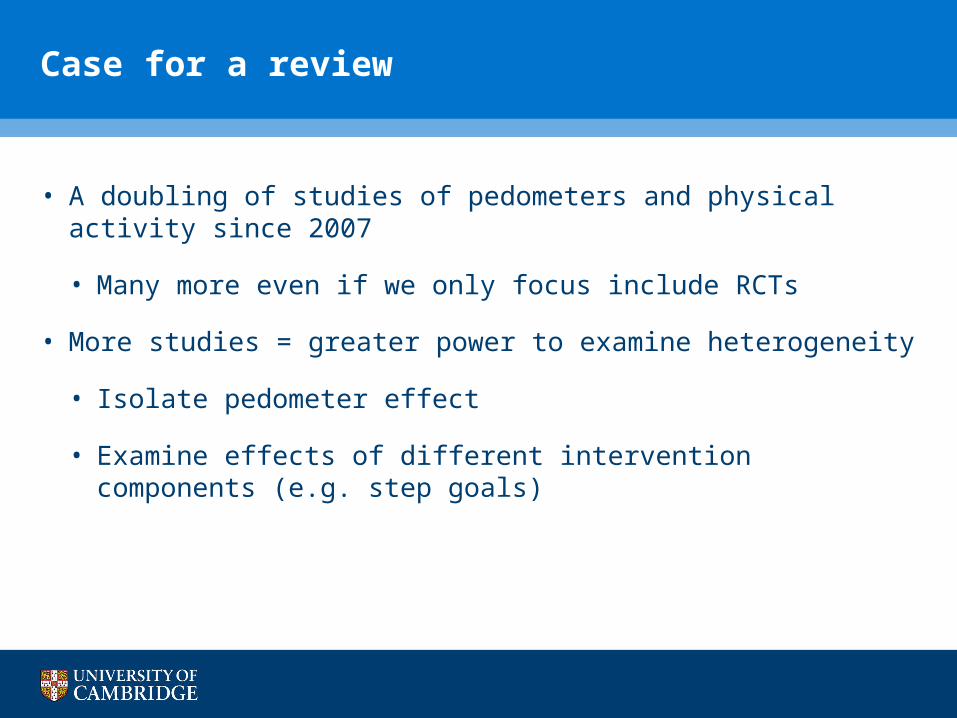
Case for a review
• A doubling of studies of pedometers and physical activity since 2007
• Many more even if we only focus include RCTs
• More studies = greater power to examine heterogeneity
• Isolate pedometer effect
• Examine effects of different intervention components (e.g. step goals)

Additional vs residual components
Additional components
Substantial addition to pedometer e.g. PA counselling, access to PA website
Pedometer NOT isolated if these vary between groups
Residual components
• Instructions to increase PA• Given a PA goal• Asked to record daily PA
Pedometer IS “isolated” if only these things vary between groups
Aims of the review
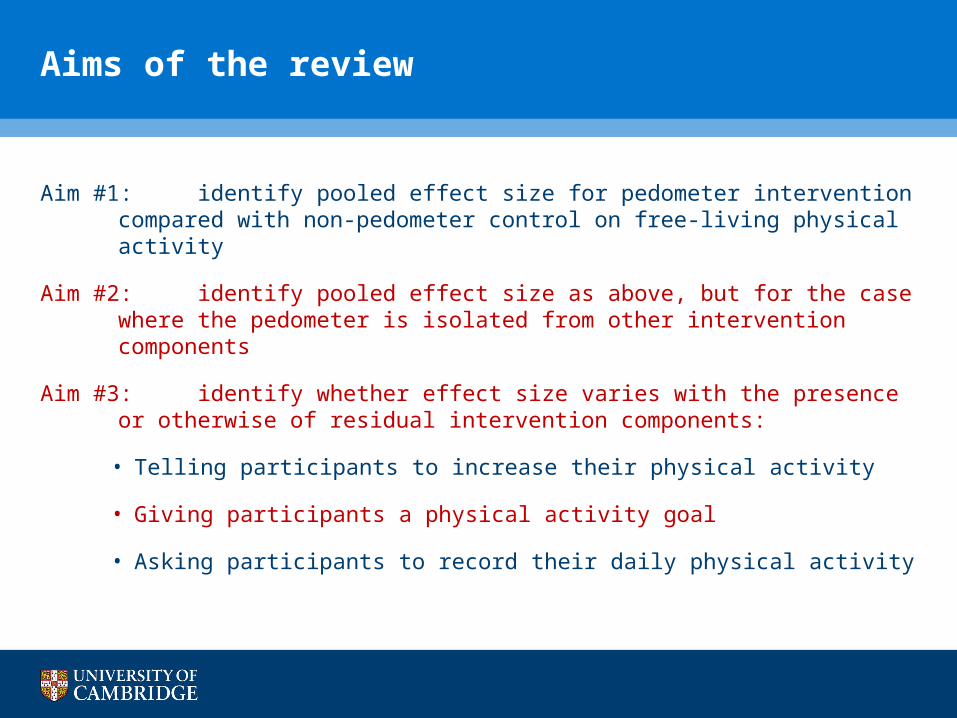
Aim #1: identify pooled effect size for pedometer intervention compared with non-pedometer control on free-living physical activity
Aim #2: identify pooled effect size as above, but for the case where the pedometer is isolated from other intervention components
Aim #3: identify whether effect size varies with the presence or otherwise of residual intervention components:
• Telling participants to increase their physical activity
• Giving participants a physical activity goal
• Asking participants to record their daily physical activity

Inclusion criteria
• Intervention group receives pedometer as intervention tool
• Participants are adults (>18yo)
• Free-living: pedometer worn in everyday life (e.g. not during prescribed exercise class; not inpatients; not lab studies)
• A physical activity or fitness outcome is reported
• More than one group; i.e. no cohort studies, no within-subjects experiments
Exclude if:
• “Controls” wear an open pedometer throughout the intervention period
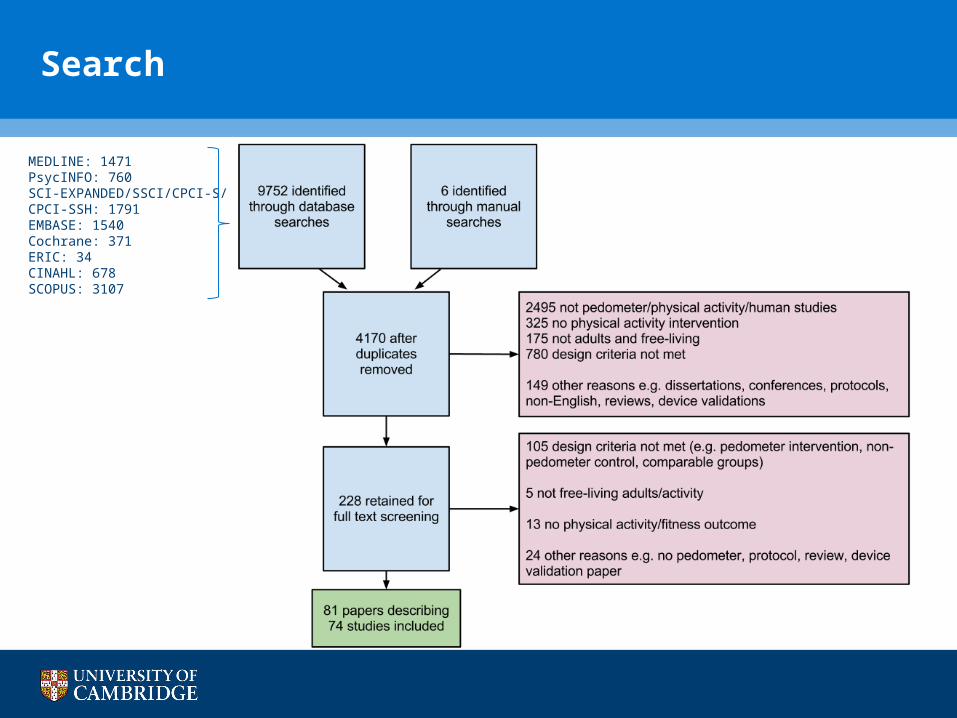
Search
MEDLINE: 1471PsycINFO: 760SCI-EXPANDED/SSCI/CPCI-S/CPCI-SSH: 1791EMBASE: 1540Cochrane: 371ERIC: 34CINAHL: 678SCOPUS: 3107

Preliminary subgroup: select by measurement
Objective physical activity measure
Self-report physical activity measure
N=27 N=15 N=26
Fitness outcomes onlyN=6

Fitness outcomes onlyN=6
N=26
Self-report physical activity measure
Preliminary subgroup: select by measurement
Objective physical activity measure
N=27 N=15

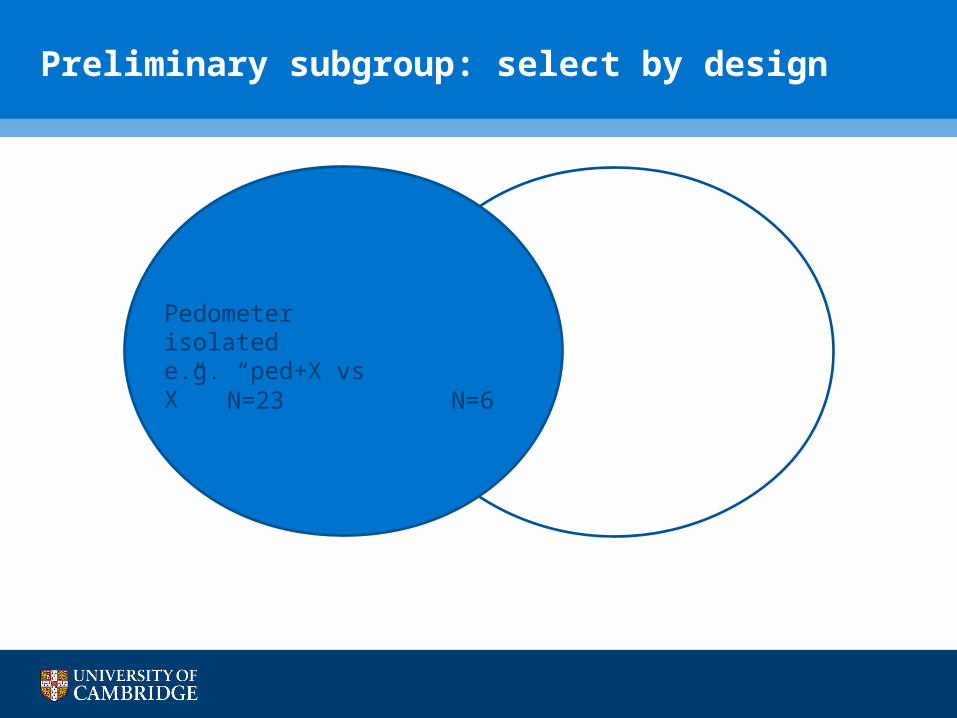
Preliminary subgroup: select by design
Pedometer isolatede.g. “ped+X vs X”
Pedometer not isolatede.g. “ped+X vs Y”
N=23 N=6 N=45
N=45
Pedometer not isolatede.g. “ped+X vs Y”
Preliminary subgroup: select by design
Pedometer isolatede.g. “ped+X vs X”
N=23 N=6
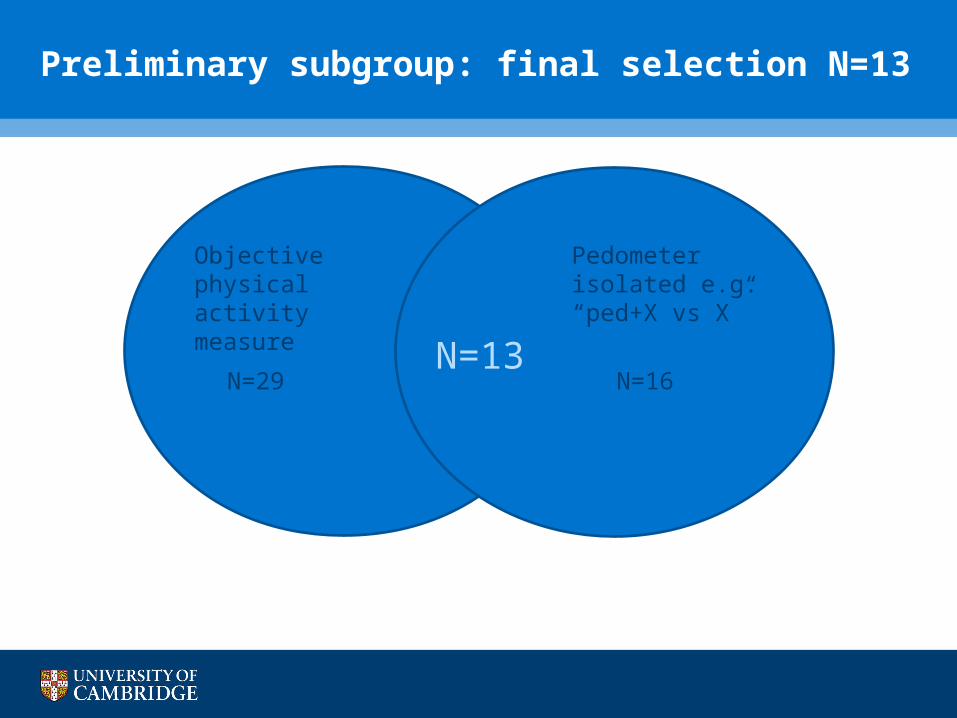
Preliminary subgroup: final selection N=13
Objective physical activity measure
Pedometer isolated e.g. “ped+X vs X”
N=29N=13
N=16
Study characteristics
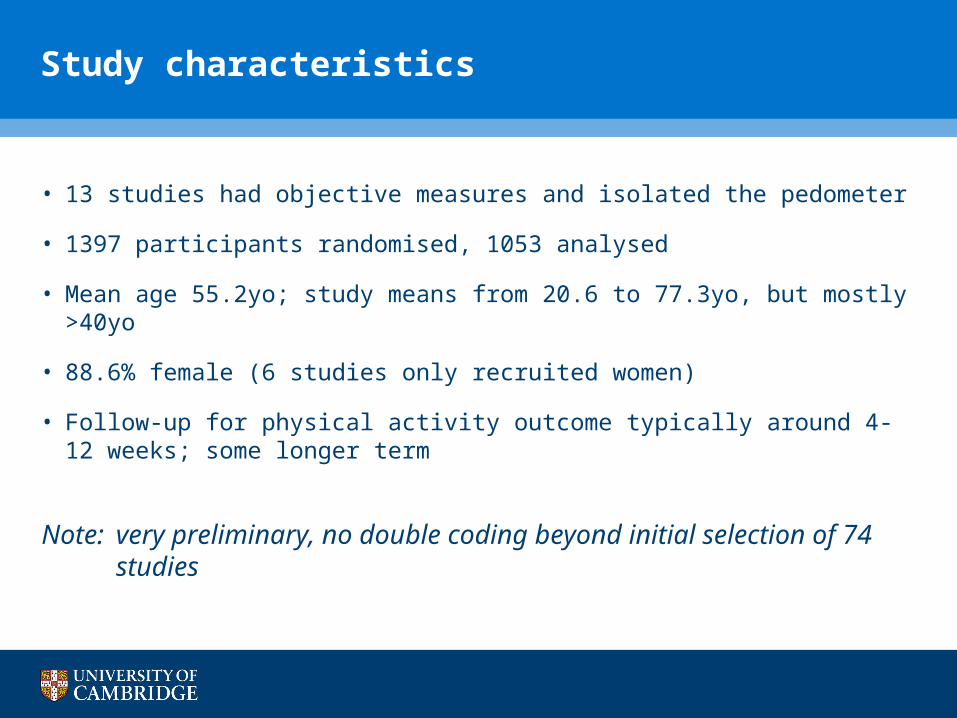
• 13 studies had objective measures and isolated the pedometer
• 1397 participants randomised, 1053 analysed
• Mean age 55.2yo; study means from 20.6 to 77.3yo, but mostly >40yo
• 88.6% female (6 studies only recruited women)
• Follow-up for physical activity outcome typically around 4-12 weeks; some longer term
Note: very preliminary, no double coding beyond initial selection of 74 studies

Residual intervention components
Instructions vary Logging PA varies Goals vary
Baker 2011
Carr 2008 X X X
Du Vall 2004 X X X
Gray 2009 X X
Hultquist 2007
McMurdo 2010
Ornes 2007 X
Samuels 2011
Sugden 2008
Vallance 2007 X
Yates 2009
Eastep 2004 X
Strath 2011 X X
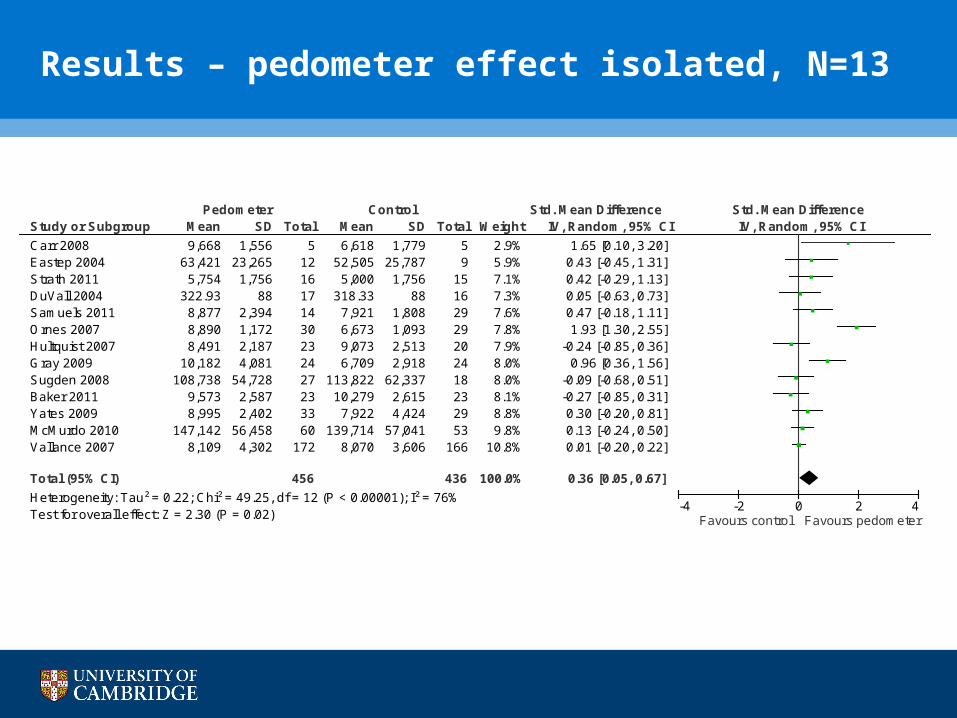
Results – pedometer effect isolated, N=13
Study or Subgroup
Carr 2008Eastep 2004Strath 2011DuVall 2004Samuels 2011Ornes 2007Hultquist 2007Gray 2009Sugden 2008Baker 2011Yates 2009McMurdo 2010Vallance 2007
Total (95% CI)
Heterogeneity: Tau² = 0.22; Chi² = 49.25, df = 12 (P < 0.00001); I² = 76%Test for overall effect: Z = 2.30 (P = 0.02)
Mean
9,66863,421
5,754322.93
8,8778,8908,491
10,182108,738
9,5738,995
147,1428,109
SD
1,55623,265
1,75688
2,3941,1722,1874,081
54,7282,5872,402
56,4584,302
Total
51216171430232427233360
172
456
Mean
6,61852,505
5,000318.33
7,9216,6739,0736,709
113,82210,279
7,922139,714
8,070
SD
1,77925,787
1,75688
1,8081,0932,5132,918
62,3372,6154,424
57,0413,606
Total
59
15162929202418232953
166
436
Weight
2.9%5.9%7.1%7.3%7.6%7.8%7.9%8.0%8.0%8.1%8.8%9.8%
10.8%
100.0%
IV, Random, 95% CI
1.65 [0.10, 3.20]0.43 [-0.45, 1.31]0.42 [-0.29, 1.13]0.05 [-0.63, 0.73]0.47 [-0.18, 1.11]1.93 [1.30, 2.55]
-0.24 [-0.85, 0.36]0.96 [0.36, 1.56]
-0.09 [-0.68, 0.51]-0.27 [-0.85, 0.31]0.30 [-0.20, 0.81]0.13 [-0.24, 0.50]0.01 [-0.20, 0.22]
0.36 [0.05, 0.67]
Pedometer Control Std. Mean Difference Std. Mean DifferenceIV, Random, 95% CI
-4 -2 0 2 4Favours control Favours pedometer

Results – pooled steps per day (1000s), N=10
Study or Subgroup
Eastep 2004Carr 2008Gray 2009Yates 2009Baker 2011Hultquist 2007Samuels 2011Strath 2011Vallance 2007Ornes 2007
Total (95% CI)
Heterogeneity: Tau² = 1.41; Chi² = 40.02, df = 9 (P < 0.00001); I² = 78%Test for overall effect: Z = 2.38 (P = 0.02)
Mean
9.069.668
10.1828.9959.5738.4918.8775.7548.109
8.89
SD
3.3241.5564.0812.4022.5872.1872.3941.7564.3021.172
Total
125
243323231416
17230
352
Mean
7.5016.6186.7097.922
10.2799.0737.921
58.07
6.673
SD
3.6841.7792.9184.4242.6152.5131.8081.7563.6061.093
Total
95
242923202915
16629
349
Weight
5.3%8.1%8.3%9.1%
10.2%10.6%10.6%11.3%12.8%13.7%
100.0%
IV, Random, 95% CI
1.56 [-1.50, 4.61]3.05 [0.98, 5.12]3.47 [1.47, 5.48]
1.07 [-0.73, 2.88]-0.71 [-2.21, 0.80]-0.58 [-2.00, 0.84]0.96 [-0.46, 2.37]0.75 [-0.48, 1.99]0.04 [-0.81, 0.88]2.22 [1.64, 2.80]
1.08 [0.19, 1.96]
Pedometer Control Mean Difference Mean DifferenceIV, Random, 95% CI
-4 -2 0 2 4Favours control Favours pedometer
Estimate 1080 steps per day advantage with pedometer

Results – goal subgroupsStudy or Subgroup4.3.1 Ped+goal compared to no-ped no-goal group (isolated)
Carr 2008Strath 2011DuVall 2004Gray 2009Subtotal (95% CI)
Heterogeneity: Tau² = 0.15; Chi² = 5.89, df = 3 (P = 0.12); I² = 49%Test for overall effect: Z = 2.18 (P = 0.03)
4.3.2 Ped+goal compared to no-ped+goal group (isolated)
Samuels 2011Hultquist 2007Sugden 2008Baker 2011Yates 2009McMurdo 2010Vallance 2007Subtotal (95% CI)
Heterogeneity: Tau² = 0.00; Chi² = 5.13, df = 6 (P = 0.53); I² = 0%Test for overall effect: Z = 0.52 (P = 0.60)
4.3.3 Ped+no goal compared to no-ped no-goal (isolated)
Eastep 2004Ornes 2007Subtotal (95% CI)
Heterogeneity: Tau² = 0.97; Chi² = 7.45, df = 1 (P = 0.006); I² = 87%Test for overall effect: Z = 1.62 (P = 0.11)
Total (95% CI)
Heterogeneity: Tau² = 0.22; Chi² = 49.25, df = 12 (P < 0.00001); I² = 76%Test for overall effect: Z = 2.30 (P = 0.02)Test for subgroup differences: Chi² = 6.14, df = 2 (P = 0.05), I² = 67.4%
Mean
9,6685,754
322.9310,182
8,8778,491
108,7389,5738,995
147,1428,109
63,4218,890
SD
1,5561,756
884,081
2,3942,187
54,7282,5872,402
56,4584,302
23,2651,172
Total
516172462
142327233360
172352
123042
456
Mean
6,6185,000
318.336,709
7,9219,073
113,82210,279
7,922139,714
8,070
52,5056,673
SD
1,7791,756
882,918
1,8082,513
62,3372,6154,424
57,0413,606
25,7871,093
Total
515162460
292018232953
166338
92938
436
Weight
2.9%7.1%7.3%8.0%
25.3%
7.6%7.9%8.0%8.1%8.8%9.8%
10.8%61.0%
5.9%7.8%
13.7%
100.0%
IV, Random, 95% CI
1.65 [0.10, 3.20]0.42 [-0.29, 1.13]0.05 [-0.63, 0.73]0.96 [0.36, 1.56]0.61 [0.06, 1.16]
0.47 [-0.18, 1.11]-0.24 [-0.85, 0.36]-0.09 [-0.68, 0.51]-0.27 [-0.85, 0.31]0.30 [-0.20, 0.81]0.13 [-0.24, 0.50]0.01 [-0.20, 0.22]0.04 [-0.11, 0.19]
0.43 [-0.45, 1.31]1.93 [1.30, 2.55]
1.21 [-0.26, 2.68]
0.36 [0.05, 0.67]
Pedometer Control Std. Mean Difference Std. Mean DifferenceIV, Random, 95% CI
-2 -1 0 1 2Favours control Favours pedometer
Results – step goal subgroup analysis, N=13 x 3 subgroups

Discussion
• Identified 74 studies with ped vs no-ped RCT designs
• Mix of self-report and objective measures
• Wide variety of interventions
• Sufficient numbers to isolate pedometer effect… but not without allowing some residual intervention components
• Preliminary analysis suggests overall increase in physical activity in pedometer groups when (somewhat) isolated against a non-pedometer control
• Subgroup analyses possible on PA goals, PA logs, goal review etc.
• But these components are all correlated to some extent…

Next steps
• Data extraction on the full set ongoing
• Extracting info on intervention intensity and mode of delivery
• “Additional” intervention components (e.g. counselling)
• “Residual” intervention components (e.g. step goals)
• Further analyses will include:
• Self-report measures
• Studies that only have pedometer groups with “additional” components i.e. not isolated

Acknowledgements
This presentation presents independent research funded by the National Institute for Health Research (NIHR) under its Programme Grants for Applied Research Programme (Grant Reference Number RP-PG-0608-10079). The views expressed are those of the author(s) and not necessarily those of the NHS, the NIHR or the Department of Health.

Search
Disjunction of Examples Notes
Device terms pedometer$, accelerometer$, “activity monitor$”
Based on previous pedometer review
Physical activity terms (physical* NEAR/5 activ*),(life-style* NEAR/5 activ*),inactiv*, walk*
Based on previous Cochrane physical activity review (Foster et al 2009)
Design terms “clinical trial”, random* Based on Haynes et al (2005) “scientifically strong studies” filter
Search in: MEDLINE, PsycINFO, SCI-EXPANDED, SSCI, CPCI-S, CPCI-SSH, EMBASE, Cochrane Library, ERIC, CINAHL, SCOPUS
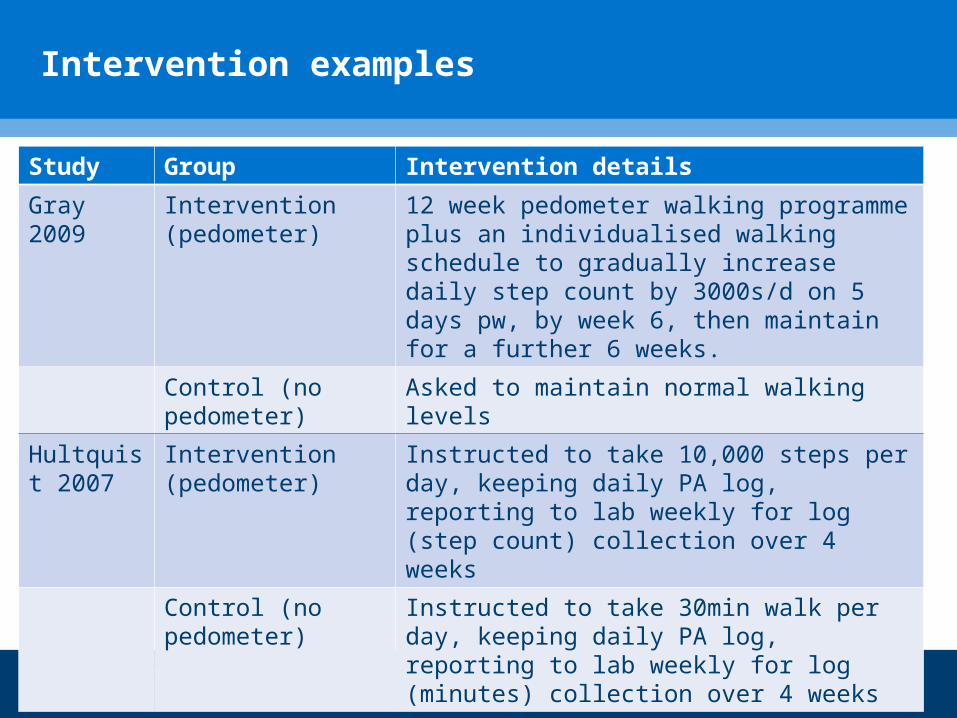
Intervention examples
Study Group Intervention details
Gray 2009 Intervention (pedometer)
12 week pedometer walking programme plus an individualised walking schedule to gradually increase daily step count by 3000s/d on 5 days pw, by week 6, then maintain for a further 6 weeks.
Control (no pedometer)
Asked to maintain normal walking levels
Hultquist 2007
Intervention (pedometer)
Instructed to take 10,000 steps per day, keeping daily PA log, reporting to lab weekly for log (step count) collection over 4 weeks
Control (no pedometer)
Instructed to take 30min walk per day, keeping daily PA log, reporting to lab weekly for log (minutes) collection over 4 weeks
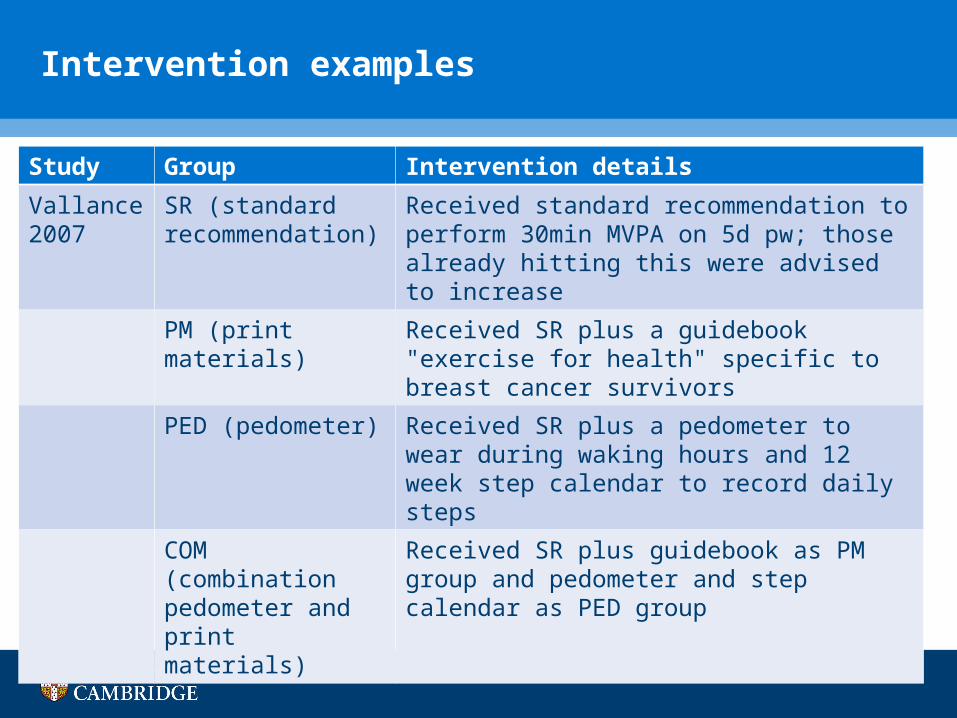
Intervention examples
Study Group Intervention details
Vallance 2007
SR (standard recommendation)
Received standard recommendation to perform 30min MVPA on 5d pw; those already hitting this were advised to increase
PM (print materials) Received SR plus a guidebook "exercise for health" specific to breast cancer survivors
PED (pedometer) Received SR plus a pedometer to wear during waking hours and 12 week step calendar to record daily steps
COM (combination pedometer and print materials)
Received SR plus guidebook as PM group and pedometer and step calendar as PED group


![am Minted] - Vijay Solvex Limited - Vijay Solvex Limited ...](https://static.fdocuments.in/doc/165x107/61db5e41d41a4d48530af940/am-minted-vijay-solvex-limited-vijay-solvex-limited-.jpg)