The effectiveness of interventions to treat severe acute ... marasmic ... entered twice with a...
67
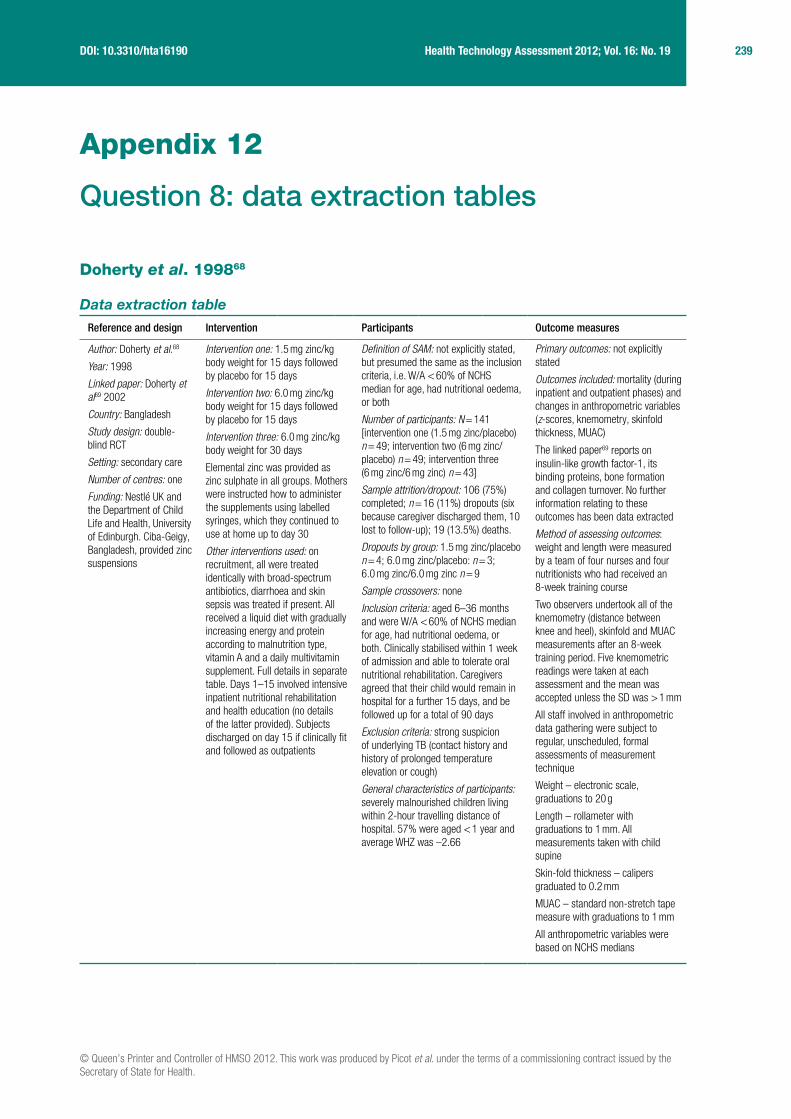
© Queen’s Printer and Controller of HMSO 2012. This work was produced by Picot et al. under the terms of a commissioning contract issued by the Secretary of State for Health. 239 Health Technology Assessment 2012; Vol. 16: No. 19 DOI: 10.3310/hta16190 Appendix 12 Question 8: data extraction tables Doherty et al. 1998 68 Data extraction table Reference and design Intervention Participants Outcome measures Author: Doherty et al. 68 Year: 1998 Linked paper: Doherty et al 69 2002 Country: Bangladesh Study design: double- blind RCT Setting: secondary care Number of centres: one Funding: Nestlé UK and the Department of Child Life and Health, University of Edinburgh. Ciba-Geigy, Bangladesh, provided zinc suspensions Intervention one: 1.5 mg zinc/kg body weight for 15 days followed by placebo for 15 days Intervention two: 6.0 mg zinc/kg body weight for 15 days followed by placebo for 15 days Intervention three: 6.0 mg zinc/kg body weight for 30 days Elemental zinc was provided as zinc sulphate in all groups. Mothers were instructed how to administer the supplements using labelled syringes, which they continued to use at home up to day 30 Other interventions used: on recruitment, all were treated identically with broad-spectrum antibiotics, diarrhoea and skin sepsis was treated if present. All received a liquid diet with gradually increasing energy and protein according to malnutrition type, vitamin A and a daily multivitamin supplement. Full details in separate table. Days 1–15 involved intensive inpatient nutritional rehabilitation and health education (no details of the latter provided). Subjects discharged on day 15 if clinically fit and followed as outpatients Definition of SAM: not explicitly stated, but presumed the same as the inclusion criteria, i.e. W/A < 60% of NCHS median for age, had nutritional oedema, or both Number of participants: N = 141 [intervention one (1.5 mg zinc/placebo) n = 49; intervention two (6 mg zinc/ placebo) n = 49; intervention three (6 mg zinc/6 mg zinc) n = 43] Sample attrition/dropout: 106 (75%) completed; n = 16 (11%) dropouts (six because caregiver discharged them, 10 lost to follow-up); 19 (13.5%) deaths. Dropouts by group: 1.5 mg zinc/placebo n = 4; 6.0 mg zinc/placebo: n = 3; 6.0 mg zinc/6.0 mg zinc n = 9 Sample crossovers: none Inclusion criteria: aged 6–36 months and were W/A < 60% of NCHS median for age, had nutritional oedema, or both. Clinically stabilised within 1 week of admission and able to tolerate oral nutritional rehabilitation. Caregivers agreed that their child would remain in hospital for a further 15 days, and be followed up for a total of 90 days Exclusion criteria: strong suspicion of underlying TB (contact history and history of prolonged temperature elevation or cough) General characteristics of participants: severely malnourished children living within 2-hour travelling distance of hospital. 57% were aged < 1 year and average WHZ was –2.66 Primary outcomes: not explicitly stated Outcomes included: mortality (during inpatient and outpatient phases) and changes in anthropometric variables (z-scores, knemometry, skinfold thickness, MUAC) The linked paper 69 reports on insulin-like growth factor-1, its binding proteins, bone formation and collagen turnover. No further information relating to these outcomes has been data extracted Method of assessing outcomes: weight and length were measured by a team of four nurses and four nutritionists who had received an 8-week training course Two observers undertook all of the knemometry (distance between knee and heel), skinfold and MUAC measurements after an 8-week training period. Five knemometric readings were taken at each assessment and the mean was accepted unless the SD was > 1 mm All staff involved in anthropometric data gathering were subject to regular, unscheduled, formal assessments of measurement technique Weight – electronic scale, graduations to 20 g Length – rollameter with graduations to 1 mm. All measurements taken with child supine Skin-fold thickness – calipers graduated to 0.2 mm MUAC – standard non-stretch tape measure with graduations to 1 mm All anthropometric variables were based on NCHS medians
Transcript of The effectiveness of interventions to treat severe acute ... marasmic ... entered twice with a...
© Queen’s Printer and Controller of HMSO 2012. This work was produced by Picot et al. under the terms of a commissioning contract issued by the Secretary of State for Health.
239 Health Technology Assessment 2012; Vol. 16: No. 19DOI: 10.3310/hta16190
Appendix 12
Question 8: data extraction tables
Doherty et al. 199868
Data extraction table
Reference and design Intervention Participants Outcome measures
Author: Doherty et al.68
Year: 1998
Linked paper: Doherty et al69 2002
Country: Bangladesh
Study design: double-blind RCT
Setting: secondary care
Number of centres: one
Funding: Nestlé UK and the Department of Child Life and Health, University of Edinburgh. Ciba-Geigy, Bangladesh, provided zinc suspensions
Intervention one: 1.5 mg zinc/kg body weight for 15 days followed by placebo for 15 days
Intervention two: 6.0 mg zinc/kg body weight for 15 days followed by placebo for 15 days
Intervention three: 6.0 mg zinc/kg body weight for 30 days
Elemental zinc was provided as zinc sulphate in all groups. Mothers were instructed how to administer the supplements using labelled syringes, which they continued to use at home up to day 30
Other interventions used: on recruitment, all were treated identically with broad-spectrum antibiotics, diarrhoea and skin sepsis was treated if present. All received a liquid diet with gradually increasing energy and protein according to malnutrition type, vitamin A and a daily multivitamin supplement. Full details in separate table. Days 1–15 involved intensive inpatient nutritional rehabilitation and health education (no details of the latter provided). Subjects discharged on day 15 if clinically fit and followed as outpatients
Definition of SAM: not explicitly stated, but presumed the same as the inclusion criteria, i.e. W/A < 60% of NCHS median for age, had nutritional oedema, or both
Number of participants: N = 141 [intervention one (1.5 mg zinc/placebo) n = 49; intervention two (6 mg zinc/placebo) n = 49; intervention three (6 mg zinc/6 mg zinc) n = 43]
Sample attrition/dropout: 106 (75%) completed; n = 16 (11%) dropouts (six because caregiver discharged them, 10 lost to follow-up); 19 (13.5%) deaths.
Dropouts by group: 1.5 mg zinc/placebo n = 4; 6.0 mg zinc/placebo: n = 3; 6.0 mg zinc/6.0 mg zinc n = 9
Sample crossovers: none
Inclusion criteria: aged 6–36 months and were W/A < 60% of NCHS median for age, had nutritional oedema, or both. Clinically stabilised within 1 week of admission and able to tolerate oral nutritional rehabilitation. Caregivers agreed that their child would remain in hospital for a further 15 days, and be followed up for a total of 90 days
Exclusion criteria: strong suspicion of underlying TB (contact history and history of prolonged temperature elevation or cough)
General characteristics of participants: severely malnourished children living within 2-hour travelling distance of hospital. 57% were aged < 1 year and average WHZ was –2.66
Primary outcomes: not explicitly stated
Outcomes included: mortality (during inpatient and outpatient phases) and changes in anthropometric variables (z-scores, knemometry, skinfold thickness, MUAC)
The linked paper69 reports on insulin-like growth factor-1, its binding proteins, bone formation and collagen turnover. No further information relating to these outcomes has been data extracted
Method of assessing outcomes: weight and length were measured by a team of four nurses and four nutritionists who had received an 8-week training course
Two observers undertook all of the knemometry (distance between knee and heel), skinfold and MUAC measurements after an 8-week training period. Five knemometric readings were taken at each assessment and the mean was accepted unless the SD was > 1 mm
All staff involved in anthropometric data gathering were subject to regular, unscheduled, formal assessments of measurement technique
Weight – electronic scale, graduations to 20 g
Length – rollameter with graduations to 1 mm. All measurements taken with child supine
Skin-fold thickness – calipers graduated to 0.2 mm
MUAC – standard non-stretch tape measure with graduations to 1 mm
All anthropometric variables were based on NCHS medians

240 Appendix 12
During in patient phase: body weight recorded daily, knemometry on alternate days, all other anthropometric variables on days 1, 8 and 15
During follow-up: all nutritional measurements recorded together in the morning
Adverse symptoms: none reported
Length of follow-up: during inpatient phase (15 days), and subsequently as outpatients on days 21, 30, 45, 60, 75 and 90
Recruitment dates: November 1995 to November 1996
Characteristics of participants:
CharacteristicIntervention one (1.5 mg zinc/placebo) (n = 49)
Intervention two (6 mg zinc/placebo) (n = 49)
Intervention three (6 mg zinc/6 mg zinc) (n = 43)
Age, months 15.5 ± 8.7 15.0 ± 9.0 16.3 ± 8.6
WAZ –4.47 ± 0.91 –4.56 ± 0.98 –4.66 ± 0.86
WHZ –2.56 ± 0.97 –2.73 ± 0.90 –2.71 ± 0.93
HAZ –3.89 ± 1.3 –3.79 ± 1.4 –3.98 ± 1.45
Malnutrition, n
Marasmus 29 27 26
Marasmic kwashiorkor 15 14 11
Kwashiorkor 5 7 6
Time from admission to recruitment, days
2.5 ± 1.5 3.5 ± 2.2 2.7 ± 1.8
Lower leg length, cm 17.08 ± 2.30 16.91 ± 2.23 17.31 ± 2.24
Comments: data presented are mean ± SD unless otherwise stated
57% of participants were < 1 year of age. Participants were both severely wasted and severely stunted
Results
Outcomes Intervention one (1.5 mg zinc/placebo) (n = 49)
Intervention two (6 mg zinc/placebo) (n = 49)
Intervention three (6 mg zinc/6 mg zinc) (n = 43)
Inpatient death, n 2 5 6
Outpatient death, n 0 3 3
Self-discharge or loss to follow-up, n
4 3 9
Comments: there were more deaths in the groups receiving 6.0 mg zinc/kg as inpatients. This trend was identified at the interim analysis of the first 100 subjects and enrolment was suspended after 141 recruits. When supplementation regimens two and three were combined, the risk of death was significant (p = 0.03) with exposure to 6.0 mg zinc/kg as compared with 1.5 mg zinc/kg initially (Yates-corrected chi-squared value of risk of death at RR 4.52, 95% CI 1.09 to 18.8). Clinician’s impression was that cause of death was sepsis in most cases, and 13 of the 18 deaths occurred when children were inpatients. The paper presents an analysis looking for possible predictors/prognostic factors for death, but none of the factors considered (age, degree of wasting and stunting, severity of initial illness, type of malnutrition) were found to predict death in association with exposure to the higher initial dose of zinc (data not extracted here)
© Queen’s Printer and Controller of HMSO 2012. This work was produced by Picot et al. under the terms of a commissioning contract issued by the Secretary of State for Health.
241 Health Technology Assessment 2012; Vol. 16: No. 19DOI: 10.3310/hta16190
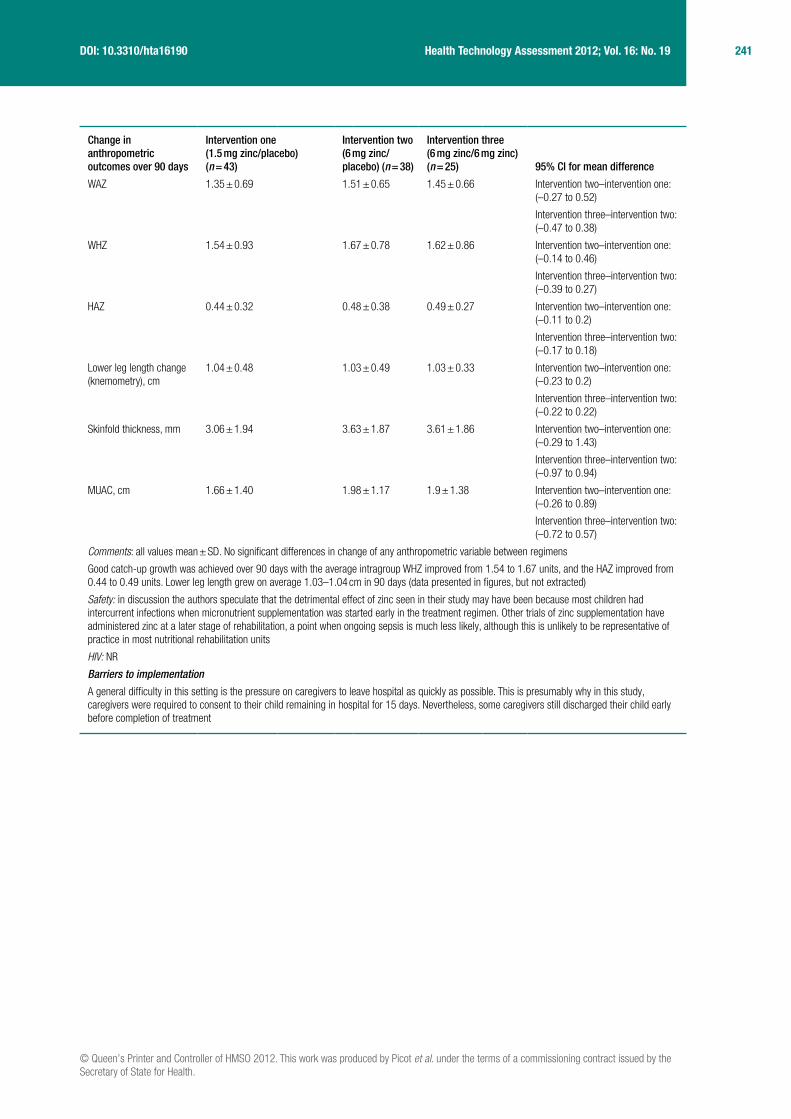
Change in anthropometric outcomes over 90 days
Intervention one (1.5 mg zinc/placebo) (n = 43)
Intervention two (6 mg zinc/placebo) (n = 38)
Intervention three (6 mg zinc/6 mg zinc) (n = 25) 95% CI for mean difference
WAZ 1.35 ± 0.69 1.51 ± 0.65 1.45 ± 0.66 Intervention two–intervention one: (–0.27 to 0.52)
Intervention three–intervention two: (–0.47 to 0.38)
WHZ 1.54 ± 0.93 1.67 ± 0.78 1.62 ± 0.86 Intervention two–intervention one: (–0.14 to 0.46)
Intervention three–intervention two: (–0.39 to 0.27)
HAZ 0.44 ± 0.32 0.48 ± 0.38 0.49 ± 0.27 Intervention two–intervention one: (–0.11 to 0.2)
Intervention three–intervention two: (–0.17 to 0.18)
Lower leg length change (knemometry), cm
1.04 ± 0.48 1.03 ± 0.49 1.03 ± 0.33 Intervention two–intervention one: (–0.23 to 0.2)
Intervention three–intervention two: (–0.22 to 0.22)
Skinfold thickness, mm 3.06 ± 1.94 3.63 ± 1.87 3.61 ± 1.86 Intervention two–intervention one: (–0.29 to 1.43)
Intervention three–intervention two: (–0.97 to 0.94)
MUAC, cm 1.66 ± 1.40 1.98 ± 1.17 1.9 ± 1.38 Intervention two–intervention one: (–0.26 to 0.89)
Intervention three–intervention two: (–0.72 to 0.57)
Comments: all values mean ± SD. No significant differences in change of any anthropometric variable between regimens
Good catch-up growth was achieved over 90 days with the average intragroup WHZ improved from 1.54 to 1.67 units, and the HAZ improved from 0.44 to 0.49 units. Lower leg length grew on average 1.03–1.04 cm in 90 days (data presented in figures, but not extracted)
Safety: in discussion the authors speculate that the detrimental effect of zinc seen in their study may have been because most children had intercurrent infections when micronutrient supplementation was started early in the treatment regimen. Other trials of zinc supplementation have administered zinc at a later stage of rehabilitation, a point when ongoing sepsis is much less likely, although this is unlikely to be representative of practice in most nutritional rehabilitation units
HIV: NR
Barriers to implementation
A general difficulty in this setting is the pressure on caregivers to leave hospital as quickly as possible. This is presumably why in this study, caregivers were required to consent to their child remaining in hospital for 15 days. Nevertheless, some caregivers still discharged their child early before completion of treatment
242 Appendix 12
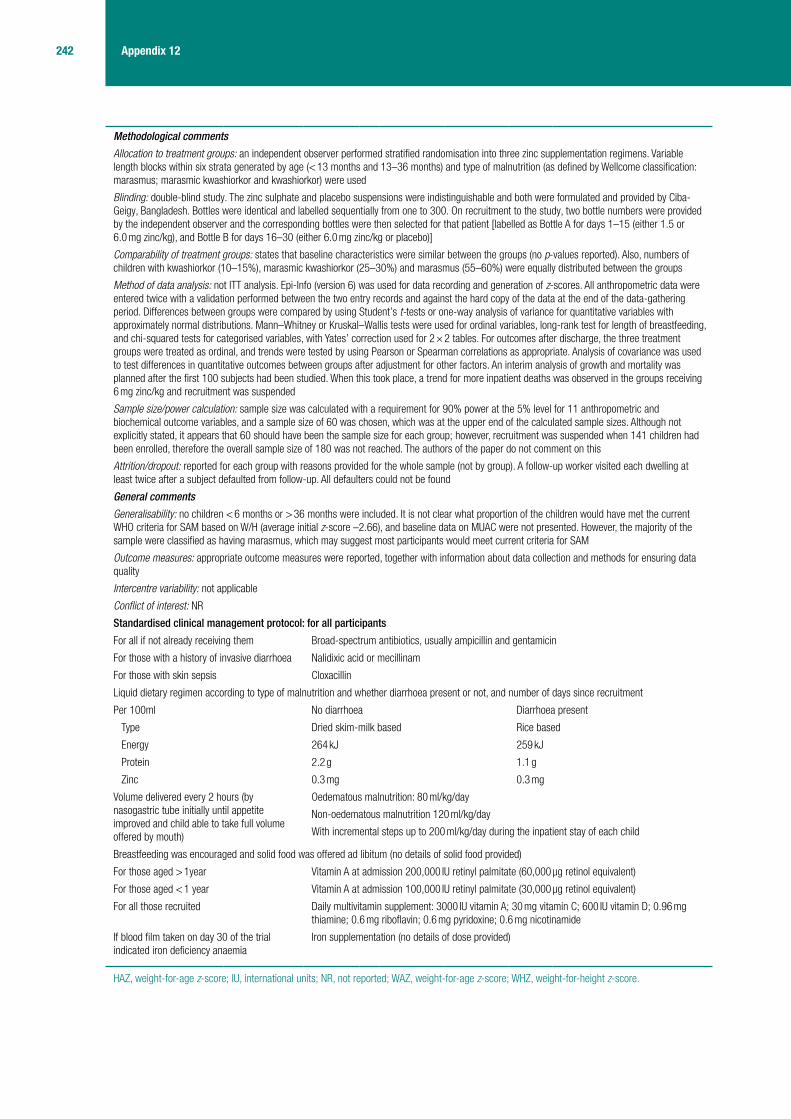
Methodological comments
Allocation to treatment groups: an independent observer performed stratified randomisation into three zinc supplementation regimens. Variable length blocks within six strata generated by age (< 13 months and 13–36 months) and type of malnutrition (as defined by Wellcome classification: marasmus; marasmic kwashiorkor and kwashiorkor) were used
Blinding: double-blind study. The zinc sulphate and placebo suspensions were indistinguishable and both were formulated and provided by Ciba-Geigy, Bangladesh. Bottles were identical and labelled sequentially from one to 300. On recruitment to the study, two bottle numbers were provided by the independent observer and the corresponding bottles were then selected for that patient [labelled as Bottle A for days 1–15 (either 1.5 or 6.0 mg zinc/kg), and Bottle B for days 16–30 (either 6.0 mg zinc/kg or placebo)]
Comparability of treatment groups: states that baseline characteristics were similar between the groups (no p-values reported). Also, numbers of children with kwashiorkor (10–15%), marasmic kwashiorkor (25–30%) and marasmus (55–60%) were equally distributed between the groups
Method of data analysis: not ITT analysis. Epi-Info (version 6) was used for data recording and generation of z-scores. All anthropometric data were entered twice with a validation performed between the two entry records and against the hard copy of the data at the end of the data-gathering period. Differences between groups were compared by using Student’s t-tests or one-way analysis of variance for quantitative variables with approximately normal distributions. Mann–Whitney or Kruskal–Wallis tests were used for ordinal variables, long-rank test for length of breastfeeding, and chi-squared tests for categorised variables, with Yates’ correction used for 2 × 2 tables. For outcomes after discharge, the three treatment groups were treated as ordinal, and trends were tested by using Pearson or Spearman correlations as appropriate. Analysis of covariance was used to test differences in quantitative outcomes between groups after adjustment for other factors. An interim analysis of growth and mortality was planned after the first 100 subjects had been studied. When this took place, a trend for more inpatient deaths was observed in the groups receiving 6 mg zinc/kg and recruitment was suspended
Sample size/power calculation: sample size was calculated with a requirement for 90% power at the 5% level for 11 anthropometric and biochemical outcome variables, and a sample size of 60 was chosen, which was at the upper end of the calculated sample sizes. Although not explicitly stated, it appears that 60 should have been the sample size for each group; however, recruitment was suspended when 141 children had been enrolled, therefore the overall sample size of 180 was not reached. The authors of the paper do not comment on this
Attrition/dropout: reported for each group with reasons provided for the whole sample (not by group). A follow-up worker visited each dwelling at least twice after a subject defaulted from follow-up. All defaulters could not be found
General comments
Generalisability: no children < 6 months or > 36 months were included. It is not clear what proportion of the children would have met the current WHO criteria for SAM based on W/H (average initial z-score –2.66), and baseline data on MUAC were not presented. However, the majority of the sample were classified as having marasmus, which may suggest most participants would meet current criteria for SAM
Outcome measures: appropriate outcome measures were reported, together with information about data collection and methods for ensuring data quality
Intercentre variability: not applicable
Conflict of interest: NR
Standardised clinical management protocol: for all participants
For all if not already receiving them Broad-spectrum antibiotics, usually ampicillin and gentamicin
For those with a history of invasive diarrhoea Nalidixic acid or mecillinam
For those with skin sepsis Cloxacillin
Liquid dietary regimen according to type of malnutrition and whether diarrhoea present or not, and number of days since recruitment
Per 100ml No diarrhoea Diarrhoea present
Type Dried skim-milk based Rice based
Energy 264 kJ 259 kJ
Protein 2.2 g 1.1 g
Zinc 0.3 mg 0.3 mg
Volume delivered every 2 hours (by nasogastric tube initially until appetite improved and child able to take full volume offered by mouth)
Oedematous malnutrition: 80 ml/kg/day
Non-oedematous malnutrition 120 ml/kg/day
With incremental steps up to 200 ml/kg/day during the inpatient stay of each child
Breastfeeding was encouraged and solid food was offered ad libitum (no details of solid food provided)
For those aged > 1year Vitamin A at admission 200,000 IU retinyl palmitate (60,000 µg retinol equivalent)
For those aged < 1 year Vitamin A at admission 100,000 IU retinyl palmitate (30,000 µg retinol equivalent)
For all those recruited Daily multivitamin supplement: 3000 IU vitamin A; 30 mg vitamin C; 600 IU vitamin D; 0.96 mg thiamine; 0.6 mg riboflavin; 0.6 mg pyridoxine; 0.6 mg nicotinamide
If blood film taken on day 30 of the trial indicated iron deficiency anaemia
Iron supplementation (no details of dose provided)
HAZ, weight-for-age z-score; IU, international units; NR, not reported; WAZ, weight-for-age z-score; WHZ, weight-for-height z-score.
© Queen’s Printer and Controller of HMSO 2012. This work was produced by Picot et al. under the terms of a commissioning contract issued by the Secretary of State for Health.
243 Health Technology Assessment 2012; Vol. 16: No. 19DOI: 10.3310/hta16190
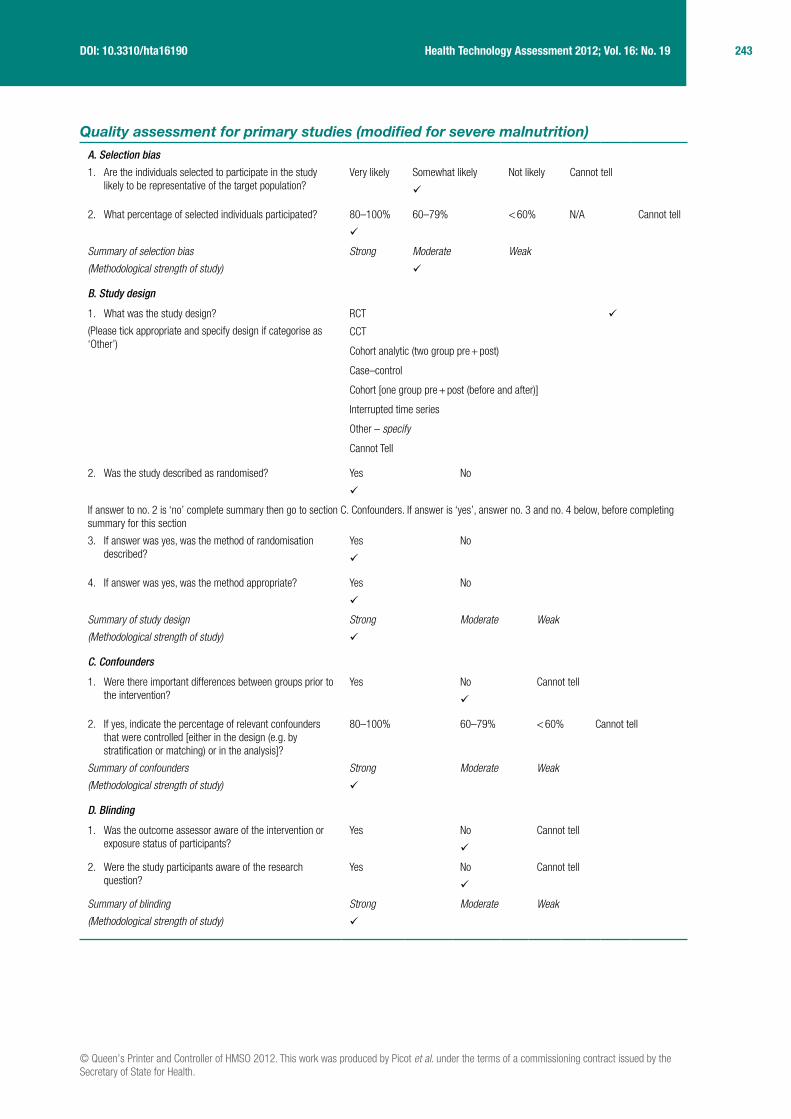
Quality assessment for primary studies (modified for severe malnutrition)
A. Selection bias
1. Are the individuals selected to participate in the study likely to be representative of the target population?
Very likely Somewhat likely Not likely Cannot tell
2. What percentage of selected individuals participated? 80–100% 60–79% < 60% N/A Cannot tell
Summary of selection bias
(Methodological strength of study)
Strong Moderate Weak
B. Study design
1. What was the study design?
(Please tick appropriate and specify design if categorise as ‘Other’)
RCT
CCT
Cohort analytic (two group pre + post)
Case–control
Cohort [one group pre + post (before and after)]
Interrupted time series
Other – specify
Cannot Tell
2. Was the study described as randomised? Yes No
If answer to no. 2 is ‘no’ complete summary then go to section C. Confounders. If answer is ‘yes’, answer no. 3 and no. 4 below, before completing summary for this section
3. If answer was yes, was the method of randomisation described?
Yes No
4. If answer was yes, was the method appropriate? Yes No
Summary of study design
(Methodological strength of study)
Strong Moderate Weak
C. Confounders
1. Were there important differences between groups prior to the intervention?
Yes No Cannot tell
2. If yes, indicate the percentage of relevant confounders that were controlled [either in the design (e.g. by stratification or matching) or in the analysis]?
80–100% 60–79% < 60% Cannot tell
Summary of confounders
(Methodological strength of study)
Strong Moderate Weak
D. Blinding
1. Was the outcome assessor aware of the intervention or exposure status of participants?
Yes No Cannot tell
2. Were the study participants aware of the research question?
Yes No Cannot tell
Summary of blinding
(Methodological strength of study)
Strong Moderate Weak

244 Appendix 12
E. Data collection methods
1. Were data collection tools shown to be valid? Yes No Cannot tell
2. Were data collection tools shown to be reliable? Yes No Cannot tell
Summary of data collection
(Methodological strength of study)
Strong Moderate Weak
F. Withdrawals and dropouts
1. Were withdrawals and dropouts reported in terms of numbers and reasons per group?
Yes No Cannot tell
2. Indicate the percentage of participants completing the study (If the percentage differs by groups, record the lowest)
80–100% 60–79% < 60% Cannot tell
Summary of withdrawals and dropouts
(Methodological strength of study)
Strong Moderate Weak
G. Intervention integrity
1. What percentage of participants received the allocated intervention or exposure of interest?
80–100% 60–79% < 60% Cannot tell
2. Was the consistency of the intervention measured? Yes No Cannot tell
3. Is it likely that subjects received an unintended intervention (contamination or co-intervention) that may influence the results?
Yes No Cannot tell
H. Analysis
1. Indicate the unit of allocation Community Organisation/institution
Practice/office
Provider Patient
2. Indicate the unit of analysis Community Organisation/institution
Practice/office
Provider Patient
3. Are the statistical methods appropriate for the study design?
Yes No Cannot tell
4. Is the analysis performed by intervention allocation status (i.e. ITT) rather than actual intervention received?
Yes No Cannot tell
Global rating for studya
(Overall methodological strength of study – based on sections A–F)
Strong Moderate Weak
HAZ, weight-for-age z-score; N/A, not applicable; ; WAZ, weight-for-age z-score; WHZ, weight-for-height z-score.a Strong = four strong ratings with no weak ratings; moderate = one weak rating; weak = two or more weak ratings.

© Queen’s Printer and Controller of HMSO 2012. This work was produced by Picot et al. under the terms of a commissioning contract issued by the Secretary of State for Health.
245 Health Technology Assessment 2012; Vol. 16: No. 19DOI: 10.3310/hta16190
Gatheru et al. 198870
Data extraction table
Reference and design Intervention Participants Outcome measures
Author: Gatheru et al.70
Year: 1988
Country: Kenya
Study design: CCT
Setting: inpatient
Number of centres: one
Funding: partly supported by the Kenya Medical Research Institute and the Ministry of Health
Intervention: zinc supplement of 5 mg elemental zinc/kg body weight/day given in three divided doses
Control: no zinc
The study also included a third group of children without kwashiorkor who are NR on here
Other interventions used: both groups managed with high protein diet, motherly care and warmth. Breastfeeding continued if it was occurring. Antibiotics given if infection suspected or confirmed
Definition of SAM: kwashiorkor as defined by Wellcome classification
Number of participants: N = 82 (zinc group, n = 42; control group, n = 40)
Sample attrition/dropout: 24 participants did not complete the study, 11 in the zinc group and 13 in the control group
Sample crossovers: none
Inclusion criteria: diagnosis of kwashiorkor (Wellcome classification), aged 1–3 years
Exclusion criteria: transfusions required, serious disease-like TB or measles present, sickle cell disease, absconded before clinical cure, and if death occurred before completion of study
General characteristics of participants: patients aged 1–3 years with kwashiorkor
Primary outcomes: not specifically stated
Outcomes included:
■ weight ■ serum zinc ■ diarrhoea ■ anorexia ■ oedema ■ skin ulcerations
Method of assessing outcomes: weights recorded using the Toledo machine model 1361 Sentinel (Toledo, OH, USA) on admission and daily thereafter until discharge
Serum zinc determined for admission (or latest on second day) and again on 10th day of treatment from a clotted blood sample by the atomic absorption spectroscopy method. One senior technician made all measurements
Signs and symptoms were obtained at admission and daily by the author. Diarrhoea was noted if a patient passed more than three loose stools in 24 hours. Anorexia was noted if the child showed no interest or will to eat or drink the feeds given. Improvement in anorexia was marked by willingness to feed. Skin ulcerations included raw, wet, oozy lesions regardless of the presence of scalding and/or skin dyspigmentation. Healing of lesions was noted as drying up and return of normal colour
Discharge criteria: oedema had subsided, diarrhoea had stopped, weight gain on three consecutive readings
Adverse symptoms: NR
Length of follow-up: 10 days
Recruitment dates: presumably the same as the period of study which was March to September 1985
Characteristics of participants
Characteristic Zinc (n = 42) Control (n = 40) p-value
Weight, mean kg 8.2 7.8 NR
Weight 6–10 kg, n 37 38 NR
Weight > 10 kg, n 5 2 NR
Serum zinc, mean (SD) μmol/l
6.4 (1.36) 6.4 (1.36) NR
Sex, M : F, n 20 : 22 23 : 17 NR
Age 12–14 months, n 35 35 NR
Age 25–36 months, n 7 5 NR
Comments: the majority (70/82, 85.4%) of the participants were < 2 years of age
The mean (range) serum zinc of the whole group of kwashiorkor patients was 6.4 μmol/l (4.0–12.9 μmol/l), this was statistically significantly lower (p < 0.05) to serum zinc values obtained from a group of children without kwashiorkor
246 Appendix 12
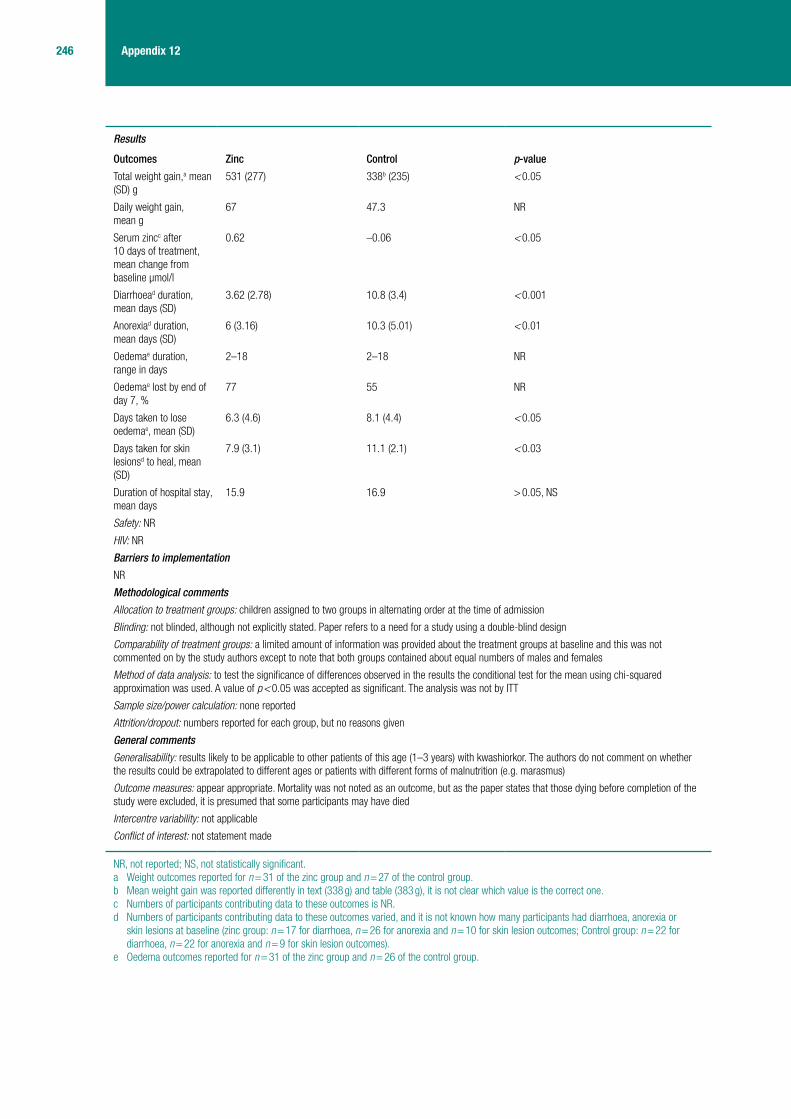
Results
Outcomes Zinc Control p-value
Total weight gain,a mean (SD) g
531 (277) 338b (235) < 0.05
Daily weight gain, mean g
67 47.3 NR
Serum zincc after 10 days of treatment, mean change from baseline μmol/l
0.62 –0.06 < 0.05
Diarrhoead duration, mean days (SD)
3.62 (2.78) 10.8 (3.4) < 0.001
Anorexiad duration, mean days (SD)
6 (3.16) 10.3 (5.01) < 0.01
Oedemae duration, range in days
2–18 2–18 NR
Oedemae lost by end of day 7, %
77 55 NR
Days taken to lose oedemae, mean (SD)
6.3 (4.6) 8.1 (4.4) < 0.05
Days taken for skin lesionsd to heal, mean (SD)
7.9 (3.1) 11.1 (2.1) < 0.03
Duration of hospital stay, mean days
15.9 16.9 > 0.05, NS
Safety: NR
HIV: NR
Barriers to implementation
NR
Methodological comments
Allocation to treatment groups: children assigned to two groups in alternating order at the time of admission
Blinding: not blinded, although not explicitly stated. Paper refers to a need for a study using a double-blind design
Comparability of treatment groups: a limited amount of information was provided about the treatment groups at baseline and this was not commented on by the study authors except to note that both groups contained about equal numbers of males and females
Method of data analysis: to test the significance of differences observed in the results the conditional test for the mean using chi-squared approximation was used. A value of p < 0.05 was accepted as significant. The analysis was not by ITT
Sample size/power calculation: none reported
Attrition/dropout: numbers reported for each group, but no reasons given
General comments
Generalisability: results likely to be applicable to other patients of this age (1–3 years) with kwashiorkor. The authors do not comment on whether the results could be extrapolated to different ages or patients with different forms of malnutrition (e.g. marasmus)
Outcome measures: appear appropriate. Mortality was not noted as an outcome, but as the paper states that those dying before completion of the study were excluded, it is presumed that some participants may have died
Intercentre variability: not applicable
Conflict of interest: not statement made
NR, not reported; NS, not statistically significant.a Weight outcomes reported for n = 31 of the zinc group and n = 27 of the control group.b Mean weight gain was reported differently in text (338 g) and table (383 g), it is not clear which value is the correct one.c Numbers of participants contributing data to these outcomes is NR.d Numbers of participants contributing data to these outcomes varied, and it is not known how many participants had diarrhoea, anorexia or
skin lesions at baseline (zinc group: n = 17 for diarrhoea, n = 26 for anorexia and n = 10 for skin lesion outcomes; Control group: n = 22 for diarrhoea, n = 22 for anorexia and n = 9 for skin lesion outcomes).
e Oedema outcomes reported for n = 31 of the zinc group and n = 26 of the control group.

© Queen’s Printer and Controller of HMSO 2012. This work was produced by Picot et al. under the terms of a commissioning contract issued by the Secretary of State for Health.
247 Health Technology Assessment 2012; Vol. 16: No. 19DOI: 10.3310/hta16190
Quality assessment for primary studies (modified for severe malnutrition)
A. Selection bias
1. Are the individuals selected to participate in the study likely to be representative of the target population?
Very likely Somewhat likely Not likely Cannot tell
2. What percentage of selected individuals participated? 80–100% 60–79% < 60% N/A Cannot tell
Summary of selection bias
(Methodological strength of study)
Strong Moderate Weak
B. Study design
1. What was the study design?
(Please tick appropriate and specify design if categorise as ‘Other’)
RCT
CCT
Cohort analytic (two group pre + post)
Case–control
Cohort [one group pre + post (before and after)]
Interrupted time series
Other – specify
Cannot Tell
2. Was the study described as randomised? Yes No
If answer to no. 2 is ‘no’ complete summary then go to section C. Confounders. If answer is ‘yes’, answer no. 3 and no. 4 below, before completing summary for this section
3. If answer was yes, was the method of randomisation described?
Yes No
4. If answer was yes, was the method appropriate? Yes No
Summary of study design
(Methodological strength of study)
Strong Moderate Weak
C. Confounders
1. Were there important differences between groups prior to the intervention?
Yes No Cannot tell
2. If yes, indicate the percentage of relevant confounders that were controlled [either in the design (e.g. by stratification or matching) or in the analysis]?
80–100% 60–79% < 60% Cannot tell
Summary of confounders
(Methodological strength of study)
Strong Moderate Weak
D. Blinding
1. Was the outcome assessor aware of the intervention or exposure status of participants?
Yes No Cannot tell
2. Were the study participants aware of the research question?
Yes No Cannot tell
Summary of blinding
(Methodological strength of study)
Strong Moderate Weak

248 Appendix 12
E. Data collection methods
1. Were data collection tools shown to be valid? Yes No Cannot tell
2. Were data collection tools shown to be reliable? Yes No Cannot tell
Summary of data collection
(Methodological strength of study)
Strong Moderate Weak
F. Withdrawals and dropouts
1. Were withdrawals and dropouts reported in terms of numbers and reasons per group?
Yes No Cannot tell
2. Indicate the percentage of participants completing the study (If the percentage differs by groups, record the lowest)
80–100% 60–79% < 60% Cannot tell
Summary of withdrawals and dropouts
(Methodological strength of study)
Strong Moderate Weak
G. Intervention integrity
1. What percentage of participants received the allocated intervention or exposure of interest?
80–100% 60–79% < 60% Cannot tell
2. Was the consistency of the intervention measured? Yes No Cannot tell
3. Is it likely that subjects received an unintended intervention (contamination or co-intervention) that may influence the results?
Yes No Cannot tell
H. Analysis
1. Indicate the unit of allocation Community Organisation/institution
Practice/office
Provider Patient
2. Indicate the unit of analysis Community Organisation/institution
Practice/office
Provider Patient
3. Are the statistical methods appropriate for the study design?
Yes No Cannot tell
4. Is the analysis performed by intervention allocation status (i.e. ITT) rather than actual intervention received?
Yes No Cannot tell
Global rating for studya
(Overall methodological strength of study – based on sections A–F)
Strong Moderate Weak
N/A, not applicable.a Strong = four strong ratings with no weak ratings; moderate = one weak rating; weak = two or more weak ratings.
© Queen’s Printer and Controller of HMSO 2012. This work was produced by Picot et al. under the terms of a commissioning contract issued by the Secretary of State for Health.
249 Health Technology Assessment 2012; Vol. 16: No. 19DOI: 10.3310/hta16190
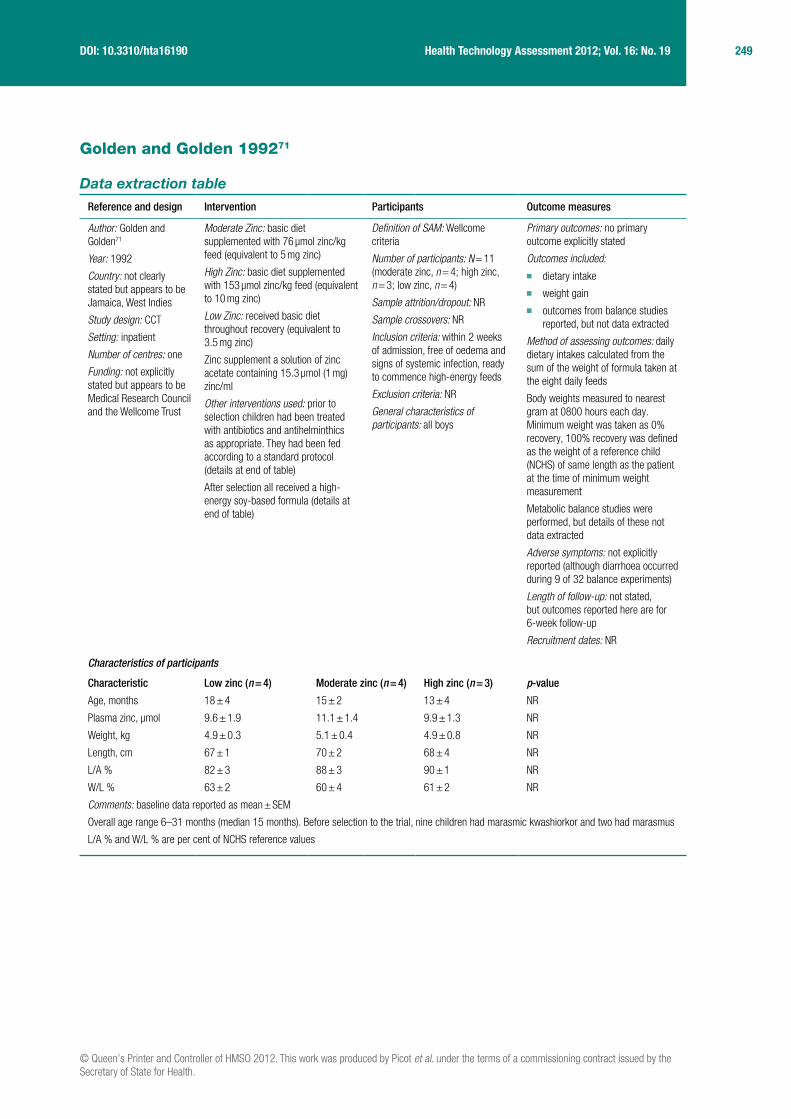
Golden and Golden 199271
Data extraction table
Reference and design Intervention Participants Outcome measures
Author: Golden and Golden71
Year: 1992
Country: not clearly stated but appears to be Jamaica, West Indies
Study design: CCT
Setting: inpatient
Number of centres: one
Funding: not explicitly stated but appears to be Medical Research Council and the Wellcome Trust
Moderate Zinc: basic diet supplemented with 76 μmol zinc/kg feed (equivalent to 5 mg zinc)
High Zinc: basic diet supplemented with 153 μmol zinc/kg feed (equivalent to 10 mg zinc)
Low Zinc: received basic diet throughout recovery (equivalent to 3.5 mg zinc)
Zinc supplement a solution of zinc acetate containing 15.3 μmol (1 mg) zinc/ml
Other interventions used: prior to selection children had been treated with antibiotics and antihelminthics as appropriate. They had been fed according to a standard protocol (details at end of table)
After selection all received a high-energy soy-based formula (details at end of table)
Definition of SAM: Wellcome criteria
Number of participants: N = 11 (moderate zinc, n = 4; high zinc, n = 3; low zinc, n = 4)
Sample attrition/dropout: NR
Sample crossovers: NR
Inclusion criteria: within 2 weeks of admission, free of oedema and signs of systemic infection, ready to commence high-energy feeds
Exclusion criteria: NR
General characteristics of participants: all boys
Primary outcomes: no primary outcome explicitly stated
Outcomes included:
■ dietary intake ■ weight gain ■ outcomes from balance studies
reported, but not data extracted
Method of assessing outcomes: daily dietary intakes calculated from the sum of the weight of formula taken at the eight daily feeds
Body weights measured to nearest gram at 0800 hours each day. Minimum weight was taken as 0% recovery, 100% recovery was defined as the weight of a reference child (NCHS) of same length as the patient at the time of minimum weight measurement
Metabolic balance studies were performed, but details of these not data extracted
Adverse symptoms: not explicitly reported (although diarrhoea occurred during 9 of 32 balance experiments)
Length of follow-up: not stated, but outcomes reported here are for 6-week follow-up
Recruitment dates: NR
Characteristics of participants
Characteristic Low zinc (n = 4) Moderate zinc (n = 4) High zinc (n = 3) p-value
Age, months 18 ± 4 15 ± 2 13 ± 4 NR
Plasma zinc, μmol 9.6 ± 1.9 11.1 ± 1.4 9.9 ± 1.3 NR
Weight, kg 4.9 ± 0.3 5.1 ± 0.4 4.9 ± 0.8 NR
Length, cm 67 ± 1 70 ± 2 68 ± 4 NR
L/A % 82 ± 3 88 ± 3 90 ± 1 NR
W/L % 63 ± 2 60 ± 4 61 ± 2 NR
Comments: baseline data reported as mean ± SEM
Overall age range 6–31 months (median 15 months). Before selection to the trial, nine children had marasmic kwashiorkor and two had marasmus
L/A % and W/L % are per cent of NCHS reference values

250 Appendix 12
Results
Outcomes during first 6 weeks of recovery
Low zinc (n = 4) Moderate zinc (n = 4)
High zinc (n = 3) p-value
Energy intake, kJ/kg/day 705 ± 18 730 ± 26 701 ± 35 NR but states not significantly different for either measureNitrogen intake mmol/kg/day 41 ± 3 42 ± 4 42 ± 3
Rate of weight gain, g/kg/day 10.10 ± 0.22 11.60 ± 0.95 11.67 ± 1.41 No significant difference, p-value NR
Energy cost of tissue deposition, kJ/g 29.3 ± 2.6 24.8 ± 1.7 25.0 ± 0.6 NR
Comments: values are mean ± SEM
Although zinc-supplemented children gained weight faster, difference with low-zinc group was NS. Energy cost of tissue deposition (ECTD) values higher in the low-zinc group, no p-value reported and states will be published separately
Outcomes from metabolic balance studies not data extracted
Safety: NR
HIV: NR
Barriers to implementation
NR
Methodological comments
Allocation to treatment groups: selected within 2 weeks of admission. Consecutive children assigned first to moderate-zinc group, then to low-zinc group, then to high-zinc group
Blinding: NR
Comparability of treatment groups: states that at selection there were no significant anthropometric differences among the groups, and plasma zinc was also not different among the zinc groups
Method of data analysis: data were analysed using the statistical routines in Systat (Systat Software Inc., Evanston, IL, USA). ANOVA with post-analysis contrasts and repeated measures analysis of variance were used to assess differences in results. Statistical significance was assumed at the 5% level. The results were presented as means ± SEM, and in some cases as individual values
Sample size/power calculation: none reported
Attrition/dropout: NR, appears to be none
General comments
Generalisability: participants were all boys (presumably to facilitate separate collection of urine and faeces during metabolic balance experiments); however, there does not seem to be any reason why the results would not hold for girls also
Outcome measures: appear appropriate, but the method of obtaining weights and lengths was NR
Intercentre variability: not applicable
Conflict of interest: no statement made. Funding appears to come from the Medical Research Council and the Wellcome Trust
Initial feeding protocol (before selection into trial) Cow’s milk diet: ■ 0.4 MJ/child/day ■ 0.6 g protein/kg/child/day
Supplemented with: ■ potassium 4 mmol/kg/child/day ■ magnesium 1 mmol/kg/child/day ■ vitamins Tropivite 1 ml/day (contains A, B1, B2, C and nicotinamide) ■ folic acid 5 mg/day
None received oral or topical zinc prior to selection
High-energy feeding protocol (after entry into trial) Sobee, Mead Johnson diet (Mead Johnson and Company, Evansville, IN, USA): ■ 133 g/kg, supplemented with arachis oil 59 g/kg, and sucrose 50 g/kg
Contents per kg feed: ■ 5.6 MJ ■ 29 g protein ■ 1.33 mmol phytic acid ■ 54 μmol zinc
Fed by cup 3-hourly, to appetite (notes that this usually increased rapidly)
Potassium, magnesium and vitamin supplements continued as previous dosage
Ferrous sulphate commenced 0.4 mmol/child/day
ANOVA, analysis of variance; ECTD, energy cost of tissue deposition; L/A, length-for-age; NR, not reported; NS, not statistically significant; SEM, standard error of the mean.

© Queen’s Printer and Controller of HMSO 2012. This work was produced by Picot et al. under the terms of a commissioning contract issued by the Secretary of State for Health.
251 Health Technology Assessment 2012; Vol. 16: No. 19DOI: 10.3310/hta16190
Quality assessment for primary studies (modified for severe malnutrition)
A. Selection bias
1. Are the individuals selected to participate in the study likely to be representative of the target population?
Very likely Somewhat likely Not likely Cannot tell
2. What percentage of selected individuals participated? 80–100% 60–79% < 60% N/A Cannot tell
Summary of selection bias
(Methodological strength of study)
Strong Moderate Weak
B. Study design
1. What was the study design?
(Please tick appropriate and specify design if categorise as ‘Other’)
RCT
CCT
Cohort analytic (two group pre + post)
Case–control
Cohort [one group pre + post (before and after)]
Interrupted time series
Other – specify
Cannot Tell
2. Was the study described as randomised? Yes No
If answer to no. 2 is ‘no’ complete summary then go to section C. Confounders. If answer is ‘yes’, answer no. 3 and no. 4 below, before completing summary for this section
3. If answer was yes, was the method of randomisation described?
Yes No
4. If answer was yes, was the method appropriate? Yes No
Summary of study design
(Methodological strength of study)
Strong Moderate Weak
C. Confounders
1. Were there important differences between groups prior to the intervention?
Yes No Cannot tell
2. If yes, indicate the percentage of relevant confounders that were controlled [either in the design (e.g. by stratification or matching) or in the analysis]?
80–100% 60–79% < 60% Cannot tell
Summary of confounders
(Methodological strength of study)
Strong Moderate Weak
D. Blinding
1. Was the outcome assessor aware of the intervention or exposure status of participants?
Yes No Cannot tell
2. Were the study participants aware of the research question?
Yes No Cannot tell
Summary of blinding
(Methodological strength of study)
Strong Moderate Weak
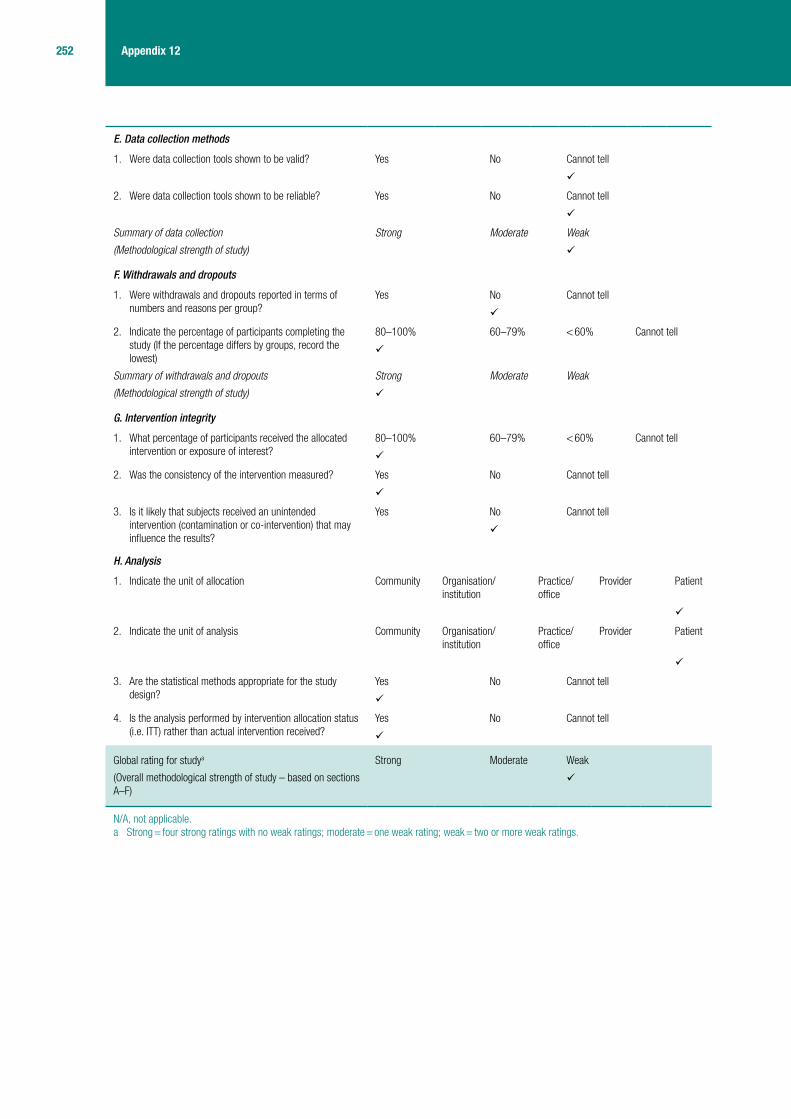
252 Appendix 12
E. Data collection methods
1. Were data collection tools shown to be valid? Yes No Cannot tell
2. Were data collection tools shown to be reliable? Yes No Cannot tell
Summary of data collection
(Methodological strength of study)
Strong Moderate Weak
F. Withdrawals and dropouts
1. Were withdrawals and dropouts reported in terms of numbers and reasons per group?
Yes No Cannot tell
2. Indicate the percentage of participants completing the study (If the percentage differs by groups, record the lowest)
80–100% 60–79% < 60% Cannot tell
Summary of withdrawals and dropouts
(Methodological strength of study)
Strong Moderate Weak
G. Intervention integrity
1. What percentage of participants received the allocated intervention or exposure of interest?
80–100% 60–79% < 60% Cannot tell
2. Was the consistency of the intervention measured? Yes No Cannot tell
3. Is it likely that subjects received an unintended intervention (contamination or co-intervention) that may influence the results?
Yes No Cannot tell
H. Analysis
1. Indicate the unit of allocation Community Organisation/institution
Practice/office
Provider Patient
2. Indicate the unit of analysis Community Organisation/institution
Practice/office
Provider Patient
3. Are the statistical methods appropriate for the study design?
Yes No Cannot tell
4. Is the analysis performed by intervention allocation status (i.e. ITT) rather than actual intervention received?
Yes No Cannot tell
Global rating for studya
(Overall methodological strength of study – based on sections A–F)
Strong Moderate Weak
N/A, not applicable.a Strong = four strong ratings with no weak ratings; moderate = one weak rating; weak = two or more weak ratings.

© Queen’s Printer and Controller of HMSO 2012. This work was produced by Picot et al. under the terms of a commissioning contract issued by the Secretary of State for Health.
253 Health Technology Assessment 2012; Vol. 16: No. 19DOI: 10.3310/hta16190
Hemalatha et al. 199372
Data extraction table
Reference and design Intervention Participants Outcome measures
Author: Hemalatha et al.72
Year: 1993
Country: India
Study design: CCT (after quality assessment)
Setting: inpatient
Number of centres: one
Funding: NR
Intervention: zinc as zinc sulphate (zincSO
4) in a capsule (40 mg
elemental zinc per capsule). Single dose each day. Estimated to be about 6 mg/kg body weight/day
Control: placebo capsule, one each day
zinc and placebo administered from admission for 21 days
Other interventions used: all children received a cereal-based diet and dairy milk provided ad libitum. Details in separate table at end
IM injection of vitamin A 100,000 IU
Definition of SAM: [v]Gómez classification with W/A < 60% of that expected (NCHS standard). Those with loss of subcutaneous fat and with muscle wasting (marasus), those with oedema with wasting (marasmic kwashiorkor)
Number of participants: N = 33 (zinc n = 16, placebo n = 17)
Sample attrition/dropout: NR (but there is missing data)
Sample crossovers: none
Inclusion criteria: children hospitalised for rehabilitation from severe PEM
Exclusion criteria: clinical evidence of any infection
General characteristics of participants: children aged 1–5 years in hospital with SAM
Primary outcomes: none specifically reported
Outcomes included:
■ time taken for oedema to resolve ■ weight change ■ duration of morbidity because of
infections ■ biochemical measures
(haemoglobin, serum albumin, plasma copper, plasma and leucocyte zinc)
Method of assessing outcomes: ■ food intake assessed by 24-hour
dietary records ■ biochemical measures obtained
from blood sample collected after overnight fast. Full details of methods used not extracted. Repeat measures at 4 weeks only possible in 25 children (remainder unwilling to provide sample)
■ zinc content of three random 1-day diet samples were analysed
Adverse symptoms: NR
Length of follow-up: 1 month
Recruitment dates: August 1990 to August 1991
Characteristics of participants
Characteristic Zinc (n = 16) Placebo (n = 17) p-value
Age (years)
1–2 6 NR
2–5 27
Marasmic kwashiorkor, n and mean weight (SD)
n = 7, 7.5 kg (0.56) n = 7, 7.3 kg (0.49) NR
Marasmic. n and mean weight (SD)
n = 9, 6.7 kg (0.56) n = 10, 7.2 kg (0.38) NR
Leucocyte zinc μg/1010 cells, n and mean weight (SD)
n = 12, 46.9 (5.490) n = 10, 45.7 (4.409) NR
Plasma zinc μg/dl, n and mean weight (SD)
n = 13, 80.4 (9.972) n = 12, 83.6 (10.363) NR, but stated they were comparable at baseline
Plasma copper μg/dl, n and mean weight (SD)
n = 13, 112.1 (9.487) n = 12, 99.1 (15.346) NR, but stated they were comparable at baseline
Comments: initial zinc and copper status of the zinc group and placebo group described as comparable, and statistically significantly lower (p < 0.001) than levels in healthy children (not data extracted). Few details about baseline characteristics presented

254 Appendix 12
Results
Primary outcomes Zinc (n = 16) Placebo (n = 17) p-value
Leucocyte zinc μg/1010 cells, n and mean (SE)
n = 12,a 107.2 (13.224) n = 10, 70.9 (8.414) NR
Leucocyte zinc, change from baselineb μg/1010 cells
n = 12a
60.3
p < 0.001
n = 10
25.2
p < 0.025
Plasma zinc, μg/dl, mean (SE)
n = 13, 107.5 (11.822) n = 12, 68.2 (7.031) NR
Plasma zinc, change from baseline,b μg/dl
n = 13
27.1
p < 0.01
n = 12
–15.4
p = NS
Plasma copper μg/dl, n and mean (SE)
n = 13
145.3 (8.621)
n = 12
144.8 (13.258)
NR
Plasma copper, change from baseline,b μg/dl
n = 13
33.2
p < 0.01
n = 12
45.7
p = 0.025
Days for oedema to disappear, mean (SE)
9.0 (2.035) 15.7 (2.7) NS
Duration of morbidity, days, mean (SE)
6.3 (0.959) 7.7 (1.040) c
Weight gain g/kg body weight/day, n and mean weight (SE) in:
Week one n = 16, 22.2 (8.365) n = 16, 31.1 (9.629) NR
Week two n = 15, 25.1 (5.892) n = 17, 23.7 (7.494) NR
Week three n = 14, 23.1 (4.945) n = 16, 22.3 (6.155) NR
Week four n = 12, 22.6 (5.100) n = 15, 24.5 (5.035) NS
Comments: data on haemoglobin and albumin levels are presented (again no between-group comparison), but have not been data extracted. Data on average energy intake in the two groups is provided separately for each of weeks 1 to 4 but these have not been data extracted
Overall reports that zinc supplementation did not have any additional benefit on the clinical or biochemical responses measured
Safety: NR other than a statement that the zinc supplements as given in the study were not found to adversely affect plasma copper levels
HIV: NR
Barriers to implementation
NR
Methodological comments
Allocation to treatment groups: no details provided. Only states that zinc capsule or placebo was randomly administered
Blinding: capsules coded in a laboratory by a person not connected with the study. After analysing clinical findings and completing the biochemical estimations, data were decoded and results analysed
Comparability of treatment groups: initial zinc and copper status described as comparable in the two groups, but statistically significantly lower (p < 0.001) than healthy children (based on data from 34 health children with normal nutritional status tested as part of the study). Few baseline characteristics presented
Method of data analysis: states that as the results were similar in marasmic and marasmic kwashiorkor children, the findings were pooled for each group. Similarly, results for boys and girls were combined because no significant sex-related differences were observed. t-tests used to compare between groups for outcomes of body weight gain and energy intake, paired t-tests used to compare before and after outcomes within groups for some outcomes. No other information provided
Sample size/power calculation: NR
Attrition/dropout: NR. However, it is clear from the information provided about numbers of participants contributing data to the different outcomes that there is missing data. For data derived from blood samples (leucocyte zinc, plasma zinc, plasma copper), data is missing because only 25 (of the 33) participants allowed a second blood sample to be taken at 4 weeks. For other outcomes, e.g. duration of morbidity, weight gain, no explanation for missing data is provided

© Queen’s Printer and Controller of HMSO 2012. This work was produced by Picot et al. under the terms of a commissioning contract issued by the Secretary of State for Health.
255 Health Technology Assessment 2012; Vol. 16: No. 19DOI: 10.3310/hta16190
General comments
Generalisability: results likely to be generalisable to children > 1 year in age with PEM, providing they do not have infection
Outcome measures: appear appropriate but, in general, between group comparisons have not been reported
Intercentre variability: not applicable
Conflict of interest: none reported
Rehabilitation diet
Energy/day 700 kJ (8–10% derived from protein)
Protein/kg body weight/day 3–4 g
Multivitamin One tablet
Ferrous sulphate 20 mg elemental iron in one capsule
Dietary analysis showed mean dietary zinc values of 7.3 ± 0.49 mg/1 day’s diet. Although not explicitly stated it is assumed that this was the dietary content received by all participants, with those in the zinc group receiving additional zinc via the supplement
IU, international units; NR, not reported; NS, not statistically significant.a It is not explicitly stated, but has been assumed by the reviewer that numbers of participants contributing outcome data to the outcomes of
leucocyte zinc, plasma zinc and plasma copper are the same as those reported for the baseline values – baseline and post-treatment values only available for the 25 children who allowed a second blood sample to be taken after treatment at 4 weeks.
b Change from baseline values calculated by reviewer. The p-values reported are for the within-group comparison between baseline and follow-up. No comparisons between the groups are reported for leucocyte zinc, plasma zinc and plasma copper.
c States groups were comparable, but no p-value reported.

256 Appendix 12
Quality assessment for primary studies (modified for severe malnutrition)
A. Selection bias
1. Are the individuals selected to participate in the study likely to be representative of the target population?
Very likely Somewhat likely Not likely Cannot tell
2. What percentage of selected individuals participated? 80–100% 60–79% < 60% N/A Cannot tell
Summary of selection bias
(Methodological strength of study)
Strong Moderate Weak
B. Study design
1. What was the study design?
(Please tick appropriate and specify design if categorise as ‘Other’)
RCT
CCT
Cohort analytic (two group pre + post)
Case–control
Cohort [one group pre + post (before and after)]
Interrupted time series
Other – specify
Cannot Tell
2. Was the study described as randomised? Yes No
If answer to no. 2 is ‘no’ complete summary then go to section C. Confounders. If answer is ‘yes’, answer no. 3 and no. 4 below, before completing summary for this section
3. If answer was yes, was the method of randomisation described?
Yes No
4. If answer was yes, was the method appropriate? Yes No
Summary of study design
(Methodological strength of study)
Strong Moderate Weak
C. Confounders
1. Were there important differences between groups prior to the intervention?
Yes No Cannot tell
2. If yes, indicate the percentage of relevant confounders that were controlled [either in the design (e.g. by stratification or matching) or in the analysis]?
80–100% 60–79% < 60% Cannot tell
Summary of confounders
(Methodological strength of study)
Strong Moderate Weak
D. Blinding
1. Was the outcome assessor aware of the intervention or exposure status of participants?
Yes No Cannot tell
2. Were the study participants aware of the research question? Yes No Cannot tell
Summary of blinding
(Methodological strength of study)
Strong Moderate Weak

© Queen’s Printer and Controller of HMSO 2012. This work was produced by Picot et al. under the terms of a commissioning contract issued by the Secretary of State for Health.
257 Health Technology Assessment 2012; Vol. 16: No. 19DOI: 10.3310/hta16190
E. Data collection methods
1. Were data collection tools shown to be valid? Yes No Cannot tell
– zinc – weight
2. Were data collection tools shown to be reliable? Yes No Cannot tell
Summary of data collection
(Methodological strength of study)
Strong Moderate Weak
– zinc – weight
F. Withdrawals and dropouts
1. Were withdrawals and dropouts reported in terms of numbers and reasons per group?
Yes No Cannot tell
2. Indicate the percentage of participants completing the study (If the percentage differs by groups, record the lowest)
80–100% 60–79% < 60% Cannot tell
Summary of withdrawals and dropouts
(Methodological strength of study)
Strong Moderate Weak
G. Intervention integrity
1. What percentage of participants received the allocated intervention or exposure of interest?
80–100% 60–79% < 60% Cannot tell
2. Was the consistency of the intervention measured? Yes No Cannot tell
3. Is it likely that subjects received an unintended intervention (contamination or co-intervention) that may influence the results?
Yes No Cannot tell
H. Analysis
1. Indicate the unit of allocation Community Organisation/institution
Practice/office
Provider Patient
2. Indicate the unit of analysis Community Organisation/institution
Practice/office
Provider Patient
3. Are the statistical methods appropriate for the study design?
Yes No Cannot tell
4. Is the analysis performed by intervention allocation status (i.e. ITT) rather than actual intervention received?
Yes No Cannot tell
Global rating for studya
(Overall methodological strength of study – based on sections A–F)
Strong Moderate Weak
N/A, not applicable.a Strong = four strong ratings with no weak ratings; moderate = one weak rating; weak = two or more weak ratings.

258 Appendix 12
Khanum et al. 198873
Data extraction table
Reviewer: DM Date: 6 September 2010 Version: 2 Checked by: DH
Reference and design Intervention Participants Outcome measures
Author: Khanum et al.73
Year: 1988
Country: Bangladesh
Study design: CCT
Setting: inpatient (Children’s Nutrition Unit)
Number of centres: one
Funding: NR
Intervention: zinc supplement [10 mg zinc/kg/day as zinc sulphate (zincSO
4) for those weighing < 6 kg;
50 mg daily for those > 6 kg] given on the 15th hospital day for 3 weeks
Control: standard care (no zinc supplement)
Other interventions used: all children received milk feeds, rice-based solid foods ad libitum up to four times/day, and vitamins and iron supplementation (see end of table for further details)
Infections had been treated before the administration of the intervention (15th hospital day)
Definition of SAM: Waterlow 1976.101 All children with oedema and all those, with or without oedema, who were ≤ 60% W/H
Number of participants: N = 60 (zinc supplemented, n = 30; control, n = 30)
Sample attrition/dropout: NR
Sample crossovers: NR
Inclusion criteria: SAM children who had been admitted to the Children’s Nutrition Unit
Exclusion criteria: NR
General characteristics of participants:
■ all children were classified clinically as either kwashiorkor or marasmic kwashiorkor
■ age range: 5–60 months ■ mean age: 29 months ■ both sexes were equally
represented
The prevalence of infections such as diarrhoea (80%), pneumonia (56%), and of other nutrient deficiencies such as xerophthalmia (76%) and anaemia (50%) was similar in both groups
Primary outcomes: not specifically stated
Outcomes: ■ mean plasma zinc concentration ■ weight gain ■ W/H ■ W/A
Method of assessing outcomes: nutritional status was assessed by W/A (Harvard standard) for < 1 year, and by W/H (Stuart and Stevenson 195925) and presence or absence of oedema for > 1 year
One ml of venous blood was drawn for measurement of plasma zinc and albumin on admission, on the 15th hospital day, and on discharge (36th hospital day)
Plasma zinc concentration was estimated by atomic absortion spectrophotometry
Weight, height and mid-arm circumference were measured on admission. Body weight was recorded at the same time each day, initially each morning, then weekly, by the same person. Height was measured weekly
Dietary intakes were measured by weighting each plate of food and leftovers; any vomitus was recorded for each feed and the total daily intake calculated. The energy value of samples of the diet was estimated by bomb calorimetry, and energy intake was calculated for each week as the average intake/day divided by the average weight of the child during that week
Adverse symptoms: NR
Length of follow-up: 5 weeks total study time (2 weeks lead in, 3 weeks of treatment; no additional follow-up after treatment ceased)
Recruitment dates: NR

© Queen’s Printer and Controller of HMSO 2012. This work was produced by Picot et al. under the terms of a commissioning contract issued by the Secretary of State for Health.
259 Health Technology Assessment 2012; Vol. 16: No. 19DOI: 10.3310/hta16190
Characteristics of participants
Characteristic Zinc supplemented (n = 30)Control (non-supplemented) (n = 30) p-value
Age (months)
5 –12 4 2 NR
12–24 6 8 NR
24–36 8 8 NR
36–48 6 8 NR
> 48 6 4 NR
Kwashiorkor, n (%)a 13 (43) 9 (30) NR, NS
Results
Outcomes Zinc supplemented (n = 30) Control (non-supplemented) (n = 30) p-value
Plasma zinc concentration (mmol/l)b
On admission day 8.23 ± 0.7 7.90 ± 0.7 NR
15th day (zinc started) 7.88 ± 0.7 8.07 ± 0.5 NR
36th day (discharged) 18.53 ± 1.5 10.56 ± 0.9 < 0.001
Weekly weight gain (g/week)
First week 600 ± 99.9 468 ± 81.7 NR
Second week 521 ± 75.4 330 ± 65.9 NR
Third week (zinc started) 580 ± 67.6 342 ± 86.5 < 0.05
Fourth week 403 ± 41.6 269 ± 47.1 < 0.05
Fifth week 462 ± 42.4 374 ± 48.9 NR
Mean weight gain rate > 10 g/kg/day
66% 33% 0.02
W/Hc
On admission day 70 ± 1.3 67 ± 1.3 NR
Eighth day 76 ± 1.4 72 ± 1.0 < 0.05
15th day (zinc started) 80 ± 1.4 75 ± 1.1 < 0.05
22nd day 87 ± 1.2 79 ± 1.3 < 0.001
29th day 91 ± 1.4 82 ± 1.4 < 0.001
36th day (discharged) 95 ± 1.2 86 ± 1.2 < 0.001
W/Ac (n = 29) (n = 28)
On admission day 50.3 ± 1.61 47.6 ± 1.60 NR
Eighth day 52.5 ± 1.44 49.9 ± 1.44 NR
15th day (zinc started) 58.1 ± 1.53 52.3 ± 1.60 < 0.05
22nd day 62.0 ± 1.57 55.2 ± 1.75 < 0.01
29th day 64.8 ± 1.58 57.1 ± 1.85 < 0.01
36th day (discharged) 68.1 ± 1.58 59.7 ± 1.77 < 0.001
Per cent of patients with W/H according to the Harvard standard on discharge (36th day), n (%)
(n = 30) (n = 30)
< 80 0 (0) 5 (16.7) NR
80–90 7 (23.3) 18 (60.0) NR
≥ 90 23 (76.6) 7 (23.3) < 0.001
260 Appendix 12
Comments: results were reported as mean ± sem
Reports no significant difference in energy intake between groups during the total treatment period. The authors also report that weight gain was the same in both sexes; an increase in appetite following zinc supplementation was not observed, and supplemental zinc did not increase energy intake (both groups had a mean energy intake of 200 kcal/kg/day)
Safety: NR
HIV: NR
Barriers to implementation
NR
Methodological comments
Allocation to treatment groups: children were randomly selected during recovery at the Children’s Nutrition Unit and were alternately allocated to the treatment or the control group
Blinding: NR. Assumed patients, care providers nor outcome assessors were blinded
Comparability of treatment groups: the supplemented group contained more cases of kwashiorkor (13 out of 30) compared with the unsupplemented controls (9 out of 30), but the difference was not significant. The age distributions, the prevalence of infections and the H/A on admission was similar in both groups (p-values NR)
Method of data analysis: Student’s t-test and chi-squared test were used for statistical interpretation of data. A p-value of < 0.05 was accepted as significant. ITT analysis for all outcomes except W/A
Sample size/power calculation: NR
Attrition/dropout: NR, but appear to be none
General comments
Generalisability: the authors refer to the paper by Waterlow (1976) to define SAM.101 However, it is not clear which were the criteria considered. According to the reported W/H on admission data, on average, participants just meet the WHO criteria (W/H < 70%). All children were diagnosed either kwashiorkor or marasmic kwashiorkor. Participants also met the Gómez severe third-degree malnutrition on admission (W/A < 60%)
The age range was 5–60 months, although the majority of participants were 12–48 months
A subsection of the population admitted to the Children’s Nutrition Unit was randomly selected during recovery from SAM
Outcome measures: the outcome measures were appropriate. However, the impact of the intervention on mortality nor its adverse effects were reported
Intercentre variability: not applicable
Conflict of interest: NR
Recovery diets
Aimed to achieve a calorie intake of 100–120 kcal/kg/day in the first week, and thereafter 150–200 kcal/kg/day with approximately 2.5 g protein/kg/day; consisted of dried skimmed milk reconstituted with oil and sugar (100 kcal/100 ml), initially given 2-hourly day and night. Given 90–100 ml/kg/day during the first week and increased gradually to 120–250 ml/kg/day in four to six feeds a day
Solid cooked meals were offered from the first week; some children refused it initially, but within a few days solid diets were taken
Solid diets
Rice pudding or Suji (68 kcal/100 g) at 0800 hours; rice + vegetable + meat (beef) mixture (100 kcal/100 g) at 1200 hours; rolls or chapatti (60 kcal/100 g) at 1500 hours and rice + dal (100 kcal/100 g) at 1800 hours
All children received supplements of vitamins (Pharmavit), oral iron [4 mg Fe/kg/day as iron sulphate (FeSO4)] and vitamin A capsules
(100,000–200,000 IU)
The zinc content of individual food items ranged from 1.5–7 p.p.m.
IU, international units; NR, not reported; NS, not statistically significant; p.p.m., parts per million; sem, standard error of the mean.a Percentage calculated by the reviewer.b Plasma zinc concentration of healthy controls are reported, but have not been data extracted.c As a percentage of the Harvard reference.

© Queen’s Printer and Controller of HMSO 2012. This work was produced by Picot et al. under the terms of a commissioning contract issued by the Secretary of State for Health.
261 Health Technology Assessment 2012; Vol. 16: No. 19DOI: 10.3310/hta16190
Quality assessment for primary studies (modified for severe malnutrition)
A. Selection bias
1. Are the individuals selected to participate in the study likely to be representative of the target population?
Very likely Somewhat likely Not likely Cannot tell
2. What percentage of selected individuals participated? 80–100% 60–79% < 60% N/A Cannot tell
Summary of selection bias
(Methodological strength of study)
Strong Moderate Weak
B. Study design
1. What was the study design?
(Please tick appropriate and specify design if categorise as ‘Other’)
RCT
CCT
Cohort analytic (two group pre + post)
Case–control
Cohort [one group pre + post (before and after)]
Interrupted time series
Other – specify
Cannot Tell
2. Was the study described as randomised? Yes No
If answer to no. 2 is ‘no’ complete summary then go to section C. Confounders. If answer is ‘yes’, answer no. 3 and no. 4 below, before completing summary for this section
3. If answer was yes, was the method of randomisation described?
Yes No
4. If answer was yes, was the method appropriate? Yes No
Summary of study design
(Methodological strength of study)
Strong Moderate Weak
C. Confounders
1. Were there important differences between groups prior to the intervention?
Yes No Cannot tell
2. If yes, indicate the percentage of relevant confounders that were controlled [either in the design (e.g. by stratification or matching) or in the analysis]?
80–100% 60–79% < 60% Cannot tell
Summary of confounders
(Methodological strength of study)
Strong Moderate Weak
D. Blinding
1. Was the outcome assessor aware of the intervention or exposure status of participants?
Yes No Cannot tell
2. Were the study participants aware of the research question?
Yes No Cannot tell
Summary of blinding
(Methodological strength of study)
Strong Moderate Weak

262 Appendix 12
E. Data collection methods
1. Were data collection tools shown to be valid? Yes No Cannot tell a
2. Were data collection tools shown to be reliable? Yes No Cannot tell
Summary of data collection
(Methodological strength of study)
Strong Moderate Weak b
F. Withdrawals and dropouts
1. Were withdrawals and dropouts reported in terms of numbers and reasons per group?
Yes No Cannot tell
2. Indicate the percentage of participants completing the study (If the percentage differs by groups, record the lowest)
80–100% 60–79% < 60% Cannot tell
Summary of withdrawals and dropouts
(Methodological strength of study)
Strong Moderate Weak
G. Intervention integrity
1. What percentage of participants received the allocated intervention or exposure of interest?
80–100% 60–79% < 60% Cannot tell
2. Was the consistency of the intervention measured? Yes No Cannot tell
3. Is it likely that subjects received an unintended intervention (contamination or co-intervention) that may influence the results?
Yes No Cannot tell
H. Analysis
1. Indicate the unit of allocation Community Organisation/institution
Practice/office
Provider Patient
2. Indicate the unit of analysis Community Organisation/institution
Practice/office
Provider Patient
3. Are the statistical methods appropriate for the study design?
Yes No Cannot tell
4. Is the analysis performed by intervention allocation status (i.e. ITT) rather than actual intervention received?
Yes No Cannot tell
Global rating for studyc
(Overall methodological strength of study – based on sections A–F)
Strong Moderate Weak d
N/A, not applicable.a ‘Yes’ for zinc status, ‘cannot tell’ for weight.b ‘Moderate’ for zinc status, ‘weak’ for weight.c Strong = four strong ratings with no weak ratings; moderate = one weak rating; weak = two or more weak ratings.d ‘Moderate’ if scoring using zinc (which is related to weight gain), ‘weak’ if scoring using weight gain. As our primary outcome of interest is
weight gain, overall score is ‘weak’.
© Queen’s Printer and Controller of HMSO 2012. This work was produced by Picot et al. under the terms of a commissioning contract issued by the Secretary of State for Health.
263 Health Technology Assessment 2012; Vol. 16: No. 19DOI: 10.3310/hta16190
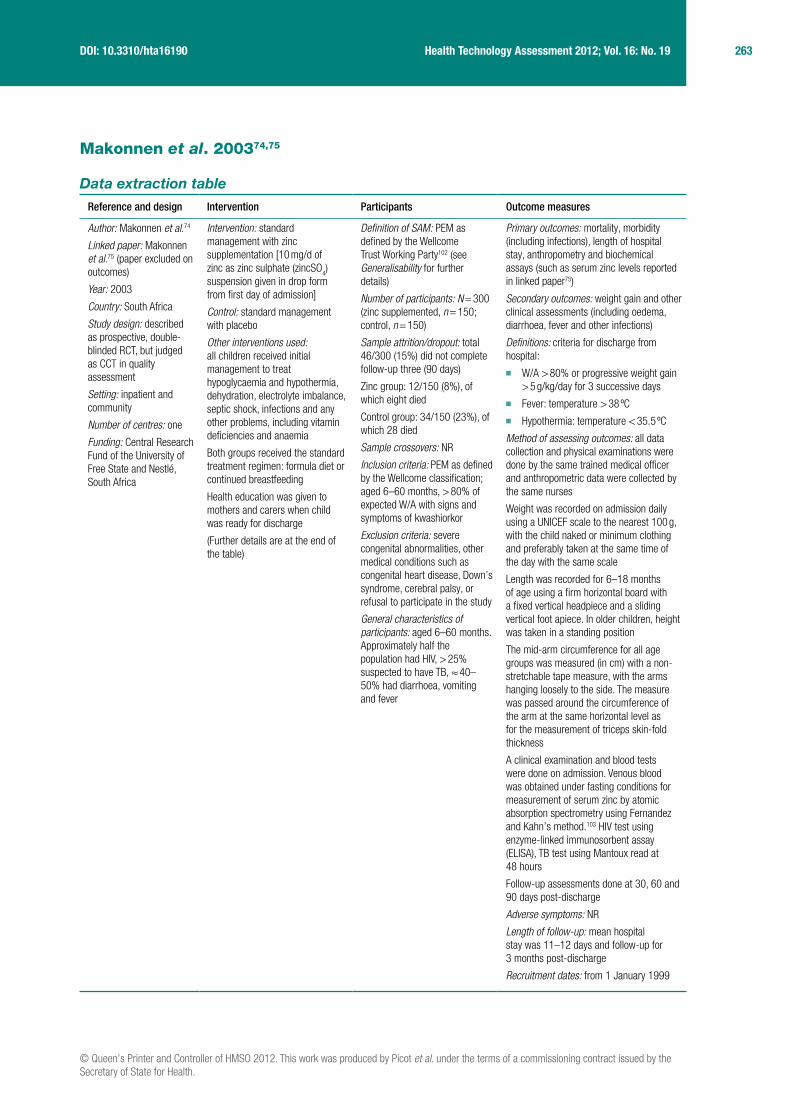
Makonnen et al. 200374,75
Data extraction table
Reference and design Intervention Participants Outcome measures
Author: Makonnen et al.74
Linked paper: Makonnen et al.75 (paper excluded on outcomes)
Year: 2003
Country: South Africa
Study design: described as prospective, double-blinded RCT, but judged as CCT in quality assessment
Setting: inpatient and community
Number of centres: one
Funding: Central Research Fund of the University of Free State and Nestlé, South Africa
Intervention: standard management with zinc supplementation [10 mg/d of zinc as zinc sulphate (zincSO
4)
suspension given in drop form from first day of admission]
Control: standard management with placebo
Other interventions used: all children received initial management to treat hypoglycaemia and hypothermia, dehydration, electrolyte imbalance, septic shock, infections and any other problems, including vitamin deficiencies and anaemia
Both groups received the standard treatment regimen: formula diet or continued breastfeeding
Health education was given to mothers and carers when child was ready for discharge
(Further details are at the end of the table)
Definition of SAM: PEM as defined by the Wellcome Trust Working Party102 (see Generalisability for further details)
Number of participants: N = 300 (zinc supplemented, n = 150; control, n = 150)
Sample attrition/dropout: total 46/300 (15%) did not complete follow-up three (90 days)
Zinc group: 12/150 (8%), of which eight died
Control group: 34/150 (23%), of which 28 died
Sample crossovers: NR
Inclusion criteria: PEM as defined by the Wellcome classification; aged 6–60 months, > 80% of expected W/A with signs and symptoms of kwashiorkor
Exclusion criteria: severe congenital abnormalities, other medical conditions such as congenital heart disease, Down’s syndrome, cerebral palsy, or refusal to participate in the study
General characteristics of participants: aged 6–60 months. Approximately half the population had HIV, > 25% suspected to have TB, ≈ 40–50% had diarrhoea, vomiting and fever
Primary outcomes: mortality, morbidity (including infections), length of hospital stay, anthropometry and biochemical assays (such as serum zinc levels reported in linked paper75)
Secondary outcomes: weight gain and other clinical assessments (including oedema, diarrhoea, fever and other infections)
Definitions: criteria for discharge from hospital:
■ W/A > 80% or progressive weight gain > 5 g/kg/day for 3 successive days
■ Fever: temperature > 38 ºC ■ Hypothermia: temperature < 35.5 ºC
Method of assessing outcomes: all data collection and physical examinations were done by the same trained medical officer and anthropometric data were collected by the same nurses
Weight was recorded on admission daily using a UNICEF scale to the nearest 100 g, with the child naked or minimum clothing and preferably taken at the same time of the day with the same scale
Length was recorded for 6–18 months of age using a firm horizontal board with a fixed vertical headpiece and a sliding vertical foot apiece. In older children, height was taken in a standing position
The mid-arm circumference for all age groups was measured (in cm) with a non-stretchable tape measure, with the arms hanging loosely to the side. The measure was passed around the circumference of the arm at the same horizontal level as for the measurement of triceps skin-fold thickness
A clinical examination and blood tests were done on admission. Venous blood was obtained under fasting conditions for measurement of serum zinc by atomic absorption spectrometry using Fernandez and Kahn’s method.103 HIV test using enzyme-linked immunosorbent assay (ELISA), TB test using Mantoux read at 48 hours
Follow-up assessments done at 30, 60 and 90 days post-discharge
Adverse symptoms: NR
Length of follow-up: mean hospital stay was 11–12 days and follow-up for 3 months post-discharge
Recruitment dates: from 1 January 1999

264 Appendix 12
Characteristics of participants
Characteristic Zinc supplemented (n = 150)Control (non-zinc supplemented) (n = 150) p-value
Male, % 48.7 50.7 NR
Aged 12–23 months, % 41 52 NR
Morbidity, n (%)
Poor appetite 89 (59.3) 70 (46.7) NR
Swelling of body 95 (63.3) 78 (52.0) NR
Diarrhoea 72 (48.0) 67 (44.7) NR
Vomiting 77 (51.3) 83 (55.3) NR
Cough 55 (36.7) 57 (38.0) NR
Fever 82 (54.7) 59 (39.3) NR
Loss of weight 118 (78.7) 114 (76.0) NR
Oral lesions 125 (83.3) 121 (80.7) NR
Per cent of expected W/A on admission, n (%)
< 60% 56 (37.3) 54 (36.0) NR
60–80% 81 (54.0) 77 (51.3) NR
> 80% with oedemaa 12 (8) 18 (12) NR
> 80% without oedema 1 (0.7) 1 (0.7) NR
Mid-arm circumference lower than fifth percentile, n (%)
96 (90.6) 105 (87.5) NR
Weight on admission, mean ± SD
7.2 ± 2.0 7.5 ± 2.4 NR
Height on admission, mean ± SD
72.2 ± 8.2 72.7 ± 8.6 NR
Mid-arm circumference, mean ± SD
11.8 ± 1.6 11.9 ± 1.8 NR
HIV+ve, % 44.7 52 NR
Serum zinc (μmol/l), mean ± SDb
6.23 ± 1.83 6.25 ± 1.74 NR; 95% CI for difference –0.43 to – 0.39
Comments: the percentage of children with weight > 80% of expected weight on admission was 8.7% in the zinc group and 12.7% in the control group. These differences were not statistically significant. More than 98% of participants in both groups with PEM were admitted for the first time. The majority were < 2 years of age
The number and percentage of participants from rural areas, orphans and breastfed for ≥ 12 months, as well as the past medical history of subjects and controls on admission were reported, but have not been data extracted

© Queen’s Printer and Controller of HMSO 2012. This work was produced by Picot et al. under the terms of a commissioning contract issued by the Secretary of State for Health.
265 Health Technology Assessment 2012; Vol. 16: No. 19DOI: 10.3310/hta16190
Results
Primary outcomes Zinc supplemented (n = 150)Control (non-zinc supplemented) (n = 150) Difference (95% CI)
Discharged after hospitalisation, %
92.7 80c NR
Death after hospitalisation, n (%)
7 (4.7) 26 (17.3) NRd
Death after readmission, n 1 2 NR
Total deaths, n (%)e 8 (5.3) 28 (18.7) NR
Morbidity on follow-up (90 days), n (%)
n = 138, 85–95 daysf n = 116, 83–95 daysf 95% CI for difference
Diarrhoea 4 (2.9) 31 (36.7) –32 to –15.0
Vomiting 1 (0.7) 8 (6.9) –11.2 to –1.2
Fever 4 (2.9) 12 (10.3) –13.8 to –1.1
Oedema 0 (0) 0 (0) –2.0 to 1.2
Acute respiratory infections
4 (2.9) 45 (38.8) –44.7 to –26.2
Skin infection 1 (0.7) 8 (6.9) –11.2 to –1.2
Pallor 32 (23.2) 62 (53.4) –41.3 to –18.4
Anthropometry on discharge
n = 139 n = 120
W/A, n (%)
< 60% 44 (31.7) 30 (25) –4.4 to 17.4
60–80% 78 (56.1) 74 (61.7) NR
> 80% without oedemab 17 (12.2) 16 (13.3) NR
Mid-arm circumference percentiles lower than fifth percentile, n (%)
92 (92.9) 82 (85.4) –1.3 to 16.1
Anthropometry on follow-up (90 days)
n = 138 n = 116
W/A, n (%)
< 60% 5 (3.6%) 16 (13.8) –17.2 to –3.1
60–80% 52 (37.7%) 67 (57.8) NR
> 80% without oedema 81 (58.7%) 33 (28.4) NRs
Mid-arm circumference percentiles lower than fifth percentile, n (%)
66 (54.1) 81 (77.9) –35.2 to –11.5
Length of hospital stay, mean ± SD
10.9 ± 3.9 11.7 ± 5.9 NR; not statistically significant
Serum zinc at 90 days follow-up (μmol/l), mean ± SDh
10.13 ± 2.93 7.84 ± 1.72 95% CI for difference 1.68 to 2.90
Comments: p-values were NR
Data were presented for morbidities during the first 3 weeks of hospitalisation (no morbidity, poor appetite, oedema, diarrhoea, vomiting, cough, fever, weight loss, and oral lesions). The paper reports a general trend for the zinc-supplemented group to recover more rapidly, though it is not true for all symptoms, nor were there any statistically significant differences over the first 3 weeks
Data also presented for morbidities at 30-day and 60-day follow-up, but these have not been data extracted
Although length was measured at discharge and every follow-up visit, these results were clearly inaccurate and therefore omitted
Results for biochemical assays (additional primary outcomes) were reported on linked paper,75 from which only serum zinc at 90 days has been extracted
Gastroenteritis was an important diagnosis in both groups, but showed regression during hospitalisation (78% in both groups in first week, 30.4% and 37.4% in zinc and control groups in second week, respectively)
The authors mention further monitoring and evaluation being carried out for secondary outcomes, but results for these were NR

266 Appendix 12
Safety: NR
HIV: six out of seven (85.7%) children in the zinc group and 15 out of 26 (57.7%) children in the control group, who died in the hospital before discharge, were diagnosed to be HIV+ve. All of them had clinical evidence of HIV-related disease. According to the authors, these data suggest that even if the contribution to the death rate caused by possible HIV disease is eliminated, significantly more children in the control group died during hospitalisation than in the supplemented group
TB: TB distribution and related findings for both groups were very similar and would not have been a confounding variable for differences in outcome
Barriers to implementation
NR
Methodological comments
Allocation to treatment groups: children were randomly assigned to one of two treatment regimens. Randomisation was stratified by sex, age and percentage of expected W/A. If children were > 80% of expected weight, but had all the clinical features of PEM (kwashiorkor), they were randomised according to the list for 60–80%. No details of the randomisation method used were provided
Blinding: double-blinded study. For the non-zinc group, placebo was presented in a similar bottle and colour with similar taste and smell, so that medical personnel and parents could not differentiate between the zinc sulphate and placebo. No details on whether or not outcome assessors were aware of groups
Comparability of treatment groups: the demography of the subjects and controls was similar. Reports that the zinc group might have had a more severe disease profile on admission as more children in this group presented with a history of oedema and fever (table 2), but opposite is shown in table 3. The distribution of symptoms, anthropometry and past medical history was quite similar and comparable in both groups. No p-values were reported
Method of data analysis: an ITT analysis was not performed. The two groups were compared with respect to the outcome measures using 95% CIs for the differences in percentages or means. Characteristics were summarised per group by frequencies and percentages (for categorical variables) and means, SDs, medians, minima and maxima (for numerical variables). Anthropometric analyses were done using Epi-Info. Arm circumferences were categorised into percentiles according to tables provided by Frisancho.104 All other analyses were done using Statistical Analysis System software (SAS Institute Inc, Cary, NC). Duration of breastfeeding was analysed using survival analysis. To compare children within a treatment group who survived with those who died, 95% CI for differences in medians were calculated, because of small group size and skewed distribution
Sample size/power calculation: the decision to include 150 children in each group was derived after analysis of the data of a pilot study, which included 60 children with PEM and 60 similar children in the control group
Attrition/dropout: in the zinc group, 150 children were entered, of which four (2.7%) absconded and seven (4.7%) died before discharge. One child was readmitted after 5 days discharge from hospital and therefore not assessed at follow-up one (30 days), but the four children who absconded did attend the first follow-up visit. Therefore, 142 supplemented children were assessed at follow-up one. One of these was readmitted at follow-up one and subsequently died, leaving 141 at follow-up two (60 days). At follow-up three (90 days), three children could not be traced and 138 were assessed. In the control group, of the 150 children that entered, four (2.7%) absconded and 26 (17.3%) died before discharge. Three children were readmitted, of which one died and two were discharged. At follow-up one, 121 children were assessed. The four children who absconded did attend the first follow-up visit. One child was readmitted and died. One did not turn up for assessment. One hundred and nineteen children were assessed at follow-up two. At follow-up three, three children could not be traced and 116 were assessed
In the two groups, the percentage of children who absconded was similar (2.7%). These eight children were all traced, attended the first follow-up, and it was decided to keep them in the study and their data analysed with the rest
General comments:
Generalisability: malnutrition is defined according to the Wellcome classification as a reduction in the expected body weight < 80% (of the Boston 50th percentile). Between 60% and 80% of expected weight is underweight in the absence of oedema, and kwashiorkor if oedema is present; < 60% of expected weight is marasmus in the absence of oedema, and marasmic kwashiorkor if oedema is present. It is not clear whether or not participants meet the WHO criteria for SAM. The majority of participants had 60–80% W/A on admission using the Wellcome classification, and the majority had MUAC lower than fifth percentile
Outcome measures: outcome measures such as W/A, mortality and morbidity were appropriate. However, outcomes as weight gain and adverse effects of the intervention were NR
Intercentre variability: not applicable
Conflict of interest: NR

© Queen’s Printer and Controller of HMSO 2012. This work was produced by Picot et al. under the terms of a commissioning contract issued by the Secretary of State for Health.
267 Health Technology Assessment 2012; Vol. 16: No. 19DOI: 10.3310/hta16190
Initial treatment began with admission to the hospital and lasted for about 7 days. Its principal aims were to treat or prevent hypoglycaemia, hypothermia, dehydration and electrolyte imbalance; treat septic shock; start feeding the child; treat infections; identify and treat any other problems, including vitamin deficiencies and manage severe anaemia and heart failure
RL (20 ml/kg/hour) was given intravenously for severe dehydration or septic shock
Most dehydrated children of both groups received ORS through a nasogastric tube. Children were reassessed every hour and rehydration stopped when the child was clinically rehydrated. ORS was continued until diarrhoea stopped or decreased significantly
Standard treatment regimen: the treatment of the intervention and control groups was identical, with the exception of the addition of zinc in the management of the supplemented group. To avoid overloading of the intestine, liver and kidneys, small frequent amounts of food were given (50–100 ml every 4 hours). Children who were unable or unwilling to eat were fed by nasogastric tube as a temporary measure. Patients who did not require other emergency treatment (especially for dehydration or septic shock) were given formula diet (Disco-dried skimmed milk-sugar-oil mixture (DSM): 80 g DSM + 60 g oil + 50 g sugar + water up to 1000 ml) or continued breastfeeding in both the study and control group
The rehabilitation phase began at about the second week of admission and lasted around 6 weeks. A child entered the rehabilitation phase when his/her appetite returned. The principal aims during this phase were to encourage the child to eat healthily, stimulate physical and emotional development and prepare the mother or caregivers to continue caring for the child after discharge
Health education was given to mothers and carers on nutrition, care (e.g. feeding and nutrition), how to recognise the symptoms and signs of illness, when to seek medical assistance, home treatment for diarrhoea, fever and acute respiratory infections
Children were followed up at the hospital at 30, 60 and 90 days after discharge. The aims of this stage were to increase feeding appropriately, monitor weight gain and mid-arm circumference, monitor the physical well-being and mental and emotional development of the child and determine their serum zinc levels
NR, not reported.a The clinical impression of kwashiorkor was confirmed in that all these children had an admission serum albumin < 30 g/l.b Reported in linked paper;74 median, minimum and maximum values were reported as well, but have not been data extracted.c Reported as 80.7% in text but 120/150 = 80% according to study’s Table 1.d Significantly more children died by the end of hospitalisation in the control group than the zinc-supplemented group (reported as 95% CI 5.5
vs 19.5 in text, but not clear what this CI refers to).e Calculated by the reviewer.f Time elapsed from discharge to third follow-up.g Reports in text that this difference is statistically significant but no p-value or CI is provided.h Most children likely to have been discharged based on progressive weight gain of > 5 g/kg/day (rather than having W/A > 80%) as proportion
with W/A > 80% on discharge is relatively small.

268 Appendix 12
Quality assessment for primary studies (modified for severe malnutrition)
A. Selection bias
1. Are the individuals selected to participate in the study likely to be representative of the target population?
Very likely Somewhat likely Not likely Cannot tell
2. What percentage of selected individuals participated? 80–100% 60–79% < 60% N/A Cannot tell
Summary of selection bias
(Methodological strength of study)
Strong Moderate Weak
B. Study design
1. What was the study design?
(Please tick appropriate and specify design if categorise as ‘Other’)
RCT
CCT
Cohort analytic (two group pre + post)
Case–control
Cohort [one group pre + post (before and after)]
Interrupted time series
Other – specify
Cannot Tell
2. Was the study described as randomised? Yes No
If answer to no. 2 is ‘no’ complete summary then go to section C. Confounders. If answer is ‘yes’, answer no. 3 and no. 4 below, before completing summary for this section
3. If answer was yes, was the method of randomisation described?
Yes No
4. If answer was yes, was the method appropriate? Yes No
Summary of study design
(Methodological strength of study)
Strong Moderate Weak
C. Confounders
1. Were there important differences between groups prior to the intervention?
Yes No Cannot tell
2. If yes, indicate the percentage of relevant confounders that were controlled [either in the design (e.g. by stratification or matching) or in the analysis]?
80–100% 60–79% < 60% Cannot tell
Summary of confounders
(Methodological strength of study)
Strong Moderate Weak
D. Blinding
1. Was the outcome assessor aware of the intervention or exposure status of participants?
Yes No Cannot tell
2. Were the study participants aware of the research question?
Yes No Cannot tell
Summary of blinding
(Methodological strength of study)
Strong Moderate Weak

© Queen’s Printer and Controller of HMSO 2012. This work was produced by Picot et al. under the terms of a commissioning contract issued by the Secretary of State for Health.
269 Health Technology Assessment 2012; Vol. 16: No. 19DOI: 10.3310/hta16190
E. Data collection methods
1. Were data collection tools shown to be valid? Yes No Cannot tell
2. Were data collection tools shown to be reliable? Yes No Cannot tell
Summary of data collection
(Methodological strength of study)
Strong Moderate Weak
F. Withdrawals and dropouts
1. Were withdrawals and dropouts reported in terms of numbers and reasons per group?
Yes No Cannot tell
2. Indicate the percentage of participants completing the study (If the percentage differs by groups, record the lowest)
80–100% 60–79% < 60% Cannot tell
Summary of withdrawals and dropouts
(Methodological strength of study)
Strong Moderate Weak
G. Intervention integrity
1. What percentage of participants received the allocated intervention or exposure of interest?
80–100% 60–79% < 60% Cannot tell
2. Was the consistency of the intervention measured? Yes No Cannot tell
3. Is it likely that subjects received an unintended intervention (contamination or co-intervention) that may influence the results?
Yes No Cannot tell
H. Analysis
1. Indicate the unit of allocation Community Organisation/institution
Practice/office
Provider Patient
2. Indicate the unit of analysis Community Organisation/institution
Practice/office
Provider Patient
3. Are the statistical methods appropriate for the study design?
Yes No Cannot tell
4. Is the analysis performed by intervention allocation status (i.e. ITT) rather than actual intervention received?
Yes No Cannot tell
Global rating for studya
(Overall methodological strength of study – based on sections A–F)
Strong Moderate Weak
N/A, not applicable.a Strong = four strong ratings with no weak ratings; moderate = one weak rating; weak = two or more weak ratings.

270 Appendix 12
Schlesinger et al. 199276
Data extraction table
Reference and design Intervention Participants Outcome measures
Author: Schlesinger et al.76
Year: 1992
Country: Chile
Study design: double-blind CCT
Setting: inpatient, tertiary care (closed nutritional recovery centre)
Number of centres: one
Funding: Nestlé Nutrition Research Grant Programme
Intervention: zinc-supplemented formula (zinc 15 mg/l), ad libitum, for 105 days
Control: standard infant formula (zinc 3.2 mg/l), ad libitum, for 105 days
Both formulas based on full-fat powered cow’s milk fortified with vitamins and minerals as per standard infant formula (Nestlé, Switzerland) except for iron and zinc (see end of table for further details). The formulas differed only in zinc content, which was 3.2 mg/l in the standard formula. No other energy-containing supplements were given to either group
Other interventions used: none reported
Definition of SAM: not specifically stated, but mean NCHS WAZ were < 3 SD on admission
Number of participants: N = 39 (zinc supplemented, n = 19; control, n = 20)
Sample attrition/dropout: none reported
Sample crossovers: none
Inclusion criteria: only reports marasmic infants with SAM
Exclusion criteria: NR
General characteristics of participants: SAM infants (< 1 year)
Primary outcomes: not specifically stated
Outcomes were:
■ zinc status ■ trace element status ■ nutritional status (HAZ, WAZ and WHZ z-scores) ■ immune function
Method of assessing outcomes: anthropometric measurements performed by a registered nurse on admission and at 15-day intervals. Intake was determined by weighing each bottle before and after feeding. Nude weights obtained before first morning feed with an infant scale (Condor, Santiago, Chile) with a 5-g precision, calibrated at regular intervals. Lengths to nearest 0.1 cm determined by standard procedures with a portable infantometer. Weight and length measurements assessed using NCHS growth percentile curves. z-scores calculated with the PCTL9Z Anthropometry Subroutine (US Centre for Health Promotion and Education, National Centre for Disease Control, Atlanta, GA, USA)
Plasma and polymorphonuclear leucocyte zinc concentrations determined using atomic absorption spectrophotometry. Polymorphonuclear leucocytes were isolated by dextran sedimentation and Ficoll Hypaque-gradient centrifugation. Iron nutrition assessed on admission and after 60 and 105 days by haemoglobin with the cyanomethemoglobin method (Coulter Counter ZBI, Fl, USA) and by serum ferritin with a radioimmunoassay (Travenol, Massachusetts). Serum copper concentrations determined by atomic absorption spectrophotometry on admission and after 30, 60 and 105 days
Detailed methodology is reported for assessment of the immunological profile but is not extracted here
Signs and symptoms of morbidity were recorded daily on a chart by the attending physician. Every infectious episode was analysed using: mean episodes/infant, mean duration days of each episode/infant, and mean per cent of infected days in the 105 days: [(number days with infection/number observed days) × 100]
Adverse symptoms:
■ upper and lower respiratory infection ■ otitis media ■ acute diarrhoeal episode (presence of liquid
stools for > 12 hours) ■ skin and mucous candidiasis ■ purulent conjuctivitis
Length of follow-up: nothing further than the 105 days of nutritional rehabilitation treatment
Recruitment dates: NR
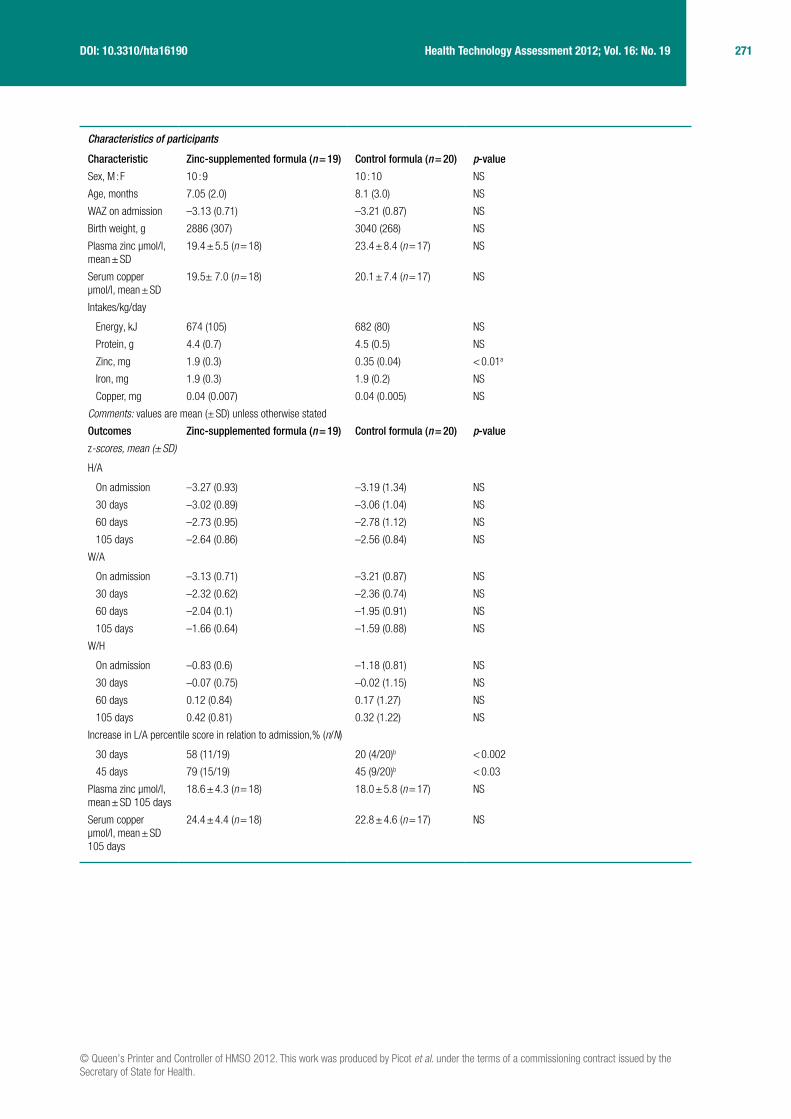
© Queen’s Printer and Controller of HMSO 2012. This work was produced by Picot et al. under the terms of a commissioning contract issued by the Secretary of State for Health.
271 Health Technology Assessment 2012; Vol. 16: No. 19DOI: 10.3310/hta16190
Characteristics of participants
Characteristic Zinc-supplemented formula (n = 19) Control formula (n = 20) p-value
Sex, M : F 10 : 9 10 : 10 NS
Age, months 7.05 (2.0) 8.1 (3.0) NS
WAZ on admission –3.13 (0.71) –3.21 (0.87) NS
Birth weight, g 2886 (307) 3040 (268) NS
Plasma zinc μmol/l, mean ± SD
19.4 ± 5.5 (n = 18) 23.4 ± 8.4 (n = 17) NS
Serum copper μmol/l, mean ± SD
19.5± 7.0 (n = 18) 20.1 ± 7.4 (n = 17) NS
Intakes/kg/day
Energy, kJ 674 (105) 682 (80) NS
Protein, g 4.4 (0.7) 4.5 (0.5) NS
Zinc, mg 1.9 (0.3) 0.35 (0.04) < 0.01a
Iron, mg 1.9 (0.3) 1.9 (0.2) NS
Copper, mg 0.04 (0.007) 0.04 (0.005) NS
Comments: values are mean (± SD) unless otherwise stated
Outcomes Zinc-supplemented formula (n = 19) Control formula (n = 20) p-value
z-scores, mean (± SD)
H/A
On admission –3.27 (0.93) –3.19 (1.34) NS
30 days –3.02 (0.89) –3.06 (1.04) NS
60 days –2.73 (0.95) –2.78 (1.12) NS
105 days –2.64 (0.86) –2.56 (0.84) NS
W/A
On admission –3.13 (0.71) –3.21 (0.87) NS
30 days –2.32 (0.62) –2.36 (0.74) NS
60 days –2.04 (0.1) –1.95 (0.91) NS
105 days –1.66 (0.64) –1.59 (0.88) NS
W/H
On admission –0.83 (0.6) –1.18 (0.81) NS
30 days –0.07 (0.75) –0.02 (1.15) NS
60 days 0.12 (0.84) 0.17 (1.27) NS
105 days 0.42 (0.81) 0.32 (1.22) NS
Increase in L/A percentile score in relation to admission,% (n/N)
30 days 58 (11/19) 20 (4/20)b < 0.002
45 days 79 (15/19) 45 (9/20)b < 0.03
Plasma zinc μmol/l, mean ± SD 105 days
18.6 ± 4.3 (n = 18) 18.0 ± 5.8 (n = 17) NS
Serum copper μmol/l, mean ± SD 105 days
24.4 ± 4.4 (n = 18) 22.8 ± 4.6 (n = 17) NS

272 Appendix 12
Comments: plasma zinc and serum copper concentrations at 30 and 60 days have not been data extracted. There were no significant differences between the groups
Nutritional status: ■ Data were further analysed by using the mean increment of L/A z-score at 0, 15, 30, 45, 60, 75, 90 and 105 days and presented in line graphs
for the whole group and separately for males and females (but data not extracted here as graphs are not clear). The zinc group began to grow earlier than the control group, becoming significant after 30 days (p-value unreadable), whereas the increment for the control group started to be significant at day 45 (p < 0.01)
■ Male infants in the zinc group grew significantly before control group males (p-value unreadable), but there was no difference in increment of HAZ in females
Other outcomes (micronutrients, immune function): ■ Results are reported for trace element status (Hb, serum ferritin, anaemia, etc.) and immunocompetence, but these data are NR in relation to
weight gain, z-score or mortality and therefore have not been data extracted ■ A statistically significant difference was found in the proportion of participants defined as having a low plasma zinc and this favoured the zinc-
supplemented group ■ No statistically significant differences in leucocyte zinc were found between the groups
Safety: ■ The number of otitis media episodes (mean ± SD) during the 105 days rehabilitation was 0.73 ± 0.9 vs 1.85 ± 2.3 for the zinc and control groups,
respectively (0.05 > p < 0.1, Student’s t-test) ■ The number of acute diarrhoeal episodes was average two versus zero for the zinc and control groups, respectively. A statistically significant
difference appeared when analysing the data using all three indices mentioned in Method of assessing outcomes (p-value NR). The diarrhoeal episodes lasted 1 or 2 days, exerting no impact on nutritional rehabilitation
■ No differences were observed between groups in number or duration of upper and lower respiratory infection, purulent conjunctivitis, and skin and mucous candidiasis
HIV: NR
Barriers to implementation
NR
Methodological comments
Allocation to treatment groups: not a randomised study. No details regarding allocation of treatments
Blinding: states double blind, but no further details are given as to how blinding was ensured in the patients and care providers (formula was provided in bottles). No details whether or not outcome assessors were blinded
Comparability of treatment groups: few baseline characteristics were presented; reports there were no significant differences between groups nor between males and females (though no p-values reported)
Method of data analysis: appears to be ITT analysis for z-scores (full number of patients allocated to each treatment group were analysed). The Statistical Analysis System software (SAS Institute Inc., Cary, NC, USA) was used. The paired and non-paired t-test, Cochrane Mantel–Hanzel test, Fisher’s exact probability test and stepwise logistic regression were used in the analysis of data. Significance was determined at p < 0.05
Sample size/power calculation: NR
Attrition/dropout: none reported
General comments
Generalisability: likely that most of the children would meet the current WHO criteria (mean WAZ < –3 SD). Unclear whether the children admitted to the tertiary centre were all those with SAM or a subsection. In addition, the mean age was 7–8 months on admission and, therefore, would not be generalisable to all children < 5 years
Outcome measures: outcomes were appropriate although mortality data not specifically reported (even though it appears to be zero)
Intercentre variability: N/A
Conflict of interest: funded by The Nestlé Nutrition Research Grant Program; no conflicts of interest are apparent
Composition of formula (per gram of powder)
Fat 0.26 g, protein 0.26 g, vitamin A 15.2 IU, cholecalciferol 3 IU, vitamin E 0.06 IU, vitamin C 1.5 mg, folic acid 0.45 µg, thiamine 3 µg, niacin 0.038 mg, vitamin B6 3 µg, biotin 0.11 mg, pantothenate 0.023 mg, riboflavin 4.5 µg, vitamin B12 0.011 µg, vitamin K 0.42 µg, choline 0.38 µg, inositol 0.23 mg, iodine 0.38 µg, copper 3.5 µg, iron 0.15 mg (as ferrous sulphate) and zinc 0.15 mg (as zinc chloride). Formula was prepared at 10% dilution
HAZ, weight-for-age z-score; IU, international units; L/A, length-for-age; NR, not reported; NS, not statistically significant; WAZ, weight-for-age z-score; WHZ, weight-for-height z-score.a Student’s t-test, reports p < 0.01 in table but p < 0.001 in text.b Differences between groups tested using Cochrane Mantel–Hanzel test.

© Queen’s Printer and Controller of HMSO 2012. This work was produced by Picot et al. under the terms of a commissioning contract issued by the Secretary of State for Health.
273 Health Technology Assessment 2012; Vol. 16: No. 19DOI: 10.3310/hta16190
Quality assessment for primary studies (modified for severe malnutrition)
A. Selection bias
1. Are the individuals selected to participate in the study likely to be representative of the target population?
Very likely Somewhat likely Not likely Cannot tell
2. What percentage of selected individuals participated? 80–100% 60–79% < 60% N/A Cannot tell
Summary of selection bias
(Methodological strength of study)
Strong Moderate Weak
B. Study design
1. What was the study design?
(Please tick appropriate and specify design if categorise as ‘Other’)
RCT
CCT
Cohort analytic (two group pre + post)
Case–control
Cohort [one group pre + post (before and after)]
Interrupted time series
Other – specify
Cannot Tell
2. Was the study described as randomised? Yes No
If answer to no. 2 is ‘no’ complete summary then go to section C. Confounders. If answer is ‘yes’, answer no. 3 and no. 4 below, before completing summary for this section
3. If answer was yes, was the method of randomisation described?
Yes No
4. If answer was yes, was the method appropriate? Yes No
Summary of study design
(Methodological strength of study)
Strong Moderate Weak
C. Confounders
1. Were there important differences between groups prior to the intervention?
Yes No Cannot tell
2. If yes, indicate the percentage of relevant confounders that were controlled [either in the design (e.g. by stratification or matching) or in the analysis]?
80–100% 60–79% < 60% Cannot tell
Summary of confounders
(Methodological strength of study)
Strong Moderate Weak
D. Blinding
1. Was the outcome assessor aware of the intervention or exposure status of participants?
Yes No Cannot tell
2. Were the study participants aware of the research question?
Yes No Cannot tell
Summary of blinding
(Methodological strength of study)
Strong Moderate Weak
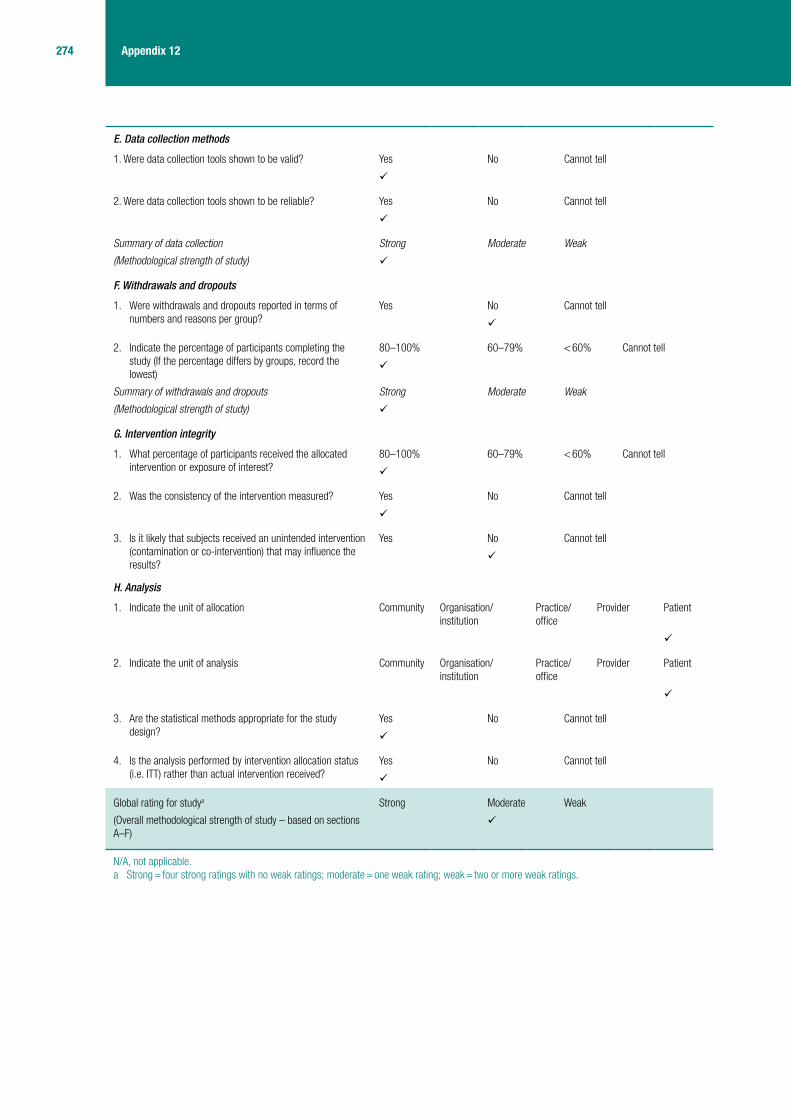
274 Appendix 12
E. Data collection methods
1. Were data collection tools shown to be valid? Yes No Cannot tell
2. Were data collection tools shown to be reliable? Yes No Cannot tell
Summary of data collection
(Methodological strength of study)
Strong Moderate Weak
F. Withdrawals and dropouts
1. Were withdrawals and dropouts reported in terms of numbers and reasons per group?
Yes No Cannot tell
2. Indicate the percentage of participants completing the study (If the percentage differs by groups, record the lowest)
80–100% 60–79% < 60% Cannot tell
Summary of withdrawals and dropouts
(Methodological strength of study)
Strong Moderate Weak
G. Intervention integrity
1. What percentage of participants received the allocated intervention or exposure of interest?
80–100% 60–79% < 60% Cannot tell
2. Was the consistency of the intervention measured? Yes No Cannot tell
3. Is it likely that subjects received an unintended intervention (contamination or co-intervention) that may influence the results?
Yes No Cannot tell
H. Analysis
1. Indicate the unit of allocation Community Organisation/institution
Practice/office
Provider Patient
2. Indicate the unit of analysis Community Organisation/institution
Practice/office
Provider Patient
3. Are the statistical methods appropriate for the study design?
Yes No Cannot tell
4. Is the analysis performed by intervention allocation status (i.e. ITT) rather than actual intervention received?
Yes No Cannot tell
Global rating for studya
(Overall methodological strength of study – based on sections A–F)
Strong Moderate Weak
N/A, not applicable.a Strong = four strong ratings with no weak ratings; moderate = one weak rating; weak = two or more weak ratings.

© Queen’s Printer and Controller of HMSO 2012. This work was produced by Picot et al. under the terms of a commissioning contract issued by the Secretary of State for Health.
275 Health Technology Assessment 2012; Vol. 16: No. 19DOI: 10.3310/hta16190
Simmer et al. 198877
Data extraction table
Reference and design Intervention Participants Outcome measures
Author: Simmer et al.77
Year: 1988
Country: Bangladesh
Study design: CCT
Setting: inpatient (Children’s Nutrition Unit)
Number of centres: one
Funding: Save the Children Fund (UK); Heinz Fellowship of the British Paediatric Association
Intervention: zinc supplement [50 mg of zinc as zinc sulphate (zincSO
4) daily
or 10 mg/kg daily if weight < 5 kg] for 2 weeks
Control: standard care (no zinc supplement)
Third group: well-nourished children (no details extracted here)
Children were allocated to the two groups after ≥ 3 days and usually after 7 days
Other interventions used: participants were fed milk every 2 hours (80–120 ml/kg/day increasing to 250 ml/kg/day). Weaning food was also given, consisting of rice, dal (pulses) and vegetables. Meat and bananas were often included, oil was added when more calories were required and an egg was added when serum proteins were low. A full diet (three cooked meals and four milk feeds a day) was usually tolerated by the third day. Additional vitamin A (100,000–200,000 IU/day) and ferrous sulphate (4–6 mg/kg/day) were routinely given
A play area with volunteer therapists provided some psychological stimulation for the children
Associated diseases and complications of nutritional rehabilitation, such as hypothermia, hypoglycaemia, and fluid overload, were treated promptly
TB: diagnosed and treated if at least two of the following criteria were met: history of contact, gradual wasting, fever and cough for 1 month, failure to gain weight despite adequate caloric intake, painless enlargement of cervical nodes or pneumonia that failed to respond to antibiotics
Definition of SAM: not specifically defined; the nutritional diagnosis was based on McLaren’s criteria.105 The Children’s Nutrition Unit is specifically for children with third-degree malnutrition, defined as nutritional oedema or W/A < 60% and W/H < 70% of local standards (or < 42% and 63%, respectively, of Western standards)
Number of participants: N = 25 (zinc group, n = 13; control group, n = 12)
Sample attrition/dropout: one patient was excluded from each group
Sample crossovers: none reported
Inclusion criteria: ■ 1–7 year-old children ■ absence of dehydration ■ loss of oedema ■ packed cell volume > 0.25 ■ children who had been at
Children’s Nutrition Unit for ≥ 3 days and were expected to stay for ≥ 3 weeks
Exclusion criteria: not stated
General characteristics of participants:
■ SAM children, average age ≈ 39 months
■ tuberculosis: 52% ■ pneumonia: 48% ■ clinical signs of vitamin A
deficiency: 83%
Primary outcomes: not specifically stated, but appears to be levels of zinc (plasma + polymorphonuclear) and plasma protein
Secondary outcomes: not stated, but appears to be vitamins A and E, ferritin, weight gain, calorie intake and protein intake
Method of assessing outcomes: weight and height measured on admission
Blood was collected at the beginning and, when possible, at the end of the study period for measurement of polymorphonuclear zinc and plasma levels of zinc, vitamins A and E, and ferritin
Zinc concentration was measured by flame atomic absorption spectrophotometry. Vitamin A and vitamin E were measured by high-performance liquid chromatography and ferritin levels by an 125I immunoradiometric assay
(Details on blood collection and preparation for analysis are given by the authors, but have not been extracted)
Protein and calorie intake were calculated daily by the dietitians at Children’s Nutrition Unit; the quantity and type of food was recorded and duplicate food samples were collected from seven children aged 24–48 months and ashed for zinc concentration measurement by atomic absorption spectrophotometry
Discharge: usually within 3 weeks if 75–80% W/H (Western standards), haemoglobin > 100 g/l and total serum proteins > 65 g/l. Children with TB were admitted for 6 weeks to ensure adequate drug therapy
Adverse symptoms: medical and nursing staff were aware of the possibility of side effects in the children receiving zinc supplements. Protein and calorie intake of both groups were monitored to study anorexia as a potential adverse effect of zinc supplementation
Length of follow-up: 2 weeks for outcomes although hospital stay was usually 3 weeks (6 weeks for children with TB)
Recruitment dates: NR

276 Appendix 12
Characteristics of participants
Characteristic Zinc supplemented (n = 12)Control (non-supplemented) (n = 11) p-value
Age, months (range) 35.3 ± 5 (12–96) 42.8 ± 7.8 (12–96) NR
Weight, kg 6.7 ± 0.6 7.9 ± 1.1 NR
W/A, % 46 ± 3 48 ± 3 NR
W/H, % 70 ± 2 66 ± 2 NR
Height, cm 76 ± 3 80 ± 5 NR
H/A, % 80 ± 2 78 ± 4 NR
Nutritional diagnosis (McLaren’s criteria), n
Marasmus 1 1 NR
Kwashiorkor 5 3 NR
Marasmic kwashiorkor 6 7 NR
Comments: results are reported as mean ± SE unless otherwise stated
No statistically significant differences between groups were reported
Whole group mean age = 38.9 ± 4.6 months, mean weight = 7.3 ± 0.6 kg, mean W/A = 47.1 ± 2.3%, mean W/H = 68.1 ± 1.8%
Birth order, number of living siblings and family income per month and per capita per day are reported, but have not been extracted
Results
Primary outcomes Zinc supplemented (n = 12)Control (non-supplemented) (n = 11) p-value
Polymorphonuclear zinc, mmol/1010 polymorphonuclear
On admission – – NR
On entry to study 1.75 ± 0.11 2.05 ± 0.18 NR
On conclusion of study 2.59 ± 0.25a 1.60 ± 0.23 NR
Plasma zinc, μmol/l
On admission – – NR
On entry to study 10.8 ± 0.8 8.6 ± 0.8 NR
On conclusion of study 14.6 ± 0.9b 12.3 ± 0.9c NR
Plasma protein, g/dl
On admission 5.3 ± 0.3 5.1 ± 0.2 NR
On entry to study 6.6 ± 0.4 6.6 ± 0.3 NR
On conclusion of study 7.6 ± 0.2(8)d 7.8 ± 0.1(7)c NR
Comments: packed cell volume, ferritin, vitamin A and vitamin E levels were reported but have not been extracted
Overall, plasma zinc and protein levels were weakly correlated (r = 0.56, p < 0.01); in the non-supplemented children the correlation between plasma zinc and protein levels was stronger (r = 0.73, p < 0.001)
Anthropometric characteristics and the results on plasma zinc, polymorphonuclear zinc, plasma vitamins A and E levels of a non-malnourished, non-supplemented control group were reported, but have not been extracted
Secondary outcomes Zinc supplemented (n = 12)Control (non-supplemented) (n = 11) p-value
Mean weight gain, g/day
Week one 35 32 NR
Week two 70 ± 20 40 ± 10 NR
Weight gain, g/kg/day
Week one 4.6 ± 1.9 4.9 ± 3.3 NR/NS
Week two 8.83 ± 1.56 5.09 ± 1.62 NR; 95% CI 0.88 to 8.36
Calorie intake, kcal/kg/day
Week one 161 ± 8 156 ± 8 NR/NS
Week two 180 ± 9 169 ± 9 NR/NS

© Queen’s Printer and Controller of HMSO 2012. This work was produced by Picot et al. under the terms of a commissioning contract issued by the Secretary of State for Health.
277 Health Technology Assessment 2012; Vol. 16: No. 19DOI: 10.3310/hta16190
Protein intake, g/kg/day
Week one 4.7 ± 0.2 4.6 ± 0.3 NR/NS
Week two 5.3 ± 0.2 4.9 ± 0.3 NR/NS
Per cent who achieved an optimal rate of weight gain (at Children’s Nutrition Unit, > 10 g/kg/day)
42 9 < 0.001
Comments: the mean unsupplemented dietary zinc intake of the malnourished children was 3.7 (range 2.4–5.3) mg/d. The zinc contents of individual foods were reported but not extracted
Safety: taking into consideration anorexia as a common feature of severe experimental zinc deficiency in animals, there was no significant difference in the intake of the two groups
Tube feeding was required for a few days for one patient in each group. Two patients in each group had a blood transfusion
HIV: NR
Barriers to implementation
NR
Methodological comments
Participants were randomly selected by the nursing sisters of Children’s Nutrition Unit. During nutritional rehabilitation, the mean supplemented dietary in take of zinc was only 3.7 mg/d, which is < 40% the recommended daily allowance. A daily dose of 50 mg probably is unnecessarily large, but did not cause any side effects
Allocation to treatment groups: participants were alternately allocated to groups for a 2-week period
Blinding: no details reported. Would assume no blinding of children, investigators nor outcome assessors
Comparability of treatment groups: reports no differences in baseline characteristics (no p-values reported). The incidence of TB, pneumonia and vitamin A deficiency was also similar in both groups
Method of data analysis: all data were expressed as mean ± SE and were analysed by unpaired Student’s t-test. Not ITT analysis
Sample size/power calculation: NR
Attrition/dropout: one patient was excluded from the zinc group owing to being transferred to the children’s hospital with a provisional diagnosis of typhoid fever. One patient was excluded from the control group because two doses (100 mg) of zinc had been accidentally given
General comments
Generalisability: the criteria used to define SAM (McLaren’s criteria: < 75% W/H and W/A), differ from the current WHO criteria; however, the average W/H is < 70%. The age inclusion range of 1–7 years differs from SHTAC’s protocol (< 5-year-old children), though the mean age was 39 months. It is not clear whether or not these results can be extrapolated to the general population, as the random selection of participants was not detailed by the authors. Many children had comorbidities, such as TB, pneumonia and vitamin A deficiency
Outcome measures: appropriate, though some key outcomes, such as mortality rate, morbidity, and time to recover were NR
Intercentre variability: not applicable
Conflict of interest: NR
IU, international units; NR, not reported; NS, not statistically significant.a p < 0.001, on entry to study vs on conclusion of study.b p < 0.01, on entry to study vs on conclusion of study.c p < 0.005, on entry to study vs on conclusion of study.d p < 0.05, on entry to study vs on conclusion of study.

278 Appendix 12
Quality assessment for primary studies (modified for severe malnutrition)
A. Selection bias
1. Are the individuals selected to participate in the study likely to be representative of the target population?
Very likely Somewhat likely Not likely Cannot tell
2. What percentage of selected individuals participated? 80–100% 60–79% < 60% N/A Cannot tell
Summary of selection bias
(Methodological strength of study)
Strong Moderate Weak
B. Study design
1. What was the study design?
(Please tick appropriate and specify design if categorise as ‘Other’)
RCT
CCT
Cohort analytic (two group pre + post)
Case–control
Cohort [one group pre + post (before and after)]
Interrupted time series
Other – specify
Cannot Tell
2. Was the study described as randomised? Yes No
If answer to no. 2 is ‘no’ complete summary then go to section C. Confounders. If answer is ‘yes’, answer no. 3 and no. 4 below, before completing summary for this section
3. If answer was yes, was the method of randomisation described?
Yes No
4. If answer was yes, was the method appropriate? Yes No
Summary of study design
(Methodological strength of study)
Strong Moderate Weak
C. Confounders
1. Were there important differences between groups prior to the intervention?
Yes No Cannot tell
2. If yes, indicate the percentage of relevant confounders that were controlled [either in the design (e.g. by stratification or matching) or in the analysis]?
80–100% 60–79% < 60% Cannot tell
Summary of confounders
(Methodological strength of study)
Strong Moderate Weak
D. Blinding
1. Was the outcome assessor aware of the intervention or exposure status of participants?
Yes No Cannot tell
2. Were the study participants aware of the research question?
Yes No Cannot tell
Summary of blinding
(Methodological strength of study)
Strong Moderate Weak

© Queen’s Printer and Controller of HMSO 2012. This work was produced by Picot et al. under the terms of a commissioning contract issued by the Secretary of State for Health.
279 Health Technology Assessment 2012; Vol. 16: No. 19DOI: 10.3310/hta16190
E. Data collection methods
1. Were data collection tools shown to be valid? Yes No Cannot tell a
2. Were data collection tools shown to be reliable? Yes No Cannot tell a
Summary of data collection
(Methodological strength of study)
Strong Moderate Weak b
F. Withdrawals and dropouts
1. Were withdrawals and dropouts reported in terms of numbers and reasons per group?
Yes No Cannot tell
2. Indicate the percentage of participants completing the study (If the percentage differs by groups, record the lowest)
80–100% 60–79% < 60% Cannot tell
Summary of withdrawals and dropouts
(Methodological strength of study)
Strong Moderate Weak
G. Intervention integrity
1. What percentage of participants received the allocated intervention or exposure of interest?
80–100% 60–79% < 60% Cannot tell
2. Was the consistency of the intervention measured? Yes No Cannot tell
3. Is it likely that subjects received an unintended intervention (contamination or co-intervention) that may influence the results?
Yes No Cannot tell
H. Analysis
1. Indicate the unit of allocation Community Organisation/institution
Practice/office
Provider Patient
2. Indicate the unit of analysis Community Organisation/institution
Practice/office
Provider Patient
3. Are the statistical methods appropriate for the study design?
Yes No Cannot tell
4. Is the analysis performed by intervention allocation status (i.e. ITT) rather than actual intervention received?
Yes No Cannot tell
Global rating for studyc
(Overall methodological strength of study – based on sections A–F)
Strong Moderate Weak
(zinc status) (weight)
N/A, not applicable.a ‘Yes’ for zinc status, ‘cannot tell’ for weight.b ‘Strong’ for zinc status, ‘weak’ for weight.c Strong = four strong ratings with no weak ratings; moderate = one weak rating; weak = two or more weak ratings.

280 Appendix 12
Vasudevan et al. 199778
Data extraction table
Reference and design Intervention Participants Outcome measures
Author: Vasudevan et al.78
Year: 1997
Country: India
Study design: double-blind placebo-controlled trial
Setting: outpatient (Division of Department of Paediatric Medical College)
Number of centres: one
Funding: not stated
Intervention: zinc-supplemented group received 6.6 mg of elemental zinc, equivalent to 20 mg of zinc sulphate, once daily
Control: placebo was provided in similar looking capsules to zinc supplement
Other comparator group: normal, healthy children, not malnourished or ill, who were siblings or volunteers were analysed for serum zinc to determine the normal range (outcomes NR)
Other interventions used: nutritional counselling to parents, dietary intake adjusted to 100–120 calories/kg/day by instructing the mother
Definition of SAM: protein energy malnutrition grades III and IV using IAP criteria
Number of participants: 72 children recruited, 62 children completed designated follow-up period (31 per group)
Sample attrition/dropout: 10 children (five per group)
Sample crossovers: not stated
Inclusion criteria: aged 8–24 months, suffering from protein–energy malnutrition grades III and IV
Exclusion criteria: children with other concurrent causes of malnutrition by history, physical examination and investigations
General characteristics of participants: none stated other than inclusion criteria
Outcomes: weight of the child; serum zinc. Primary and secondary outcomes were not defined
Method of assessing outcomes: serum zinc analysis by calorimetric methods using a kit obtained from Randox Laboratories (UK). Weight of the child and serum zinc was assessed at baseline and at 3-months follow-up. Serum zinc was assessed at end of 3 months, allowing 6 days after the last dose of zinc prior to analysis
Adverse symptoms: none stated
Length of follow-up: 3 months
Recruitment dates: none reported
Characteristics of participants
Characteristic Zinc supplemented (n = 31) Placebo (n = 31) p-value
Mean serum zinc levels 98.4 ± 26.1 µg/dl
Comments: mean serum zinc levels for healthy group 154.4 ± 24 µg/dl significantly different to malnourished children 98.4 ± 26.1 µg/dl (p < 0.001)
Results
Outcomes Zinc supplemented (n = 31) Placebo (n = 31) p-value
Change in zinc levels (µg/dl) (before-and-after study)
+ 51.3 + 16.4 < 0.001
Rate of weight gain (g/kg/day)
1.4 0.98 > 0.1
Comments: states that none of the children with zinc supplementation developed any related side effects
Safety: none stated
HIV: none stated
Barriers to implementation
None stated
Methodological comments
Allocation to treatment groups: not stated
Blinding: double blind
Comparability of treatment groups: matched for age (within 3 months), sex, W/A, socioeconomic status, ethnic background (data NR)
Method of data analysis: t-tests (paired and Student’s)
Sample size/power calculation: not stated
Attrition/dropout: 10 children (five per group) did not complete the designated follow-up. Reasons for dropout were NR
General comments
Generalisability: limited details are provided about the group and so it is only possible to indicate that the study is relevant to children aged 8–24 months with PEM
Outcome measures: suitable outcomes were reported
Intercentre variability: not relevant
Conflict of interest: none stated
NR, not reported.

© Queen’s Printer and Controller of HMSO 2012. This work was produced by Picot et al. under the terms of a commissioning contract issued by the Secretary of State for Health.
281 Health Technology Assessment 2012; Vol. 16: No. 19DOI: 10.3310/hta16190
Quality assessment for primary studies (modified for severe malnutrition)
A. Selection bias
1. Are the individuals selected to participate in the study likely to be representative of the target population?
Very likely Somewhat likely Not likely Cannot tell
2. What percentage of selected individuals participated? 80–100% 60–79% < 60% N/A Cannot tell
Summary of selection bias
(Methodological strength of study)
Strong Moderate Weak
B. Study design
1. What was the study design?
(Please tick appropriate and specify design if categorise as ‘Other’)
RCT
CCT
Cohort analytic (two group pre + post)
Case–control
Cohort [one group pre + post (before and after)]
Interrupted time series
Other – specify
Cannot Tell
2. Was the study described as randomised? Yes No
If answer to no. 2 is ‘no’ complete summary then go to section C. Confounders. If answer is ‘yes’, answer no. 3 and no. 4 below, before completing summary for this section
3. If answer was yes, was the method of randomisation described?
Yes No
4. If answer was yes, was the method appropriate? Yes No
Summary of study design
(Methodological strength of study)
Strong Moderate Weak
C. Confounders
1. Were there important differences between groups prior to the intervention?
Yes No Cannot tell
2. If yes, indicate the percentage of relevant confounders that were controlled [either in the design (e.g. by stratification or matching) or in the analysis]?
80–100% 60–79% < 60% Cannot tell
Summary of confounders
(Methodological strength of study)
Strong Moderate Weak
D. Blinding
1. Was the outcome assessor aware of the intervention or exposure status of participants?
Yes No Cannot tell
2. Were the study participants aware of the research question?
Yes No Cannot tell
Summary of blinding
(Methodological strength of study)
Strong Moderate Weak
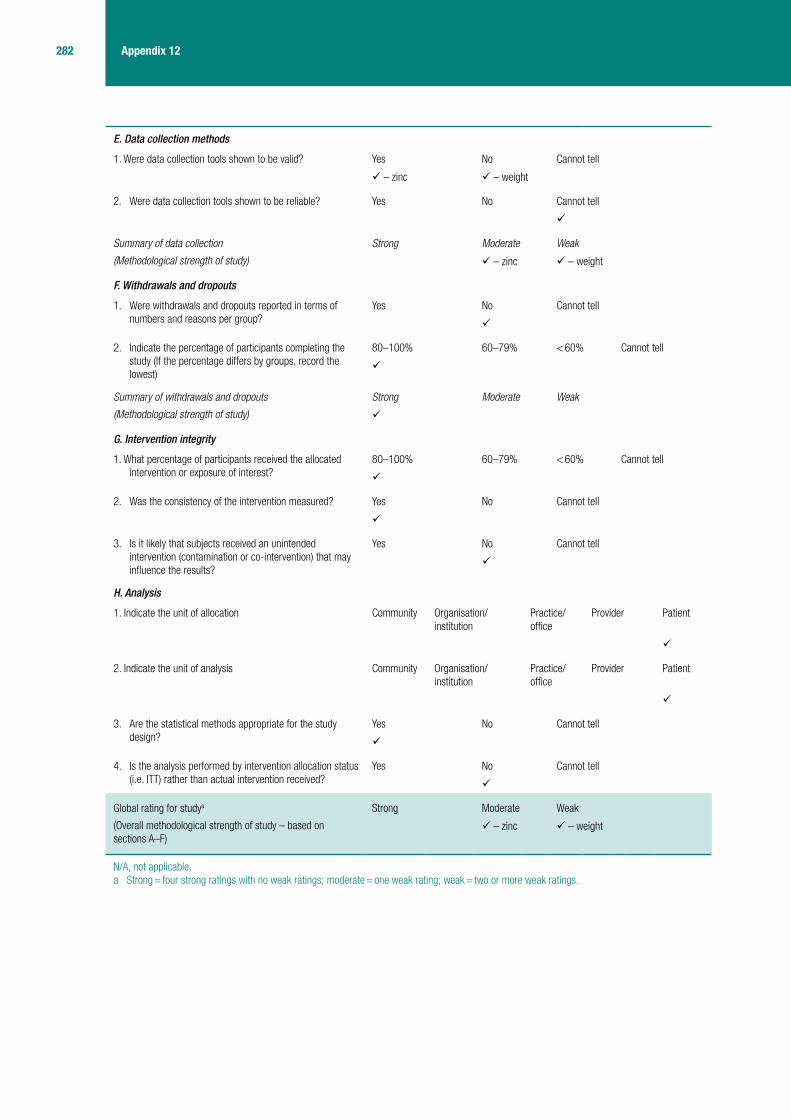
282 Appendix 12
E. Data collection methods
1. Were data collection tools shown to be valid? Yes No Cannot tell
– zinc – weight
2. Were data collection tools shown to be reliable? Yes No Cannot tell
Summary of data collection
(Methodological strength of study)
Strong Moderate Weak
– zinc – weight
F. Withdrawals and dropouts
1. Were withdrawals and dropouts reported in terms of numbers and reasons per group?
Yes No Cannot tell
2. Indicate the percentage of participants completing the study (If the percentage differs by groups, record the lowest)
80–100% 60–79% < 60% Cannot tell
Summary of withdrawals and dropouts
(Methodological strength of study)
Strong Moderate Weak
G. Intervention integrity
1. What percentage of participants received the allocated intervention or exposure of interest?
80–100% 60–79% < 60% Cannot tell
2. Was the consistency of the intervention measured? Yes No Cannot tell
3. Is it likely that subjects received an unintended intervention (contamination or co-intervention) that may influence the results?
Yes No Cannot tell
H. Analysis
1. Indicate the unit of allocation Community Organisation/institution
Practice/office
Provider Patient
2. Indicate the unit of analysis Community Organisation/institution
Practice/office
Provider Patient
3. Are the statistical methods appropriate for the study design?
Yes No Cannot tell
4. Is the analysis performed by intervention allocation status (i.e. ITT) rather than actual intervention received?
Yes No Cannot tell
Global rating for studya
(Overall methodological strength of study – based on sections A–F)
Strong Moderate Weak
– zinc – weight
N/A, not applicable.a Strong = four strong ratings with no weak ratings; moderate = one weak rating; weak = two or more weak ratings.

© Queen’s Printer and Controller of HMSO 2012. This work was produced by Picot et al. under the terms of a commissioning contract issued by the Secretary of State for Health.
283 Health Technology Assessment 2012; Vol. 16: No. 19DOI: 10.3310/hta16190
Bhutta et al. 199979
Data extraction table
Reference and design Intervention Participants Outcome measures
Author: Bhutta et al.79
Year: 1999
Country: Pakistan
Study design: double-blind RCT
Setting: Nutrition Research ward at the National Institute of Child Health
Number of centres: one
Funding: the Applied Diarrhoeal Disease Research Program of the Harvard Institute for International Development via an agreement with the US Agency for International Development
Intervention: zinc supplementation (3 mg/kg/day of elemental zinc sulphate, single daily dose) during 14 days of inpatient dietary therapy and continued for 14 days at home (with home available diets) after discharge
Control: placebo during 14 days of inpatient dietary therapy and continued for 14 days at home (with home available diets) after discharge
Other interventions used: applied to all children: stabilisation period of 24 hours during which i.v. and oral rehydration fluids were administered as necessary and antibiotic therapy for concomitant non-enteric infections was initiated. Stool output quantified and and any coexisting dehydration or electrolyte imbalance corrected
Dietary therapy with rice-lentil KY diet, supplemented with vitamins initiated and continued under supervision for 14 days. Diet administered ad libitum, in gradually increasing amounts, to provide at least 100 kcal/kg/day by day 4 of therapy
Details of the diet below
Breastfeeding continued as required
Degree of dehydration, body temperature, vital signs and clinical status recorded twice daily or more frequently as clinically indicated. In cases of suspected septicaemia a blood culture was obtained before initiation of broad-spectrum antibiotics (usually i.v. ampicillin and gentamicin, or i.v. ceftriaxone in suspected typhoidal salmonellosis). Suspected bacterial lower respiratory infections evaluated by chest radiography and treated according to the standard WHO guidelines
Definition of SAM: not defined, although children were shown to meet W/A and MUAC criteria
Number of participants: N = 87 (intervention, n = 43; control, n = 44)
Sample attrition/dropout: 10 participants did not complete the inpatient part of the study and did not take supplements at home. Zinc group: two discharged prematurely, two because of concomitant infection precluding full enteral feeds, and one because of development of recurrent dehydration. Control: two discharged prematurely, three because of concomitant infection precluding full enteral feeds
Sample crossovers: not applicable
Inclusion criteria: children aged 6–36 months with persistent diarrhoea (four or more unformed stools per day continuously for at least 14 days) and malnutrition (WAZ ≤ 2)
Exclusion criteria:
■ children with overt evidence of kwashiorkor and ocular or skin lesions suggestive of vitamin A or zinc deficiency
■ children who still needed i.v. fluids or were unable to tolerate oral feeds because of concomitant illness at the end of the 24-hour stabilisation phase were also excluded
General characteristics of participants: children aged 6–36 months with persistent diarrhoea and evidence of malnutrition
Primary outcome: overall weight gain by day 14 of inpatient therapy
Secondary outcomes (> 14 days inpatient therapy):
■ overall energy intake (kcal/kg/day)
■ stool frequency (number/day) ■ stool volume (g/kg/day) for
males ■ changes in laboratory
parameters (included serum albumin, prealbumin, alkaline phasphatase, insulin-like growth factor-1, plasma copper and zinc)
■ time to weight gain ■ time to diarrhoeal recovery ■ time taken to achieve a 30%
and 50% reduction in stool output
Method of assessing outcomes: unclothed weight obtained prior to feed at admission, and daily, on a double-beam balance sensitive up to 10 g. Length measured on an infant stadiometer, occipito-frontal, mid-arm, and mid-thigh circumferences measured using paper tape. Anthropomorphic measures repeated at days 7, 14 and 28
Laboratory measurements were undertaken at baseline, 7 and 14 days
Daily amounts of food consumed estimated by weighing left-over food. Breastfed amount estimated by immediate test weighing
Accurate records of stool, vomitus and urinary output were maintained by quantifying stool output separately from urine by means of adhesive bags. For females, only stool frequency and character were recorded after 72 hours of therapy (because of high rates of urine–stool admixture)

284 Appendix 12
A range of laboratory investigations were carried out at baseline, day 7 and day 14 on stools and blood (details not data extracted).Intestinal permeability was also assessed. Children were considered zinc deficient based on plasma zinc levels < 60 μg/dl (9.18 μmol/l)
Time to weight gain: time taken to achieve weight gain for three or more days consecutively after achieving a caloric intake of 100 kcal/kg/day
Time to diarrhoeal recovery: time taken to achieve a reduction in stool volume to < 30 g/kg/day in males, stool frequency less than four per day in both, and achievement of a semisoft stool consistency
Compliance with therapy: assessed by estimation of remaining supplement volume at return appointment
Adverse symptoms: NR
Length of follow-up: 28 days
Recruitment dates: July 1993 to September 1995
Characteristics of participants
Characteristic Intervention (zinc) (n = 43) Control (placebo) (n = 44) p-value
Sex (M : F) 27 : 16 26 : 18 NS
Age, months 11.6 ± 5.6 13.1 ± 6.2 NS
WAZ –3.47 ± 0.97 –3.27 ± 1.33 NS
HAZ –1.68 ± 1.14 –1.44 ± 1.34 NS
WHZ –3.02 ± 0.90 –3.13 ± 1.19 NS
Mid-arm circumference, cm
11.1 ± 1.5 11.6 ± 1.9 NS
Total protein, g/l 55.0 ± 9.2 56.8 ± 8.9 NS
Serum albumin, g/l 33.7 ± 7.8 33.5 ± 6.5 NS
Serum prealbumin, mg/l 93.8 ± 40.2 77.4 ± 35.0 NS
Haemoglobin, g/l 92.3 ± 18.2 91.6 ± 19.0 NS
Haematocrit, % 29.9 ± 4.3 29.8 ± 4.9 NS
C-reactive protein, mg/l 32.9 ± 42.5 41.4 ± 67.6 NS
Plasma zinc, μg/dl 78.0 ± 32.2 70.3 ± 19.0 NS
Plasma copper, μg/dl 67.4 ± 34.2 64.1 ± 19.2 NS
Duration of diarrhoea 14–30 days
33 (77%) 32 (73%) NS
> 30 days 10 (23%) 12 (27%)
Stool at admission, n (%)
Watery 32 (74) 28 (64) NS
Bloody 3 (7) 2 (5)
Mucoid 3 (7) 6 (14)
Mixed 5 (12) 8 (18)

© Queen’s Printer and Controller of HMSO 2012. This work was produced by Picot et al. under the terms of a commissioning contract issued by the Secretary of State for Health.
285 Health Technology Assessment 2012; Vol. 16: No. 19DOI: 10.3310/hta16190
Stool volume n (%)a
< 40 g/kg/day 13 (30) 9 (20) NS
40–70 g/kg/day 10 (23) 17 (39)
> 70 g/kg/day 20 (47) 18 (41)
Stool frequency n (%)a
1–5 per day 10 (23) 8 (18) NS
6–10 per day 14 (33) 15 (34)
> 10 per day 19 (44) 21 (48)
Degree of dehydration at admission n (%)
None 23 (53) 29 (66) NS
Mild 16 (37) 11 (25)
Moderate 2 (5) 2 (5)
Severe 2 (5) 2 (5)
Comments: at baseline, overall, 25 children (29%) had plasma zinc levels < 60 μg/dl (9.18 μmol/l) and were therefore considered zinc deficient. Stool pathogens: enteropathogenic E. coli and Campylobacter jejuni in two each, S. paratyphi and Aeromonas hydrophilia in two children in the zinc group, and V. cholerae ogawa in one child in the placebo group. Degree of dehydration at admission similar in both groups, amounts of i.v. fluids (not data extracted) and ORS (not data extracted) consumed during initial stabilisation were comparable
Results
Primary outcomes Intervention (zinc) Control (placebo) p-value
Overall weight increment, g/kg/day
10.3 ± 5.7 8.7 ± 6.5 NS
Weight, kg
Day 1 6.08 ± 1.32 6.33 ± 1.56
Day 7 6.27 ± 1.29 6.84 ± 1.41
Day 14 6.67 ± 1.43 7.13 ± 1.42 0.27b
Comments: text indicates that rate of weight gain was slow in children with evidence of systemic infection requiring antibiotics, but numerical data are not presented. These patients were distributed equally between the two groups
Secondary outcomes Intervention (zinc), mean ± SD (n = 43)
Control (placebo), mean ± SD (n = 44)
p-value
Plasma zinc, μg/dlc
Day 1 78.0 ± 32.2 70.3 ± 19.0
Day 7 100 ± 48 64 ± 20
Day 14 112 ± 64 68 ± 20 0.03d
Caloric intake, kcal/kg/day
Day 1 83.1 ± 37.5 80.2 ± 28.6
Day 7 129.6 ± 39.6 123.8 ± 36.9
Day 14 130.7 ± 46.6 121.1 ± 49.7 0.79b
Overall increment in caloric intake, kcal/kg/day
39.9 ± 46.5 40.0 ± 51.3 NS
Stool frequency, n/day
Day 1 10.2 ± 6.4 11.8 ± 7.8
Day 7 5.9 ± 5.6 5.2 ± 3.7
Day 14 2.9 ± 1.6 3.0 ± 2.2 0.52b
Decrease in stool frequency, n/day
7.4 ± 7.4 8.1 ± 8.8 NS

286 Appendix 12
Stool volume, g/kg/day (males)
Day 1 116.8 ± 103.7 141.9 ± 171.6
Day 7 66.7 ± 68.1 43.9 ± 40.1
Day 14 24.9 ± 16.2 27.8 ± 31.4 0.42b
Decrease in stool volume (g/kg/day)
91.1 ± 103.6 98.0 ± 187.9 NS
Mid-arm circumference (cm)
Day 1 11.4 ± 1.5 11.5 ± 1.9
Day 7 11.7 ± 1.4 12.0 ± 1.8
Day 14 12.0 ± 1.4 12.4 ± 1.8 0.66b
Overall increment in mid-arm circumference
0.3 ± 0.3 0.4 ± 0.3 NS
Weight gain during the 14 days of ambulatory home based supplementation, g/kg/day
9.2 ± 46 7.6 ± 5.7 NS
Increment in mid-arm circumference after 14 days of ambulatory home based supplementation
0.13 ± 0.28 0.19 ± 0.40 NR
Comments: data from Kaplan–Meier plots of time-to-diarrhoeal-recovery and time-to-weight-gain have not been data extracted. Although children in the zinc group had a faster initial reduction in stool output (log-rank test for time to 30% reduction in stool output; p < 0.03) there was no significant difference between the groups for the time take for a 50% reduction in stool output (p = 0.24). The overall time taken for diarrhoeal recovery (p = 0.713) and weight gain (p = 0.397) were comparable
The authors performed subgroup analyses on outcomes for the subgroup with low plasma zinc levels at admission (not data extracted), and for the subgroup of stunted children (HAZ < –2) (data not presented in paper). There were no significant differences, but the authors acknowledge that their study had insufficient power to detect significant differences in these subgroups
Data on the lactulose: rhamnose ratio, and the sequential breath hydrogen excretion values were not extracted
Safety: no child had a relapse of diarrhoea and the morbidity patterns were comparable during the 14-day period of home supplementation and follow-up
The authors point out that care is needed when supplementing with single nutrients as some may interfere with the absorption of others. In particular, significant interaction of zinc absorption with copper and iron has been described. Data on plasma copper have not been data extracted from a line figure. A significant trend in reduction of serum copper was seen in the zinc group, whereas values significantly increased in the placebo group by the end of the second week of therapy. Numerical values (as well as the line graph) are provided in the paper, but it is not clear what these correspond to as they do not appear to match expected values on the graph for plasma copper at day 14
HIV: NR
Barriers to implementation
NR

© Queen’s Printer and Controller of HMSO 2012. This work was produced by Picot et al. under the terms of a commissioning contract issued by the Secretary of State for Health.
287 Health Technology Assessment 2012; Vol. 16: No. 19DOI: 10.3310/hta16190
Methodological comments
Zinc dose: the authors note that zinc could have been provided at a fixed daily dose for ease of administration. However, they gave 3 mg/kg/day of elemental zinc in an attempt to evaluate a level of zinc intake that provided almost twice the recommended daily allowance. In addition, this level could also have been emulated from dietary sources subsequently. The dose was also believed to be sufficient for replenishment of plasma zinc levels
Allocation to treatment groups: block randomisation. The randomisation code, maintained by the Pharmacy Department at the Aga Khan University Hospital was not available to the investigators until the end of the study. The pharmacy department were unaware of the identity of enrolled patients
Blinding: described as double blind
Comparability of treatment groups: described as closely comparable for all admission clinical, nutritional, and laboratory parameters. Also comparable for the duration and severity of diarrhoea, as assessed by history as well as during the period of stabilisation. An equal number of children in both groups revealed stool pathogens on cultures
Method of data analysis: A mid-term analysis of morbidity and mortality among the participants was conducted independently by consultants from Applied Diarrhoeal Disease Research Program, and the study was allowed to proceed to conclusion. Final analysis was on an ITT basis, irrespective of length of stay in the study. Differences between groups evaluated for categorical data by chi-squared analysis or Fisher’s exact test as appropriate. Differences for continuous data compared by two-tailed Student’s t-test. Sequential data for primary and secondary outcomes at baseline, day 7 and 14 evaluated by analysis of variance for repeated measures, evaluating the interaction of time trend and treatment effect. Time to event data for the two groups compared by survival analysis using the log-rank test. A subgroup analysis was conducted for the subgroup of children considered zinc deficient. Significance was set at 5%
Sample size/power calculation: reported and reference provided for the formula used. The formula used was for analysis of longitudinal continuous data, and the calculation was based on the known pattern and rate of weight gain (5 ± 3 g/kg/day) in comparably malnourished children with persistent diarrhoea receiving the same KY-based diet. It was estimated that to achieve at least a 30% difference in weight gain after 14 days of therapy, with 80% power and a type 1 error of 0.05, 40 participants would be needed in each group. However, the authors note that although overall weight gain exceeded their initial estimates, the SDs were wide, which led to the possibility that the study had insufficient power to elucidate smaller put potentially significant differences in stool output or weight gain. The authors estimated the final power of the study to detect a 25% difference in rates of weight gain was < 60%
Attrition/dropout: numbers overall and by trial group were provided with reasons
General comments
Generalisability: a doctor and nurse in constant attendance on the ward, this level of supervision might not be possible in all settings. As children with kwashiorkor or symptoms suggestive of vitamin A or zinc deficiency were excluded from this study, the results may not be applicable to these groups
Outcome measures: a primary outcome measure was stated although this outcome was subsequently presented among other results. Outcomes were listed and defined where necessary. Outcome data were presented as mean ± SD
Intercentre variability: not applicable
Conflict of interest: not stated
Dietary therapy
Khitchri (60 g rice, 30 g lentils, 10 g dry weight cottonseed oil and 1 g salt) prepared on site daily. Fresh live yoghurt obtained from a single source. Zinc content estimated to be < 2.5 mg zinc per 100 g. Vitamin mixture (1.5 the daily recommended doses): vitamin A (4500 units, 1.35 mg), vitamin D (600 units, 15 μg), vitamin B1 (2.2 mg), vitamin B2 (1.8 mg), vitamin B6 (1.5 mg), vitamin B12 (4.5 μg), nicotinamide (15 mg), vitamin C (75 mg)
ANOVA, analysis of variance; HAZ, weight-for-age z-score; NR, not reported; NS, not statistically significant; WAZ, weight-for-age z-score; WHZ, weight-for-height z-score.a Observed during initial period of stabilisation.b p-values are for the repeated measures ANOVA which evaluated the interaction of time trend and therapy effect for both groups during 14
days of therapy. All differences are non-significant.c Estimated by reviewer from line figure.d Zinc-supplemented children showed a sustained increment in plasma zinc and had significantly higher values at days 7 and 14 in comparison
with controls (p = 0.03 for time trend, p = 0.03 for therapy effect). By day 7 of zinc supplementation only three (8%) of the zinc group had plasma zinc levels < 60 μg/dl.

288 Appendix 12
Quality assessment for primary studies (modified for severe malnutrition)
A. Selection bias
1. Are the individuals selected to participate in the study likely to be representative of the target population?
Very likely Somewhat likely Not likely Cannot tell
2. What percentage of selected individuals participated? 80–100% 60–79% < 60% N/A Cannot tell
Summary of selection bias
(Methodological strength of study)
Strong Moderate Weak
B. Study design
1. What was the study design?
(Please tick appropriate and specify design if categorise as ‘Other’)
RCT
CCT
Cohort analytic (two group pre + post)
Case–control
Cohort [one group pre + post (before and after)]
Interrupted time series
Other – specify
Cannot Tell
2. Was the study described as randomised? Yes No
If answer to no. 2 is ‘no’ complete summary then go to section C. Confounders. If answer is ‘yes’, answer no. 3 and no. 4 below, before completing summary for this section
3. If answer was yes, was the method of randomisation described?
Yes No
4. If answer was yes, was the method appropriate? Yes No
Summary of study design
(Methodological strength of study)
Strong Moderate Weak
C. Confounders
1. Were there important differences between groups prior to the intervention?
Yes No Cannot tell
2. If yes, indicate the percentage of relevant confounders that were controlled [either in the design (e.g. by stratification or matching) or in the analysis]?
80–100% 60–79% < 60% Cannot tell
Summary of confounders
(Methodological strength of study)
Strong Moderate Weak
D. Blinding
1. Was the outcome assessor aware of the intervention or exposure status of participants?
Yes No Cannot tell
2. Were the study participants aware of the research question?
Yes No Cannot tell
Summary of blinding
(Methodological strength of study)
Strong Moderate Weak

© Queen’s Printer and Controller of HMSO 2012. This work was produced by Picot et al. under the terms of a commissioning contract issued by the Secretary of State for Health.
289 Health Technology Assessment 2012; Vol. 16: No. 19DOI: 10.3310/hta16190
E. Data collection methods
1. Were data collection tools shown to be valid? Yes No Cannot tell
2. Were data collection tools shown to be reliable? Yes No Cannot tell
Summary of data collection
(Methodological strength of study)
Strong Moderate Weak
F. Withdrawals and dropouts
1. Were withdrawals and dropouts reported in terms of numbers and reasons per group?
Yes No Cannot tell
2. Indicate the percentage of participants completing the study (If the percentage differs by groups, record the lowest)
80–100% 60–79% < 60% Cannot tell
Summary of withdrawals and dropouts
(Methodological strength of study)
Strong Moderate Weak
G. Intervention integrity
1. What percentage of participants received the allocated intervention or exposure of interest?
80–100% 60–79% < 60% Cannot tell
2. Was the consistency of the intervention measured? Yes No Cannot tell
3. Is it likely that subjects received an unintended intervention (contamination or co-intervention) that may influence the results?
Yes No Cannot tell
H. Analysis
1. Indicate the unit of allocation Community Organisation/institution
Practice/office
Provider Patient
2. Indicate the unit of analysis Community Organisation/institution
Practice/office
Provider Patient
3. Are the statistical methods appropriate for the study design?
Yes No Cannot tell
4. Is the analysis performed by intervention allocation status (i.e. ITT) rather than actual intervention received?
Yes No Cannot tell
Global rating for studya
(Overall methodological strength of study – based on sections A–F)
Strong Moderate Weak
N/A, not applicable.a Strong = four strong ratings with no weak ratings; moderate = one weak rating; weak = two or more weak ratings.

290 Appendix 12
Manary and Brewster 199780
Data extraction table
Reference and design Intervention Participants Outcome measures
Author: Manary and Brewster80
Year: 1997
Country: Malawi
Study design: double-blind RCT (judged as CCT in quality assessment)
Setting: inpatient (hospital-based NRU)
Number of centres: one
Funding: none reported
Intervention: high potassium supplementation (additional 3 mmol/kg potassium above the standard supplement given in corn syrup as a medication, total potassium dose of 7.7 mmol/kg/day in phase one of diet, i.e. first 7 days)
Control: standard potassium supplementation (3.2 mmol/kg/day of potassium plus placebo of corn syrup given as a medication, total potassium dose of 4.7 mmol/kg/day in phase one of diet, i.e. first 7 days)
Other interventions used: initial routine medications were cotrimoxazole, albendazole, magnesium (2.8 mmol/kg/day), zinc (40 mg daily as lactate) and multivitamins. Oral rehydration solution and i.v. fluid were used cautiously to avoid excess sodium and fluid loads. Standard regime of mild feeds (see end of table)
Definition of SAM: only described as children with kwashiorkor
Number of participants: N = 116 (intervention, n = 55; control, n = 61)
Sample attrition/dropout: n = 17 were excluded because they absconded before completion of the 7-day potassium supplement or placebo (intervention n = 7, control n = 10)
Sample crossovers: none reported
Inclusion criteria: all children admitted with kwashiorkor to the NRU
Exclusion criteria: children with oedema owing to renal disease or malarial anaemia
General characteristics of participants: rural children < 3 years of age admitted to hospital with kwashiorkor, with or without diarrhoea or HIV infection, but excluding oedema owing to renal disease or malarial anaemia
Primary outcomes: NR
Outcomes: deaths, clinical sepsis, skin ulcers, per cent weight loss, cough, dyspnoea, duration of hospital stay, irritability, diarrhoea and oedema
Method of assessing outcomes: daily weight taken plus examination for oedema, fever, respiratory signs, oral ulcers, skin ulcers and irritability
Number of days for: cough, duration of hospital stay, irritability, diarrhoea and 2+ or 3+ oedema
Number of cases for: dyspnoea
Per cent weight loss: assessed by day 7 and by discharge
Clinical sepsis: days 2–7 and days 8–24. Diagnosis based on fever, shock without dehydration, dyspnoea or an abrupt change in mental status or general condition (no microbiological investigations to confirm diagnosis)
Pedal oedema was graded on a 0–3 scale (1+ = < 0.5 cm of pitting oedema of the dorsum of the foot; 3+ = gross oedema of shins and eyelids)
Deaths: defined as early if it occurred in the first 5 days; defined as late if it occurred after at least 5 days of NRU treatment; defined as unexpected if there were no clinical indications of a life-threatening complication
Adverse symptoms: mothers were asked daily for 7 days if child was irritable, anorexic, able to finish the feeds, had diarrhoea, vomiting, a cough or respiratory distress
Charts of seriously ill children taken home against medical advice were reviewed blindly if they had received ≥ 7 days of treatment, to decide whether or not they were likely to have died at home and these children were then added to the late deaths
Length of follow-up: unclear
Recruitment dates: 10 February 1995 to 16 March 1995

© Queen’s Printer and Controller of HMSO 2012. This work was produced by Picot et al. under the terms of a commissioning contract issued by the Secretary of State for Health.
291 Health Technology Assessment 2012; Vol. 16: No. 19DOI: 10.3310/hta16190
Characteristics of participants
Characteristic Intervention (n = 48) Control (n = 51) p-value
Mean age, months (SD) 29.3 (14) 27.9 (15) 0.62
Wasting (%) > –1 9 (19) 8 (17) NR
W/H (SD) –2 15 (32) 6 (12) 0.91
z-scores (SD) –3 12 (26) 20 (42) NR
Oedema free (SD)
< –3 11 (23) 14 (29) NR
Mean (SD) –2.04 (1.20) –2.40 (1.13) 0.13
Stunting (%) > –2 11 (23) 5 (10) NR
H/A (SD) –3 10 (21) 13 (27) 0.92
(z-scores) (SD) –4 11 (23) 15 (31) NR
< –4 15 (32) 15 (31) NR
Mean (SD) –3.01 (1.73) –3.44 (1.25) 0.16
Oedema on admission (%)
1+ 9 (19) 9 (18) NR
2+ 13 (27) 16 (31) 0.90
3+ 26 (54) 26 (51) NR
Rash (%)
Nil 16 (33) 22 (43) NR
Mild 16 (33) 15 (29) 0.90
Moderate 13 (27) 9 (18) NR
Severe 3 (6) 5 (10) NR
Cough (%) 24 (50) 34 (67) 0.14
Clinical sepsis (%)a 4 (8) 7 (14) 0.59
Fever > 38.0 °C (%) 7 (15) 11 (22) 0.52
Haematocrit, mean % (SD) 31 (7) 30 (10) 0.49
Diarrhoea, n (%) 16 (33) 19 (37) 0.84
Mean days of diarrhoea before admission (SD)
4.2 (3.1) 4.6 (4.0) 0.56
Severe anorexia (%) 12 (25) 14 (27) 0.96
Irritability (%) 40 (83) 42 (82) 0.89
Skin ulcers (%) 18 (37) 19 (37) 0.86
Comments: clinical signs and symptoms on admission for whole sample: fever (39%), cough (53%), shortness of breath (12%), sore mouth (28%), oral thrush (24%), hair changes (58%), hepatomegaly of > 2 cm below the costal margin (28%) and splenomegaly (10%)
Baseline characteristics only provided for those followed up
Results
Outcomes Intervention (n = 37)b Control (n = 41)b p-value
Late death (%)c 3 (8) 13 (32) 0.02
Left before discharge (after day 7) (%)
3 (8) 8 (19.5) 0.15
Clinical sepsis (days 2–7) (%) 0 (0) 9 (22) 0.01
Clinical sepsis (days 8–24) (%) 3 (9) 9 (22) 0.05
New skin ulcers, number of cases (%)
4 (11) 13 (33) 0.05
Weight loss by day 7, % (SD) 5.6 (8.0) 4.0 (7.2) 0.36
Weight loss by discharge, % (SD)
4.9 (9.1) 3.8 (10.3) 0.61

292 Appendix 12
Cough, number of days (SD) 2.3 (2.6) 3.9 (2.7) 0.01
Dyspnoea, number of cases (%) 1 (3) 10 (24.4) 0.01
Hospital stay, number of days (SD)
11.6 (0.9) 13.2 (4.9) 0.21
Irritability, number of days (SD) 3.4 (1.7) 3.7 (2.1) 0.47
Diarrhoea, number of days (SD) 0.9 (2.5) 1.5 (1.7) 0.14
Oedema 2+ or 3+, number of days (SD)
2.7 (2.2) 2.7 (2.1) 0.99
Number of deaths in hospital (%)
14 (29.2)d 20 (39.2)d 0.40
Number of death in
First 48 hours 6 6 NR
Days 3–5 5 4 NR
Late deaths 3 10 NR
Adjusted late deaths (%) 3/37 (8.1) 13/41 (31.7) 0.02e
Causes of late death
Sepsis 3 3 NR
Anaemia 2 NR
Unexpected 5f NR
Comments: case-fatality rate was reduced by 33% in the intervention group (13/48) compared with the control group (21/51). Note, possible error in n/N, as all other information suggests 14/48 and 20/51 deaths
The intervention group had significantly fewer presumed septic episodes (3 vs 18) [OR 8.9 (95% CI 2.2 to 50.9)] respiratory symptoms and new skin ulcerations than controls
Safety: none stated
HIV: no enzyme-linked immunosorbent assays for HIV infection were conducted because of a refusal of consent. Paper reported prevalence figures from unpublished 1993–4 data (n = 519) as 6% for kwashiorkor patients and 17% for marasmic kwashiorkor patients. Also states that > 30% of Blantyre mothers are infected, and the transmission rate (by PCR) at birth is 27%106 with presumably an additional 14% infected via breast milk;107 therefore, expected prevalence rates for infants are around 12% before ceasing breastfeeding
Barriers to implementation
Lack of skilled management of individual cases, owing to a variety of constraints which are not readily remediable, were responsible for a case-fatality rate of 34% for kwashiorkor. Authors state that they are attempting the rate through feasible changes in management. Nasogastric tube feeding was used infrequently because of resistance from mothers, reducing the potassium intake in anorexic children
It is suggested that the blanket recommendation of a supplement of 4 mmol/kg is insufficient for phase one and might well be too much for the rapid growth phase when added to the diet. Authors state that although individualising doses of micronutrients as a medication has merits, the constraints at NRU make adding them to the diet a much more convenient option when nursing care is limited
Authors recommend that results can not be extrapolated to this setting, as there are regional differences in the prevalence of potassium depletion in kwashiorkor, which may be related to the mineral content of weaning diets and that additional losses of potassium can occur in stool with diarrhoea (present on admission to the NRU in this study in 33–37% of cases)
Methodological comments
Allocation to treatment groups: described as randomised, but no details provided
Blinding: described as double-blind, placebo-controlled trial. Investigators, health workers and mothers unaware of child’s allocation group
Comparability of treatment groups: no significant differences between treatment arms (all p-values reported)
Method of data analysis: dichotomous parameters were evaluated as ORs with 95% CI with Fisher’s exact test and Yates’ corrected p-values. Continuous parameters were evaluated using Student’s t-test (Epi Info version 6)
Sample size/power calculation: none reported
Attrition/dropout: numbers and reasons reported. Discontinuation rates appears to be similar between the two groups

© Queen’s Printer and Controller of HMSO 2012. This work was produced by Picot et al. under the terms of a commissioning contract issued by the Secretary of State for Health.
293 Health Technology Assessment 2012; Vol. 16: No. 19DOI: 10.3310/hta16190
General comments
Generalisability: not generalisable to children with oedema because of renal disease or malarial anaemia who were excluded and also not generalisable to older children. Not all the children may have met the current WHO criteria for SAM, as the sample included children with kwashiorkor categorised as W/H –2
Outcome measures: no primary outcome defined. Outcome measures appear suitable and appropriate
Intercentre variability: not applicable
Conflict of interest: none reported
Diet for all admissions (phase one and phase two)
Phase 1: dried skimmed milk, sugar, vegetable oil and water containing 278 kJ (66 kcal) and 1.0 g of protein per 100 ml. Daily intake per kilogram of body weight was approximately 332 kJ (79 kcal), 1.2 g of protein and 1.5 mmol of potassium. Once oedema, appetite and mental status had improved, children advanced to a phase two diet (generally in the second week of treatment, after completion of the potassium supplement or placebo)
Phase 2: four feeds of high-energy milk 477 kJ (114 kcal) and 4.1 g of protein per 100 ml, as well as two feeds of a local weaning porridge of maize, soya, sugar and oil consisting of 468 kJ (112 kcal) and 3.3 g of protein per 100 ml. Daily intake of 150 mmol/kg/day: 712 kJ (170 kcal), 5.8 g of protein and 7.6 mol of potassium/kg/day. The higher protein intake in phase one was necessitated by the use of a milk-oil-sugar premix for both phases
The protein and energy densities of these diets were similar to those recommended by Waterlow97 of 336 kJ (80 kcal) and 0.7 g of protein/kg/day in phase one and 735 kJ (175 kcal) and 5.75 g of protein/kg/day in phase two. States that the potassium treatment doses for children in both groups were within the ranges of those recommended for SAM in the scientific literature
NR, not reported; NRU, nutritional rehabilitation unit; PCR, polymerase chain reaction.a See Methods of assessing outcomes for definition.b Numbers excluded 21 early deaths (intervention, n = 11; control, n = 10).c Includes three controls who left hospital to die at home.d Thirty-four known deaths in hospital during the study (34% case fatality), of which 21 were early and 13 were late deaths (after day 5). Eleven
children (intervention n = 3, control n = 8) were taken from hospital before discharge after completing the 7-day trial, but before resolution of oedema and clinical improvement. Figure includes three of these children (all control), which had been assessed blindly to have been seriously ill and unlikely to have survived at home.
e OR 5.3 (95% CI 1.2 to 31.0).f The children who died unexpectedly had persisting diarrhoea and died between days 9 and 13.

294 Appendix 12
Quality assessment for primary studies (modified for severe malnutrition)
A. Selection bias
1. Are the individuals selected to participate in the study likely to be representative of the target population?
Very likely Somewhat likely Not likely Cannot tell
2. What percentage of selected individuals participated? 80–100% 60–79% < 60% N/A Cannot tell
Summary of selection bias
(Methodological strength of study)
Strong Moderate Weak
B. Study design
1. What was the study design?
(Please tick appropriate and specify design if categorise as ‘Other’)
RCT
CCT
Cohort analytic (two group pre + post)
Case–control
Cohort [one group pre + post (before and after)]
Interrupted time series
Other – specify
Cannot Tell
2. Was the study described as randomised? Yes No
If answer to no. 2 is ‘no’ complete summary then go to section C. Confounders. If answer is ‘yes’, answer no. 3 and no. 4 below, before completing summary for this section
3. If answer was yes, was the method of randomisation described?
Yes No
4. If answer was yes, was the method appropriate? Yes No
Summary of study design
(Methodological strength of study)
Strong Moderate Weak
C. Confounders
1. Were there important differences between groups prior to the intervention?
Yes No Cannot tell
2. If yes, indicate the percentage of relevant confounders that were controlled [either in the design (e.g. by stratification or matching) or in the analysis]?
80–100% 60–79% < 60% Cannot tell
Summary of confounders
(Methodological strength of study)
Strong Moderate Weak
D. Blinding
1. Was the outcome assessor aware of the intervention or exposure status of participants?
Yes No Cannot tell
2. Were the study participants aware of the research question? Yes No Cannot tell
Summary of blinding
(Methodological strength of study)
Strong Moderate Weak

© Queen’s Printer and Controller of HMSO 2012. This work was produced by Picot et al. under the terms of a commissioning contract issued by the Secretary of State for Health.
295 Health Technology Assessment 2012; Vol. 16: No. 19DOI: 10.3310/hta16190
E. Data collection methods
1. Were data collection tools shown to be valid? Yes No Cannot tell
2. Were data collection tools shown to be reliable? Yes No Cannot tell
Summary of data collection
(Methodological strength of study)
Strong Moderate Weak
F. Withdrawals and dropouts
1. Were withdrawals and dropouts reported in terms of numbers and reasons per group?
Yes No Cannot tell
2. Indicate the percentage of participants completing the study (If the percentage differs by groups, record the lowest)
80–100% 60–79% < 60% Cannot tell
Summary of withdrawals and dropouts
(Methodological strength of study)
Strong Moderate Weak
G. Intervention integrity
1. What percentage of participants received the allocated intervention or exposure of interest?
80–100% 60–79% < 60% Cannot tell
2. Was the consistency of the intervention measured? Yes No Cannot tell
3. Is it likely that subjects received an unintended intervention (contamination or co-intervention) that may influence the results?
Yes No Cannot tell
H. Analysis
1. Indicate the unit of allocation Community Organisation/institution
Practice/office
Provider Patient
2. Indicate the unit of analysis Community Organisation/institution
Practice/office
Provider Patient
3. Are the statistical methods appropriate for the study design? Yes No Cannot tell
4. Is the analysis performed by intervention allocation status (i.e. ITT) rather than actual intervention received?
Yes No Cannot tell
Global rating for studya
(Overall methodological strength of study – based on sections A–F)
Strong Moderate Weak
N/A, not applicable.a Strong = four strong ratings with no weak ratings; moderate = one weak rating; weak = two or more weak ratings.

296 Appendix 12
Philip et al. 198281
Data extraction table
Reference and design Intervention Participants Outcome measures
Author: Philip et al.81
Year: 1982
Country: India
Study design: CCT
Setting: inpatient
Number of centres: one
Funding: NR
Intervention: standard diet + nicotinic acid, 25 mg/kg/day (three divided doses) for 1 month
Control: standard diet for 1 month
Standard diet contained 4 g protein and 200 kcal obtained from K Mix two (supplied by UNICEF), tapioca, sugar, gingelly oil and rice (no further details reported)
Other interventions used: none reported
Definition of SAM: no specific reference made to SAM, only those ‘fulfilling the standard criteria for marasmas’ (no further details reported)
Number of participants: N = 80 (nicotinic acid, n = 40; control, n = 40)
Sample attrition/dropout: none reported
Sample crossovers: none reported
Inclusion criteria: standard criteria for marasmus (no reference or details provided)
Exclusion criteria: none reported.
General characteristics of participants: marasmic children aged 0–4 years
Primary outcomes: weight gain
Secondary outcomes: calorie consumption
Method of assessing outcomes: weight was recorded every morning before being given the standard diet. The calculated amount of food was given five times daily at 0700, 1000, 1300, 1600 and 2100 hours in divided quantities for 1 month. No further details
Adverse symptoms: none reported
Length of follow-up: none beyond the 1 month treatment period
Recruitment dates: 1974–6
Characteristics of participants
Characteristic Nicotinic acid (n = 40) Standard diet (n = 40) p-value
Age (years), n (%)
0–1 10 (25) 7 (17.5) NR
1–2 22 (55)a 23 (57.5) NR
2–3 7 (17.5) 8 (20) NR
3–4 1 (2.5) 2 (5) NR
Comments: no difference in sex distribution was noted. No other baseline characteristics were reported by the authors
Results
Primary outcomes Nicotinic acid (n = 40) Standard diet (n = 40) p-value
Weight gain in 1 month, g/kg
231.05 (20.05) 171.81 (22.01) 0.001b
Comments: results are reported as mean (SD)
When weight gain was calculated separately for each week, both groups showed maximum gain during week 2, followed by week 3, with the lowest gain in weeks 1 and 4 (no data reported)
For both groups, the rate of weight gain was slightly higher in those children with a greater initial weight deficit
Secondary outcomes Nicotinic acid (n = 40) Standard diet (n = 40) p-value
Calories consumed for 1 g gain in weight
14.2 19.3 NR
Safety: none of the children experienced any remarkable side effects of nicotinic acid
HIV: NR

© Queen’s Printer and Controller of HMSO 2012. This work was produced by Picot et al. under the terms of a commissioning contract issued by the Secretary of State for Health.
297 Health Technology Assessment 2012; Vol. 16: No. 19DOI: 10.3310/hta16190
Barriers to implementation
NR
Methodological comments
Allocation to treatment groups: not randomised. No details on allocation
Blinding: NR. No details on how nicotinic acid administered and thus blinding of patients, care providers and outcome assessors is unknown
Comparability of treatment groups: age is the only baseline characteristic reported; the distribution of the age ranges from 0–4 years was similar between the two groups, but no comment or p-value was reported. Authors noted that there was no difference in sex distribution (no data or p-value)
Method of data analysis: ITT analysis as data at end of study period is for all 80 subjects. No further details reported
Sample size/power calculation: NR
Attrition/dropout: none reported. Data at 1 month is for all included subjects so assume no dropouts
General comments
Generalisability: unable to tell whether or not the included children would meet the current WHO criteria as no specific definition of SAM was given; majority of children < 2 years. Unable to compare these children to the general SAM population as no baseline characteristics were given and reporting is limited
Outcome measures: primary outcome of weight gain was appropriate although mortality was NR
Intercentre variability: N/A
Conflict of interest: no details on funding nor any conflicts of interest were reported
N/A, not applicable; NR, not reported.a Reported as 65%, but 22/40 = 55%.b Reports t = 13.05 (assume Student’s t-test value).

298 Appendix 12
Quality assessment for primary studies (modified for severe malnutrition)
A. Selection bias
1. Are the individuals selected to participate in the study likely to be representative of the target population?
Very likely Somewhat likely Not likely Cannot tell
2. What percentage of selected individuals participated? 80–100% 60–79% < 60% N/A Cannot tell
Summary of selection bias
(Methodological strength of study)
Strong Moderate Weak
B. Study design
1. What was the study design?
(Please tick appropriate and specify design if categorise as ‘Other’)
RCT
CCT
Cohort analytic (two group pre + post)
Case–control
Cohort [one group pre + post (before and after)]
Interrupted time series
Other – specify
Cannot Tell
2. Was the study described as randomised? Yes No
If answer to no. 2 is ‘no’ complete summary then go to section C. Confounders. If answer is ‘yes’, answer no. 3 and no. 4 below, before completing summary for this section
3. If answer was yes, was the method of randomisation described?
Yes No
4. If answer was yes, was the method appropriate? Yes No
Summary of study design
(Methodological strength of study)
Strong Moderate Weak
C. Confounders
1. Were there important differences between groups prior to the intervention?
Yes No Cannot tell
2. If yes, indicate the percentage of relevant confounders that were controlled [either in the design (e.g. by stratification or matching) or in the analysis]?
80–100% 60–79% < 60% Cannot tell
Summary of confounders
(Methodological strength of study)
Strong Moderate Weak
D. Blinding
1. Was the outcome assessor aware of the intervention or exposure status of participants?
Yes No Cannot tell
2. Were the study participants aware of the research question?
Yes No Cannot tell
Summary of blinding
(Methodological strength of study)
Strong Moderate Weak

© Queen’s Printer and Controller of HMSO 2012. This work was produced by Picot et al. under the terms of a commissioning contract issued by the Secretary of State for Health.
299 Health Technology Assessment 2012; Vol. 16: No. 19DOI: 10.3310/hta16190
E. Data collection methods
1. Were data collection tools shown to be valid? Yes No Cannot tell
2. Were data collection tools shown to be reliable? Yes No Cannot tell
Summary of data collection
(Methodological strength of study)
Strong Moderate Weak
F. Withdrawals and dropouts
1. Were withdrawals and dropouts reported in terms of numbers and reasons per group?
Yes No Cannot tell
2. Indicate the percentage of participants completing the study (If the percentage differs by groups, record the lowest)
80–100% 60–79% < 60% Cannot tell
Summary of withdrawals and dropouts
(Methodological strength of study)
Strong Moderate Weak
G. Intervention integrity
1. What percentage of participants received the allocated intervention or exposure of interest?
80–100% 60–79% < 60% Cannot tell
2. Was the consistency of the intervention measured? Yes No Cannot tell
3. Is it likely that subjects received an unintended intervention (contamination or co-intervention) that may influence the results?
Yes No Cannot tell
H. Analysis
1. Indicate the unit of allocation Community Organisation/institution
Practice/office
Provider Patient
2. Indicate the unit of analysis Community Organisation/institution
Practice/office
Provider Patient
3. Are the statistical methods appropriate for the study design?
Yes No Cannot tell
4. Is the analysis performed by intervention allocation status (i.e. ITT) rather than actual intervention received?
Yes No Cannot tell
Global rating for studya
(Overall methodological strength of study – based on sections A–F)
Strong Moderate Weak
N/A, not applicable.a Strong = four strong ratings with no weak ratings; moderate = one weak rating; weak = two or more weak ratings.

300 Appendix 12
Vásquez-Garibay 200582
Data extraction table
Reference and design Intervention Participants Outcome measures
Author: Vásquez-Garibay82
Year: 2005
Country: Mexico
Study design: RCT
Setting: inpatient (Unit of Studies of Infantile Nutrition, Metabolic ward, Unit of Studies of Infantile Nutrition, Civil Hospital of Guadalajara)
Number of centres: one
Funding: none reported
Intervention: added NT (NT+) (SMA; Wyeth de México, SA de CV, Mexico): a milk-based formula with NT and corn syrup added to increase energy density to 3.35 kJ/ml (casein-dominant formula) (see end of table for details)
Control: no added NT (NT–) (S26; Wyeth de México, SA de CV, Mexico): similar formula with the same energy density, but no added NT (whey-dominant formula) (see end of table for details)
Feeding was through a nasogastric tube with infant formula (3.35 kJ/ml) for 2 weeks and ad libitum for a further 2 weeks
Other interventions used: parasites found in faeces were treated prior to acceptance into study
Definition of SAM: W/A or W/H < –3 SD from the median using the NCHS/WHO reference
Number of participants: N = 25 (NT+, n = 12; NT–, n = 13)
Sample attrition/dropout : n = 5
NT+: n = 1 (excluded owing to a non-determined liver disease)
NT–: n = 4 (excluded owing to fever syndrome n = 1, emetic syndrome n = 1, poor nutritional progress and a positive HIV test n = 2)
Sample crossovers: none reported
Inclusion criteria:
■ full-term infants with normal birth weight, primary and severe PEM, aged 3–18 months, W/A or W/H < –3 SD from the median NCHS/WHO standard
■ infants with severe PEM, free of infection and/or moderate or severe episodes of diarrhoea (infants with less than four liquid or semi-liquid stools) were accepted
■ only infants with the same clinical type of severe and primary PEM (marasmus) were investigated
Exclusion criteria: ■ infants rejecting formula feeding ■ genetic, congenital, chronic and/
or severe pathologies (Down’s syndrome, mucoviscidosis, congenital cardiac disease, cerebral palsy, kidney disease and others)
■ infant’s clinical condition might be detrimental to the completion of the study
■ voluntary discharge ■ non-compliance by parent or
legal guardian ■ any other pathology
contraindicating oral or enteral feeding
General characteristics of participants: Infants aged 3–18 months with severe PEM and who are free of infection and moderate or severe diarrhoea
Primary outcomes: not specifically reported
Outcomes: weight, length, head circumference, arm circumference, triceps, subscapular, subcostal and suprailiac skin fold thickness
Method of assessing outcomes: specialised personnel took care of the infants for the duration of the study. Two observers carried out the measurements
Anthropometric measurements were taken at start of study and once a week for 4 weeks. Blood samples were obtained by antecubital venopuncture at the start of study (at 0700 hours prior to first feed), after 2 weeks and at end of study (see end of table for details)
Weight: taken in a calibrated scale without clothes (Bame model 440, Mexico; with a minimum of 5 g). Before and after each bottle feed, bottles were weighed on a triple-beam balance (Ohaus, Florhand Park, New Jersey)
Length: measured on infant-measuring board (read to the nearest 0.1 cm)
Age and measurements of length and weight, W/A, L/A and W/L, were calculated and expressed as z-scores. Head circumference, arm circumference, and triceps, subscapular, subcostal and suprailiac skin fold thickness were determined with a Lange Skinfold Caliper (Cambridge Scientific Industries, Inc, Cambridge, Maryland)
Definitions:
■ primary PEM: cause of malnutrition was an inadequate and insufficient diet commonly associated with repeated upper respiratory tract infectious disease and/or frequent diarrhoea
■ severe PEM: free of infection and/or moderate or severe episodes of diarrhoea (infants with less than four liquid or semi-liquid stools)
Adverse symptoms: none reported
Length of follow-up: 4 weeks
Recruitment dates: March 1996 to February 1999

© Queen’s Printer and Controller of HMSO 2012. This work was produced by Picot et al. under the terms of a commissioning contract issued by the Secretary of State for Health.
301 Health Technology Assessment 2012; Vol. 16: No. 19DOI: 10.3310/hta16190
Characteristics of participants
Characteristic NT+ (n = 11) NT– (n = 9) p-value
Mean birth weight, g (SD) 2975 (387) 3021 (369) 0.81
Mean age, days (SD) 228 (138) 242 (173) 0.84
Mean age, months (SD) 7.6 (4.6) 8.1 (3.2) NR
Sex, M : F 8 : 3 5 : 4 NR
Mean weight, g (SD) 4246 (1403) 3955 (1250) 0.87
Mean length, cm (SD) 61.1 (8.0) 60.2 (7.7) 0.95
Mean head circumference, cm (SD) 39.7 (3.4) 38.9 (2.1) 0.85
Mean arm circumference, cm (SD) 7.9 (1.1) 7.6 (1.0) 0.44
Mean triceps, mm (SD)a 3.8 (1.0) 2.8 (0.6) 0.031
Mean subscapular, mm (SD)a 2.9 (0.7) 2.4 (0.6) 0.076
Mean subcostal, mm (SD)a 2.3 (0.5) 1.8 (0.3) 0.045
Mean suprailiac, mm (SD)a 2.2 (0.5) 1.7 (0.3) 0.020
Mean total upper arm area, mm2 (SD) 512 (139) 463 (114) 0.54
Mean upper arm muscle area, mm2 (SD) 369 (89) 361 (84) 0.82
Mean upper arm fat area, mm2 (SD) 143 (53) 101 (33) 0.003
Mean arm fat index, % (SD) 27 (4) 22 (2) 0.005
Mean BMI (SD) 11.0 (0.9) 10.6 (1.0) 0.33
W/H mean z-score (SD) –2.80 (0.73) –2.99 ± 0.74 0.001
Results
Outcomes: indicatorb NT+ (n = 11) NT– (n = 9) p-valuec
Mean skin fold, mm (SD)
Triceps
Initial 3.8 (1.0) 2.8 (0.6) 0.031
Fourth week 9.2 (2.6) 8.5 (1.6) 0.517
Subscapular
Initial 2.9 (0.7) 2.4 (0.6) 0.076
Fourth week 8.1 (2.7) 6.4 (1.1) 0.112
Subcostal
Initial 2.3 (0.5) 1.8 (0.3) 0.045
Fourth week 5.5 (1.9) 4.0 (0.6) 0.004
Suprailiac
Initial 2.2 (0.5) 1.7 (0.3) 0.02
Fourth week 5.7 (2.5) 4.2 (0.6) 0.114
Body composition, mean (SD)
Total upper arm area, mm2
Initial 512 (139) 463 (114) 0.54
Fourth week 960 (199) 903 (148) 0.49
Upper arm muscle area, mm2
Initial 369 (89) 361 (84) 0.82
Fourth week 571 (73) 508 (112) 0.83
Upper arm fat area, mm2
Initial 143 (54) 101 (33) 0.003
Fourth week 443 (154) 395 (84) 0.42
Arm fat index, %
Initial 27 (4) 22 (2) 0.005
Fourth week 45 (8) 44 (7) 0.76

302 Appendix 12
BMI, kg/m2
Initial 11.0 (0.9) 10.6 (1.0) 0.33
Fourth week 15.1 (1.0) 14.5 (1.0) 0.23
Mean weight gain, g/day (SD) 67 (15) 69 (12)
W/H mean z-score (SD), fourth week –0.64 (0.66) –0.94 (0.47) 0.001
Comments: both NT+ and NT– showed significant improvement in W/A and W/L indices from the first week; however, p-values were reported for within group differences only. Mean weight gain was similar between groups (no p-value reported)
Paper talks of W/A and W/L, but only outcomes for W/L and L/A are provided (not W/A)
Typical weight gain was five times higher than that of normal infants aged around 8 months and the pace of linear growth was doubled
Other outcomes NT+ (n = 11) NT– (n = 9) p-value
Mean urea concentration, mg/l (SD)
Mean alkaline phosphatase, U/l (SD)
136 (36)
152 (77)
214 (66)
218 (46)
0.009
0.041
Comments: both groups were integrated for initial vs final outcome comparison of creatinine, glucose, calcium and phosphorus levels, showing significant improvements in each for the whole group. The same was true for haemoglobin levels and mean corpuscular volume. There were no significant changes in white blood cell count
Safety: NR
HIV: although not specifically part of the exclusion criteria, two infants with positive HIV tests were excluded
Barriers to implementation
None reported
Methodological comments
Allocation to treatment groups: random assignment into two groups following an arbitrary schedule precisely. When one patient was eliminated, another one was included, receiving the formula that corresponded to the next number in the random sample
Blinding: none reported
Comparability of treatment groups: baseline age, weight and length were similar, although fat stores were slightly higher in the NT+ group. However, apart from significant differences in skin fold, there were also significant baseline differences in upper-arm muscle area, upper-arm fat area and arm fat index between the groups
Method of data analysis: paired Student’s t-tests for the analysis of all initial vs weekly anthropometric indicators (including initial vs final means of the biochemical and haematological indicators). Non-paired Student t-tests were used to compare the anthropometric, biochemical and haematologic mean indicators of group NT+ vs group NT– at different stages in the study. Dbase-IV (Microsoft Corporation, Redmond, WA, USA), Epi Info 6.04 and SPSS/PC programmes were used for capturing, processing and analysing data. Null hypothesis was rejected with a p-value of ≤ 0.05
Sample size/power calculation: sample size calculated at 12 for each group (calculations reported). Authors state that the sample size was large enough to compare both groups, considering they had similar means and SDs in most of the anthropometric indicators at the end of the study. However, after exclusions, number of participants was below the sample size needed
Attrition/dropout: number of exclusions and reasons reported
General comments
Generalisability: only to full-term infants with normal birth weight, with primary and severe PEM aged 3–18 months were included. Generalisability might therefore not extent to older children or to children with below birth weight. Definition of SAM meets the WHO criteria
Outcome measures: outcomes appear appropriate
Intercentre variability: N/A, one centre only
Conflict of interest: none reported
Milk-based infant formulasd NT+ (SMA) NT– (S26)
Nutrients (per litre)
Energy, kJ 2845 2800
Fat, g 36 33.9
Linoleate, g – 7.99
Protein, g 15 14.9
Carbohydrate, g 72 75.9
Mineral salts (ashes), g 2.5 2.0
Sodium, mg 150 156
Potassium, mg 560 659
Chloride, mg 380 429.5
Calcium, mg 420 419.5
Phosphorus, mg 280 210

© Queen’s Printer and Controller of HMSO 2012. This work was produced by Picot et al. under the terms of a commissioning contract issued by the Secretary of State for Health.
303 Health Technology Assessment 2012; Vol. 16: No. 19DOI: 10.3310/hta16190
Vitamin A, IU 2000 1998
Vitamin D, IU 400 400
Vitamin E, IU 19 17.9
Vitamin K, μg 55 54.9
Vitamin C, mg 55 53.9
Thiamin B1, μg 670 400
Riboflavin B2, μg 1000 899
Niacin, μg 5000 4995
Vitamin B6, μg 420 499.5
Folic acid, μg 50 59.9
Pantothenic acid, μg 2100 2992
Vitamin B12, μg 1.3 1.3
Biotin, μg 15 14.6
Choline, mg 100 49.9
Magnesium, mg 35 40
Iron, mg 12 8
Iodine, μg 60 33
Copper, μg 470 413
Zinc, mg 5 5
Manganese, μg 100 46.9
Commercially available formulas with NT (in milligrams per liter) cytidine monophosphate (16.5), uridine monophosphate (5.0), adenosine monophosphate (4.0), guanosine monophosphate (2.0) and inosine monophosphate (2.0) (SMA; 2845 kJ/L); and without NT (S26; 2800 kJ/L). Both formulas, belonging to the same batch, had a similar nutritional content and were within the accepted range for infant formula. The formula was placed in a feeding bag of 500 ml (Pisa; Guadalajara, Jalisco, Mexico), then introduced into a feeding tube (D-731 o 732; Desvar de Mexico, Sociedad Anónima, Mexico) and administered to infants by continuous infusion pump (Braun, Germany)
From day 1: daily oral vitamins (vitamin A 5000 IU, vitamin D 1000 IU, vitamin C 50 mg, thiamin 1 mg, riboflavin 0.8 mg, niacin 6 mg and folic acid 0.5 mg)
During the first 5 days: energy intake = 670 kJ/kg/day, protein intake 3.2 g/kg/day
After day 5: depending on the new weight (kilograms), the energy and protein intake was adjusted to 837 kJ/kg/day and 4 g/kg/day, respectively
From day 6: elemental iron 3 mg/kg daily
Start of third week: infants were fed ad libitum by bottle. The total amount of formula, protein and energy intake was calculated daily. The formula included all the water, energy, proteins and other nutrients required. No other foods were offered during the 4-week nutritional period (infants were started with complementary foods before being discharged)
Laboratory tests: blood samples at start for total proteins, serum albumin, calcium, phosphorus, magnesium, alkaline phosphatase, urea, creatinine, glucose, sodium, potassium, chloride and haemoglobin, as well as urine analysis. The calcium, phosphorus, magnesium and total protein determinations were done by the final point colorimetric method (RA-1000 Technicon; Bayer Diagnostic, Tarrytown, NY); alkaline phosphatase, by an enzymatic method of zero order and a C-405 filter; and haemoglobin, by a modified haemiglobincyanide method (CELL-DYN 3500R; Abbott Laboratories, Diagnostics Division, North Chicago, IL, USA)
IU, international units; L/A, length-for-age; N/A, not applicable; NR, not reported.a Skin fold.b Denotes p < 0.001; initial vs fourth week within each group.c Denotes that some p-values are differences between group. Because of the absence of further notations, it is uncertain which p-values are for
within group and which for between group differences. However, authors state that there were no significant differences between groups at week 4 for total upper arm area, upper arm muscle area, upper arm fat area or arm fat index.
d Powder infant formula; Wyeth de México, Sociedad Anónima de Cuenta variable.

304 Appendix 12
Quality assessment for primary studies (modified for severe malnutrition)
A. Selection bias
1. Are the individuals selected to participate in the study likely to be representative of the target population?
Very likely Somewhat likely Not likely Cannot tell
2. What percentage of selected individuals participated? 80–100% 60–79% < 60% N/A Cannot tell
Summary of selection bias
(Methodological strength of study)
Strong Moderate Weak
B. Study design
1. What was the study design?
(Please tick appropriate and specify design if categorise as ‘Other’)
RCT
CCT
Cohort analytic (two group pre + post)
Case–control
Cohort [one group pre + post (before and after)]
Interrupted time series
Other – specify
Cannot Tell
2. Was the study described as randomised? Yes No
If answer to no. 2 is ‘no’ complete summary then go to section C. Confounders. If answer is ‘yes’, answer no. 3 and no. 4 below, before completing summary for this section
3. If answer was yes, was the method of randomisation described?
Yes No
4. If answer was yes, was the method appropriate? Yes No
Summary of study design
(Methodological strength of study)
Strong Moderate Weak
C. Confounders
1. Were there important differences between groups prior to the intervention?
Yes No Cannot tell
2. If yes, indicate the percentage of relevant confounders that were controlled [either in the design (e.g. by stratification or matching) or in the analysis]?
80–100% 60–79% < 60% Cannot tell
Summary of confounders
(Methodological strength of study)
Strong Moderate Weak
D. Blinding
1. Was the outcome assessor aware of the intervention or exposure status of participants?
Yes No Cannot tell
2. Were the study participants aware of the research question?
Yes No Cannot tell
Summary of blinding
(Methodological strength of study)
Strong Moderate Weak

© Queen’s Printer and Controller of HMSO 2012. This work was produced by Picot et al. under the terms of a commissioning contract issued by the Secretary of State for Health.
305 Health Technology Assessment 2012; Vol. 16: No. 19DOI: 10.3310/hta16190
E. Data collection methods
1. Were data collection tools shown to be valid? Yes No Cannot tell
2. Were data collection tools shown to be reliable? Yes No Cannot tell
Summary of data collection
(Methodological strength of study)
Strong Moderate Weak
F. Withdrawals and dropouts
1. Were withdrawals and dropouts reported in terms of numbers and reasons per group?
Yes No Cannot tell
2. Indicate the percentage of participants completing the study (If the percentage differs by groups, record the lowest)
80–100% 60–79% < 60% Cannot tell
Summary of withdrawals and dropouts
(Methodological strength of study)
Strong Moderate Weak
G. Intervention integrity
1. What percentage of participants received the allocated intervention or exposure of interest?
80–100% 60–79% < 60% Cannot tell
2. Was the consistency of the intervention measured? Yes No Cannot tell
3. Is it likely that subjects received an unintended intervention (contamination or co-intervention) that may influence the results?
Yes No Cannot tell
H. Analysis
1. Indicate the unit of allocation Community Organisation/institution
Practice/office
Provider Patient
2. Indicate the unit of analysis Community Organisation/institution
Practice/office
Provider Patient
3. Are the statistical methods appropriate for the study design?
Yes No Cannot tell
4. Is the analysis performed by intervention allocation status (i.e. ITT) rather than actual intervention received?
Yes No Cannot tell
Global rating for studya
(Overall methodological strength of study – based on sections A–F)
Strong Moderate Weak
N/A, not applicable.a Strong = four strong ratings with no weak ratings; moderate = one weak rating; weak = two or more weak ratings.