The effectiveness of domestic water treatment processes ...
117
The effectiveness of domestic water treatment processes, North West Province, South Africa N Gumbi orcid.org 0000-0002-5075-181x Dissertation accepted in fulfilment of the requirements for the degree Master of Science in Environmental Sciences at the North West University Supervisor: Prof LG Palamuleni Graduation ceremony: April 2020 Student number: 21606765
Transcript of The effectiveness of domestic water treatment processes ...

The effectiveness of domestic water treatment processes, North West Province, South Africa
N Gumbi orcid.org 0000-0002-5075-181x
Dissertation accepted in fulfilment of the requirements for the degree Master of Science in Environmental Sciences at the
North West University
Supervisor: Prof LG Palamuleni
Graduation ceremony: April 2020
Student number: 21606765
i
DECLARATION
I, Nomfundo Gumbi (21606765), declare that this dissertation entitled “The
effectiveness of domestic water treatment processes, North West province, South
Africa” which I herewith submit to the North West University is in compliance with the
requirements set for the Master of Science in Environmental Science degree. This is
my own research work, has been language edited, and has not already been
submitted to any other university.
I understand and accept that the copies that are submitted for examination are the
property of the University.
________________________ __________________
Nomfundo Gumbi Date

ii
DEDICATION
This work is dedicated to my parents, Prof. and Mrs. T. Gumbi, the reason for my
existence.
The family vacations to the Nature and Game Reserves are the reason I fell in love
with the natural environment. I am forever indebted to you, and I will continue to do
more work to make you proud while conserving the beauty of nature.
To my brother Siyabonga and family - Nomalungelo and Khanyisa, this humble work
is a sign of my love to you.
iii
ACKNOWLEDGEMENTS
I would like to express my sincere appreciation and gratitude to the following people
and institutions for their contribution and support towards the completion of this study:
The financial assistance from the North West University (NWU) Staff Discounts, the
Faculty of Natural and Agricultural Sciences, as well as the Department of Geography
and Environmental Sciences is gratefully acknowledged.
Prof. Lobina Palamuleni for her patience, guidance, encouragement, time, support and
valuable input into making this work possible, as well as pushing me to completion.
My designated Department of Chemistry (NWU), the Head of Department, and School
Director for allowing me the opportunity, resources and support throughout my years
of study.
A special gratitude to Ms. Shalene Janse van Rensburg of the Midvaal Water
Company and Ms. Irene Monaisa of the Mahikeng Municipality for their warm
welcome, immense support, and generosity during the site visits.
Mr. Sizwe Loyilani, my colleague, for his help with some lab instruments and words of
encouragement when all seemed impossible.
Dr. Sammy Bett for his assistance with the maps.
Dr. Oziniel Ruzvidzo for proof reading and editing my work.
Lastly, my friends Namhla, Masechaba, and my cousin Zama and all who have played
different roles during my study. The motivation, assistance and support they have
given me is immeasurable.
iv
ABSTRACT
People are increasingly concerned with the quality of water they drink. Globally, there
is still an alarming rate of people who do not have access to basic services such as a
supply of clean drinking water from the faucets. This is greatly concerning because
our natural water reserves are diminishing exponentially as a result of climate change.
Additionally, our water sources are increasingly polluted by anthropogenic activities;
which makes the minority of people who are dependent on direct water source
consumption at a higher health risk. In the Republic of South Africa, municipalities and
independent water boards treat and supply domestic water to urban, semi-urban and
some rural areas. This water is mainly for drinking purposes, hence it must meet the
specified drinking water quality guidelines according to the South African National
Standards (SANS 241) in order to be deemed safe for domestic use. The North West
province, in general, is under-resourced, and made of under-privileged communities.
Most municipalities in the North West are battling to maintain the aging water
infrastructures. Hence, there is a challenge with the water quality, and supply, in
places like Mmabatho.
In this study, all parameters are measured and compared to specified drinking water
quality limits according to the World Health Organisation (WHO) and the Department
of Water Affairs; and then discussed with reference to the national drinking water
standards (SANS 241). Current improvements of analytical methods allow for the
detection of impurities, even at lower concentrations, and make it easier to ascertain
the quality of the water. This study occurred at the water treatment plants of Mmabatho
and Klerksdorp. The plant operators from Mmabatho Water Treatment Plant and
Midvaal Water Company assisted with the collection of water samples from designated
water sampling points; (i) before the treatment process (inlet), and (ii) after the
treatment process (outlet). Sterilised and treated water sampling containers that were
already labelled accordingly, were used to collect water for microbiological analysis.
Sampling containers for chemical analysis were prewashed and oven dried prior to
use. Physical parameters were measured in situ using various hand-held instruments;
while the chemical and microbiological parameters were analysed ex situ using
various laboratory instruments. Data processing, calculations and statistical analysis
of all water quality variables was performed on results using one-way analysis of
v
variance (ANOVA) at 0.05% level of significance with the objective of evaluating the
significant differences among the two study areas as well as the seasonal variations.
At the Midvaal Water Company, in Klerksdorp; the mean values of pH, temperature,
electrical conductivity (EC), turbidity, total dissolved solids (TDS) and total suspended
solids (TSS) before treatment were 8.86, 20.79 °C, 72.00 mS/cm, 21.09 NTU, 451.00
mg/L and 49.40 mg/L. After treatment, the mean values were 7.96, 23.80 °C, 73.75
mS/cm, 0.46 NTU, 482.00 mg/L and 35.75 mg/L. At the Mmabatho Water Treatment
Plant, in Mmabatho; the mean values of the physical parameters: pH, temperature,
EC, turbidity, TDS and TSS before treatment were 8.64, 20.88 °C, 222.25 mS/cm,
23.39 NTU, 428.39 mg/L and 284.27 mg/L. After treatment, the mean values were
8.81, 21.34 °C, 193.25 mS/cm, 6.01 NTU, 240.51 mg/L and 151.32 mg/L. All physical
parameters from Klerksdorp were within specifications. The physical parameters in
Mmabatho were within specifications, except for electrical conductivity and turbidity.
The concentration of major ions nitrate, sulphate, chloride, sodium, magnesium and
calcium before treatment in Klerksdorp were 1.51, 129.48, 50.44, 58.85, 21.22 and
58.51 mg/L. After treatment, the mean concentration were 1.77, 163.42, 54.79, 58.10,
23.87 and 63.69 mg/L. In Mmabatho, the concentration of these major ions before
treatment were 2.66, 150.13, 222.35, 130.38, 26.72 and 172.60 mg/L. After treatment,
ions concentration in Mmabatho were 1.22, 185.51, 226.29, 126.98, 22.67 and 155.67
mg/L. All major ions after treatment were well within specifications at both study areas,
except for high levels of calcium concentration in Mmabatho.
The concentration of free chlorine before treatment in Klerksdorp and Mmabatho was
0.00 mg/L. After treatment, the concentration of free chlorine was 1.49 and 3.87 mg/L
in Klerksdorp and Mmabatho, respectively. These values fall within specified
concentration for free chlorine after treatment. The mean concentration for total
hardness for Klerksdorp and Mmabatho before treatment was 228.71 and 356.94
mg/L, respectively. After treatment, the total hardness was 55.19 and 264.79 mg/L,
respectively. The hardness concentration was high at both sites before treatment,
however, only in Klerksdorp this concentration fell within specifications after treatment.
In Mmabatho, the total hardness concentration remained high. The mean values for
Escherichia coli (E. coli) in Klerksdorp and Mmabatho before treatment were 29.75

vi
and 33.50 CFU/100 mL, respectively. The total coliform detected at both sites before
treatment was 38883.90 and 51190.25 CFU/100 mL, respectively. After treatment,
both E. coli and total coliform were not detected at both study sites.
The overall results for both the study sites after the water treatment process were
comparable with the specified domestic water quality standards according to the
SANS 241, except for the turbidity, electrical conductivity, total hardness and calcium
at the Mmabatho Water Treatment Plant. This suggests that there is more work that
needs to be done to investigate and safeguard the water sources in the North West
province. This, in turn, will make it easier to mitigate and improve the water treatment
processes in Mmabatho.
Keywords: drinking water, physico-chemical, water quality, water treatment
processes, source water pollution.

vii
Table of Contents
CHAPTER ONE ......................................................................................................... 1
INTRODUCTION ........................................................................................................ 1
1.1 Background ....................................................................................................... 1
1.2 Problem statement ............................................................................................ 3
1.3 Justification ....................................................................................................... 4
1.4 Aim and objectives ............................................................................................ 5
1.5 Hypotheses ....................................................................................................... 6
1.6 Description of the study area ............................................................................ 6
1.7 Research ethics .............................................................................................. 10
1.8 Summary ......................................................................................................... 10
1.9 Outline of dissertation chapters ....................................................................... 10
CHAPTER TWO ....................................................................................................... 12
LITERATURE REVIEW ............................................................................................ 12
2.1 Water availability and demand ........................................................................ 12
2.2 Water pollution ................................................................................................ 14
2.2.1 Point and non-point source pollution ......................................................... 16
2.3 Water treatment technology ............................................................................ 17
2.3.1 Conventional methods of water treatment ................................................ 19
2.3.2 Advanced methods of water treatment ..................................................... 20
2.4 Water treatment processes ............................................................................. 21
2.4.1 Coagulation-flocculation ........................................................................... 22
2.4.2 Sedimentation-flotation ............................................................................. 24
2.4.3 Filtration .................................................................................................... 25
2.4.4 Disinfection ............................................................................................... 26
2.4.5 Membrane filtration ................................................................................... 27
2.4.6 Reverse osmosis ...................................................................................... 27
viii
2.4.7 Adsorption and ion exchange ................................................................... 28
2.4.8 Granular activated carbon......................................................................... 28
2.4.9 Ozonation ................................................................................................. 29
2.4.10 UV radiation ............................................................................................ 30
2.4.11 Chemical stabilisation ............................................................................. 30
2.5 Threats to water treatment .............................................................................. 31
2.6 Summary ......................................................................................................... 32
CHAPTER THREE ................................................................................................... 34
METHODOLOGY ..................................................................................................... 34
3.1 Introduction ..................................................................................................... 34
3.2 Research design ............................................................................................. 36
3.3 Sampling sites and points ............................................................................... 37
3.4 Data collection ................................................................................................ 38
3.4.1 Materials and methods ............................................................................. 38
3.4.2 Preliminary data collection ........................................................................ 39
3.4.3 Preparation of sampling equipment .......................................................... 39
3.4.4 Collection of water samples ...................................................................... 40
3.5 Physico-chemical analysis .............................................................................. 41
3.5.1 In situ ........................................................................................................ 41
3.5.2 Cation and anion analysis ......................................................................... 43
3.6 Microbiological analysis .................................................................................. 47
3.6.1 Determination of Escherichia coli and total coliforms (TC) ....................... 47
3.7 Data processing, calculations and statistical analysis ..................................... 47
CHAPTER FOUR ..................................................................................................... 49
RESULTS AND DISCUSSION ................................................................................. 49
4.1 Introduction ..................................................................................................... 49
4.1.1 Water treatment processes ....................................................................... 49
ix
4.2 Water quality analysis ..................................................................................... 50
4.2.1 Physical properties ................................................................................... 51
4.2.2 Chemical properties .................................................................................. 61
4.2.3 Microbiological properties ......................................................................... 72
4.3 Summary ......................................................................................................... 75
CHAPTER FIVE ....................................................................................................... 76
CONCLUSION AND RECOMMENDATIONS ........................................................... 76
5.1 Conclusion ...................................................................................................... 76
5.2 Recommendations .......................................................................................... 78
APPENDICES .......................................................................................................... 96
Appendix 1: Ethical clearance ............................................................................... 96
Appendix 2: Raw data ........................................................................................... 97

x
List of Figures
Figure 1: Map of the North West province and locations of the study sites ............... 6
Figure 2: Map of Mafikeng town showing the sources of water ................................. 8
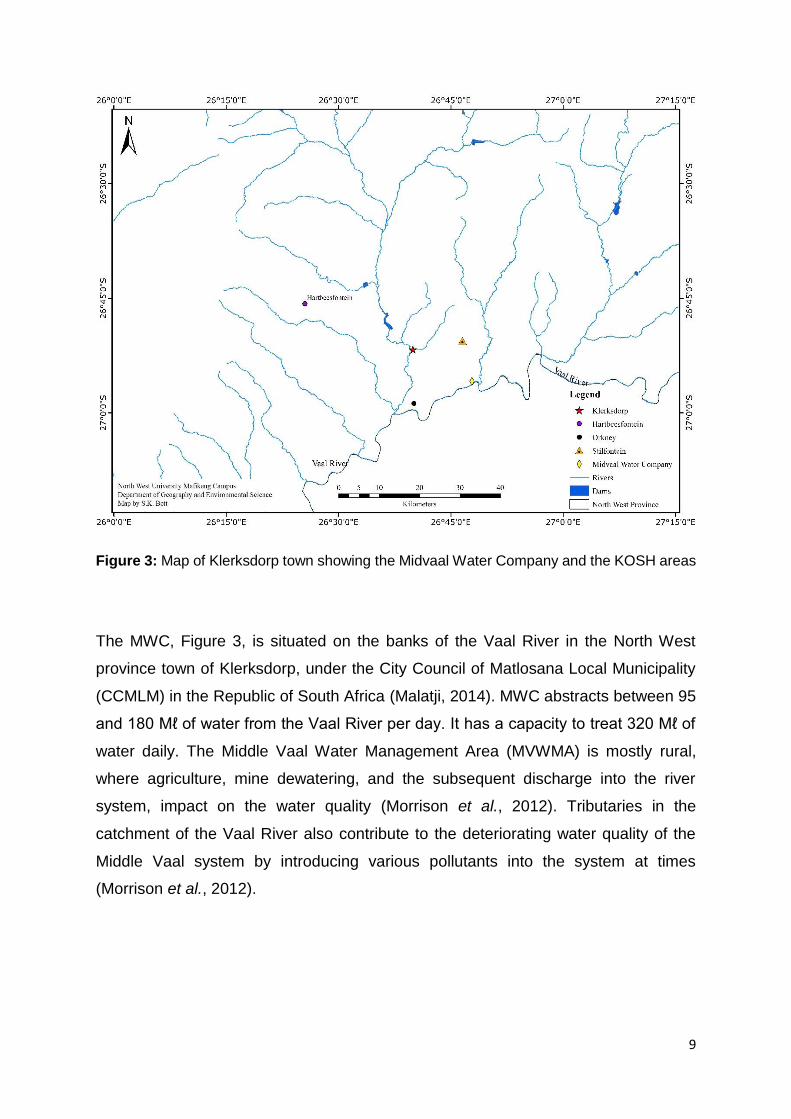
Figure 3: Map of Klerksdorp town showing the Midvaal Water Company and the
KOSH areas ............................................................................................................... 9
Figure 4: A typical layout of water treatment processes .......................................... 20
Figure 5: Schematic diagram of a coagulation process ........................................... 22
Figure 6: Flocculation process in conventional water treatment plants ................... 23
Figure 7: Dissolved air flotation with solid-liquid separation .................................... 24
Figure 8: Major threats to water treatment systems ................................................ 32
Figure 9: Flow chart showing the research design .................................................. 36
Figure 10: Flow chart showing the sequence of the water treatment steps, plus the
sampling points, at Midvaal Water Company ........................................................... 37
Figure 11: Flow chart showing the sequence of the conventional water treatment
steps, and the sampling points used at Mmabatho Water Treatment Plant ............. 38
xi
List of Tables
Table 1: Water quality parameters and analytical methods for water source evaluation.
................................................................................................................................. 35
Table 2: A summary of the water treatment process at Midvaal Water Company from
1954-2015. ............................................................................................................... 50
Table 3: Substances which are general indicators of water quality. ........................ 51
Table 4: Seasonal mean values of electrical conductivity, pH, temperature and TDS.
................................................................................................................................. 54
Table 5: Seasonal mean values of turbidity and total suspended solids (TSS). ...... 59
Table 6: Seasonal mean values of calcium, magnesium and sodium in mg/L. ........ 65
Table 7: Seasonal mean values of the most prevalent anions in mg/L. ................... 68
Table 8: Seasonal mean values of free (residual) chlorine and total hardness (TH) in
mg/L. ........................................................................................................................ 70
Table 9: Seasonal mean values of E. coli and Total coliform (TC) in CFU/100 mL. 73

xii
LIST OF SYMBOLS
% - percent
= - equal to
> - greater than
± - plus or minus
≤ - less than or equal to
µm micrometers
cm - centimetres
cm3 - cubic centimetres
g/m3 - grams per cubic metres
km - kilometres
km2 - square kilometres
M - molarity
mg/dm3 - milligrams per cubic decimetres
Mℓ - mega litres
mL - millilitres
mm - millimetres
mM - millimolar
mS - millisiemens
N - normality

xiii
nm - nanometres
pg/dm3 - picogram per cubic decimetres
ppb - parts per billion
ppm - parts per million
μg/dm3 - microgram per cubic decimetres

xiv
LIST OF ACRONYMS
AAS – Atomic Absorption Spectrometry
ACT – Activated carbon treatment
AMD – Acid mine drainage
APHA – American Public Health Association
BDS – Blue Drop System
BOD – Biochemical oxygen demand
Ca2+ and Mg2+ - Calcium and magnesium ions
CCMLM – City Council of Matlosana Local Municipality
CFU – Colony forming units
COD – Chemical oxygen demand
DAF – Dissolved air flotation
DBPs – Disinfection by-products
DEA – Department of Environmental Affairs
DIW – Distilled/deionised water
DL – Detection limit
DO – Dissolved oxygen
DOC – Dissolved organic carbon
DWA – Department of Water Affairs
DWS – Department of Water and Sanitation

xv
DWTP – Drinking Water Treatment Plant(s)
ECs – Emerging contaminants
EPA – Environmental Protection Agency
EU – European Union
FIB – Faecal indicator bacteria
GAC – Granular activated carbon
HCL – Hollow cathode lamp
HPC – Heterotrophic plate counts
IOCs – Inorganic chemicals
IX – Ion exchange
KCl – Potassium chloride
KOSH – Klerksdorp Orkney Stilfontein Hartebeesfontein
M – Molarity of a solution expressed as moles of solute per litre of solution
MCL – Maximum contaminant level
MPN – Most probable number
MVWMA – Middle Vaal Water Management Area
MWC – Midvaal Water Company
N – Normality of a solution expressed as equivalents per litre of solution
ND – Not detected
NECs – New and emerging contaminant(s)
NEMA – National Environmental Management Act

xvi
NOM – Natural organic material
NTU – Nephelometric turbidity unit
NWA – National Water Act
O3 – Ozone/ozonation
PAC – Powdered activated carbon
POE – Point of entry
POU – Point of use
PPCPs – Pharmaceutical and personal care product(s)
RO – Reverse osmosis
SA – South Africa
SABS – South African Bureau of Standards
SANS – South African National Standards
SD – Standard deviation
TDS – Total dissolved solids
THMs – Trihalomethanes
TOC – Total organic carbon
TSS – Total suspended solids
TTC – Thermo-tolerant coliforms
UK – United Kingdom
UV – Ultra violet
VOCs – Volatile organic compounds

xvii
WHO – World Health Organization
WMA – Water Management Area
WSA – Water Service Authority
1
CHAPTER ONE
INTRODUCTION
1.1 Background
Water is the most vital resource of all living beings (Ali, 2012). The provision of clean
and safe water is critical for sustaining human wellbeing as well as improving
environmental health and people’s livelihoods worldwide (Wanda et al., 2016a). Water
may be of good quality for household use according to the SANS 241, a South African
national standard for drinking water quality, however it may have characteristics that
may give perception that it is of poor quality (DWAF, 1996). For example, tap water
may not taste or smell good; or it may produce noticeable stains on laundry and/or
appliances; or it may have noticeable suspended particles (Water, 2014). Water
assessments tend to emphasise on water quantity, while water quality is equally
critical for satisfying human and environmental needs (Gleick, 2014). Good quality
drinking water must have an eye and taste appeal before we will drink it with much
relish; instinctively we tend to draw back from drinking water that is aesthetically poor
(Cheremisinoff, 2001).
The production of potable water has become a worldwide concern. It is said that less
than 3 percent of the earth’s 330 million cubic miles of water is fresh, and it is very
unevenly distributed across the planet (Roy et al., 2015). It is estimated that over one
billion people around the world are without clean drinking water and approximately 2.3
billion people live in regions with extreme water shortages. As a result of demographic
expansion, many areas in the world face the challenge of meeting the ever-increasing
water demands. This is why water has been dubbed the Blue Gold of the 21st century
(Barlow & Clarke, 2017).
Water scarcity can be a result of natural or human-made phenomenon, however the
latter has become even more prevalent (Liu et al., 2013). Water shortage problems
can be addressed through recycling of municipal greywater for reuse in households;
a practice which is increasing worldwide. However, reclaimed water may be a major
source of biological, chemical, radiological pollutants (Wilcox et al., 2016). Nowadays,
2
water sectors are also battling with a rise of what has been termed “new and emerging”
micropollutants; that include steroid hormones, detergents, personal care products
and pharmaceutical waste products; which have been found to be very resistant and
often survive the water treatment processes (Richardson & Ternes, 2014). These
micropollutants also present an issue of environmental concern when discharged back
into the water source owing to their eco-toxicological effects (Wanda et al., 2016b).
Different methods have been developed and used for water treatment and purification
process over the past decade. The most common and widely used methods are
screening, sand filtration, sedimentation and gravity separation, flotation, flocculation
and coagulation, reverse osmosis, ion exchange and disinfection (Ali, 2012).
In South Africa, water of sufficient quality and quantity is required to meet the basic
human needs as well as the demands of agriculture, industry, conservational, and
ecosystem uses (Matthews & Bernard, 2015). However, our fresh water resources are
rapidly diminishing as a result of high temporal and spatial variable rainfall. This
situation is exacerbated by the increasing water demand, pollution, unsustainable use,
and climate change (Sharma et al., 2019). The Constitution, as the mother-body to all
South African laws and policies, was promulgated in 1996 to transform all sectors
which included political, social, economic and environmental sectors (Monnahela,
2014). In addition to the Constitution, the National Environmental Management Act
(NEMA) provided the Water Services Act 108 of 1997 and National Water Act 36 of
1998 with the aim of managing the use of water resources as well as governing the
quality of potable water in South Africa (Department of Water Affairs & Forestry, 1998).
According to the National Water Act, water must meet certain basic requirements to
make it fit for domestic use. However, many people in the rural areas of South Africa
are still without the basic services such as indoor tap water, and rely on communal
taps for access to clean and safe drinking water. Additionally, Water Service
Authorities (WSA), which are either district and/or local municipalities and
metropolitans, are required to submit information regarding drinking water quality and
management thereof regularly to the national Blue Drop System (BDS).
Since 2009, a trend has emerged in which urban municipalities have shown to
consistently improve their water quality and management whilst some of the rural and
under-resourced municipalities are falling behind (Rivett et al., 2013). A major concern

3
has been that the rural/under-resourced municipalities are failing to report the required
information, and are not complying with some of the regulator’s requirements for water
quality monitoring and management (Faust & Aly, 2018). The problem of withholding
such information is increasing the potential risks related to ecological and human
health impacts (Delpla et al., 2009). Furthermore, to manage and address some of the
challenges associated with water shortages of existing water resources in South Africa
and all over the world, water treatment and reuse has formed an important component
of water management (Hering & Ingold, 2012). The supply of good clean quality water
is an important component that can never be overlooked because it poses an
increased potential risk to human lives especially in smaller communities across South
Africa. Some of the major factors of water management and monitoring efforts are a
direct result of improper treatment procedures, broken and/or ageing water
infrastructures, poor maintenance of equipment, financial constraints, and a lack of
qualified personnel to ensure clean potable water is supplied to communities
(Monnahela, 2014).
1.2 Problem statement
The importance of good-quality, potable water for human existence cannot be under-
estimated, and life will be practically impossible or difficult without the availability of
safe drinking water (Tijani et al., 2013). The primary goal of municipal water treatment
is to supply an adequate quantity of safe potable water to the public. A second and
most essential goal is to make the water palatable (Davis, 2010). Water is deemed
safe to drink when it meets water quality guidelines prescribed by the World Health
Organisation (WHO), as well as country-specific guidelines. In South Africa, the
Department of Water and Sanitation (formerly known as the Department of Water
Affairs) has set water quality guidelines that is fitting to the nature of our water sources.
The quality of water in S.A. is measured against, must comply to, the South African
National Standards (SANS 241 standards) in order to receive a good Blue Drop Score.
Urban municipalities are capable of utilising different modern and sophisticated water
treatment technologies with capacities to treat and remove a variety of contaminants
from water. However, such a luxury cannot be afforded by smaller and rural
4
municipalities (Rivett et al., 2013). The challenge thereof is that rural municipalities will
eventually supply water that has not been properly tested, and therefore does not meet
all the required specifications. The inconsistency in the level of treatment, water quality
and management may be mainly due to a complexity of factors ranging from (1)
political influence, (2) economic factors from smaller rates and taxes paid to limited
operating funds to run the municipality, (3) lack of state-of-the-art resources to treat
and recycle domestic wastewater and raw water from the source, and (4) lack of skilled
personnel. The end result is what is typically less sophisticated and robust water
treatment plants that needs more and expensive maintenance, and hence the water
treatment and monitoring processes are basic and limited (Zanacic et al., 2016).
The community that have experienced palatable water from the cities may be dubious
with drinking water that is hard and looks turbid. Hard water would not necessarily
pose any threat to human health since it is caused by high levels of dissolved minerals
(both calcium and magnesium) in water. In contrast, turbid water may signify the
presence of potentially harmful bacteria in water, hence many people would resort to
buying bottled water when in doubt. In most cases, turbid water would be noticeable
following a water burst in municipal pipes; during or after some extreme weather
changes that cause floods; or when there has been some major maintenance works
in the water treatment plants. This study seeks to assess the effectiveness of domestic
water treatment processes in the North West Province of South Africa.
1.3 Justification
According to the National Water Act No. 36 of 1998, water must meet certain basic
requirements to make it fit for domestic use (Department of Water Affairs & Forestry,
1998). Most surface water sources contain harmful micro-organisms and other harmful
substances that must be removed from the water, at least, to acceptable levels to
make the water fit for drinking and other domestic use. In addition to the requirement
that water must be safe to drink, water for domestic use must also have a pleasing
appearance, and it must furthermore be chemically stable (Chigor et al., 2013).
Effective water treatment processes will not only benefit the end-user/consumers, but
has the potential of enhancing the productivity within the water sector and contribute

5
towards the ecological sustainability and improvement of the entire water environment.
The consumption of untreated and/or poorly treated water may result in waterborne
diseases such as cholera or dysentery if the water source or point-of-water-use water
is contaminated by pathogens (Ngwenya et al., 2013).
Water treatment plants are finding it much harder to treat and remove the different
types of pollution contained in domestic water (Hodgson & Manus, 2006). Since this
study was focused in the North West province, the state of water quality was studied,
and a gap analysis to identify the monitoring needs was undertaken in the province.
The analysis of water quality, before and after treatment, was carried out to indicate
how effective the treatment processes were in producing water that is of a high drinking
quality standard according to WHO, DWA and SANS. The significance of this
comparative study is to make WSA aware of the concerns of the public and
researchers who have no choice but to rely on other sources of drinking water in order
to eliminate potential health risks from drinking poor quality water. This may in turn
indicate that there is a gap in the market, especially for the North West province’s
water treatment plants. The study emphasised the importance of choosing the right
treatment method to remove the type of contamination load in a particular town so that
the entire process minimises potential negative economic, social and environmental
impacts.
1.4 Aim and objectives
The aim of this study is to assess the effectiveness of domestic water treatment
processes in the North West province, South Africa.
The specific objectives of carrying this research are as follows:
Objective 1: To analyse the processes used in two water treatment plants in the
North West province of South Africa;
Objective 2: To analyse the physico-chemical properties of the water; and

6
Objective 3: To investigate the microbiological properties of the water, in
particular, the Escherichia coli and total coliform.
1.5 Hypotheses
Polluted water sources as well as ineffective water treatment works by Mafikeng Local
Municipality in the North West province has led to loss of credibility in the quality of
potable water supplied by the local municipality to their community.
1.6 Description of the study area
The study was focused on two towns; namely Klerksdorp and Mafikeng as shown in
Figure 1, having taken into account the spatial and temporal variations that may
influence the hydrochemistry of water and ultimately the choice of water treatment
(Pratt & Chang, 2012).
Figure 1: Map of the North West province and locations of the study sites
7
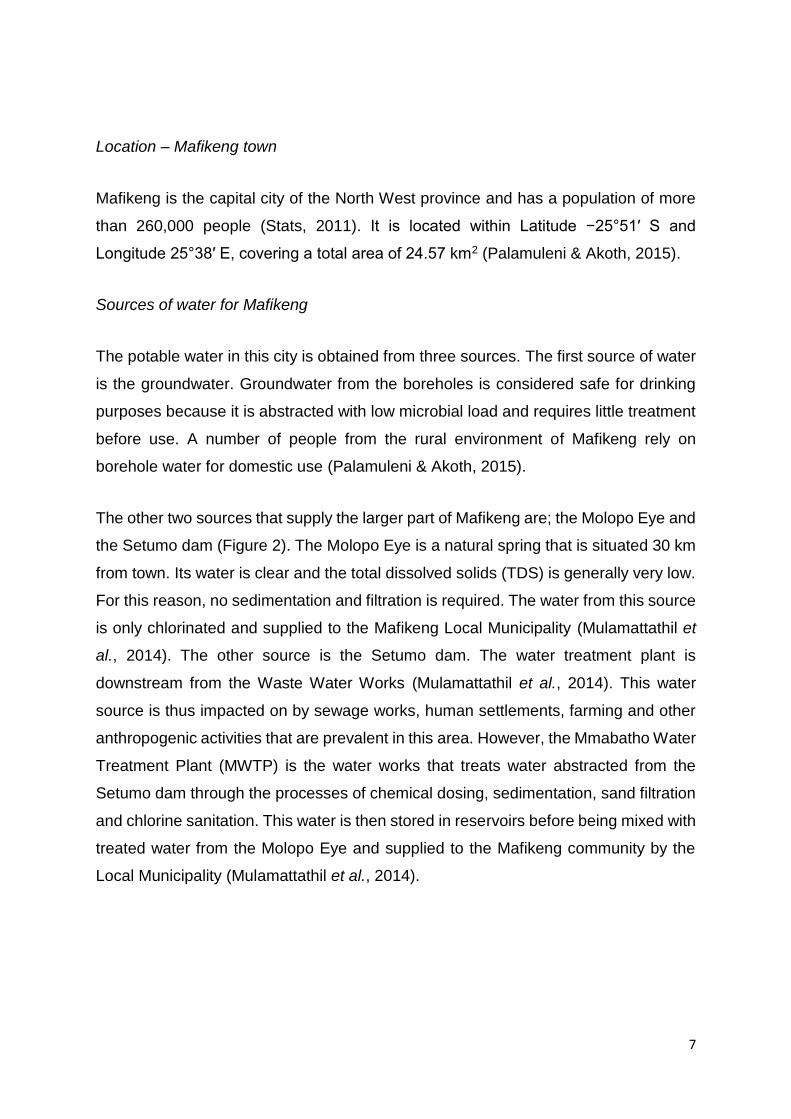
Location – Mafikeng town
Mafikeng is the capital city of the North West province and has a population of more
than 260,000 people (Stats, 2011). It is located within Latitude −25°51′ S and
Longitude 25°38′ E, covering a total area of 24.57 km2 (Palamuleni & Akoth, 2015).
Sources of water for Mafikeng
The potable water in this city is obtained from three sources. The first source of water
is the groundwater. Groundwater from the boreholes is considered safe for drinking
purposes because it is abstracted with low microbial load and requires little treatment
before use. A number of people from the rural environment of Mafikeng rely on
borehole water for domestic use (Palamuleni & Akoth, 2015).
The other two sources that supply the larger part of Mafikeng are; the Molopo Eye and
the Setumo dam (Figure 2). The Molopo Eye is a natural spring that is situated 30 km
from town. Its water is clear and the total dissolved solids (TDS) is generally very low.
For this reason, no sedimentation and filtration is required. The water from this source
is only chlorinated and supplied to the Mafikeng Local Municipality (Mulamattathil et
al., 2014). The other source is the Setumo dam. The water treatment plant is
downstream from the Waste Water Works (Mulamattathil et al., 2014). This water
source is thus impacted on by sewage works, human settlements, farming and other
anthropogenic activities that are prevalent in this area. However, the Mmabatho Water
Treatment Plant (MWTP) is the water works that treats water abstracted from the
Setumo dam through the processes of chemical dosing, sedimentation, sand filtration
and chlorine sanitation. This water is then stored in reservoirs before being mixed with
treated water from the Molopo Eye and supplied to the Mafikeng community by the
Local Municipality (Mulamattathil et al., 2014).
8
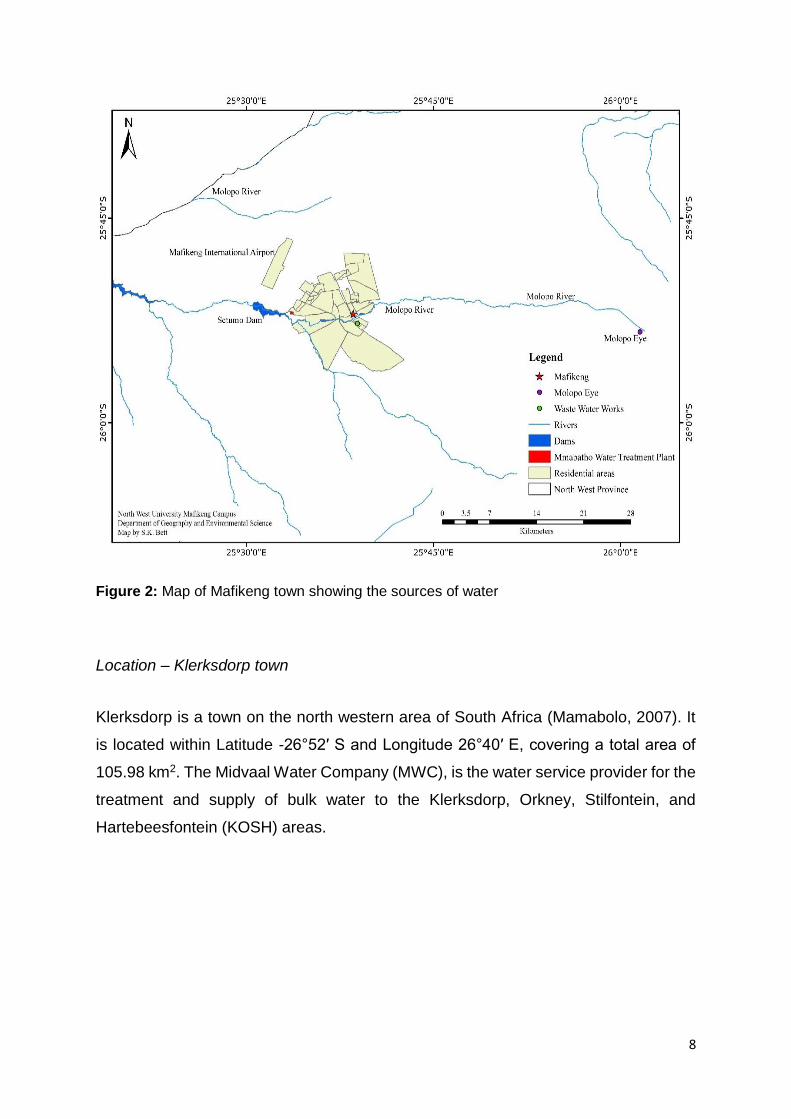
Figure 2: Map of Mafikeng town showing the sources of water
Location – Klerksdorp town
Klerksdorp is a town on the north western area of South Africa (Mamabolo, 2007). It
is located within Latitude -26°52′ S and Longitude 26°40′ E, covering a total area of
105.98 km2. The Midvaal Water Company (MWC), is the water service provider for the
treatment and supply of bulk water to the Klerksdorp, Orkney, Stilfontein, and
Hartebeesfontein (KOSH) areas.
9
Figure 3: Map of Klerksdorp town showing the Midvaal Water Company and the KOSH areas
The MWC, Figure 3, is situated on the banks of the Vaal River in the North West
province town of Klerksdorp, under the City Council of Matlosana Local Municipality
(CCMLM) in the Republic of South Africa (Malatji, 2014). MWC abstracts between 95
and 180 Mℓ of water from the Vaal River per day. It has a capacity to treat 320 Mℓ of
water daily. The Middle Vaal Water Management Area (MVWMA) is mostly rural,
where agriculture, mine dewatering, and the subsequent discharge into the river
system, impact on the water quality (Morrison et al., 2012). Tributaries in the
catchment of the Vaal River also contribute to the deteriorating water quality of the
Middle Vaal system by introducing various pollutants into the system at times
(Morrison et al., 2012).

10
1.7 Research ethics
In order to uphold the various codes of ethics such as honesty, integrity, respect, and
confidentiality that govern research, application for ethical clearance was made to the
North West University ethical clearance committee. This was a requirement in the
fulfilment of a Master’s degree with the North West University. Permission to collect
water samples from the two treatment plants was granted and the findings from the
study are intended for research purposes only.
1.8 Summary
The provision of safe water is critical for sustaining human wellbeing as well as
improving the environmental health and livelihoods of people worldwide. Effective
water treatment processes will not only benefit the end-users or consumers, but has
the potential of enhancing the productivity within the water sector and contribute
towards the ecological sustainability and improvement of the entire water environment.
The municipalities in South Africa are responsible for the treatment and provision of
water services of a specific quality to all respective customers.
1.9 Outline of dissertation chapters
This dissertation is divided into five chapters.
Chapter one outlines a general overview of the research project, study objectives and
description of the study area.
Chapter two lays out the general overview of water works, while looking specifically
into point and non-point sources of pollution, different treatment processes, and water
quality parameters of concern, while also highlighting studies that have demonstrated
the use of various (conventional and advanced) treatment technologies to optimally
remove pollutants.

11
Chapter three gives a detailed description of the sampling sites, laboratory procedures
undertaken to achieve the main aim of this study.
Chapter four presents the results obtained from the analysis while comparing and
discussing the results based on other literature findings.
The conclusions and recommendations from this study are discussed in Chapter five.

12
CHAPTER TWO
LITERATURE REVIEW
2.1 Water availability and demand
Rapid industrial developments coupled with surging population growth have
complicated issues dealing with water scarcity as the quest for clean and sanitised
water intensifies globally. The WHO reports that one sixth of the world’s population
does not have access to safe drinking water (Griggs et al., 2013). Existing fresh water
supplies could be contaminated with organic, inorganic and biological matters that
have potential harm to the society (Choy et al., 2014). The primary objective of any
water supply scheme is to provide clean drinking water to all humans. The earth’s
renewable supply of water for human consumption and the ecosystem is dependent
on the hydrologic cycle (Gleick, 2014). The hydrologic cycle is the system that supplies
the earth’s natural surface water in the form of wetlands, rivers, dams, wells, lakes,
and estuaries. Unfortunately, water quality of most water sources is deteriorating
continuously due to overpopulation, civilisation, geological, environmental and global
changes (Ali, 2012).
Due to the limited annual rainfall, South Africa is considered a semi-arid, and also the
thirtieth driest, country in the world (Duse et al., 2003). The annual rainfall in SA ranges
from 100 mm in the west to 1500 mm in the east; with a mean precipitation of 800 mm
per annum but this is pressured by high evaporation rates as well as highly sporadic
and uneven rainfall patterns in the inland regions (Du Plessis & Schloms, 2017). In
addition, a dynamic growing economy and provision of services which requires
extensive use of water impacts negatively on the available water supplies. The worst
and probably the most devastating is that, no truly large rivers exist in South Africa.
The four main rivers SA has are shared with other African countries (Water, 2014).
Hence, the water quality of the rivers could also be deteriorating fast due to receiving
large quantities of effluent. The major sources of pollution of surface waters are
agricultural drainage and runoff; urban runoff and effluent return flows, industries,
mining, acid mine drainage and rural settlements with insufficient sanitation services
(Khatri & Tyagi, 2015). Moreover, the rate of urbanisation in South African cities has
13
increased due to population growth and a search for better lives and economic
freedom (Stats, 2011). For example, in the Gauteng province, many people from within
South Africa as well as other African countries leave their homes in search for jobs,
hence Johannesburg city is now water stressed. Cape Town, on the other hand, has
experienced minimal rainfall in the recent years, and the city is now in a dire state of
drought, coupled with water use restrictions (Ahjum et al., 2015). Although Durban
receives enough rain throughout the year, the city’s municipality is also water stressed
due to over-population by people migrating from other cities to live and/or retire by the
coastal region. Water treatment and recycling may be the only alternative for getting
and sustaining fresh water sources in the coming decades. For that reason, there is a
great need for the development of suitable, inexpensive and efficient wastewater
treatment techniques and reuse or conservation methods in this present century
(Gupta et al., 2012).
Water treatment plants are the key component of such water supply schemes that
transform the raw water into potable water by using the appropriate treatment
processes. The selection of the treatment process depends upon the raw water quality
as well as the finished water quality objectives (Bonton et al., 2012). Water treatment
plants can either be conventional or advanced in design and operation. A conventional
water treatment or purification process, which is used by most water companies, will
involve the following stages: aeration, coagulation, flocculation, sedimentation,
stabilisation, filtration and disinfection (Ewerts et al., 2014). More water industries are
realising the need to use alternative water treatment methods such as membrane
processes, ozonation and UV disinfection in order to meet the increasing demand for
cleaner potable water production (Qu et al., 2013). Similar to domestic water
treatment, the treatment processes used for water and wastewater reclamation, reuse
and recycling can be of a physical, biological or chemical nature, and they also depend
on the type of treatment and reuse options to be achieved in the process (Gadipelly et
al., 2014). A detailed discussion of the water treatment processes is found in section
2.3 of this dissertation. Influent and effluent quality of municipal, industrial or mine
wastewater treatment plants play significant roles in influencing the overall ecology of
receiving water bodies. The importance of wastewater as a resource, and the adoption
of advanced treatment solutions and resource utilisation in the long term highlights a
step towards sustainable water resource management (Sun et al., 2016). Peng and

14
Zhang (2012) argued that the worldwide water crisis facing most countries no longer
requires new water sources, but rather how to use the available water resources
sustainably. This is the reason water treatment and water recycling has become a
crucial element in order to make water fit for all domestic use.
2.2 Water pollution
Water is mainly referred to as polluted when it is impaired by both anthropogenic and
natural contaminants and becomes unable to support human uses such as drinking,
and/or undergoes a marked shift in its ability to support its constituent biotic
communities, such as fishes. One major environmental issue affecting the quality of
inland and coastal waters is eutrophication caused by excessive presence of dissolved
inorganic nutrients (Zamyadi et al., 2013). Algal bloom and oxygen depletion are still
reported in many water bodies worldwide. Agricultural activities are responsible for
large scale water quality degradation and are estimated to contribute around 55
percent of the nitrogen entering the surface water resources. However, natural
phenomena like volcanoes, algae blooms, storms, and earthquakes may also cause
major changes in water quality and ecological status of water (Harikumar et al., 2017).
Rivers, channels, lakes, oceans, and groundwater are often contaminated by a variety
of organic and inorganic substances that can affect aquatic life and threaten human
health (Rivera-Utrilla et al., 2013). For instance, water pollution that come from
industry, agriculture or households, returns negatively back to the environment.
Chemical and mining wastes such as arsenic, fluorides, lead, nitrates, sulphates,
pesticides, petro-chemicals and acid mine water have negative effect on living
organism in water and subsequently on human health (Alrumman et al., 2016). Acid
mine drainage (AMD) is still a huge and most threatening challenge for water sources
since it has continued to linger for decades after the closure of gold mines (Humby,
2013). For this reason, groundwater, rivers, lakes, streams and dams in and around
the Gauteng province are still fairly affected notwithstanding years of clean-up. This is
more evident from the persistent algal growth at Hartbeespoort Dam, Vaal Dam as
well as the entire Vaal River, which runs across the Mpumalanga, Gauteng, Free
State, North West and Northern Cape provinces, affecting the catchments around it
(Paerl & Otten, 2013). The effects of water pollution are varied and depend on the kind

15
of chemicals dumped and their locations. Pollutants such as lead and cadmium are
consumed by tiny animals which cascade to the higher levels of the food chain.
Several countries have sought to regulate the discharges of pollutants in the water to
minimise the impacts of pollution through various treatments (Alrumman et al., 2016).
Recent research reveals the presence of a multitude of micropollutants, termed new
and emerging contaminants (NECs), which affect water resources significantly
(Rodriguez-Narvaez et al., 2017). These pollutants can be detected at extremely low
concentrations of picogram per litre to microgram per litre range (Mkwate et al., 2017).
NECs are natural or synthetically occurring substances not commonly monitored in
the environment and having known or suspected undesirable effects on humans and
the ecosystem. An example of these type of substances are pharmaceutical and
personal care products (PPCPs), pesticides, and hormones that have adverse effects
on human and wildlife endocrine systems (Mkwate et al., 2017). Antibiotics are not
effectively removed by modern-day water treatment processes, hence they are a
growing threat to ecosystem and human health. The emergence, and continual
production, of such organic and toxic compounds have become a matter of concern
as they may result in the induction and spread of bacterial resistance which may be
harmful to humans and/or animals if continually found in aquatic environment (Rivera-
Utrilla et al., 2013).
The WHO guidelines for drinking water quality recommend that faecal indicator
bacteria (FIB), preferably Escherichia coli or thermo-tolerant coliform (TTC), should
not be detectable in any 100 mL of drinking water sample (Edition, 2011). However, it
is estimated that 1.8 billion people globally use a source of drinking water which suffers
from faecal contamination. Drinking water is found to be more often contaminated in
rural areas than in urban areas, and contamination is most prevalent in Africa and
South East Asia (Bain et al., 2014). Water contamination with coliform bacteria was
the main source of waterborne diseases like gastroenteritis, dysentery, diarrhoea and
viral hepatitis as complained by most of the respondents during questionnaire survey
conducted Charsadda district, Pakistan (Khan et al., 2013).
16
2.2.1 Point and non-point source pollution
The information age has ushered in a global awareness of complex environmental
problems that do not respect political or physical boundaries; such as climate change,
ozone layer depletion, deforestation, desertification, and pollution (Axelrod &
VanDeveer, 2014). Among these global environmental issues are point and non-point
sources of pollution which represent a perfect example of a complex multidisciplinary
problem that exists over multiple scales with tremendous spatial and temporal
complexity.
2.2.1.1 Point sources of water pollution
Point sources of pollution are the major causes of degradation of ecosystems, and
may have significant effects on human health if they are not properly controlled (Sun
et al., 2016). They can be classified in terms of sources, the discharged media, and
the pollutants themselves. The sources include municipal and industrial sector
activities, and the media include water, air, and solids (Axelrod & VanDeveer, 2014).
A point source of pollution discharges to the environment from an identifiable location,
whereas a non-point source of pollution enters the environment from a widespread
area (Gleick, 2014). The ability to accurately assess present and future point and non-
point source pollution impacts on ecosystems ranging from local to global scales
provides a powerful tool for environmental stewardship and guiding future human
activities (Tietenberg & Lewis, 2016).
Surface water quality, for example river water, is strongly influenced by land use. Most
water pollutants such as particles, nutrients and metals show a significantly positive
correlation with the percentage of construction land (Gleick, 2014). Crop land cover,
however, may have a more complex relationship with water quality. The increase of
farm land coverage was found to increase the concentrations of both nitrate and
sulphate ion in some case studies, but no influence in others (Gleick, 2014). Other
emerging types of land use, such as nursery garden and urban green land, have
received relatively little attention in research on water quality and their effects could
be underestimated (Tietenberg & Lewis, 2016). Previous studies have shown that land
use close to a river was a better predictor of water quality than the spatial pattern of
17
the entire watershed (Wu & Chen, 2013). In addition, in many regions with flat relief
and canals, it is impossible to clearly delineate the watershed boundary (Davis, 2010).
2.2.1.2 Non-point sources of water pollution
Metal pollution from diffuse sources to natural waters is more difficult to control than
metals from point-sources (Gleick, 2014). The widespread use of metals in
construction materials, batteries, vehicles, personal care products, clothing, and many
other materials leads to moderate contamination of watersheds in populated and
industrialised areas. Wastewater treatment effluent, combined sewer overflows, and
urban runoff all contain elevated concentrations of metals that are very difficult to
control. Control of metals in an upstream manufacturing process can reduce metals
loads effluent (Davis, 2010).
2.3 Water treatment technology
The basic goal of water treatment is to remove undesired constituents from water (Qu
et al., 2013). New and improved treatment technologies are emerging all the time,
however their operational cost and maintenance are unsustainable especially for large
scale water treatment (Marlow et al., 2013). Water treatment requires physical,
chemical and sometimes biological processes to remove contaminants. The various
unit processes are critical to the overall process efficiency since each unit has a
specific purpose (Gavrilescu et al., 2015). Potable water treatment plants use the
physical and chemical processes, while wastewater treatment plants normally use the
biological processes (Spellman, 2013).
In a conventional or traditional water treatment, the physical processes used include
flocculation, sedimentation, filtration, adsorption, and disinfection by UV light, while the
chemical processes for potable water treatment will include oxidation, coagulation and
disinfection (Parsons & Jefferson, 2006). The types and order of processes used will
depend on the state of the source water, the kind of contaminants that must be
removed, the concentrations of contaminants and the water quality standards that
must be achieved. Adsorption is the most effective and widely used water treatment

18
method for the removal of organic and persistent organic pollutants (Ali, 2014). The
design for adsorption technology will depend on raw water quality, pollution load and
the preliminary treatment results. An example of an adsorbent of choice is the
activated carbon which has long been used for water and wastewater treatment due
to its good capacity for adsorption (Ali, 2014).
A study by Plappally (2012) explains the stages for water recycling and reuse in
relation to energy consumption. The significance of this study is that it emphasises the
importance of choosing the right processes in the production of water so that the entire
process minimises economic and environmental impacts. It also explains why water
treatment processes will differ from one area to another (Plappally, 2012). The water
life cycle starts with production or extraction of water from natural sources such as
ground water aquifers, lakes, rivers, and oceans. Fresh water from lakes and rivers
normally requires treatment for the removal of micro-organisms and suspended solids
such as sand or silt. Algae and cyanobacteria (phytoplankton) form part of organic
suspended matter in water (Ewerts et al., 2014). Phytoplankton cells such as the
dinoflagellate Ceratim hirundinella are known to cause major water purification
problems, especially during bloom forming periods (Ewerts et al., 2014). In some
cases, advanced methods of treatment would be needed to remove organic
compounds, dissolved ions, and/or in the case of ground water, absorbed gases. The
importance of each stage in the water cycle is distinct and is also significantly affected
by variations in the geographical location being served, water availability there, the
local climate, the culture and customs of the area, and the economic status of the
location (Plappally, 2012).
Treated water is used in different ways by various customers in the residential,
commercial, industrial and agricultural sectors (Jensen et al., 2014). For example,
residential customers usually pump water for domestic use (washing and cooking),
while agricultural consumers pump water to irrigate fields. Treated water may also
become polluted at the point-of-use (POU) and thus require some treatment before it
can be consumed. There may be a chance that the faucet has accumulated
microbiological agents, hence it is always recommended that consumers run the
communal taps for at least five minutes before they can draw water for drinking
purposes (Harvey et al., 2016). POU treatment processes can be used at home, in the
19
field, and in emergency situations. The main objective of this kind of treatment is to
produce clear and microbiologically safe water. The processes used are relatively
simple processes such as boiling water, or adding chlorine in the form of bleach, or
exposing the water to sunlight (Sobsey et al., 2008).
2.3.1 Conventional methods of water treatment
Safe drinking water is essential to the health and welfare of a community and water
from all sources must have some form of purification before consumption (Saritha et
al., 2017). Various methods are used to make water safe and attractive to the
consumer. The method employed depends upon balancing a few factors, including
intake water characteristics, the volume of water needed, and target water quality. One
of the problems with treatment of surface water is the large seasonal variation in
turbidity (Padmaja et al., 2014).
Different water treatment processes are used in sequence in order to produce drinking
water of a desired quality (Ewerts et al., 2014). A conventional water treatment and
purification process includes a series of physical and chemical steps that when applied
to raw water sources contribute to the reduction of microorganisms of public health
concern (Korotta-Gamage & Sathasivan, 2017). A general example of a purification
process would be; an oxidation process followed by sedimentation and filtration
process. The oxidation process causes the dissolved contaminants to form a
precipitate, which is then removed by filtration (Parsons & Jefferson, 2006).
All raw natural water contains suspended particles which need to be removed. In a
conventional water purification works, suspended matter is removed in sedimentation
tank and sand filters after coagulation and flocculation (Figure 4). The primary aim of
coagulation and flocculation is to remove suspended and dissolved particles that may
be undesirable in the final effluent (Ewerts et al., 2014). Very seldom, the water
distributed may need further treatment at the POU. This may involve, for example
softening of hard water by means of a home ion exchanger, or treatment by some
other home treatment device. In some areas, for example in the rural areas, rainwater
is collected from rooftops and stored in tanks before use (Visvanathan et al., 2015).
The water may be treated by means of a filter or used without any treatment at all.

20
Provision is often made that the first water collected from the roof is diverted from the
tank in order to prevent dirt and debris from entering the tank. In some systems water
is supplied without any treatment at all (Padmaja et al., 2014). For example, where
water is fetched directly from a source by the individual user or by vendors, the water
is often consumed without any treatment (Cheremisinoff, 2001). Consuming surface
water without treatment is a dangerous practice that may result in contracting diseases
such as cholera if the water source is contaminated by pathogens (Gleick, 2014).
Detailed discussions of conventional water treatment processes will be discussed in
sections 2.4.1 to 2.4.4.
Figure 4: A typical layout of water treatment processes
Source: Karki, 2018.
2.3.2 Advanced methods of water treatment
The intensity of water resource scarcity in South Africa, as well as the rest of the world,
is forcing water companies to utilise advanced water treatment processes in order to
purify every available water source, even a river, reservoir or wetland with water that
looks like pea soup, or one clogged from bank to bank with aquatic plants (Morrison

21
et al., 2012). Some micropollutants, more especially the emerging contaminants, are
particularly more resistant to removal and inactivation by conventional water treatment
processes. Therefore, extensive research has been focused on the optimisation of
water treatment processes and application of new technologies in order to reduce the
concentrations of viable and/or infectious micropollutants to a level that prevents
diseases (Betancourt & Rose, 2004). The advanced water treatment processes are
discussed in sections 2.4.5 to 2.4.11.
2.4 Water treatment processes
The primary purpose of water treatment is to provide drinking water that is free of
biological, chemical and physical contaminants. Since there is no single treatment
process that can be expected to completely remove all the different types of
contaminants found in water, under all conditions, multiple barriers are desirable. The
number of treatment methods required is influenced by the quality of the source water
(Benner et al., 2013). For example, groundwater will normally require very minimal
treatment, if any, since they are protected from the surface influence. However, low-
land surface water will mostly require much more treatment processes because of the
poorer source water quality. Hence, selecting an appropriate treatment process is a
critical step, influenced by many environmental factors, in providing safe and reliable
drinking water quality (Marlow et al., 2013). There is also a need to collect and analyse
raw water quality data for an extended period of time, sufficient to show seasonal and
extreme events, to make sound decisions on the most appropriate and effective water
treatment processes.
Traditionally, there are four stages involved in domestic water treatment. The first
stage is called pre-treatment, where screens are used to remove the large debris and
objects from the water supply (Faust & Aly, 2018). Aeration can also be used in the
pre-treatment phase. This stage also improves colour, taste and odour of drinking
water. The second stage in water treatment process involves coagulation and
flocculation. A coagulating agent that is added to water will cause the suspended
particles to clump together into flocs which can be easily removed as they settle,
forming a precipitate, into the sedimentation basins. This step will allow clarified water
22
to flow through the process, and into the third stage, which is the filtration (Faust &
Aly, 2018). Filtration is the process whereby smaller particles not removed by
flocculation are removed by running the water through a series of filters. Filter media
can include sand, reverse osmosis, adsorbent, ion exchange, granulated carbon, or
any activated carbon filter effective enough to remove the salt particles and biological
microorganisms in water (Padmaja et al., 2014). Following filtration is the final stage,
the disinfection process. Water is finally disinfected to kill, disable or inactivate any
microbes or viruses that could potentially make the consumer sick. The most
traditional disinfection methods used are chlorination by the use of chlorine gas or
chloramines. However, new drinking water disinfection methods are constantly coming
into the market. The two disinfection methods that have been gaining traction use
ozone and ultra-violet radiation to disinfect the water supply (Cheremisinoff, 2019).
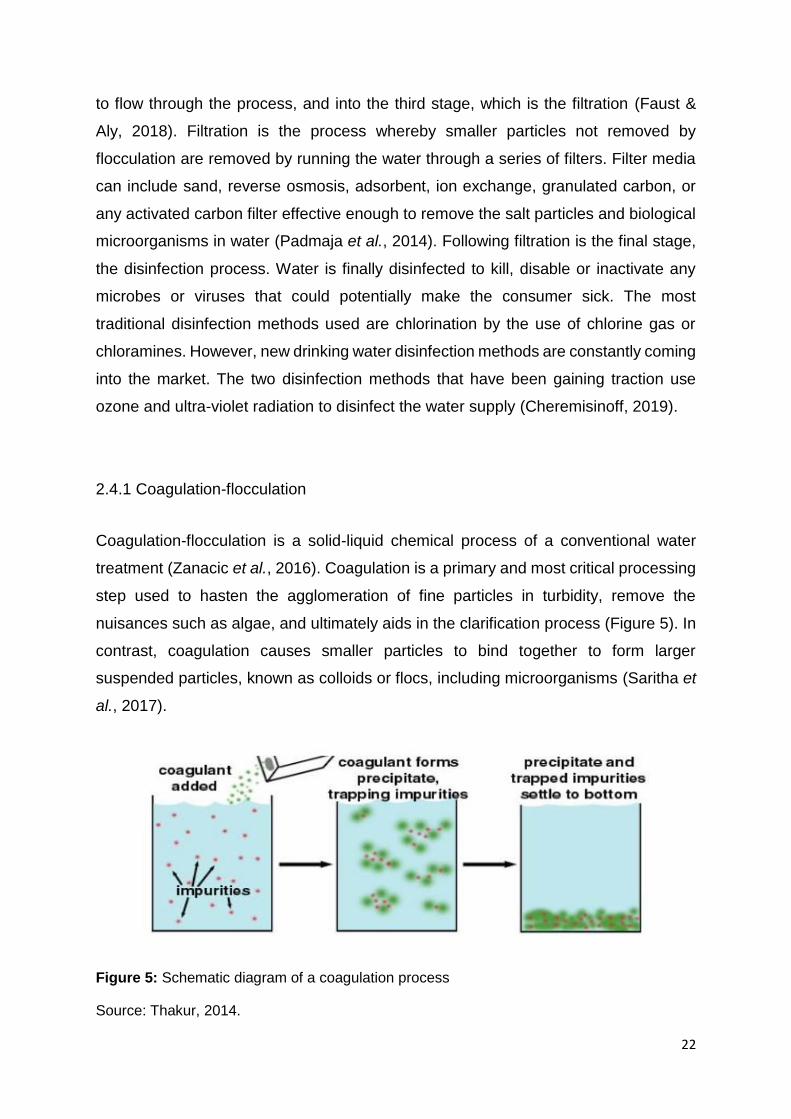
2.4.1 Coagulation-flocculation
Coagulation-flocculation is a solid-liquid chemical process of a conventional water
treatment (Zanacic et al., 2016). Coagulation is a primary and most critical processing
step used to hasten the agglomeration of fine particles in turbidity, remove the
nuisances such as algae, and ultimately aids in the clarification process (Figure 5). In
contrast, coagulation causes smaller particles to bind together to form larger
suspended particles, known as colloids or flocs, including microorganisms (Saritha et
al., 2017).
Figure 5: Schematic diagram of a coagulation process
Source: Thakur, 2014.

23
Flocculation is the process that gathers together the fine particles in water, by the
gentle mixing, after the addition of coagulant chemicals (Zanacic et al., 2016). The
destabilised suspended particles clump together to form larger flocs. At this stage, the
flow rate of water is high enough to discourage the settling of flock within the spiral
flocculators, but low enough to encourage flock formation (Figure 6).
Figure 6: Flocculation process in conventional water treatment plants
Source: Chinyama et al., 2014.
The most common coagulants in use throughout the world are aluminium sulphate,
ferric sulphate, ferric chloride and poly-aluminium chloride (Javid et al., 2015). The
coagulant is mixed with water in order to produce a hydroxide precipitate that is “fluffy”
and enmesh particles along with some of the dissolved organic carbon (Marlow et al.,
2013). The large floc particles that are formed are subsequently removed by
sedimentation or by direct filtration. It is essential that the removal of micro-organisms
and particulate matter should be as complete as possible before disinfection such that
the need for high disinfectant doses, and the cost of disinfection, is reduced (Haute et
al., 2015). This will also limit the formation of disinfection by-products. Factors that
influence coagulation–flocculation process are, among others, temperature, pH,
effluent quality, dosage and coagulant type (Saritha et al., 2017). Since suspended
particles often vary considerably in source, composition charge, particle size, shape
and density; the correct application of coagulation-flocculation process, as well as the

24
selection of the coagulants would normally depend upon understanding the interaction
between all these factors. It is therefore imperative for relevant stakeholders to fully
comprehend the technicalities involved when considering the coagulants for
rural/underprivileged domestic water treatment facilities, where cost limit are a factor
(Saritha et al., 2017).
2.4.2 Sedimentation-flotation
Simple sedimentation without the use of coagulants may be used to reduce turbidity
and solids in suspension (Khiadani et al., 2014). Sedimentation tanks are designed to
reduce the velocity of flow of water so as to permit suspended solids to settle under
gravity. An alternative technique to that of sedimentation is flotation. Flotation is
achieved by several methods but the most effective form is dissolved air flotation.
Dissolved air flotation (DAF) allows for the removal of fragile floc particles found in
water treatment via adherence to air bubbles (Betancourt & Rose, 2004). The gas
bubbles attach to the particles and make their effective density lower than that of the
water. This causes the large particles, or the sludge, to rise and float at the surface
(Figure 7). The advantage of flotation over sedimentation are that very small or light
particles, particularly fats, oils, and grease, that settle slowly can be removed more
efficiently by the use of a skimmer (Cheremisinoff, 2019).
Figure 7: Dissolved air flotation with solid-liquid separation
Source: Khiadani et al., 2014.

25
2.4.3 Filtration
Filtration is the physical removal of turbidity and microorganisms from water
(Shanmuganathan et al., 2017). Filters within a conventional water treatment process
are considered as the last barrier to the release of particles into the distribution system.
During filtration, water passes through a pore-like structure made up of a variety of
bed materials that can be composed of, a bed of sand or gravel also known as sand
filtration; a layer of diatomaceous earth also known as diatomaceous earth filtration;
or a combination of coarse anthracite coal overlying finer sand, known as dual and tri-
media filtration (Zanacic et al., 2016). The water to be treated flows down through the
filter bed and, as it does so, a layer a few millimetres thick of algae, plankton and other
microscopic plant life forms on the top. The removal of particles in suspension occurs
by straining through the pores in the filter bed, by adsorption of the particles to the filter
grains, by sedimentation of particles while in the media pores, by coagulation while
traveling through the pores, and by biological mechanisms such as slow sand filtration
(Zahrim & Hilal, 2013). The latter is accomplished by the filtering action of the
schmutzdecke. The schmutzdecke is the top layer, a few centimetres in depth, of sand
and particulate materials such as fine soil particles, plant debris, algae, free-living or
non-pathogenic protozoa that have been removed from the water as it percolates
downward through the sand filter bed (Hoslett et al., 2018).
When the rate of filtration begins to tail off after a month or two, the filter is drained
and the top 2 cm of sand is removed to be replaced by fresh sand (Zanacic et al.,
2016). Slow sand filters are expensive to build and operate, and require a large amount
of space. They cannot be used for coagulated waters because of rapid clogging. Slow
sand filters have been largely replaced by rapid gravity sand filters, which are
particularly effective for water treated with coagulants and are less expensive than
slow sand filters (Divrikli et al., 2007). The filter is cleaned at intervals of 24–48 hours
by pumping water and air, to assist in scouring, under pressure backwards through
the filter to wash out the trapped impurities. This process is called backwashing. Unlike
slow sand filters which tend to produce water with a particularly low bacterial count,
26
rapid filters produce water with high bacterial counts, increasing the necessity to follow
them with disinfection before supplying the water to the public (Boleda et al., 2011).
2.4.4 Disinfection
Before water can be passed into the public supply, it is necessary to remove all
potentially pathogenic micro-organisms (Delpla & Rodriguez, 2017). Water suppliers
must assume that all surface waters contain E. coli and treat the water accordingly.
However, by definition disinfection does not usually inactivate every last cell of micro-
organisms that are present; it may rather reduce concentrations to acceptable levels
for which disease risk is very low (Byrne et al., 2015). Since these micro-organisms
are extremely small, it is not possible to guarantee their complete removal by
sedimentation and filtration, so the water must be disinfected to ensure its quality.
Disinfection is the inactivation of pathogenic organisms and is not to be confused with
sterilisation, which is the destruction of all organisms (Momba et al., 2009).
Water disinfection is accomplished with chemical or physical disinfectants (Momba et
al., 2009). Worldwide, the most common disinfectant used in water supply is chlorine;
as a gas or hypochlorite; but other chemical disinfectants such as chloramine, chlorine
dioxide, and ozone are also used. Chlorine acts as a strong oxidising agent which can
penetrate microbial cells, killing the micro-organisms. It is known to kill most bacteria
but not all viruses. It is relatively cheap and extremely soluble in water, up to 7000
g/m3 (Zanacic et al., 2016). Unfortunately, chlorine comes with some disadvantages.
It can give alter the taste and give odour problems to water. For example, in the
presence of organic compounds, chlorine reacts to form carcinogenic disinfection by-
products such as trihalomethanes (Betancourt & Rose, 2004). In South Africa,
trihalomethanes (THMs) are regulated organic pollutants with a limit of 200 µg/L
according to the drinking water quality guidelines by DWA (DWAF, 1996). Thus, there
is a need to monitor the presence of these undesirable pollutants in water systems
and remove them before they reach the consumers (Betancourt & Rose, 2004). The
advanced water treatment process was discussed in the preceding sections.

27
2.4.5 Membrane filtration
Membrane filtration is becoming popular in water treatment processes for the removal
of micropollutants such as trace organic compounds, trace heavy metals, and
microbiological compounds such as pesticides. Pesticides, which are often
carcinogenic, are not at all desirable in potable water. According to the SANS 241, an
allowable limit for individual pesticides is less than, or equal to 0.1 micrograms per litre
of water (DWAF, 1996).
Membrane filtration is an important enrichment technique for separating trace metal
ions and microbiological components in water (Divrikli et al., 2007). The formation of
hydrophobic species is necessary for the quantitative extraction of the desired trace
elements on the membrane filter. The collection of trace metal ions is performed very
quickly by filtration under suction with the aid of a vacuum aspirator (Divrikli et al.,
2007). The collected trace elements are dissolved together with the membrane in a
small amount of mineral acid. The trace ions in the final solution are determined by
analytical laboratory instruments. The most attractive features of membrane filtration
technique are the simplicity and rapidity of the procedure, an easily attainable high
concentration factor and determination with high-precision (Divrikli et al., 2007).
Pressure-driven membrane processes are also used in water treatment processes to
control and remove disinfection by-products (DBPs), pathogens, inorganic and
synthetic organic chemicals, respectively (Holloway et al., 2016).
2.4.6 Reverse osmosis
Reverse osmosis (RO) is another technique that has become popular in water
treatment for the removal of pollutants such as trace organics and salts; and it is worth
considering for nitrate removal (Holloway et al., 2016). When a solution of a salt is
separated from pure water by a semi-permeable membrane that permits the passage
of pure water but prevents that of the salt, water will tend to diffuse through the
membrane into the salt solution, continuously diluting it. This phenomenon is called
osmosis (Holloway et al., 2016). If the salt solution is in an enclosed vessel, a pressure
will be developed. This pressure in a particular solution is known as the osmotic
28
pressure of that solution. Reverse osmosis is therefore a process in which water is
separated from dissolved salts in a solution by filtering through a semi-permeable
membrane at a pressure greater than the osmotic pressure caused by the dissolved
salts in the water (Holloway et al., 2016). The salts to be eliminated could be in any
form, including nitrates. The removal rates in excess of 93 percent for nitrates have
been reported for RO technology (Holloway et al., 2016). Furthermore, operating costs
and space requirements for RO are said to be much less than of an equivalent ion
exchange (IX) water treatment plant.
2.4.7 Adsorption and ion exchange
Ion exchange (IX) is used in some water treatment plants to remove nitrates from
drinking water (Ali, 2014). In this process, water is passed through an IX resin which
removes the undesired ions and replaces them with ions which do not affect the water
quality. This technology for nitrate removal was developed from water softening
systems which were used to remove the hardness conferring ions, Ca2+ and Mg2+ (Ali,
2014). For example, the Vaal Dam in South Africa has a high concentration of blue-
green algae during the summer months. This type of algae produces an odorous
substance called “geosmin” which causes an unpleasant taste to linger on in water
even after coagulation and the entire treatment process. An imported and expensive
chemical called powdered activated carbon (PAC) is added to the water to adjust the
taste and smell of the finished product (Korotta-Gamage & Sathasivan, 2017).
2.4.8 Granular activated carbon
After conventional treatment, water may still contain trace concentrations of synthetic
organic compounds, which, if left in the water, can lead to taste and odour problems
(Ang et al., 2015). The problem is most likely to arise where the raw water source has
been badly polluted. The problem can be solved by including the process of granular
activated carbon adsorption after the filtration process (Ang et al., 2015). Activated
carbon is treatment by carbon which has been activated by heating in the absence of
oxygen. This results in the formation of many pores within each carbon particle, which

29
has more adsorbent characteristics. Charcoal is a form of activated carbon but with
fewer pores. Granular activated carbon (GAC) is known to be an effective adsorbent
material of organic compounds. Its effectiveness can be measured by the reduction in
the chemical oxygen demand (COD), which is the oxygen needed to chemically
oxidise all carbonaceous material present, and the total organic carbon (TOC) of water
(Ang et al., 2015). GAC can be used in a water treatment process for the removal of
soluble phenols which produce strong smelling and tasting chlorophenols upon
reaction with chlorine in the disinfection stage. In the event that trihalomethanes
(THMs) are formed after disinfection by chlorine, GAC can be used to eliminate these
toxic compounds. GAC, once exhausted, can be regenerated by heat treatment (Ang
et al., 2015).
Another method of removing trace organics is to oxidise them to harmless products
such as carbon dioxide by using ozone (Ang et al., 2015). Ozone oxidation and
activated carbon are capable of removing trace quantities of organic pollutants, such
as pesticides, present in water supplies to comply with the limit specified by the EU
and WHO (Ang et al., 2015). Powdered activated carbon (PAC) can also be added to
water for the adsorption of trace organic contaminants. It has also been used to
eliminate tastes and odours in drinking water brought about by algae, actinomycetes
and fungi. It is usually added in the coagulation stage prior to sand filtration. Unlike
GAC, the regeneration of PAC is not practicable, so it is only used when intermittent
water quality problems occur (Ang et al., 2015).
2.4.9 Ozonation
The ozone, (O3), used in water treatment plants is usually generated by passing dry
air or oxygen between plates, across which a high voltage is imposed (Rivera-Utrilla
et al., 2013). Ozonation is an expensive technology; and the necessary equipment to
produce the method is complex. However, ozone which is a blue gas; and a very
strong oxidising agent, has recently become a popular disinfecting agent as it is
particularly more effective against viruses and spores (Rivera-Utrilla et al., 2013). In
the United Kingdom (UK), it is often used to oxidise any pesticide residuals present in
water treatment. Also, the ozonation process does not produce the toxic by-products
30
such as THMs which can occur with chlorine. It can, however, form toxic bromates if
bromine is present in the water (Rivera-Utrilla et al., 2013). Ozonation is particularly
popular in European water treatment plants because many water suppliers in Europe
source water from rivers that contain organic substances that can be destroyed by
ozone without forming the toxic organochlorines. The only drawback with ozone is that
it is not possible to have a residual level, as there is for chlorine, to confer protection
in the supply and distribution system. Ozone will break down to oxygen very rapidly
when any particles are present in water. However, if water is ultra-clean, it will remain
as O3. Hence, after ozonation, the water is chlorinated before it goes into the supply
system (Rivera-Utrilla et al., 2013).
2.4.10 UV radiation
Ultraviolet radiation is also a powerful disinfecting agent, and is becoming increasingly
popular in New Zealand and other countries, particularly for inactivating protozoa,
again in part because organochlorine by-products are avoided (Stanfield et al., 2003).
There is also increasing interest in natural solar disinfection of water, particularly in
developing countries where infrastructure for water disinfection is unavailable or has
been damaged, but sunlight is abundant (Rivera-Utrilla et al., 2013). Although UV
radiation can be used to disinfect water, care must be taken to ensure that no
suspended solids are present which could shield the micro-organisms and prevent
them from being destroyed. UV systems are generally only used in small-scale water
treatment units. Similar to ozonation, UV radiation do not give a residual for protection
in the distribution system (Lee & Park, 2013).
2.4.11 Chemical stabilisation
Post-treatment stabilisation is an important process for aesthetic quality of water and
public health and cost-effective operation of the treatment plant. Priority issues relating
to post-treatment stabilisation are scaling and corrosion control, as well as water
quality goals (Jensen et al., 2014). Corrosion is one of the most apparent problems in
the drinking water industry. Corrosive pipes are in the exposure of microbial

31
contamination and elevated water metal concentrations such as iron, zinc, copper,
manganese, lead, selenium, and arsenic that in addition to endangering the health of
people, cause consumer complaints due to the smell, taste and colour of the water
(Asghari et al., 2018). In water distribution networks, corrosion causes entrance of
various substances into the water body; and the occurrence of the toxic metals such
as lead (Pb) and cadmium (Cd) is attributable almost entirely to leaching caused by
corrosion of plumbing materials (Tchounwou et al., 2012). Copper, iron, and zinc may
cause staining of plumbing fixtures and sometimes a metallic taste on water.
Plant operators use three parameters to control and generate more stable water,
which is: pH, alkalinity and hardness. Each of these parameters possess unique
properties that can enhance the quality and stability of the water as it travels from the
treatment plant through the distribution system (Gitis & Hankins, 2018). Proper
stabilisation of aggressive water can also extend the life of the plumbing fixtures and
distribution system, hence lowering operating cost by reducing excessive scaling,
corrosion and its damaging effects. Ineffective chemical stabilisation may also
increase the risk of bacterial or viral regrowth in water (Faust & Aly, 2018).
2.5 Threats to water treatment
The rapid changes in human lifestyles over the years have consistently added different
notorious anthropogenic pollutants in the aquatic systems (Das et al., 2014).
Eradication of these newly emerging deleterious pollutants is either impossible or
difficult using the classical water treatment systems. Major threats to common water
purification systems are summarised in Figure 8. This clearly reflects that a single
method is insufficient to remove all pollutants from water (Das et al., 2014). For
instance, the pathogen removal processes of conventional water treatment plants may
affect the effluent water quality parameters, such as turbidity, pH and temperature,
and further decrease pathogen sensing ability (Das et al., 2014). Certain bacteria in
treated water may release toxins, which may seriously affect the overall quality of
water during the treatment process. For example, cyanobacteria release microcystin
toxin in water while undergoing the treatment process. Low concentration and small
dimensions of pollutants are difficult to sense and mitigate (Das et al., 2014).

32
Figure 8: Major threats to water treatment systems
Source: Das et al., 2014.
2.6 Summary
There are various processes and technologies used to remove contaminants from
water and to improve the quality of water in many parts of the world. The major and
most crucial steps are common to both conventional and non-conventional (advanced)
processes; which are the coagulation-flocculation, filtration and disinfection stages.
There have been studies to find cost-effective and efficient ways to remove
contaminants in drinking water, for example, the development of effective membrane
filters, as well as the use of environmental catalysts in water treatment. The most
critical stage is the final, in which most water treatment plants need to be aware of the
possibility for the formation of carcinogenic by-products as a result of the chlorination
process if organics are present in the water being disinfected. However, if the water
has been previously treated by coagulation-flocculation and pre-ozonation, the
33
chances of organic pollutants being present to form these harmful by-products are
remote. Hence the additional use of filters is more preferred for the effective removal
of trace organics. There is evidence that the choice of a water treatment process
depends upon the type of the raw water source and the cost of the treatment method.

34
CHAPTER THREE
METHODOLOGY
3.1 Introduction
In water-scarce environments, surface water bodies serve both as water sources and
waste disposal channels. The Molopo River that drains through Mafikeng, South
Africa, has been dammed for agricultural and municipal water supply, resulting in four
reservoirs near Mafikeng. It receives municipal waste water discharges from point
pollution source sewage processing plants. Molopo River is the main water source for
Mafikeng Municipal water supply, having been purified through Mmabatho Water
Treatment Plant. A spatial variation analysis conducted by Munyati (2015) revealed a
manifestation of eutrophic and hypertrophic in the reservoir water around July, the dry
season where river flow is at its lowest. The Matlosana Municipality, in Klerksdorp,
gets water supply through the Midvaal Water Company. The Midvaal, as the name
suggests, is situated at the middle of the stretch of the Vaal River. The quality of the
river water varies seasonally as the river is affected by extensive activities upstream,
hence it contains numerous types of algae and other nuisance water plants as a result
of the high levels of phosphates and nitrates. This study is aimed at assessing the
effectiveness of the drinking water treatment processes at the Mmabatho and Midvaal
water plants. This was done by analysing the different treatment processes used by
the two facilities, and lastly by determining the water quality produced by the two plants
by analysing the physico-chemical and microbiological constituents of water samples
at specific points of the treatment process. Table 1 summarises the water quality
variables that were measured, and the analytical methods used to determine the water
quality at each site.
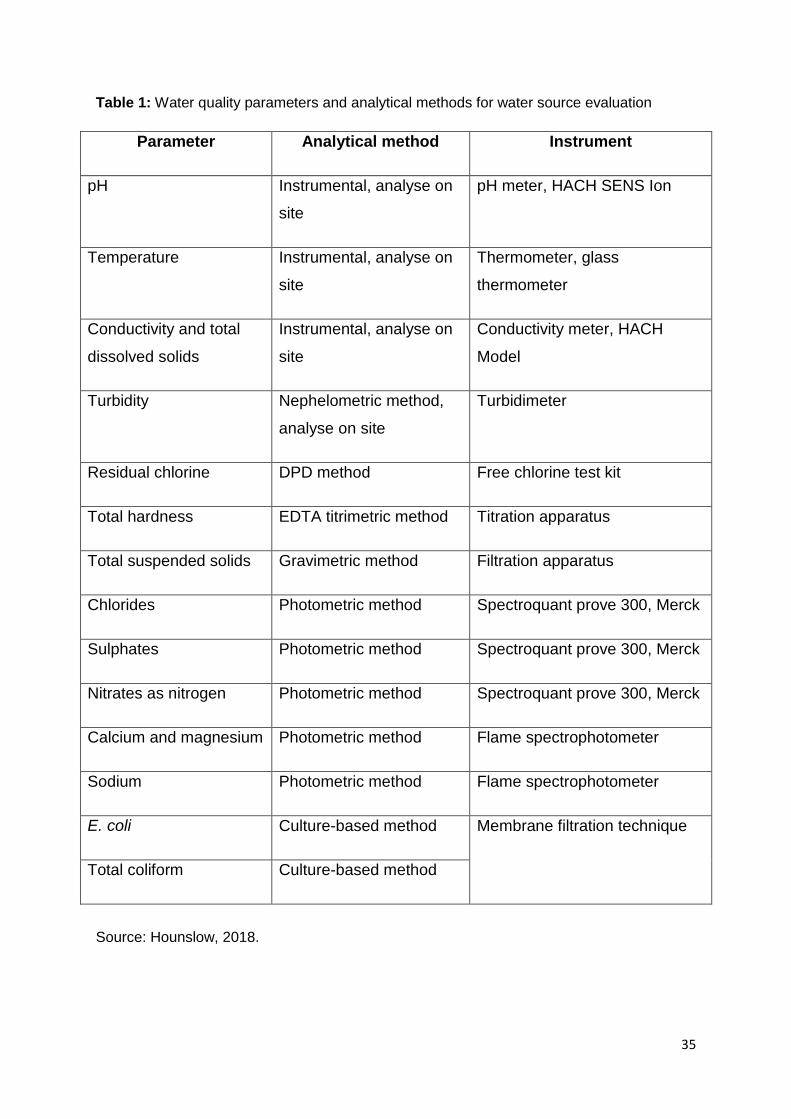
35
Table 1: Water quality parameters and analytical methods for water source evaluation
Parameter Analytical method Instrument
pH Instrumental, analyse on
site
pH meter, HACH SENS Ion
Temperature Instrumental, analyse on
site
Thermometer, glass
thermometer
Conductivity and total
dissolved solids
Instrumental, analyse on
site
Conductivity meter, HACH
Model
Turbidity Nephelometric method,
analyse on site
Turbidimeter
Residual chlorine DPD method Free chlorine test kit
Total hardness EDTA titrimetric method Titration apparatus
Total suspended solids Gravimetric method Filtration apparatus
Chlorides Photometric method Spectroquant prove 300, Merck
Sulphates Photometric method Spectroquant prove 300, Merck
Nitrates as nitrogen Photometric method Spectroquant prove 300, Merck
Calcium and magnesium Photometric method Flame spectrophotometer
Sodium Photometric method Flame spectrophotometer
E. coli Culture-based method Membrane filtration technique
Total coliform Culture-based method
Source: Hounslow, 2018.

36
Refer to sections 3.3, 3.4, 3.5 and 3.6 for an overview of the sampling regime that was
followed as well as materials and methods that were used to determine the water
quality variables.
3.2 Research design
The research process most suited for the study was a quantitative experimental
approach. Most water quality analyses cannot be done on site, i.e. in situ. Therefore,
a representative volume of water, at specific points of interest, were collected for
analysis in the laboratory, i.e. ex situ (Schutte, 2001). The research design followed is
illustrated in Figure 9.
Figure 9: Flow chart showing the research design
Identify
sample sites
Collect &
analyse
samples
Gather data
& interpret
Visit sites
Collect
background info
Collect samples
Analyse samples
Compare
results with
standard limits
Compute data
Draw correlation
graphs
Statistical
analysis &
interpretation
of data
Discussion
and
conclusion
Note different
water
treatment
technologies
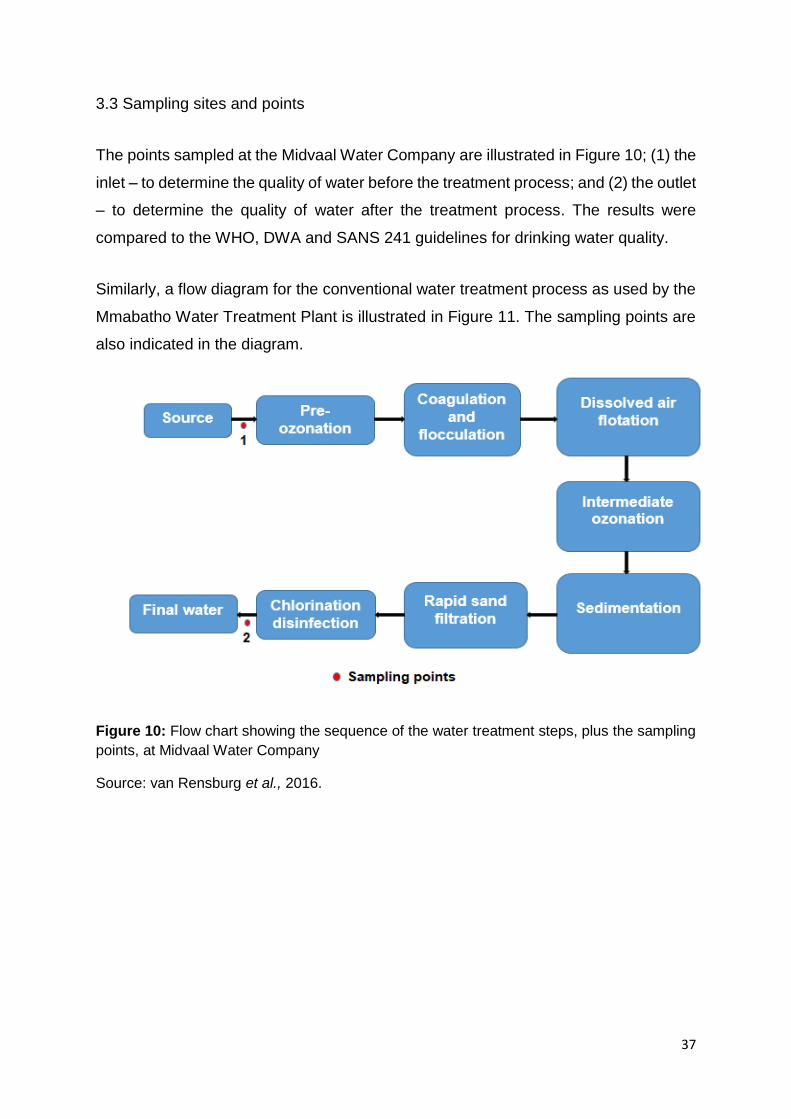
37
3.3 Sampling sites and points
The points sampled at the Midvaal Water Company are illustrated in Figure 10; (1) the
inlet – to determine the quality of water before the treatment process; and (2) the outlet
– to determine the quality of water after the treatment process. The results were
compared to the WHO, DWA and SANS 241 guidelines for drinking water quality.
Similarly, a flow diagram for the conventional water treatment process as used by the
Mmabatho Water Treatment Plant is illustrated in Figure 11. The sampling points are
also indicated in the diagram.
Figure 10: Flow chart showing the sequence of the water treatment steps, plus the sampling
points, at Midvaal Water Company
Source: van Rensburg et al., 2016.

38
Figure 11: Flow chart showing the sequence of the conventional water treatment steps, and
the sampling points used at Mmabatho Water Treatment Plant
Source: Kawamura, 2000.
3.4 Data collection
3.4.1 Materials and methods
Analytical grade reagents and standards were used throughout this study, according
to the methods of water analysis in the preceding section 3.5; and were obtained from
Merck Chemicals (South Africa). Unless otherwise indicated by the DWA analysis
guide, ultra-pure or type 1 deionised water was used to prepare and dilute all
standards and water samples. All field apparatus and laboratory instruments used
were calibrated according to manufacturer’s instructions. Furthermore, the glassware

39
were of A-grade and were washed and treated according to the standard guide
(Schutte, 2001).
3.4.2 Preliminary data collection
The first step involved a field trip to the sites to learn the different water treatment
processes employed at the two study areas and the motivation towards the selection
of their treatment processes. Furthermore, the baseline information pertaining the
source water; the general characteristics of the water source; as well as the quality of
the water was obtained before gathering individual site data. The sample locations
were also identified with the assistance of plant operators. Sampling and analysis
using environmental analytical instrumentation were scheduled for the months
between December 2017 and November 2018 to cover the different seasonal
variables.
3.4.3 Preparation of sampling equipment
Sampling equipment checklist was obtained and checked before every sampling trip
to ensure that all necessary equipment was brought along. Specific hand-held
equipment used to determine the physical constituents such as pH, electrical
conductivity, temperature, turbidity and free chlorine were calibrated in advance.
Twelve new polypropylene bottles (1000 cm3) and their caps were washed in warm
soapy water, and rinsed three times with distilled water. Only the six bottles for
microbiological sampling were further sterilised, and treated with 10% sodium
thiosulfate solution (i.e. 0.1 cm3/100 cm3 sample), which is a preservation method used
to neutralise further disinfection process of the water sample. All bottles were tightly
sealed with caps, to prevent contamination, and labelled accordingly to indicate
sample location, sample number, and date of sampling (Keith, 2017).

40
3.4.4 Collection of water samples
The collection of samples for various analysis was performed with the assistance of
plant operators at designated points. Six batches of 1000 cubic centimetres (cm3) per
site were collected, labelled, preserved and analysed according to the relevant guides
outlined in the Quality of Domestic Water Supplies, Volume 3, Analysis Guide by the
Department of Water Affairs (DWA) and Water Research Commission (WRC).
3.4.4.1 Sample collection and preservation – microbiological analysis
Samples for microbiological analysis were collected first. The faucets were sterilised
by wiping with a disinfecting wipe. The taps were then allowed to run water fully for at
least 5 minutes to remove any stagnant water from the system. The water flow was
adjusted to a normal flow before the collection of each sample. As a precautionary
measure, the sample containers were handled at the base to prevent contamination
of the sample. With the free hand, the cap of the sample container was carefully
removed, and water filled to the line, ensuring that water does not overflow from the
container. The container cap was replaced tightly, and the sample placed in the cooler
box filled with ice to maintain the temperature at 4 °C until delivery to the lab for further
analysis of faecal and total coliforms within 24 hours (Keith, 2017).
3.4.4.2 Sample collection and preservation – chemical analysis
For chemical analysis, the sample containers and their caps were rinsed 3 times
before the water flow was reduced to allow for the collection of the sample at
reasonable flow. No preservation was necessary for samples for chemical analysis,
therefore the sample containers were filled to the top, and caps put tightly with no air
gap (Keith, 2017). Samples were immediately put in the cooler box filled with ice to
maintain the temperature of 4 °C until delivery to the Chemistry lab for further analysis
of selected chemicals. These included the most abundant anions and cations in water
such as nitrates (NO3-), sulphates (SO4
2-), chlorides (Cl-), calcium (Ca+), magnesium

41
(Mg2+), and sodium (Na+); as well as other important determinants in domestic water
quality like free chlorine, total suspended solids (TSS), and total hardness (TH).
3.5 Physico-chemical analysis
A range of different analytical methods were used to gather data on physical and
chemical determinants of the various sampling points. Laboratory instruments and
hand held apparatus were used to measure and compare the related water
parameters. It should also be noted that calibration of equipment was done to ensure
accuracy and reliability of test results.
3.5.1 In situ
The parameters that were measured in situ included temperature, pH, conductivity,
total dissolved solids (TDS), turbidity and residual chlorine (as free chlorine). The
equipment, as mentioned in section 3.4.1, were first calibrated following the
manufacturers’ guidelines before analysis took place.
3.5.1.1 Temperature measurement
Approximately 100 cm3 of water was obtained. A small A-grade beaker and the glass
thermometer were rinsed three times using a portion of distilled water, followed by the
water sample. A glass thermometer was immersed into a sufficient volume of the
representative water sample, and held 1 centimetre (cm) away from the sides and the
bottom of the beaker, for approximately 1 minute. The readings were recorded to the
nearest 0.1 °C.
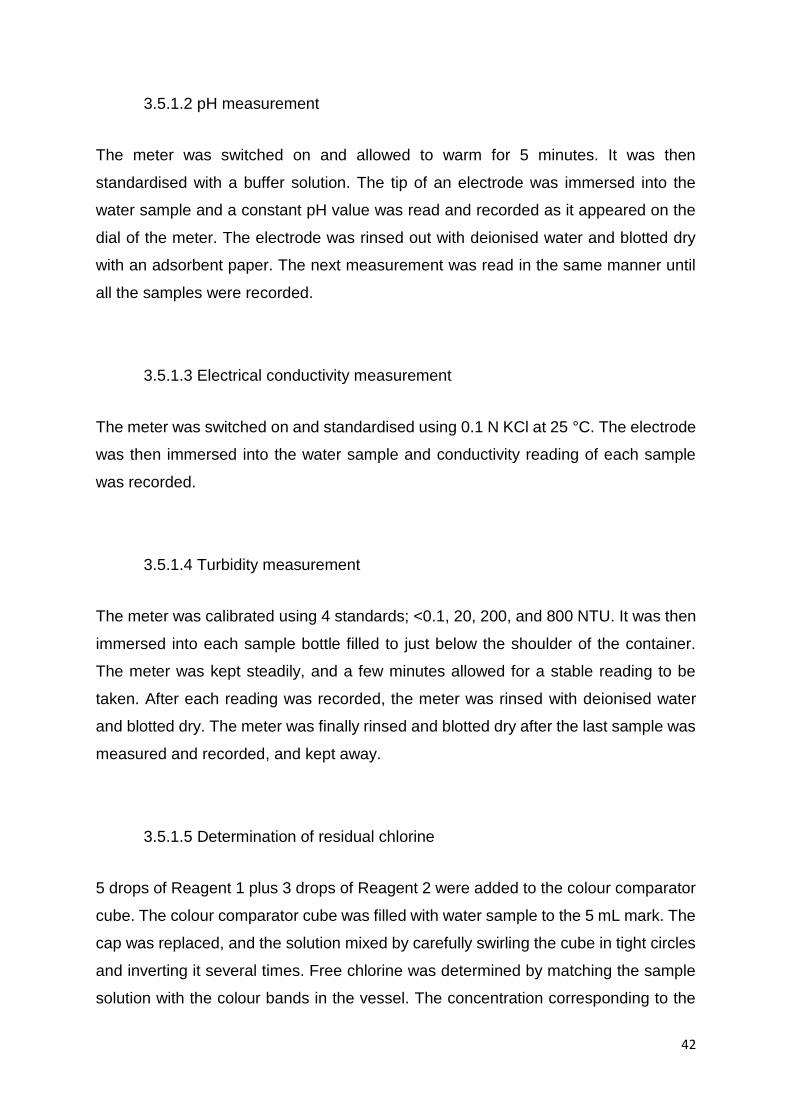
42
3.5.1.2 pH measurement
The meter was switched on and allowed to warm for 5 minutes. It was then
standardised with a buffer solution. The tip of an electrode was immersed into the
water sample and a constant pH value was read and recorded as it appeared on the
dial of the meter. The electrode was rinsed out with deionised water and blotted dry
with an adsorbent paper. The next measurement was read in the same manner until
all the samples were recorded.
3.5.1.3 Electrical conductivity measurement
The meter was switched on and standardised using 0.1 N KCl at 25 °C. The electrode
was then immersed into the water sample and conductivity reading of each sample
was recorded.
3.5.1.4 Turbidity measurement
The meter was calibrated using 4 standards; <0.1, 20, 200, and 800 NTU. It was then
immersed into each sample bottle filled to just below the shoulder of the container.
The meter was kept steadily, and a few minutes allowed for a stable reading to be
taken. After each reading was recorded, the meter was rinsed with deionised water
and blotted dry. The meter was finally rinsed and blotted dry after the last sample was
measured and recorded, and kept away.
3.5.1.5 Determination of residual chlorine
5 drops of Reagent 1 plus 3 drops of Reagent 2 were added to the colour comparator
cube. The colour comparator cube was filled with water sample to the 5 mL mark. The
cap was replaced, and the solution mixed by carefully swirling the cube in tight circles
and inverting it several times. Free chlorine was determined by matching the sample
solution with the colour bands in the vessel. The concentration corresponding to the
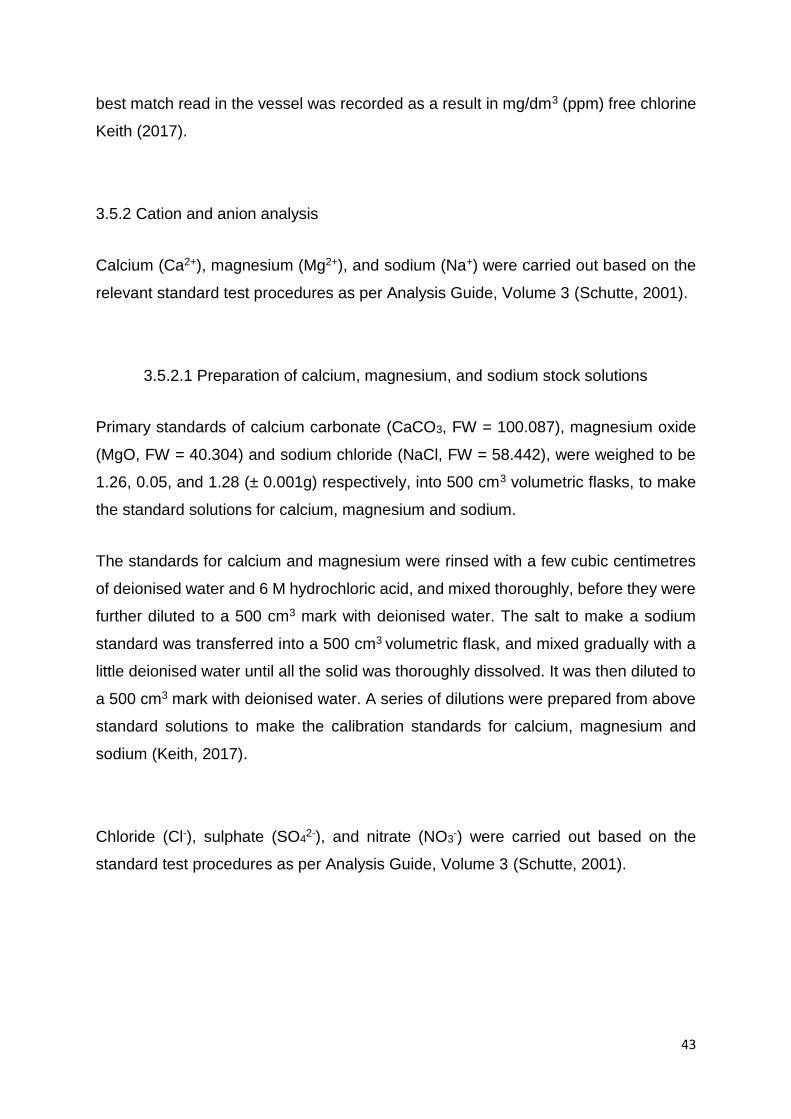
43
best match read in the vessel was recorded as a result in mg/dm3 (ppm) free chlorine
Keith (2017).
3.5.2 Cation and anion analysis
Calcium (Ca2+), magnesium (Mg2+), and sodium (Na+) were carried out based on the
relevant standard test procedures as per Analysis Guide, Volume 3 (Schutte, 2001).
3.5.2.1 Preparation of calcium, magnesium, and sodium stock solutions
Primary standards of calcium carbonate (CaCO3, FW = 100.087), magnesium oxide
(MgO, FW = 40.304) and sodium chloride (NaCl, FW = 58.442), were weighed to be
1.26, 0.05, and 1.28 (± 0.001g) respectively, into 500 cm3 volumetric flasks, to make
the standard solutions for calcium, magnesium and sodium.
The standards for calcium and magnesium were rinsed with a few cubic centimetres
of deionised water and 6 M hydrochloric acid, and mixed thoroughly, before they were
further diluted to a 500 cm3 mark with deionised water. The salt to make a sodium
standard was transferred into a 500 cm3 volumetric flask, and mixed gradually with a
little deionised water until all the solid was thoroughly dissolved. It was then diluted to
a 500 cm3 mark with deionised water. A series of dilutions were prepared from above
standard solutions to make the calibration standards for calcium, magnesium and
sodium (Keith, 2017).
Chloride (Cl-), sulphate (SO42-), and nitrate (NO3
-) were carried out based on the
standard test procedures as per Analysis Guide, Volume 3 (Schutte, 2001).

44
3.5.2.2 Preparation and analysis of chloride, sulphate, and nitrate
Working standard solutions for anions of interest were prepared following sequential
dilutions method. Mixed standard solutions with concentrations of 1, 5, 25 and 50 ppm
of each of the three desired anions were used to plot the calibration curve. The linear
relationship between the peak area and concentration was confirmed experimentally
(Keith, 2017).
3.5.2.3 Determination of cations
The determination of cations in water was done using a flame spectrophotometer (iCE
3300 series, Thermo Fisher Scientific Inc). For analysis of calcium and magnesium, a
combination hollow cathode lamp (HCL) was used; while sodium required a separate
lamp as well as different operating wavelengths (Helaluddin et al., 2016). The
instrument is standardised with the known concentration of each cation (1 to 100
mg/L). The absorbance was measured for each standard using a respective HCL and
plotted against the concentrations in excel, thus confirming the linear relationship.
These graphs became the calibration curves for the measurements of specific
elements in the water samples.
The hollow cathode lamps for specific elements to be measured were used, and the
AA instrument was set to the desired wavelength, slit width and line source before the
emission intensities for standards and water samples were measured. The deionised
water was used as a blank before each standard was measured. The samples having
higher concentration are suitably diluted with distilled water and the dilution factor is
applied to the observed values (Keith, 2017).
3.5.2.4 Determination of anions
Anions were measured using the Spectroquant prove 300 (Merck, Germany). The
corresponding method numbers were used to operate the photometer. Measurements
could be made without any further adjustments to the instrument.

45
3.5.2.4.1 Chloride
Chlorides were determined by iron (III) thiocyanate method. A pre-programmed
method number 63, with a total measurement range of 10 – 250 mg/L, was used for
the determination of chlorides in raw and processed water. No further adjustments
were required to the instrument. The concentration was recorded as displayed in the
photometer.
3.5.2.4.2 Sulphate
Sulphates were first determined by nephelometric method in which the concentration
of turbidity was measured against the known concentration of synthetically prepared
sulphate solution. Barium chloride was used for the production of a turbid solution as
a result of barium sulphate and a mixture of glycerol and sodium chloride is used to
prevent the settling of turbidity. The results obtained using this method corresponded
well with the recordings from the photometer. The photometer also measures
sulphates using a pre-programmed method 82, with a total measurement range of 100
– 1000 mg/L.
3.5.2.4.3 Nitrate
Nitrates were determined by nitrospectral method, with corresponding method number
59. A total measurement range of 0.5 – 18.0 mg/L nitrate-nitrogen was used for the
determination of nitrates in raw and processed water. The concentration was recorded
as displayed in the photometer.
3.5.2.5 Determination of total suspended solid
A fixed volume (100 cm3) of the water samples were poured onto pre-weighed glass
fibre filter papers (Whatman GF/F circles, 47 mm diameter and 1.5 µm nominal pore
size) before starting the vacuum filtration process. After the completion of the filtration
process, the filters were removed and placed in an aluminium dish in an oven at 103
°C for 2-3 hours until all the remaining water was completely dried off. Thereafter, the

46
filters were removed from the oven and placed into the desiccator until cooled to
balance temperature; and then weighed. The mass was recorded in mg/dm3 (this is
the tarred weight of the filter). Total suspended solids were obtained using the formula
below.
𝑇𝑜𝑡𝑎𝑙 𝑠𝑢𝑠𝑝𝑒𝑛𝑑𝑒𝑑 𝑠𝑜𝑙𝑖𝑑𝑠, 𝑎𝑠 𝑇𝑆𝑆𝑚𝑔
𝐿=
(𝐴−𝐹) 𝑋 1000
𝑆
Where,
A = final 103 °C weight of the dried residue + the tarred filter (in mg),
F = tarred filter weight (in mg), and
S = sample volume (in mL)
Source: Keith, 2017.
3.5.2.6 Determination of total hardness
10 cm3 of Water sample was pipetted into a conical flask. 1 cm3 of the buffer solution
(NH4Cl) of pH = 10 and 3 drops of Eriochrome Black T (EBT) indicator were added to
the flask. The mixture was then titrated with 0.01 M EDTA (ethyl diamine tetra acetic
acid) until the colour changed from wine red to blue. The procedure was repeated two
more times to obtain the average litre value. Calculation of total hardness was as
equations 1 and 2 below.
𝑇𝑜𝑡𝑎𝑙 ℎ𝑎𝑟𝑑𝑛𝑒𝑠𝑠 (𝑝𝑝𝑚) ∶ 𝑀1𝑉1 = 𝑀2𝑉2 …………………………Equation 1
𝑀1 = 𝑀2𝑉2
𝑉1…………………………………………...…………….Equation 2
Where,
M1 = Total hardness of sample water (in ppm)
V1 = volume of sample hard water titrated (in mL)
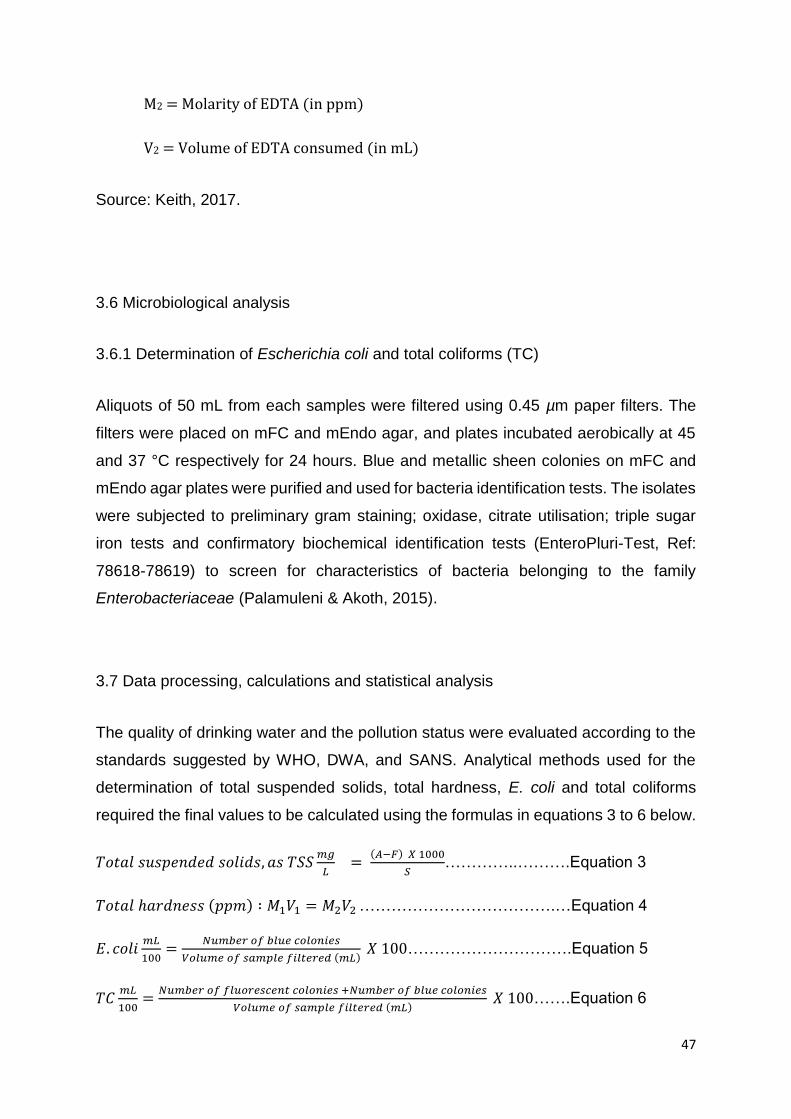
47
M2 = Molarity of EDTA (in ppm)
V2 = Volume of EDTA consumed (in mL)
Source: Keith, 2017.
3.6 Microbiological analysis
3.6.1 Determination of Escherichia coli and total coliforms (TC)
Aliquots of 50 mL from each samples were filtered using 0.45 µm paper filters. The
filters were placed on mFC and mEndo agar, and plates incubated aerobically at 45
and 37 °C respectively for 24 hours. Blue and metallic sheen colonies on mFC and
mEndo agar plates were purified and used for bacteria identification tests. The isolates
were subjected to preliminary gram staining; oxidase, citrate utilisation; triple sugar
iron tests and confirmatory biochemical identification tests (EnteroPluri-Test, Ref:
78618-78619) to screen for characteristics of bacteria belonging to the family
Enterobacteriaceae (Palamuleni & Akoth, 2015).
3.7 Data processing, calculations and statistical analysis
The quality of drinking water and the pollution status were evaluated according to the
standards suggested by WHO, DWA, and SANS. Analytical methods used for the
determination of total suspended solids, total hardness, E. coli and total coliforms
required the final values to be calculated using the formulas in equations 3 to 6 below.
𝑇𝑜𝑡𝑎𝑙 𝑠𝑢𝑠𝑝𝑒𝑛𝑑𝑒𝑑 𝑠𝑜𝑙𝑖𝑑𝑠, 𝑎𝑠 𝑇𝑆𝑆𝑚𝑔
𝐿=
(𝐴−𝐹) 𝑋 1000
𝑆…………..……….Equation 3
𝑇𝑜𝑡𝑎𝑙 ℎ𝑎𝑟𝑑𝑛𝑒𝑠𝑠 (𝑝𝑝𝑚) ∶ 𝑀1𝑉1 = 𝑀2𝑉2 ……………………………….…Equation 4
𝐸. 𝑐𝑜𝑙𝑖𝑚𝐿
100=
𝑁𝑢𝑚𝑏𝑒𝑟 𝑜𝑓 𝑏𝑙𝑢𝑒 𝑐𝑜𝑙𝑜𝑛𝑖𝑒𝑠
𝑉𝑜𝑙𝑢𝑚𝑒 𝑜𝑓 𝑠𝑎𝑚𝑝𝑙𝑒 𝑓𝑖𝑙𝑡𝑒𝑟𝑒𝑑 (𝑚𝐿) 𝑋 100………………………….Equation 5
𝑇𝐶𝑚𝐿
100=
𝑁𝑢𝑚𝑏𝑒𝑟 𝑜𝑓 𝑓𝑙𝑢𝑜𝑟𝑒𝑠𝑐𝑒𝑛𝑡 𝑐𝑜𝑙𝑜𝑛𝑖𝑒𝑠 +𝑁𝑢𝑚𝑏𝑒𝑟 𝑜𝑓 𝑏𝑙𝑢𝑒 𝑐𝑜𝑙𝑜𝑛𝑖𝑒𝑠
𝑉𝑜𝑙𝑢𝑚𝑒 𝑜𝑓 𝑠𝑎𝑚𝑝𝑙𝑒 𝑓𝑖𝑙𝑡𝑒𝑟𝑒𝑑 (𝑚𝐿) 𝑋 100…….Equation 6
48
Statistical conclusions and tests were made on the basis of a multi-parametric model.
The data for physico-chemical parameters of water samples were presented as mean
values of water sampled at different study areas. Pearson’s correlation product of the
moment was used to determine the correlation between conductivity, TDS, pH and
temperature. A coefficient of correlation (CV) and student’s t-test was used to describe
the temporal variations of the observed water quality parameters. Prior to investigating
the seasonal effect on water quality parameters, the observation period was divided
into two major seasons: summer season (December, January and February) and the
winter season (June, July, and August). The data was analysed using one-way
analysis of variance (ANOVA) at 0.05% level of significance with the objective of
evaluating the significant differences among the sites for all water quality variables.
The two-tailed test of significance (p < 0.05) was used to determine the significance of
the result (Momba et al., 2009). All statistical analyses were performed using Microsoft
Excel 2013, SPSS Version 24, and PAST Version 1.93 software applications.
49
CHAPTER FOUR
RESULTS AND DISCUSSION
4.1 Introduction
Sampling and analysis for fourteen physico-chemical and two microbiological
parameters was done between December 2017 and November 2018. The sampling
periods were strategically selected in order to observe the seasonal variations of water
quality. The mean and standard deviation of the samples were calculated, and results
are presented in Tables 4, 5, 6, 7, 8 and 9, respectively. The results obtained show
the overall characteristics of drinking water quality. Each parameter is discussed in
relation to the drinking water quality limits stipulated by World Health Organisation
(WHO), Department of Water Affairs (DWA) and the South African National Standards
(SANS).
4.1.1 Water treatment processes
The significance of water quality variables are not only to characterise a water source,
but also to provide information on the likely water quality related problems that can
lead to health, aesthetic and economic impacts (Spellman, 2017). The most applicable
water treatment options are ascertained by determining the water quality of the source
as this often influences the variables for the entire treatment process. For example,
the water treatment processes at the Midvaal Water Company (MWC) have changed
over the years to adapt to the varying water quality of the Vaal River as illustrated in
Table 2 (van Rensburg et al., 2016). Unfortunately, no data was available to illustrate
the same trend, or any continuous improvement plans to improve the quality systems,
at Mmabatho Water Treatment Plant (MWTP).
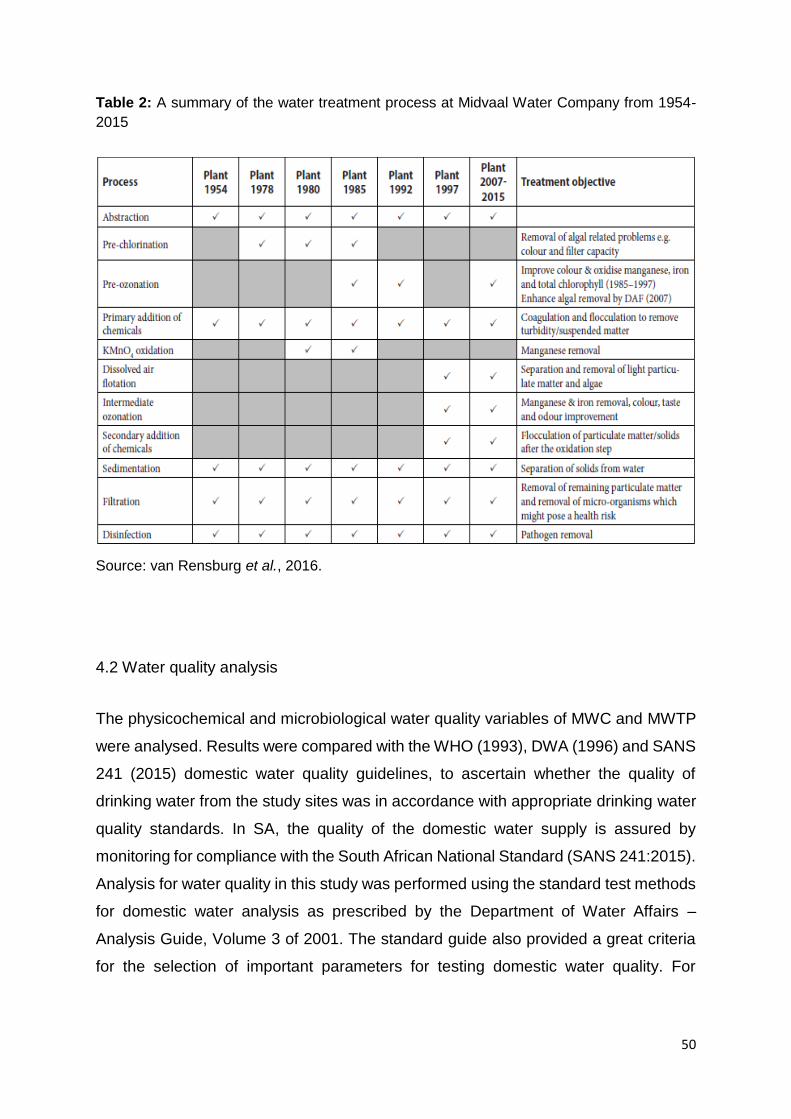
50
Table 2: A summary of the water treatment process at Midvaal Water Company from 1954-
2015
Source: van Rensburg et al., 2016.
4.2 Water quality analysis
The physicochemical and microbiological water quality variables of MWC and MWTP
were analysed. Results were compared with the WHO (1993), DWA (1996) and SANS
241 (2015) domestic water quality guidelines, to ascertain whether the quality of
drinking water from the study sites was in accordance with appropriate drinking water
quality standards. In SA, the quality of the domestic water supply is assured by
monitoring for compliance with the South African National Standard (SANS 241:2015).
Analysis for water quality in this study was performed using the standard test methods
for domestic water analysis as prescribed by the Department of Water Affairs –
Analysis Guide, Volume 3 of 2001. The standard guide also provided a great criteria
for the selection of important parameters for testing domestic water quality. For

51
instance, substances listed in Table 3 provide an indication of general water quality,
hence it was important to include them in this study.
Table 3: Substances which are general indicators of water quality
Electrical conductivity
(total dissolved salts)
Conductivity is an indicator of total dissolved salts (TDS), and also
establishes if the water is drinkable and capable of slaking thirst.
Faecal coliforms This is an indicator of the possible presence of disease-causing
organisms. It establishes if water is polluted with faecal matter.
pH value This has a marked effect on the taste of the water and also
indicates possible corrosion problems resulting from dissolution
of metals such copper, zinc and cadmium that can be very toxic.
Turbidity This affects the appearance, and thus the aesthetic acceptability,
of the water. Turbidity is commonly high in surface waters.
Free available chlorine
(Residual chlorine)
This is a measure of the effectiveness of the disinfection of the
water. Residual chlorine is the chlorine concentration remaining
at least 30 minutes after disinfection. There should be residual
chlorine in the water, but if concentrations are too high it may
impart an unpleasant taste and smell to the water.
Source: DWA, 2003.
4.2.1 Physical properties
Some physical parameters of water were performed in situ according to the methods
outlined in Chapter 3, Section 3.5.1. Tables 4 and 5 summarise the average physical
properties of water; that is, temperature; pH; conductivity; turbidity; total dissolved
solids (TDS) and total suspended/settle-able solids (TSS); sampled at two specific
sampling points of the two study areas between December 2017 and November 2018.

52
4.2.1.1 Temperature
The highest temperature measured and recorded was in the summer season, and the
lowest in the winter season. Temperature values ranged from 15.58 to 26 °C (Table
4). Both the maximum and minimum temperature values were recorded in the raw
water for Klerksdorp. The maximum temperature (26 °C) was recorded during the
summer season, and the minimum (15.58 °C) during the winter. Generally, water
temperature corresponds with air temperature regardless of where sampling was
done. Temperature recording for inlet water followed a typical seasonal pattern
whereby higher water temperatures were measured during the summer season and
lower temperatures were measured in the winter season. In Klerksdorp, the
temperature of water measured at the inlet was 26.00±0.14 and 15.58±2.56 °C for
summer and winter, respectively. After the treatment process, the temperature of
water was 25.65±1.48 and 21.94±2.50 °C for summer and winter, respectively. There
was no significant difference between the temperature measurements before and after
treatment with the p value equal to 0.43. In Mmabatho, the temperature of water before
treatment measured 22.86±3.51 and 18.90±0.88 °C for summer and winter,
respectively. After treatment the temperature of water was 21.88±0.54 and 20.79±1.88
°C for summer and winter, respectively. Similarly, there was no significant difference
in the temperature values before and after treatment in Mmabatho, the p value was
0.85. The overall results revealed that water temperature was significantly different
between the sampled seasons with p = 0.04, but insignificant between the two study
areas at p value = 0.80.
The temperature of water is an important parameter to measure and monitor in a water
treatment process. Water temperature will influence the rate of biochemical reactions
in a water treatment process and also affect most water quality parameters (Barnes et
al., 2014). For instance, the efficiency of coagulation; one of the key steps in the water
treatment process is greatly dependent on temperature. As water temperature
increases, the optimal pH will decrease during coagulation. Additionally, as
temperature decreases, the viscosity of water increases causing the rate of

53
sedimentation to decrease (Tetteh & Rathilal, 2019). However, effective water
treatment plants and processes tend to defeat this problem.
Water temperature can also affect the disinfection process. When water has a pH
value higher than 8.5, higher temperatures multiply the bactericidal effectiveness of
chlorine, as well as its effectiveness in killing some viruses (Haydar et al., 2016). It has
also been found that water temperature influences the seasonal variation in
trihalomethane (THM) concentrations. Furthermore, without corrosion inhibitors, the
corrosion rate will greatly increase when water temperature is higher (Gough et al.,
2014). This study observed that water temperature influenced most parameters. There
was a significant variation (p ≤ 0.05) in the pH, conductivity, TDS, turbidity, and calcium
of water with p values between the water temperature and the mentioned parameters
less than 0.001. However, water temperature was insignificantly different to
magnesium and total coliforms, the p values were 0.49 and 0.29, respectively.
In RSA, the North West province is known to be very hot and dry during the summer
seasons. High water temperatures are big contributors to the growth of cyanobacterial
(algal) blooms in water sources. Cyanobacterial blooms have aesthetic impacts on the
overall quality of potable water hence they are a nuisance to water treatment plants
(van Rensburg et al., 2016).

54
Table 4: Seasonal mean values of electrical conductivity (EC), pH, temperature and TDS
Temperature (°C) pH EC (mS/cm) TDS (mg/L)
Summer Winter Summer Winter Summer Winter Summer Winter
MWC 1 26.00±0.14 15.58±2.56 9.32±0.11 8.39±0.47 83.50±7.78 60.50±26.16 525.50±51.62 376.50±143.54
MWC 2 25.65±1.48 21.94±2.50 7.68±0.15 8.24±0.16 69.50±2.12 78.00±7.07 491.50±54.45 472.50±50.20
MWTP 1 22.86±3.51 18.90±0.88 8.91±0.05 8.36±0.08 240.00±76.37 204.50±36.06 530.53±11.43 326.24±53.97
MWTP 2 21.88±0.54 20.79±1.88 9.33±0.01 8.29±0.06 203.00±16.97 183.50±2.12 266.64±9.50 214.37±16.92
DWA No guideline 6.0 ≥ to ≤ 9.0 ≤170 ≤1200
WHO No guideline 6.5 ≥ to ≤ 8.5 ≤150 ≤1000
SANS No guideline 5.0 ≥ to ≤ 9.7 ≤170 ≤1200
Note: 1 represent inlet values and 2 represent outlet values.
55
4.2.1.2 pH
The pH of water is a reflection of the degree of acidity (pH ≤ 7) or alkalinity (pH ≥ 7)
hence it is the most important operational parameter in the water treatment processes
(Mulamattathil et al., 2015). The pH values higher than 8 are not suitable for effective
disinfection of water, while values less than 6.5 enhance the corrosion in galvanised
or copper pipes and household plumbing system (Haydar et al., 2016). The taste of
water, its corrosiveness and solubility and speciation of metal ions are all influenced
by the pH. At low pH, water may taste sour while at high pH water tastes bitter or soapy
(Mulamattathil et al., 2015).
The pH of most unpolluted water lies between 6.5 and 8.5. As shown in Table 4, the
pH of water from the 2 water treatment systems (MWC and MWTP) ranged from 7.68
to 9.33. The lowest overall mean pH value of 7.68±0.15 was measured at Klerksdorp
outlet during the summer season while the highest overall annual mean pH of
9.32±0.11 was measured at the inlet. Although the pH of 9.32 was above the specified
drinking water quality limits by WHO and DWA; the SANS 241 guideline still provides
for pH limits of 5.0 to 9.7 for potable water quality. Hence, the overall mean values of
8.29 and 9.33, at the Klerksdorp outlet measured in winter and summer, respectively
are acceptable and within the SANS limits.
In Klerksdorp, the value of pH measured at the inlet was 9.32±0.11 and 8.39±0.47
during summer and winter, respectively. After treatment, the value of pH was
7.68±0.15 and 8.24±0.16 during summer and winter, respectively. There was no
significant difference in the pH values before and after the treatment process, the p
value was 0.24. In Mmabatho, the value of pH measured at the inlet was 8.91±0.05
and 8.36±0.08 for summer and winter, respectively. After treatment, the pH of water
was 9.33±0.01 and 8.29±0.06 measured in summer and winter, respectively. Similarly,
there was no significant difference between the pH of water before and after treatment
in Mmabatho, the p value was 0.82. The student t-test revealed an insignificant
difference in pH values between the seasons measured, at p = 0.44; however, there
was an inverse correlation in the p value of the sampled areas at p = 0.02. All pH
values of water before and after the treatment process were within specified
acceptable limits, making water marginal for irrigation and drinking purposes.

56
4.2.1.3 Total dissolved solids
Total dissolved solids (TDS) is a measure of the chemical constituents dissolved in
water. Salts and minerals such as calcium, potassium, sodium, bicarbonates,
chlorides, magnesium and sulphates produce an unwanted taste, and discolour the
appearance of water. High TDS concentrations in water indicate mineralised water.
According to the WHO water quality guidelines, the acceptable TDS limit is between
500 and 1000 mg/L. DWA and SANS has a prescribed maximum limit of 1200 mg/L,
even though; according to WHO; the TDS higher than 1000 mg/L imparts the taste of
drinking water. Furthermore, a value higher than 1000 mg/L results in excessive
scaling in water pipes, heaters, boilers and other household appliances (Haydar et al.,
2016).
Table 4 shows the concentration of TDS recorded in this study which ranged between
214.37 and 530.53 mg/L. The mean TDS at the Mmabatho inlet were 326.24±53.97
mg/L and 530.53±11.43 mg/L during the winter and summer seasons, respectively. At
the outlet, the lowest mean TDS of 214.37±16.92 mg/L and 266.64±9.50 mg/L during
the winter and summer seasons, respectively. The same trend of differences was also
reflected in their respective electrical conductivity values. However, there was no
significant difference in the TDS measurements before and after water treatment in
Mmabatho, the p value was 0.22. For Klerksdorp, the highest TDS mean of
525.50±51.62 mg/L was recorded at the inlet during the summer season while the
lowest TDS mean of 376.50±143.54 mg/L was recorded in the winter season. After
the water treatment process, the mean TDS values of 491.50±54.45 mg/L and
472.50±50.20 mg/L were measured during the summer and winter seasons,
respectively. Similarly, there was no significant difference in the TDS measurements
before and after water treatment in Klerksdorp, with the p value equal to 0.72. The
highest mean concentration of TDS in drinking water is due to the highest availability
of CO32-, HCO3
-, Cl-, SO42-, NO3
-, Na+, K+, Ca2+, and Mg2+ in water (Nawab et al.,
2016). Overall, there was no significant difference in the mean concentrations of TDS
between the study areas as well as between the seasons measured, at p values =
0.13 and 0.25, respectively. High TDS values have been shown to be more prevalent
in groundwater than in surface waters.
57
4.2.1.4 Electrical conductivity
Electrical conductivity (EC) is an important tool to assess the degree of water purity
(Shigut et al., 2017). It measures the ability of water to conduct an electric current, and
is mostly dependent upon the number of ions or charged particles in the water.
Determining electrical conductivity in water quality studies is useful because they
provide a direct measurement of dissolved ionic matter in the water. Low EC values
are characteristic of high-quality, low-nutrient waters. The high values of conductivity
can be indicative of salinity problems, while very high values are good indicators of
possible polluted sites (Suratman et al., 2019). Based on the WHO guidelines, the
electrical conductivity for domestic water quality should be between 75 and 150
mS/cm; while in RSA, DWA and SANS 241 permissible limits are both at 150 mS/cm.
Table 4 shows that the overall mean electrical conductivity levels between the two
study sites ranged from 60.50 to 240.00 mS/cm. The mean EC levels recorded in
Klerksdorp inlet were 83.50±7.78 mS/cm and 60.50±26.16 mS/cm for summer and
winter, respectively. After the water treatment process, the conductivity values were
69.50±2.12 mS/cm and 78.00±7.07 mS/cm for summer and winter, respectively. There
was no significant difference between the EC measurements before and after water
treatment in Klerksdorp, the p value was 0.90. Moreover, the overall EC means for
Klerksdorp at both the inlet and outlet were within the specified drinking water quality
standards throughout the seasons of assessment.
In Mmabatho, the mean EC levels at the inlet were high and above specific limits, at
240.00±76.37 mS/cm and 204.50±36.06 mS/cm, for summer and winter, respectively.
After treatment, the EC levels in Mmabatho were 203.00±16.97 and 183.50±2.12
mS/cm during summer and winter, respectively. There was no significant difference in
the EC measurements before and after water treatment, at p value equal to 0.29.
Overall, there was no significant difference (p = 0.77) in electrical conductivities of both
Klerksdorp and Mmabatho between the seasons of measure. On the contrary, there
was a significant difference (p < 0.01) between the two study sites.
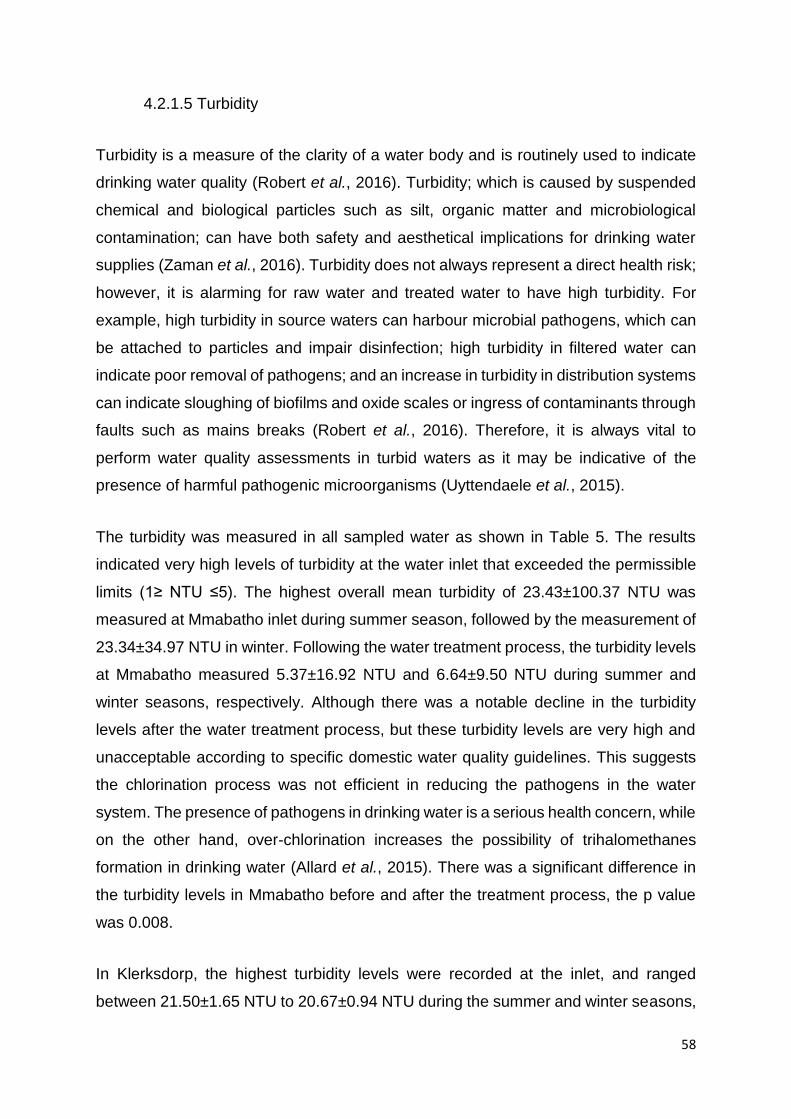
58
4.2.1.5 Turbidity
Turbidity is a measure of the clarity of a water body and is routinely used to indicate
drinking water quality (Robert et al., 2016). Turbidity; which is caused by suspended
chemical and biological particles such as silt, organic matter and microbiological
contamination; can have both safety and aesthetical implications for drinking water
supplies (Zaman et al., 2016). Turbidity does not always represent a direct health risk;
however, it is alarming for raw water and treated water to have high turbidity. For
example, high turbidity in source waters can harbour microbial pathogens, which can
be attached to particles and impair disinfection; high turbidity in filtered water can
indicate poor removal of pathogens; and an increase in turbidity in distribution systems
can indicate sloughing of biofilms and oxide scales or ingress of contaminants through
faults such as mains breaks (Robert et al., 2016). Therefore, it is always vital to
perform water quality assessments in turbid waters as it may be indicative of the
presence of harmful pathogenic microorganisms (Uyttendaele et al., 2015).
The turbidity was measured in all sampled water as shown in Table 5. The results
indicated very high levels of turbidity at the water inlet that exceeded the permissible
limits (1≥ NTU ≤5). The highest overall mean turbidity of 23.43±100.37 NTU was
measured at Mmabatho inlet during summer season, followed by the measurement of
23.34±34.97 NTU in winter. Following the water treatment process, the turbidity levels
at Mmabatho measured 5.37±16.92 NTU and 6.64±9.50 NTU during summer and
winter seasons, respectively. Although there was a notable decline in the turbidity
levels after the water treatment process, but these turbidity levels are very high and
unacceptable according to specific domestic water quality guidelines. This suggests
the chlorination process was not efficient in reducing the pathogens in the water
system. The presence of pathogens in drinking water is a serious health concern, while
on the other hand, over-chlorination increases the possibility of trihalomethanes
formation in drinking water (Allard et al., 2015). There was a significant difference in
the turbidity levels in Mmabatho before and after the treatment process, the p value
was 0.008.
In Klerksdorp, the highest turbidity levels were recorded at the inlet, and ranged
between 21.50±1.65 NTU to 20.67±0.94 NTU during the summer and winter seasons,
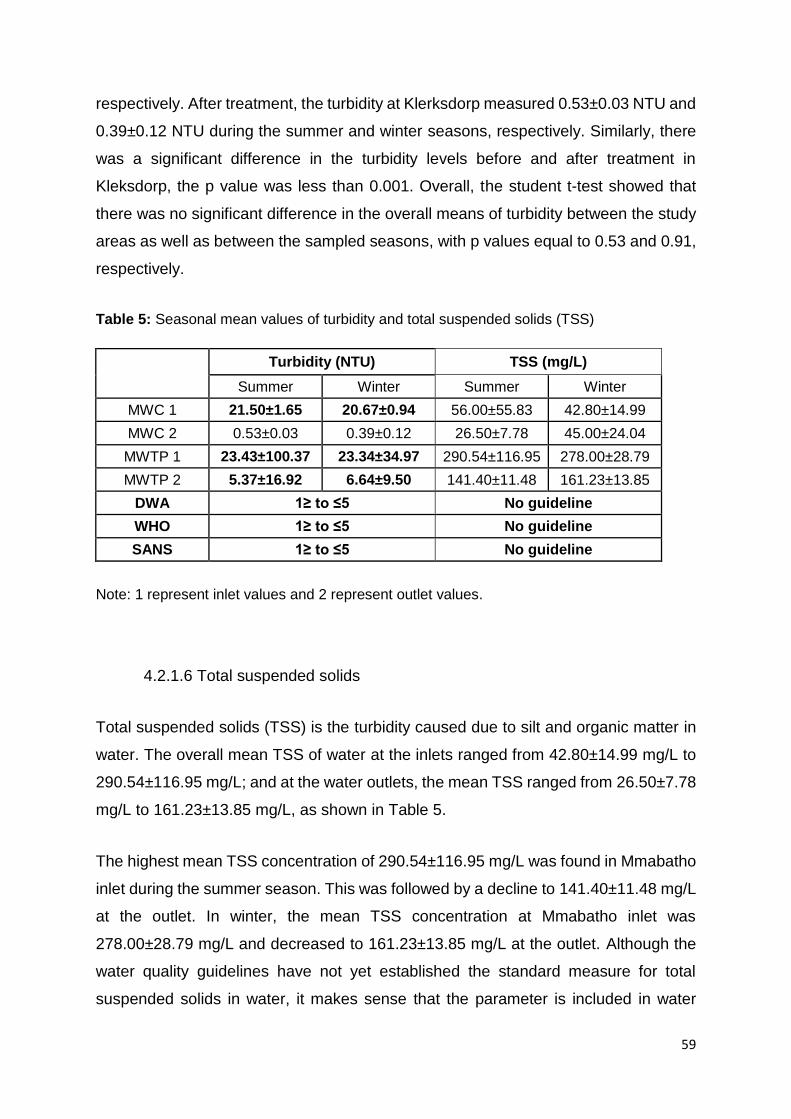
59
respectively. After treatment, the turbidity at Klerksdorp measured 0.53±0.03 NTU and
0.39±0.12 NTU during the summer and winter seasons, respectively. Similarly, there
was a significant difference in the turbidity levels before and after treatment in
Kleksdorp, the p value was less than 0.001. Overall, the student t-test showed that
there was no significant difference in the overall means of turbidity between the study
areas as well as between the sampled seasons, with p values equal to 0.53 and 0.91,
respectively.
Table 5: Seasonal mean values of turbidity and total suspended solids (TSS)
Turbidity (NTU) TSS (mg/L)
Summer Winter Summer Winter
MWC 1 21.50±1.65 20.67±0.94 56.00±55.83 42.80±14.99
MWC 2 0.53±0.03 0.39±0.12 26.50±7.78 45.00±24.04
MWTP 1 23.43±100.37 23.34±34.97 290.54±116.95 278.00±28.79
MWTP 2 5.37±16.92 6.64±9.50 141.40±11.48 161.23±13.85
DWA 1≥ to ≤5 No guideline
WHO 1≥ to ≤5 No guideline
SANS 1≥ to ≤5 No guideline
Note: 1 represent inlet values and 2 represent outlet values.
4.2.1.6 Total suspended solids
Total suspended solids (TSS) is the turbidity caused due to silt and organic matter in
water. The overall mean TSS of water at the inlets ranged from 42.80±14.99 mg/L to
290.54±116.95 mg/L; and at the water outlets, the mean TSS ranged from 26.50±7.78
mg/L to 161.23±13.85 mg/L, as shown in Table 5.
The highest mean TSS concentration of 290.54±116.95 mg/L was found in Mmabatho
inlet during the summer season. This was followed by a decline to 141.40±11.48 mg/L
at the outlet. In winter, the mean TSS concentration at Mmabatho inlet was
278.00±28.79 mg/L and decreased to 161.23±13.85 mg/L at the outlet. Although the
water quality guidelines have not yet established the standard measure for total
suspended solids in water, it makes sense that the parameter is included in water

60
quality assessments. High TDS and TSS in drinking water are aesthetically unpleasant
and the accumulation of total solids in the water system reveals the overall
ineffectiveness of the current treatment process. Most minerals in drinking water are
undesirable at high concentrations. Moreover, there was a significant difference in the
TSS concentration of Mmabatho before and after the treatment process, the p value
was equal to 0.08. Similarly, as shown in Table 5, the same trend is observed for
Klerksdorp with a high TSS mean concentration of 56.00±55.83 mg/L measured in
summer at the inlet and decreased to 26.50±7.78 mg/L at the outlet. Inversely, the
mean TSS concentration at Klerksdorp inlet measured 42.80±14.99 mg/L in winter,
and then increased to 45.00±24.04 mg/L after at the outlet. Where a certain parameter
increases instead of the expected decrease after the water treatment process, this
could be attributed to the failure to dissolve the chemicals used during the treatment
process. There was no significant difference in the TSS concentration of Klerksdorp
before and after the treatment process, with the p value equal to 0.35. Overall, the
TSS mean concentrations showed a significant difference between the study areas,
however, there was no significant difference between the sampled seasons at p values
equal to 0.004 and 0.97, respectively.
In summary, the physical parameters of water give the general indication of the water
quality. Furthermore, an assessment of the physical water quality parameters before
and after the water treatment process is important to provide the baseline information
on the critical chemical and biological constituents that will need further analysis, for
example, nutrient load, pathogens, heavy metal ions, and disinfection by products in
resultant water. The results of the physical water parameters show that the
conventional water treatment processes used in Mmabatho is not effective in removing
contaminants from the water specifically conductivity and turbidity levels which were
still above the water quality ranges after the treatment process. However, all the other
parameters, especially in Klerksdorp, were reasonably within the permissible water
quality limits after water treatment even though the inlet water quality had been above
the water quality standards. Therefore, from the physical parameters, the Klerksdorp
water treatment processes have shown to be the most effective drinking water
treatment method.
61
4.2.2 Chemical properties
Water contamination with anions, cations and other organic and inorganic chemicals
is a concerning issue for human health and the environment (Nawab et al., 2016). The
concentrations of the major anions (chloride, nitrate, sulphate); cations (calcium,
magnesium, sodium); and other important chemical constituents were measured. The
results are summarised in Tables 6, 7 and 8. The mean concentrations of anions in
Mmabatho were found in the order of Cl- > SO42- > NO3
- and SO42- > Cl- > NO3
- for
Klerksdorp. Cations followed this order Ca2+ > Na+ > Mg2+ for both study areas. Taste
properties of drinking water are largely determined by cations (K+, Na+, Ca2+, Mg2+),
whereas anions (Cl−, NO3−, SO4
2−) tend to modify its taste intensity (Vingerhoeds et
al., 2016).
4.2.2.1 Calcium and magnesium
Calcium and magnesium are the two main ions, or rather dissolved minerals that are
naturally occurring in surface and ground water that contribute to the total hardness
(TH) in water, which were discussed as a separate parameter before the end of this
section. These two minerals mainly originate from carbonate, such as calcite and
dolomite, as water moves through sedimentary environments such as rocks and
stones (Vingerhoeds et al., 2016).
4.2.2.1.1 Calcium
The desirable limit of calcium content in drinking water is 75 mg/L according to WHO,
80 mg/L for DWA and 150 mg/L for SANS (Table 6). Calcium is a naturally occurring
mineral found in abundance as a result of the environmental cycle. It is an essential
component of limestone and commonly found in hydrothermal environments. The
concentration of calcium in water resources is greatly influenced by high temperatures.
Table 6 shows that the concentration of calcium was higher at the inlets during the
summer season. This is because water temperature is higher in summer thus aiding
the solubility of the mineral in water (Cheremisinoff, 2019).
62
The concentration of calcium at Klerksdorp inlet was 69.40±6.51 mg/L in summer and
47.61±26.01 mg/L in winter. After water treatment, the mean concentration recorded
in Klerksdorp was 62.47±9.14 mg/L in summer and 64.90±0.99 mg/L in winter. The
concentrations were all within the acceptable limits for calcium according to the
drinking water standards, however, the slight increase in the concentration noted in
winter may be due to other steps in the water treatment process. For example, lime is
often used in the water treatment process to adjust the pH of water, or as a softening
agent. This increase was not significant in the overall calcium concentration between
the sampled points, with the p value = 0.68.
In Mmabatho, the concentration of calcium recorded at the inlet was 178.37±0.80 mg/L
and 166.83±11.69 mg/L during summer and winter, respectively. Again, after the water
treatment process the concentration of calcium was 149.19±22.78 mg/L and
162.15±7.85 mg/L during summer and winter, respectively. Although both
measurements at the inlet were above the recommended limits, the most concerning
deviations for the study are the concentrations that exceed the drinking water standard
limits after the treatment process. These are the deviations that may be detrimental to
human health in the long term, and hence form a basis for rendering the water
treatment process as ineffective. The student t-test showed no significant differences
in calcium concentration between sampled points and sites, at p = 0.51 and 0.76, as
well as between the seasons of measure, at p = 0.48.
4.2.2.1.2 Magnesium
Similarly, as Table 6 shows, the same trend is observed for magnesium ion (Mg2+).
The overall magnesium in water ranged from the highest mean concentration of
29.44±8.72 mg/L to the lowest overall mean magnesium content of 18.79±8.78 mg/L.
All sampled water revealed that magnesium concentrations were within the
permissible specified levels of 150 mg/L and 70 mg/L according to the WHO, DWA
and SANS drinking water standards. The highest overall mean Mg2+ concentration of
29.44±8.72 mg/L was measured in Mmabatho inlet during the winter season.
Inversely, the lowest overall mean Mg2+ concentration of 18.79±8.78 mg/L was
measured in Klerksdorp inlet during the winter season. The concentration made a
steep increase to 25.50±0.57 mg/L after water treatment. Many factors could have

63
played a role in this notable increase in magnesium concentration after treatment.
However, all magnesium concentration from both study areas were still within the
specified acceptable drinking water limits after the treatment process. There was no
significant difference in the values of magnesium between the sampled points and
study sites, at p = 0.46 and 0.76; as well as between the sampled seasons at p = 0.68.
4.2.2.2 Sodium
A cation can evoke different taste qualities such as astringent, bitter, salty, sweet, sour,
metallic, and/or irritation depending on concentration and the mean level at which the
specific taste can be detected. For sodium, a salty taste has been acknowledged
between 30 and 60 mg Na/L, and taste recognition thresholds of 0.59–0.67 g Na/L,
have been reported (Boateng et al., 2016). However, consumers have different taste
or sensory recognition thresholds which leads to many people being particular to a
brand of bottled mineral water they drink.
In this study, all raw water samples had relatively high sodium concentrations ranging
from 42.69 mg/L to 133.05 mg/L. Treated water had sodium concentrations ranging
from 56.89 mg/L to 129.40 mg/L, as illustrated in Table 6. The maximum permissible
limits of sodium concentration in drinking water according to the WHO, DWA and
SANS is 200 mg/L. This means that the overall mean concentrations of sodium of all
sampled water were well within the maximum allowable concentration. According to
Hua et al. (2015), a high percentage of municipal water supplies obtained from lakes
and rivers are low in sodium content. However, some surface water sources may
absorb a considerable amount of salt from alkali soils. Raw water in Mmabatho has
slightly higher sodium concentrations than Klerksdorp water which could be attributed
to leaching out of alkaline salts of sodium, calcium and magnesium (Edition, 2011). In
addition, the bicarbonates and sulphates of calcium and magnesium along with some
iron salts may be the cause of the water hardness in Mmabatho. The lowest mean
concentration of sodium ion in water of 42.69±24.48 mg/L was measured in Klerksdorp
inlet during the winter season, however it increased to 59.30±5.94 mg/L at the outlet
which could be as a result of the mixing with other salts during the treatment process.
However, this increase was not significant (p = 0.97). During the summer season, the

64
concentration of sodium at Klerksdorp inlet was 75.00±6.36 mg/L and decreased to
56.89±1.97 mg/L at the outlet.
In Mmabatho, the highest mean concentration of sodium in water of 133.05±3.48 mg/L
was measured in the inlet during the summer season, and decreased to 129.40±0.14
mg/L at the outlet. Similarly, the mean concentration of sodium in Mmabatho inlet was
127.71±1.31 mg/L, and decreased to 124.56±5.76 mg/L at the outlet. Again, the
differences between the inlet and outlet concentration were not significant with p =
0.96.
The overall concentration of sodium between the study sites was insignificant (p ≤
0.05); however, the concentration between the sampled seasons were significant, with
p value = 0.74.
4.2.2.3 Chloride
The permissible limit of chloride (Cl-) content in water is 250 mg/L for WHO and 200
mg/L for both DWA and SANS standard guidelines. The chloride content of water of
all sampling sites were within these permissible limits. As shown in Table 7, the overall
mean concentration of chloride in water ranged from 39.14 to 242.41 mg/L. The lowest
chloride content was measured at the Klerksdorp inlet during the winter season, while
the highest chloride content was measured at Mmabatho outlet in summer (Table 7).
In Klerksdorp, the chloride concentration before treatment was 61.73±3.78 and
39.14±18.42 mg/L during the summer and winter, respectively. But after treatment, the
concentration of chloride was 51.95±1.73 and 57.62±6.51 mg/L during summer and
winter, respectively. The differences in concentration of chloride between the inlet and
outlet were not significant, with p = 0.74. In Mmabatho, the concentration of chloride
at the inlet was 226.86±4.79 and 217.83±9.71 mg/L during the summer and winter
seasons, respectively. After treatment, the chloride concentration was 242.41±1.17
and 210.16±0.08 mg/L during summer and winter, respectively. Again, the differences
in concentration between the inlet and outlet were not significant, with p = 0.84.

65
Table 6: Seasonal mean values of calcium, magnesium and sodium in mg/L
Calcium Magnesium Sodium
Summer Winter Summer Winter Summer Winter
MWC 1 69.40±6.51 47.61±26.01 23.65±3.46 18.79±8.78 75.00±6.36 42.69±24.48
MWC 2 62.47±9.14 64.90±0.99 22.24±2.45 25.50±0.57 56.89±1.97 59.30±5.94
MWTP 1 178.37±0.80 166.83±11.69 24.00±1.98 29.44±8.72 133.05±3.48 127.71±1.31
MWTP 2 149.19±22.78 162.15±7.85 21.13±4.02 24.20±0.99 129.40±0.14 124.56±5.76
DWA ≤80 ≤70 ≤200
WHO 75 ≥ to ≤ 200 ≤150 ≤200
SANS ≤150 ≤70 ≤200
Note: 1 represent inlet values and 2 represent outlet values.
66
Generally, the high concentration of chloride ion in natural source waters is due to
dissolution of salts, soil erosion and discharge effluents into the water sources
(Cheremisinoff, 2019). Conversely, the high chloride content in treated drinking water
is most likely a result of the chlorination process. Chlorides may get into surface water
from several sources including rocks containing chlorides, agricultural runoff, waste
water from nearby industries, and effluent waste water from wastewater treatment
plants. Furthermore, high chloride concentration in water can corrode metal piping of
the water distribution system, which will then affect the taste of drinking water. Hence,
it is vital for water treatment plants to monitor and limit high chloride levels in treated
water. The resulting salty taste in drinking water may also result in hypertension,
osteoporosis, renal stones and asthma problems (Boateng et al., 2016). Overall, the
student t-test revealed a significant difference (p ≤ 0.05) in the overall means of
chloride concentration between the study areas, however, there was no significant
difference (p ≥ 0.05) between the sampled seasons with p value = 0.84.
4.2.2.4 Sulphate
Drinking water is susceptible to high levels of sulphate (SO42-). This is mainly because
surface water sources are polluted by sulphur dioxide emissions from anthropogenic
sources such as oil refineries, mine dumps, etc. In addition, the mean sulphate level
in municipal drinking water supplies may be increased by water treatment processes
(Hounslow, 2018). Interestingly, the increase in sulphate ion concentration is also
observed in the analytical results as shown in Table 7. However, the levels of sulphate
were all within the acceptable limits of ≤ 500 mg SO42-/L of drinking water.
Table 7 shows the overall mean concentration of sulphate in analysed water ranged
from 123.42 to 187.97 mg/L. At Klerksdorp inlet, the sulphate content recorded during
the summer and winter seasons were 135.53±16.01 and 123.42±83.76 mg/L,
respectively. The concentration of sulphate increased at after treatment and measured
152.23±23.29 and 174.60±23.31 mg/L for summer and winter seasons, respectively.
This increase in concentration of sulphate before treatment and after treatment was
not significant, at p = 0.12. Similarly, with Mmabatho, the concentration of sulphate at
67
the inlet was 168.51±24.61 and 131.75±83.44 mg/L during the summer and winter
seasons, respectively. The concentration of sulphate at the outlet increased to
187.97±29.32 and 183.05±6.99 mg/L during summer and winter seasons,
respectively. Again, this increase was not significant as the p value was 0.20.
Aluminium sulphate or alum may be responsible for the increase of sulphate ion
concentration in the treatment processes. Aluminium sulphate aids in the removal of
suspended particles, as well as clear unwanted colour and turbidity from water
supplies. However, it is still critical for water treatment plants to neutralise the
aluminium and sulphate ions to within acceptable drinking water levels so that they do
not cause adverse health effects to consumers (Choy et al., 2014). The overall student
t-test showed that there was no significant difference (p ≥ 0.05) in the concentration of
sulphate between the study sites as well as between the sampled seasons, with p
values = 0.25 and 0.69, respectively.
4.2.2.5 Nitrate
Water quality monitoring shows that nitrate ion (NO3-) exists naturally in the
environment and changes forms as it moves through the nitrogen cycle (Leip et al.,
2015). However, excessive concentrations of nitrate-nitrogen in drinking water can be
hazardous to health, especially for infants and pregnant women (Jensen et al., 2014).
The permissible limit of the nitrate ion in drinking water is ≤11 mg/L for WHO, DWA
and SANS 241. The highest nitrate-nitrogen contents were found at the inlets, the raw
water reservoirs, for both study sites (Table 7). Mmabatho has the highest nitrate
concentration, especially in summer. The high levels of nitrate-nitrogen water pollution
are likely a result of the many agricultural and farming activities dominating the towns,
domestic effluents, leachates from refuse dumps, sewage disposal and some
industrial discharges. The nitrate content measured at the inlet during summer was
3.07±0.23 mg/L, while in winter it was 2.24±1.37 mg/L. In Klerksdorp, the nitrate
concentration at the inlet was higher in winter than in summer, measuring 2.31±0.96
and 0.71±0.66 mg/L respectively. There was no significant difference (p ≥ 0.05) in the
overall means of nitrate-nitrogen between the study areas and between the seasons,
with p values equal to 0.21 and 0.69, respectively.

68
Table 7: Seasonal mean values of the most prevalent anions in mg/L
Chloride Nitrate Sulphate
Summer Winter Summer Winter Summer Winter
MWC 1 61.73±3.78 39.14±18.52 0.71±0.66 2.31±0.96 135.53±16.01 123.42±83.76
MWC 2 51.95±1.73 57.62±6.51 0.82±0.81 2.72±0.25 152.23±23.29 174.60±23.31
MWTP 1 226.86±4.79 217.83±9.71 3.07±0.23 2.24±1.37 168.51±24.61 131.75±83.44
MWTP 2 242.41±1.17 210.16±0.08 0.83±0.82 1.61±0.88 187.97±29.32 183.05±6.99
DWA ≤250 ≤11 ≤500
WHO ≤250 ≤11 ≤500
SANS ≤300 ≤11 ≤500
Note: 1 represent inlet values and 2 represent outlet values.

69
4.2.2.6 Total hardness
The total hardness (TH) of water is not known to cause any potential health risks to
human health. However, WHO has a recommendation that the TH of drinking water
should not exceed 500 mg/L (Edition, 2011). The challenge with water hardness above
500 mg/L is that an excess use of soap is needed to achieve effective cleaning. Again,
hard potable water may modify the chemical forms of fluoride and other trace
elements; therefore, it may act as a secondary factor in the overall toxicity of drinking
water (Haydar et al., 2016).
Total hardness represents the concentration of calcium and magnesium in water
(Krishnan et al., 2007). Drinking water with a hardness of <61 mg/L is considered soft;
61–120 mg/L is moderately hard; 121–180 mg/L is hard; and more than 180 mg/L is
considered very hard (Edition, 2011). The desirable upper limit of TH in drinking water
is 200 mg/L according to DWA and SANS 241, while the WHO has a range of between
100 and 500 mg/L.
Table 8 shows that the total hardness (TH) of water at the inlets of the two study sites
ranged from 216.58 mg/L to 360.52 mg/L. At the water outlets of the sites, the TH
ranged from 42.56 mg/L to 267.64 mg/L. The acceptable limits of total hardness in
drinking water according to the WHO, DWA and SANS are ≥20 to ≤200, ≥100 to ≤500,
and ≥20 to ≤200, respectively. This means the TH of water was above the acceptable
limits at all the water inlets. After the treatment process, only the TH of water from
Klerksdorp fell to within the specified acceptable limits, but in Mmabatho, the total
hardness was still above specified TH standards after water treatment. In Klerksdorp,
the total hardness of water before treatment was 240.83±46.22 and 216.58±76.09
mg/L during summer and winter, respectively. After treatment, the TH was
67.81±20.98 and 42.56±11.76 mg/L for summer and winter, respectively. There was
a significant difference (p ≤ 0.05) in the concentration of TH of water at the inlet and
outlet in Klerksdorp, with the p value equal to 0.01. In Mmabatho, the concentration of
TH of water before treatment was 360.52±4.88 and 352.36±19.76 mg/L during
summer and winter seasons, respectively. After treatment, the concentration of TH of
water was 267.64±13.56 and 261.94±15.27 mg/L during summer and winter seasons,
respectively. Again, there was a significant difference between the inlet and outlet
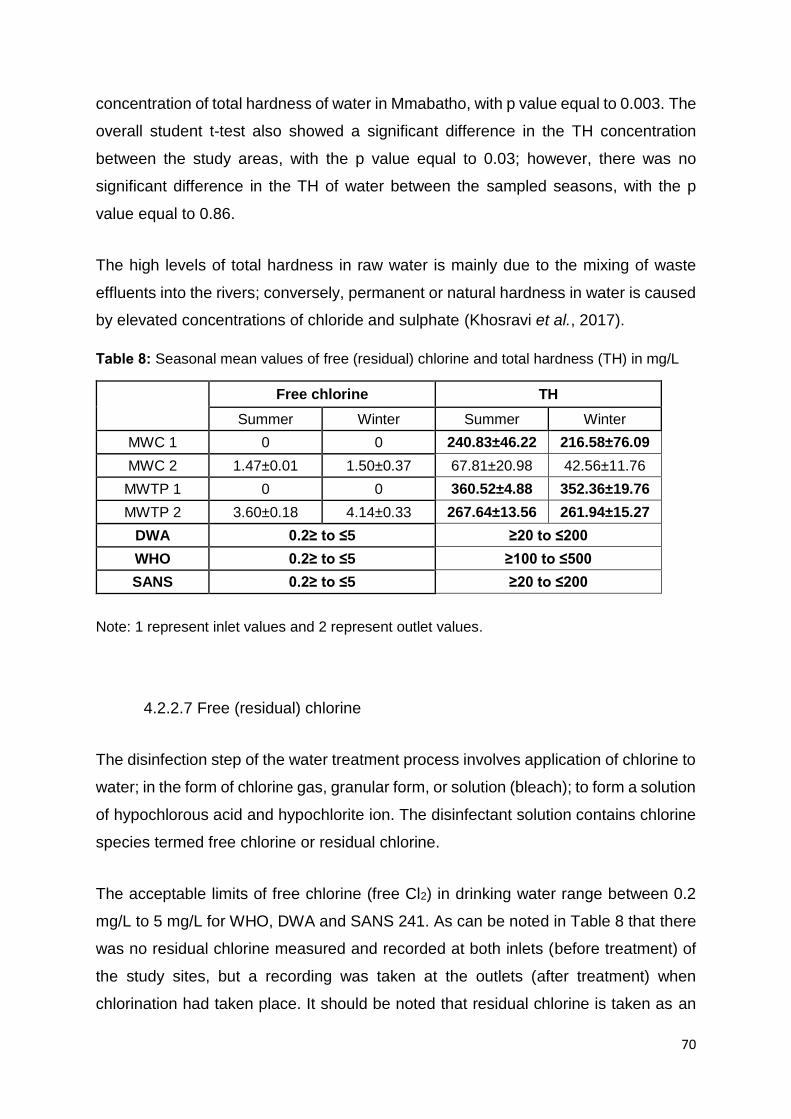
70
concentration of total hardness of water in Mmabatho, with p value equal to 0.003. The
overall student t-test also showed a significant difference in the TH concentration
between the study areas, with the p value equal to 0.03; however, there was no
significant difference in the TH of water between the sampled seasons, with the p
value equal to 0.86.
The high levels of total hardness in raw water is mainly due to the mixing of waste
effluents into the rivers; conversely, permanent or natural hardness in water is caused
by elevated concentrations of chloride and sulphate (Khosravi et al., 2017).
Table 8: Seasonal mean values of free (residual) chlorine and total hardness (TH) in mg/L
Free chlorine TH
Summer Winter Summer Winter
MWC 1 0 0 240.83±46.22 216.58±76.09
MWC 2 1.47±0.01 1.50±0.37 67.81±20.98 42.56±11.76
MWTP 1 0 0 360.52±4.88 352.36±19.76
MWTP 2 3.60±0.18 4.14±0.33 267.64±13.56 261.94±15.27
DWA 0.2≥ to ≤5 ≥20 to ≤200
WHO 0.2≥ to ≤5 ≥100 to ≤500
SANS 0.2≥ to ≤5 ≥20 to ≤200
Note: 1 represent inlet values and 2 represent outlet values.
4.2.2.7 Free (residual) chlorine
The disinfection step of the water treatment process involves application of chlorine to
water; in the form of chlorine gas, granular form, or solution (bleach); to form a solution
of hypochlorous acid and hypochlorite ion. The disinfectant solution contains chlorine
species termed free chlorine or residual chlorine.
The acceptable limits of free chlorine (free Cl2) in drinking water range between 0.2
mg/L to 5 mg/L for WHO, DWA and SANS 241. As can be noted in Table 8 that there
was no residual chlorine measured and recorded at both inlets (before treatment) of
the study sites, but a recording was taken at the outlets (after treatment) when
chlorination had taken place. It should be noted that residual chlorine is taken as an

71
index of pollution in treated water. This is because an optimal point of disinfection
happens when there is a balance between the chlorine demanded and consumed by
the treatment process. Therefore, any chlorine species remaining after the disinfection
process has taken place is unfavourable for human consumption.
Table 8 shows that the residual chlorine content measured at both Klerksdorp and
Mmabatho was within the permissible drinking water quality limits. In Klerksdorp, the
mean residual chlorine concentration was 1.47±0.01 mg/L during summer season and
1.50±0.37 mg/L during the winter season. In Mmabatho, the mean residual chlorine
was within the permissible limit though a bit higher, and measured 3.60±0.18 mg/L in
summer, and 4.14±0.33 mg/L in winter. There was a clear significant difference in the
free chlorine measurements before and after the treatment processes, with the p
values of 0.0001 and 0.005 in Klerksdorp and Mmabatho, respectively. Furthermore,
the high and low concentrations of free chlorine in drinking water may lead to health,
aesthetic and operational risks. A free chlorine content that is less than 0.2 mg/L may
increase the turbidity of water as a result of microbial recontamination at the point of
distribution; and a residual chlorine content of >5 mg/L is aesthetically unacceptable.
There was no significant difference (p ≥ 0.05) in the overall means of free chlorine
between the study areas as well as between the seasons measured, with p = 0.92 and
0.36, respectively.
In summary, both the conventional and non-conventional (advanced) water treatment
processes employed at the two study areas in the North West province were effective
in treating the chemical pollutants in the water sources. The exception was the
effective removal of total hardness and calcium in Mmabatho’s processed water.
Although the chemical parameters measured are not known to cause any adverse or
long health impacts, it is however imperative to control them for aesthetic quality of
drinking water. Calcium, in the form of carbonates, is naturally occurring in
sedimentary environments, hence the mineral may be dissolved by the water sources
influenced by high temperatures. The chemical parameters that were measured are
total hardness, magnesium, calcium, sodium, chloride, sulphate, nitrate and the
residual chlorine. Another parameter that raised concern, even though the
concentration of outlet water was within the acceptable level, was the sulphate. The
72
sulphate ion in the form of aluminium sulphate is used in one of the stages in treatment
process hence it needs close monitoring.
4.2.3 Microbiological properties
An important source of microbial contamination of surface and/or groundwater is runoff
water from agricultural, pasture lands, and urban areas (Meffe & de Bustamante,
2014). Faecal bacteria enter surface water by direct deposit of animal faeces and by
overland runoff. The movement of faecal wastes into water sources is the major factor
contributing to the detection of E. coli and total coliform (TC) bacteria in domestic
water.
4.2.3.1 E. coli and total coliforms
The ability of faecal bacteria to survive in environmental waters generally increases as
the temperature decreases. Coliforms have no taste, smell, or colour. They can only
be detected through a laboratory test. The guideline value for E. coli and total coliforms
in drinking water as prescribed by WHO, DWA, and SANS 241 is “none detectable
colony forming unit (CFU) in any 100 mL sample of water” (Affairs & Services, 2005;
Edition, 2011)
The mean microbial counts for E. coli and TC were counted for sampled water, at the
inlets (before chlorination) and outlets (after chlorination) from the study areas and
recorded as the number of colony forming units (CFU) per 100mL (Table 9). The
results obtained indicate that the sources that supply Klerksdorp and Mmabatho are
highly contaminated with bacteria. The total coliforms recorded at Klerksdorp during
the summer and winter seasons were 74855±3047.63 and 2912.80±2493.05 CFU/
100 mL, respectively.

73
Table 9: Seasonal mean values of E. coli and Total coliform (TC) in CFU/100 mL
E. coli Total coliform
Summer Winter Summer Winter
MWC 1 14.50±4.95 45.00±49.50 74855.00 ± 3047.63 2912.80±2493.05
MWC 2 0.00±0.00 0.00±0.00 0.00±0.00 0.00±0.00
MWTP 1 41.50±44.55 25.50±34.65 920356.00±56.57 10024.50±21.93
MWTP 2 0.00±0.00 0.00±0.00 0.00±0.00 0.00±0.00
DWA 0 0 - 5
WHO 0 0
SANS 0 0
Note: 1 represent inlet values and 2 represent outlet values.

74
In the great majority of studies, microbial contamination is more often detected and
found at higher concentrations during the wet seasons (Rochelle-Newall et al., 2015).
This trend is observed in the data for Mmabatho. In Mmabatho, the total coliform
measured before treatment was 920356±56.57 and 10024.50±21.93 CFU/100 mL for
summer and winter, respectively. Again, this trend coincides with seasonal patterns in
health outcomes, such as diarrheal diseases, that are associated with drinking faecal-
contaminated water. These diseases are known to be more prevalent during periods
of heavy rainfall and floods (Kostyla et al., 2015). After treatment, no total coliform
bacteria were detected at both study areas, and for all sampled seasons. There was
no significant difference in the total coliform measurement between the inlet and the
outlet at both study areas, with the p values equal to 0.39 and 0.41, respectively.
Again, the student t-test showed no significant differences in the measurements
between both study areas, as well as between the sampled seasons, with the p values
equal to 0.39 and 0.32, respectively.
Similarly, the E. coli detected at the inlets of Klerksdorp and Mmabatho ranged from
14.50 to 45.00 CFU/100 mL. In Klerksdorp, the E. coli measured at before water
treatment was 14.50±4.95 and 45.00±49.50 CFU/100 mL during summer and winter,
respectively. In Mmabatho, the E. coli was 41.50±44.55 and 25.50±34.65 CFU/100
mL for summer and winter, respectively. There was no significant difference at the E.
coli measurements in Klerksdorp, with the p value equal to 0.19. However, there was
a significant difference in the E. coli measurements for Mmabatho, with the p value
equal to 0.05. Overall, the student t-test show that there was no significant differences
in measurements for E. coli between the study areas, as well as between the sampled
seasons with p values equal to 0.90 and 0.81, respectively.
In summary, microbial contaminants were well treated and eliminated by the two water
treatment processes, rendering the two water treatment processes effective. The
sources of microbial pollution are the mixing of water from the municipal wastewater
treatment systems as well as runoff of faecal matter into surface water sources.

75
4.3 Summary
Overall, the water quality parameters from the outlets (post-treated water), except for
temperature and pH, were significantly different from the inlets (pre-treated water).
This means Klerksdorp and Mmabatho water treatment systems have, and are able
to produce, fairly good potable. The contamination of outlet water (post-treatment) is
the most concerning in all water quality studies because it has a greater potential to
cause adverse effects to human health in the long run. This is the reason water quality
studies, assessments and monitoring continue to be important and relevant at
municipal, governmental, provincial and national level. The majority of the physico-
chemical and microbial properties of water were found to be within permissible limits
according to the World Health Organisation, Department of Water Affairs and the
South African National Standard guidelines for drinking water quality.

76
CHAPTER FIVE
CONCLUSION AND RECOMMENDATIONS
5.1 Conclusion
This study aimed to assess the effectiveness of domestic water treatment processes
in the North West province, South Africa. This was achieved by analysing the physico-
chemical and microbial properties of water from the water treatment plants of the two
study areas. In addition, a major objective was formulated to achieve the aim of this
study. The overall conclusions from the study are presented in the sections that follow.
I. Analysing the processes used in the two water treatment plants in the
North West province of South Africa
The conventional treatment process by filtration, alum treatment, and disinfection by
chlorination is, and has been, relied upon by many water treatment plants; and offers
the most sustainable way to eliminate health risks as a result of consuming
contaminated water (Gitis & Hankins, 2018). This study revealed that a conventional
water treatment process with rapid-sand filtration and chlorination can treat the most
widespread source of municipal and agricultural pollution and/or runoff in the Setumo
Dam, the water source feeding the Mafikeng Local Municipality, in the North West
province. The exception were parameters such as conductivity, turbidity, hardness,
and calcium that were still present in the water after the treatment process at the levels
exceeding the standard limits as specified by the SANS 241 for drinking water quality.
The non-conventional (advanced) water treatment process used by the Midvaal Water
Company, in Klerksdorp, is the most effective water treatment process for domestic
water treatment and purification. The advantages of the pre- and intermediate
ozonation step in the purification process of the Middle Vaal River, which is known to
be affected with the major algal species, cannot be understated (Morrison et al., 2012).
The intermediate ozonation step plays a crucial role in the elimination of unwanted
species and contaminants that vary the physico-chemical characteristics of the output

77
water; while the pre-ozonation step removed most of the trivial algal species very early
into the treatment process. Additionally, the combination of the intermediate ozonation
and the dissolved air flotation steps were very crucial in the effective removal and
elimination of: organic and inorganic matter, including natural organic matters (NOM);
micro-pollutants such as pesticides; disinfection by-products (DBP’s) such as
trihalomethanes (THMs); and odour and taste.
II. Analysing the physico-chemical properties of water from the selected
sample points of the water treatment plants in the North West province
The quality of water in Mafikeng and Klerksdorp, which are both situated the North
West province, were successfully analysed to determine their physico-chemical
properties. The 14 physico-chemical parameters measured were compared to the
drinking water quality guidelines as set out by the WHO, DWA, and SANS (DWAF,
1996d). Their comparison to these standards yielded results of whether or not the
water is suitable for domestic purposes after the treatment process.
Most physico-chemical parameters analysed at the study sites were within the
permissible limits according to the drinking water quality guidelines (DWAF, 1996b)
except few parameters such as electrical conductivity, total hardness, turbidity and
calcium; particularly in Mmabatho; which exceeded the total water quality ranges
(TWQRs) after the treatment process. The excessive levels in these physico-chemical
parameters is most likely the cause of the aesthetic, taste and scaling problems,
amongst the many challenges that have been reported in Mmabatho. Furthermore, a
seasonal variation was notable from both study sites, with higher levels measured
during the wet-summer seasons.
Overall, Mmabatho Water Treatment Plant produces and supplies fairly good domestic
water despite the poor status in the Blue Drop Score rating. The only concern for
Mmabatho is the long term impacts for failure to meet all the water quality guidelines.
Some more work needs to be done to investigate further the core problems and their
long term effect on the operational and health risk of the consumers. Klerksdorp, on
the other hand, has continually maintained their excellent Blue Drop Score status over
78
the past years according to the statistics by the Department of Water and Sanitation
(DWS website, 2019).
III. Investigating the microbiological properties of water, in particular, the
Escherichia coli and total coliform from the selected sample points of the
water treatment plants in the North West province
The microbial properties of water samples, particularly E. coli and total coliform, from
Klerksdorp and Mmabatho Water Treatment Plant in the North West province were
investigated. The results clearly indicate significant differences in individual levels of
bacterial pollutants (total coliform and E. coli) at the inlet. However, statistically there
were insignificant differences in E. coli and total coliforms levels during the wet-
summer and dry-winter seasons. The presence of E. coli in concentrations above the
SANS 241 (2015) and WHO Guidelines for Drinking Water Quality specifications is
unacceptable in drinking water. From this study, no bacterial pollutants were detected
at the outlet of all sampled water which means the WTPs of the study areas were able
to eliminate the major health risks from domestic water distribution systems.
5.2 Recommendations
With reference to this study, the following recommendations are suggested:
Parameters such as pH, conductivity, turbidity, faecal coliform and residual
chlorine (for water treated with chlorine-based disinfectants) should be tested
and closely monitored at all points in the water treatment system. These
substances are indicators of potential problems in the water system, and give
an indication of the general water quality (DWAF, 1996).
The present study did not analyse for chemical oxygen demand (COD) and
biological oxygen demand (BOD). It is recommended that future studies should
analyse and monitor for COD and BOD from the study areas because of the
major agricultural activities. These parameters provide vital information that
79
indicate the presence of toxic organic pollutants in the water system
(Organization, 1993).
The study recommends adherence to strict environmental policies and
procedures that do not allow any treated or untreated effluent into open
channels without prior authorisation. Additionally, all waste or effluent water
generating industries, including the municipal wastewater, are required to pre-
treat the effluent to conform with required wastewater quality guidelines before
discharging to the centralised wastewater treatment plant. The Department of
Water and Sanitation has a set of guidelines that should be adhered to ensure
protection of the receiving water bodies. Poorly treated wastewater effluent is
the major cause for the eutrophication of fresh water bodies, and create
environmental conditions that favour proliferation of waterborne pathogens
(Ahmad et al., 2008).
The physico-chemical and microbiological levels should be correlated to rainfall
patterns as well as the river flow conditions. This correlation will help explain
seasonal variations and trends observed in the surface water systems and their
respective treatment plants (Bezuidenhout, 2013).
E. coli species confirmed by biochemical techniques (such as API, EnteroPluri-
Test) and the identification should be further confirmed by molecular methods.
A polymerase chain reaction (PCR) amplification procedure that uses E. coli
and coliform detection genes such as lacZ and uidA could be used for this
purpose (Deshmukh et al., 2016).
This study presented the baseline data on the current state of potable water quality in
the North West province of South Africa. With the rise in industrialisation and global
warming, more environmental challenges, especially those that will affect the surface
water quality, are imminent. Therefore, there is still a gap in the market to look at other
practical but effective ways to improve water treatment of domestic water, especially
at the point-of-use. Some POU technologies have emerged as a way to empower
people and communities without an access to safe water to improve their water quality
by treating it at their homes by using readily available material, such as ceramic and
80
bio-sand, as household water filters. These materials have been identified by Rosa et
al. (2016) as simple, effective and sustainable methods that may reduce waterborne
diseases in drinking water. However, attention still needs to be drawn into continual
monitoring of natural water resources, and upgrade the existing water treatment
infrastructures according to the changes in the physico-chemical and biological
properties of the natural waters. Furthermore, a detailed study into the presence of
new and emerging pollutants such as pharmaceutical and personal care products in
natural waters in the North West province needs to be looked at as it is an emerging
source of water quality concern.

81
REFERENCES
Affairs, D.o.W. & Forestry. 1998. National Water Act No. 36 of 1998: Statutes of the
Republic of South Africa: Water Pretoria.
Affairs, S.A.D.o.W. & Services, F.C.D.C. 2005. Drinking Water Quality Regulation
Strategy: The Role of National and Provincial Government in Regulation of Drinking
Quality Water: Department of Water Affairs and Forestry.
Ahjum, F., Hughes, A. & Fant, C. 2015. Climate, land, energy and water strategies in
the City of Cape Town.
Ahmad, M., Bajahlan, A.S. & Hammad, W.S. 2008. Industrial effluent quality, pollution
monitoring and environmental management. Environmental Monitoring and
Assessment, 147(1-3):297-306.
Ali, I. 2012. New generation adsorbents for water treatment. Chemical Reviews,
112(10):5073-5091.
Ali, I. 2014. Water treatment by adsorption columns: evaluation at ground level.
Separation and Purification Reviews, 43(3):175-205.
Allard, S., Tan, J., Joll, C.A. & Von Gunten, U. 2015. Mechanistic study on the
formation of Cl-/Br-/I-trihalomethanes during chlorination/chloramination combined
with a theoretical cytotoxicity evaluation. Environmental science & technology,
49(18):11105-11114.
Alrumman, S.A., El-kott, A.F. & Keshk, S.M. 2016. Water pollution: source &
treatment. American Journal of Environmental Engineering, 6(3):88-98.
Ang, W.L., Mohammad, A.W., Hilal, N. & Leo, C.P. 2015. A review on the applicability
of integrated/hybrid membrane processes in water treatment and desalination plants.
Desalination, 363:2-18.
82
Asghari, F.B., Jaafari, J., Yousefi, M., Mohammadi, A.A. & Dehghanzadeh, R. 2018.
Evaluation of water corrosion, scaling extent and heterotrophic plate count bacteria in
asbestos and polyethylene pipes in drinking water distribution system. Human and
Ecological Risk Assessment: An International Journal, 24(4):1138-1149.
Axelrod, R.S. & VanDeveer, S.D. 2014. The global environment: institutions, law, and
policy: CQ Press.
Bain, R., Cronk, R., Hossain, R., Bonjour, S., Onda, K., Wright, J., et al. 2014. Global
assessment of exposure to faecal contamination through drinking water based on a
systematic review. Tropical Medicine and International Health, 19(8):917-927.
Barlow, M. & Clarke, T. 2017. Blue gold: the battle against corporate theft of the
world's water: Routledge.
Barnes, M.A., Turner, C.R., Jerde, C.L., Renshaw, M.A., Chadderton, W.L. & Lodge,
D.M. 2014. Environmental conditions influence eDNA persistence in aquatic systems.
Environmental Science and Technology, 48(3):1819-1827.
Benner, J., Helbling, D.E., Kohler, H.-P.E., Wittebol, J., Kaiser, E., Prasse, C., et al.
2013. Is biological treatment a viable alternative for micropollutant removal in drinking
water treatment processes? Water Research, 47(16):5955-5976.
Betancourt, W.Q. & Rose, J.B. 2004. Drinking water treatment processes for removal
of Cryptosporidium and Giardia. Veterinary Parasitology, 126(1-2):219-234.
Bezuidenhout, C. 2013. A Large-scale Study of Microbial and Physico-chemical
Quality of Selected Groundwaters and Surface Waters in the North West province,
South Africa: A Report to the Water Research Commission.
Boateng, T.K., Opoku, F., Acquaah, S.O. & Akoto, O. 2016. Groundwater quality
assessment using statistical approach and water quality index in Ejisu-Juaben
Municipality, Ghana. Environmental Earth Sciences, 75(6):489.

83
Boleda, M.R., Galceran, M.T. & Ventura, F. 2011. Behavior of pharmaceuticals and
drugs of abuse in a drinking water treatment plant (DWTP) using combined
conventional and ultrafiltration and reverse osmosis (UF/RO) treatments.
Environmental Pollution, 159(6):1584-1591.
Bonton, A., Bouchard, C., Barbeau, B. & Jedrzejak, S. 2012. Comparative life cycle
assessment of water treatment plants. Desalination, 284:42-54.
Byrne, J.A., Dunlop, P.S.M., Hamilton, J.W.J., Fernández-Ibáñez, P., Polo-López, I.,
Sharma, P.K., et al. 2015. A review of heterogeneous photocatalysis for water and
surface disinfection. Molecules, 20(4):5574-5615.
Cheremisinoff, N.P. 2001. Handbook of Water and Wastewater Treatment
Technologies: Butterworth-Heinemann.
Cheremisinoff, P.N. 2019. Handbook of Water and Wastewater Treatment
Technology: Routledge.
Chigor, V.N., Sibanda, T. & Okoh, A.I. 2013. Studies on the bacteriological qualities
of the Buffalo River and three source water dams along its course in the Eastern Cape
province of South Africa. Environmental Science and Pollution Research, 20(6):4125-
4136.
Chinyama, A., Ochieng, G., Nhapi, I. & Otieno, F. 2014. A simple framework for
selection of water quality models. Reviews in Environmental Science and
Bio/Technology, 13(1):109-119.
Choy, S.Y., Prasad, K.M.N., Wu, T.Y., Raghunandan, M.E. & Ramanan, R.N. 2014.
Utilization of plant-based natural coagulants as future alternatives towards sustainable
water clarification. Journal of Environmental Sciences, 26(11):2178-2189.
Das, R., Ali, M.E., Hamid, S.B.A., Ramakrishna, S. & Chowdhury, Z.Z. 2014. Carbon
nanotube membranes for water purification: a bright future in water desalination.
Desalination, 336:97-109.

84
Davis, M.L. 2010. Water and Wastewater Engineering: McGraw-Hill.
Delpla, I., Jung, A.-V., Baures, E., Clement, M. & Thomas, O. 2009. Impacts of
climate change on surface water quality in relation to drinking water production.
Environment International, 35(8):1225-1233.
Delpla, I. & Rodriguez, M.J. 2017. Variability of disinfection by-products at a full-scale
treatment plant following rainfall events. Chemosphere, 166:453-462.
Deshmukh, R.A., Joshi, K., Bhand, S. & Roy, U. 2016. Recent developments in
detection and enumeration of waterborne bacteria: a retrospective minireview.
Microbiology Open, 5(6):901-922.
Divrikli, U., Kartal, A.A., Soylak, M. & Elci, L. 2007. Preconcentration of Pb (II), Cr
(III), Cu (II), Ni (II) and Cd (II) ions in environmental samples by membrane filtration
prior to their flame atomic absorption spectrometric determinations. Journal of
Hazardous Materials, 145(3):459-464.
Du Plessis, J. & Schloms, B. 2017. An investigation into the evidence of seasonal
rainfall pattern shifts in the Western Cape, South Africa. Journal of the South African
Institution of Civil Engineering, 59(4):47-55.
Duse, A., Da Silva, M. & Zietsman, I. 2003. Coping with hygiene in South Africa, a
water scarce country. International Journal of Environmental Health Research,
13(sup1):S95-S105.
DWAF. 1996. South African water quality guidelines. Volume 1: Domestic Water Use:
Department of Water Affairs and Forestry Pretoria.
Edition, F. 2011. Guidelines for drinking-water quality. WHO Chronicle, 38(4):104-
108.
Ewerts, H., Barnard, S., Swanepoel, A., Du Preez, H. & van Vuuren, S.J. 2014.
Strategies of coagulant optimisation to improve the removal of turbidity and Ceratium
85
hirundinella cells during conventional drinking water purification. Water Science and
Technology: Water Supply, 14(5):820-828.
Faust, S.D. & Aly, O.M. 2018. Chemistry of Water Treatment: CRC Press.
Gadipelly, C., Pérez-González, A., Yadav, G.D., Ortiz, I., Ibáñez, R., Rathod, V.K., et
al. 2014. Pharmaceutical Industry Wastewater: Review of the Technologies for Water
Treatment and Reuse. Industrial and Engineering Chemistry Research,
53(29):11571-11592.
Gavrilescu, M., Demnerová, K., Aamand, J., Agathos, S. & Fava, F. 2015. Emerging
pollutants in the environment: Present and Future challenges in biomonitoring,
ecological risks and bioremediation. New Biotechnology, 32(1):147-156.
Gitis, V. & Hankins, N. 2018. Water treatment chemicals: Trends and Challenges.
Journal of Water Process Engineering, 25:34-38.
Gleick, P.H. 2014. The world's water volume 8: The biennial report on freshwater
resources. Vol. 8: Island Press.
Gough, R., Holliman, P.J., Willis, N. & Freeman, C. 2014. Dissolved organic carbon
and trihalomethane precursor removal at a UK upland water treatment works. Science
of The Total Environment, 468:228-239.
Griggs, D., Stafford-Smith, M., Gaffney, O., Rockström, J., Öhman, M.C.,
Shyamsundar, P., et al. 2013. Policy: Sustainable development goals for people and
planet. Nature, 495(7441):305.
Gupta, V.K., Ali, I., Saleh, T.A., Nayak, A. & Agarwal, S. 2012. Chemical treatment
technologies for waste-water recycling—an overview. Royal Society of Chemistry
Advances, 2(16):6380-6388.
Harikumar, P.S., Aravind, A. & Vasudevan, S. 2017. Assessment of Water Quality
Status of Guruvayur Municipality. Journal of Environmental Protection,
Vol.08No.02:12.
86
Harvey, P.J., Handley, H.K. & Taylor, M. 2016. Widespread copper and lead
contamination of household drinking water, New South Wales, Australia.
Environmental Research, 151:275-285.
Haute, S.v., Sampers, I., Jacxsens, L. & Uyttendaele, M. 2015. Selection criteria for
water disinfection techniques in agricultural practices. Critical Reviews in Food
Science and Nutrition, 55(11):1529-1551.
Haydar, S., Arshad, M. & Aziz, J. 2016. Evaluation of drinking water quality in urban
areas of Pakistan: A case study of Southern Lahore. Pakistan Journal of Engineering
and Applied Sciences.
Helaluddin, A., Khalid, R.S., Alaama, M. & Abbas, S.A. 2016. Main analytical
techniques used for elemental analysis in various matrices. Tropical Journal of
Pharmaceutical Research, 15(2):427-434.
Hering, J.G. & Ingold, K.M. 2012. Water resources management: what should be
integrated? Science, 336(6086):1234-1235.
Hodgson, K. & Manus, L. 2006. A drinking water quality framework for South Africa.
Water SA, 32(5).
Holloway, R.W., Miller-Robbie, L., Patel, M., Stokes, J.R., Munakata-Marr, J., Dadakis,
J., et al. 2016. Life-cycle assessment of two potable water reuse technologies:
MF/RO/UV–AOP treatment and hybrid osmotic membrane bioreactors. Journal of
Membrane Science, 507:165-178.
Hoslett, J., Massara, T.M., Malamis, S., Ahmad, D., van den Boogaert, I., Katsou, E.,
et al. 2018. Surface water filtration using granular media and membranes: A review.
Science of The Total Environment, 639:1268-1282.
Hounslow, A. 2018. Water quality data: analysis and interpretation: CRC press.
87
Hua, G., Reckhow, D.A. & Abusallout, I. 2015. Correlation between SUVA and DBP
formation during chlorination and chloramination of NOM fractions from different
sources. Chemosphere, 130:82-89.
Humby, T.-L. 2013. Environmental justice and human rights on the mining wastelands
of the Witwatersrand gold fields. Revue générale de droit, 43:67-112.
Javid, A.H., Malakootian, M. & Mehdipour, M. 2015. Investigation of Ozone and
Coagulant Material's (Aluminum Sulfate, Ferric Chloride, Poly Aluminum Chloride and
Lime) Efficiency in'Kerman Kork'Industry Wastewater Treatment.
Jensen, V.B., Darby, J.L., Seidel, C. & Gorman, C. 2014. Nitrate in potable water
supplies: alternative management strategies. Critical Reviews in Environmental
Science and Technology, 44(20):2203-2286.
Kawamura, S. 2000. Integrated design and operation of water treatment facilities:
John Wiley & Sons.
Keith, L. 2017. Environmental sampling and analysis: a practical guide: Routledge.
Khan, S., Shahnaz, M., Jehan, N., Rehman, S., Shah, M.T. & Din, I. 2013. Drinking
water quality and human health risk in Charsadda district, Pakistan. Journal of
Cleaner Production, 60:93-101.
Khatri, N. & Tyagi, S. 2015. Influences of natural and anthropogenic factors on
surface and groundwater quality in rural and urban areas. Frontiers in Life Science,
8(1):23-39.
Khiadani, M., Kolivand, R., Ahooghalandari, M. & Mohajer, M. 2014. Removal of
turbidity from water by dissolved air flotation and conventional sedimentation systems
using poly aluminum chloride as coagulant. Desalination and Water Treatment, 52(4-
6):985-989.
Khosravi, R., Eslami, H., Almodaresi, S.A., Heidari, M., Fallahzadeh, R.A., Taghavi,
M., et al. 2017. Use of geographic information system and water quality index to
88
assess groundwater quality for drinking purpose in Birjand City, Iran. Desalination and
Water Treatment, 67(1):74-83.
Korotta-Gamage, S.M. & Sathasivan, A. 2017. A review: Potential and challenges of
biologically activated carbon to remove natural organic matter in drinking water
purification process. Chemosphere, 167:120-138.
Kostyla, C., Bain, R., Cronk, R. & Bartram, J. 2015. Seasonal variation of fecal
contamination in drinking water sources in developing countries: a systematic review.
Science of The Total Environment, 514:333-343.
Krishnan, R.R., Dharmaraj, K. & Kumari, B.R. 2007. A comparative study on the
physicochemical and bacterial analysis of drinking, borewell and sewage water in the
three different places of Sivakasi. Journal of Environmental Biology, 28(1):105-108.
Lee, S.-Y. & Park, S.-J. 2013. TiO 2 photocatalyst for water treatment applications.
Journal of Industrial and Engineering Chemistry, 19(6):1761-1769.
Leip, A., Billen, G., Garnier, J., Grizzetti, B., Lassaletta, L., Reis, S., et al. 2015.
Impacts of European livestock production: nitrogen, sulphur, phosphorus and
greenhouse gas emissions, land-use, water eutrophication and biodiversity.
Environmental Research Letters, 10(11):115004.
Liu, J., Zang, C., Tian, S., Liu, J., Yang, H., Jia, S., et al. 2013. Water conservancy
projects in China: achievements, challenges and way forward. Global Environmental
Change, 23(3):633-643.
Malatji, E.S. 2014. An analysis of strategy plan on business performance of a water
utility: a Midvaal water company case study.
Marlow, D.R., Moglia, M., Cook, S. & Beale, D.J. 2013. Towards sustainable urban
water management: A critical reassessment. Water Research, 47(20):7150-7161.

89
Matthews, M.W. & Bernard, S. 2015. Eutrophication and cyanobacteria in South
Africa's standing water bodies: A view from space. South African Journal of Science,
111(5-6):1-8.
Meffe, R. & de Bustamante, I. 2014. Emerging organic contaminants in surface water
and groundwater: a first overview of the situation in Italy. Science of The Total
Environment, 481:280-295.
Mkwate, R.C., Chidya, R.C.G. & Wanda, E.M.M. 2017. Assessment of drinking water
quality and rural household water treatment in Balaka District, Malawi. Physics and
Chemistry of the Earth, Parts A/B/C, 100:353-362.
Momba, M., Obi, C. & Thompson, P. 2009. Survey of disinfection efficiency of small
drinking water treatment plants: Challenges facing small water treatment plants in
South Africa. Water SA, 35(4):485-493.
Monnahela, K.S. 2014. The management of potable water supply in Khuma
Township, Matlosana Local Municipality.
Morrison, S., Venter, A. & Barnard, S. 2012. A case study to determine the efficacy
of ozonation in purification processes. Water SA, 38(1):49-54.
Mulamattathil, S.G., Bezuidenhout, C. & Mbewe, M. 2015. Analysis of physico-
chemical and bacteriological quality of drinking water in Mafikeng, South Africa.
Journal of Water and Health, 13(4):1143-1152.
Mulamattathil, S.G., Bezuidenhout, C., Mbewe, M. & Ateba, C.N. 2014. Isolation of
environmental bacteria from surface and drinking water in Mafikeng, South Africa, and
characterization using their antibiotic resistance profiles. Journal of Pathogens, 2014.
Munyati, C. 2015. A spatial analysis of eutrophication in dam reservoir water on the
Molopo River at Mafikeng, South Africa. Sustainability of Water Quality and Ecology,
6:31-39.
90
Nawab, J., Khan, S., Ali, S., Sher, H., Rahman, Z., Khan, K., et al. 2016. Health risk
assessment of heavy metals and bacterial contamination in drinking water sources: a
case study of Malakand Agency, Pakistan. Environmental Monitoring and
Assessment, 188(5):286.
Ngwenya, N., Ncube, E.J. & Parsons, J. 2013. Recent advances in drinking water
disinfection: successes and challenges. Reviews of environmental contamination and
toxicology. Springer. p. 111-170).
Organization, W.H. 1993. Guidelines for drinking-water quality: World Health
Organization.
Padmaja, K., Cherukuri, J. & Anji Reddy, M. 2014. Conventional to cutting edge
technologies in Drinking Water Purification–a REVIEW. International Journal of
Innovative Research in Science, Engineering and Technology, 3(2):9375-9385.
Paerl, H.W. & Otten, T.G. 2013. Harmful cyanobacterial blooms: causes,
consequences, and controls. Microbial Ecology, 65(4):995-1010.
Palamuleni, L. & Akoth, M. 2015. Physico-chemical and microbial analysis of selected
borehole water in Mahikeng, South Africa. International Journal of Environmental
Research and Public Health, 12(8):8619-8630.
Parsons, S.A. & Jefferson, B. 2006. Introduction to Potable Water Treatment
Processes: Blackwell publishing.
Peng, C.Y. & Zhang, J. 2012. Addressing urban water resource scarcity in China
from water resource planning experiences of Singapore. (In. Advanced Materials
Research organised by: Trans Tech Publ. p. 1213-1218).
Plappally, A. 2012. Energy requirements for water production, treatment, end use,
reclamation, and disposal. Renewable and Sustainable Energy Reviews, 16(7):4818-
4848.
91
Pratt, B. & Chang, H. 2012. Effects of land cover, topography, and built structure on
seasonal water quality at multiple spatial scales. Journal of Hazardous Materials,
209:48-58.
Qu, X., Alvarez, P.J. & Li, Q. 2013. Applications of Nanotechnology in Water and
Wastewater Treatment. Water Research, 47(12):3931-3946.
Richardson, S.D. & Ternes, T.A. 2014. Water Analysis: Emerging Contaminants and
Current Issues. Analytical Chemistry, 86(6):2813-2848.
Rivera-Utrilla, J., Sánchez-Polo, M., Ferro-García, M.Á., Prados-Joya, G. & Ocampo-
Pérez, R. 2013. Pharmaceuticals as emerging contaminants and their removal from
water. A review. Chemosphere, 93(7):1268-1287.
Rivett, U., Champanis, M. & Wilson-Jones, T. 2013. Monitoring drinking water quality
in South Africa: Designing information systems for local needs. Water SA, 39(3):409-
414.
Robert, E., Grippa, M., Kergoat, L., Pinet, S., Gal, L., Cochonneau, G., et al. 2016.
Monitoring water turbidity and surface suspended sediment concentration of the Bagre
Reservoir (Burkina Faso) using MODIS and field reflectance data. International
Journal of Applied Earth Observation and Geoinformation, 52:243-251.
Rochelle-Newall, E., Nguyen, T.M.H., Le, T.P.Q., Sengtaheuanghoung, O. & Ribolzi,
O. 2015. A short review of fecal indicator bacteria in tropical aquatic ecosystems:
knowledge gaps and future directions. Frontiers in Microbiology, 6:308.
Rodriguez-Narvaez, O.M., Peralta-Hernandez, J.M., Goonetilleke, A. & Bandala, E.R.
2017. Treatment technologies for emerging contaminants in water: A review.
Chemical Engineering Journal, 323:361-380.
Rosa, G., Kelly, P. & Clasen, T. 2016. Consistency of use and effectiveness of
household water treatment practices among urban and rural populations claiming to
treat their drinking water at home: a case study in Zambia. The American Journal of
Tropical Medicine and Hygiene, 94(2):445-455.
92
Roy, S., Phetxumphou, K., Dietrich, A.M., Estabrooks, P.A., You, W. & Davy, B.M.
2015. An evaluation of the readability of drinking water quality reports: a national
assessment. Journal of Water and Health, 13(3):645-653.
Saritha, V., Srinivas, N. & Vuppala, N.S. 2017. Analysis and optimization of
coagulation and flocculation process. Applied Water Science, 7(1):451-460.
Schutte, C. 2001. Quality of Domestic Water Supplies, Vol. 3: Analysis Guide. Water
Research Commission, 1st ed., Report TT129/00, Pretoria, South Africa.
Shanmuganathan, S., Loganathan, P., Kazner, C., Johir, M. & Vigneswaran, S. 2017.
Submerged membrane filtration adsorption hybrid system for the removal of organic
micropollutants from a water reclamation plant reverse osmosis concentrate.
Desalination, 401:134-141.
Sharma, P.J., Patel, P. & Jothiprakash, V. 2019. Impact of rainfall variability and
anthropogenic activities on streamflow changes and water stress conditions across
Tapi Basin in India. Science of the Total Environment, 687:885-897.
Shigut, D.A., Liknew, G., Irge, D.D. & Ahmad, T. 2017. Assessment of physico-
chemical quality of borehole and spring water sources supplied to Robe Town, Oromia
region, Ethiopia. Applied Water Science, 7(1):155-164.
Sobsey, M.D., Stauber, C.E., Casanova, L.M., Brown, J.M. & Elliott, M.A. 2008. Point
of use household drinking water filtration: a practical, effective solution for providing
sustained access to safe drinking water in the developing world. Environmental
Science and Technology, 42(12):4261-4267.
Spellman, F.R. 2013. Handbook of Water and Wastewater Treatment Plant
Operations: CRC Press.
Spellman, F.R. 2017. The Drinking Water Handbook: CRC Press.
Stats, S. 2011. Statistics South Africa. Formal Census.

93
Sun, Y., Chen, Z., Wu, G., Wu, Q., Zhang, F., Niu, Z., et al. 2016. Characteristics of
water quality of municipal wastewater treatment plants in China: implications for
resources utilization and management. Journal of Cleaner Production, 131:1-9.
Tchounwou, P.B., Yedjou, C.G., Patlolla, A.K. & Sutton, D.J. 2012. Heavy metal
toxicity and the environment. Molecular, clinical and environmental toxicology.
Springer. p. 133-164).
Tetteh, E.K. & Rathilal, S. 2019. Application of Organic Coagulants in Water and
Wastewater Treatment. Organic Polymers. IntechOpen.
Tietenberg, T.H. & Lewis, L. 2016. Environmental and natural resource economics:
Routledge.
Tijani, J.O., Fatoba, O.O. & Petrik, L.F. 2013. A review of pharmaceuticals and
endocrine-disrupting compounds: sources, effects, removal, and detections. Water,
Air and Soil Pollution, 224(11):1770.
Uyttendaele, M., Jaykus, L.A., Amoah, P., Chiodini, A., Cunliffe, D., Jacxsens, L., et
al. 2015. Microbial hazards in irrigation water: Standards, norms, and testing to
manage use of water in fresh produce primary production. Comprehensive Reviews
in Food Science and Food Safety, 14(4):336-356.
van Rensburg, S.J., Barnard, S. & Krüger, M. 2016. Challenges in the potable water
industry due to changes in source water quality: case study of Midvaal Water
Company, South Africa. Water SA, 42(4):633-640.
Vingerhoeds, M.H., Nijenhuis-de Vries, M.A., Ruepert, N., van der Laan, H., Bredie,
W.L. & Kremer, S. 2016. Sensory quality of drinking water produced by reverse
osmosis membrane filtration followed by remineralisation. Water Research, 94:42-51.
Visvanathan, C., Vigneswaran, S. & Kandasamy, J. 2015. Rainwater Collection and
Storage in Thailand: Design, Practices and Operation. Journal of Water Sustainability,
5(4):129.

94
Wanda, E.M., Mamba, B.B. & Msagati, T.A. 2016a. Determination of the water quality
index ratings of water in the Mpumalanga and North West provinces, South Africa.
Physics and Chemistry of the Earth, Parts A/B/C, 92:70-78.
Wanda, E.M., Mamba, B.B. & Msagati, T.A. 2016b. Hydrochemical modelling of water
quality in terms of emerging micropollutants in Mpumalanga, Gauteng and North West
Provinces. Physics and Chemistry of the Earth, Parts A/B/C.
Water, U. 2014. United Nations Water. Water in the Green Economy in Practice.
Wilcox, J., Nasiri, F., Bell, S. & Rahaman, M.S. 2016. Urban water reuse: A triple
bottom line assessment framework and review. Sustainable Cities and Society,
27:448-456.
Wu, Y. & Chen, J. 2013. Investigating the effects of point source and nonpoint source
pollution on the water quality of the East River (Dongjiang) in South China. Ecological
Indicators, 32:294-304.
Wu, Z., Fang, J., Xiang, Y., Shang, C., Li, X., Meng, F., et al. 2016. Roles of reactive
chlorine species in trimethoprim degradation in the UV/chlorine process: Kinetics and
transformation pathways. Water Research, 104:272-282.
Zahrim, A. & Hilal, N. 2013. Treatment of highly concentrated dye solution by
coagulation/flocculation–sand filtration and nanofiltration. Water Resources and
Industry, 3:23-34.
Zaman, S., Begum, A., Rabbani, K. & Bari, L. 2016. Low cost and sustainable surface
water purification methods using Moringa seeds and scallop powder followed by bio-
sand filtration. Water Science and Technology: Water Supply, 17(1):125-137.
Zamyadi, A., Dorner, S., Sauvé, S., Ellis, D., Bolduc, A., Bastien, C., et al. 2013.
Species-dependence of cyanobacteria removal efficiency by different drinking water
treatment processes. Water Research, 47(8):2689-2700.

95
Zanacic, E., Stavrinides, J. & McMartin, D.W. 2016. Field-analysis of potable water
quality and ozone efficiency in ozone-assisted biological filtration systems for surface
water treatment. Water Research, 104:397-407.
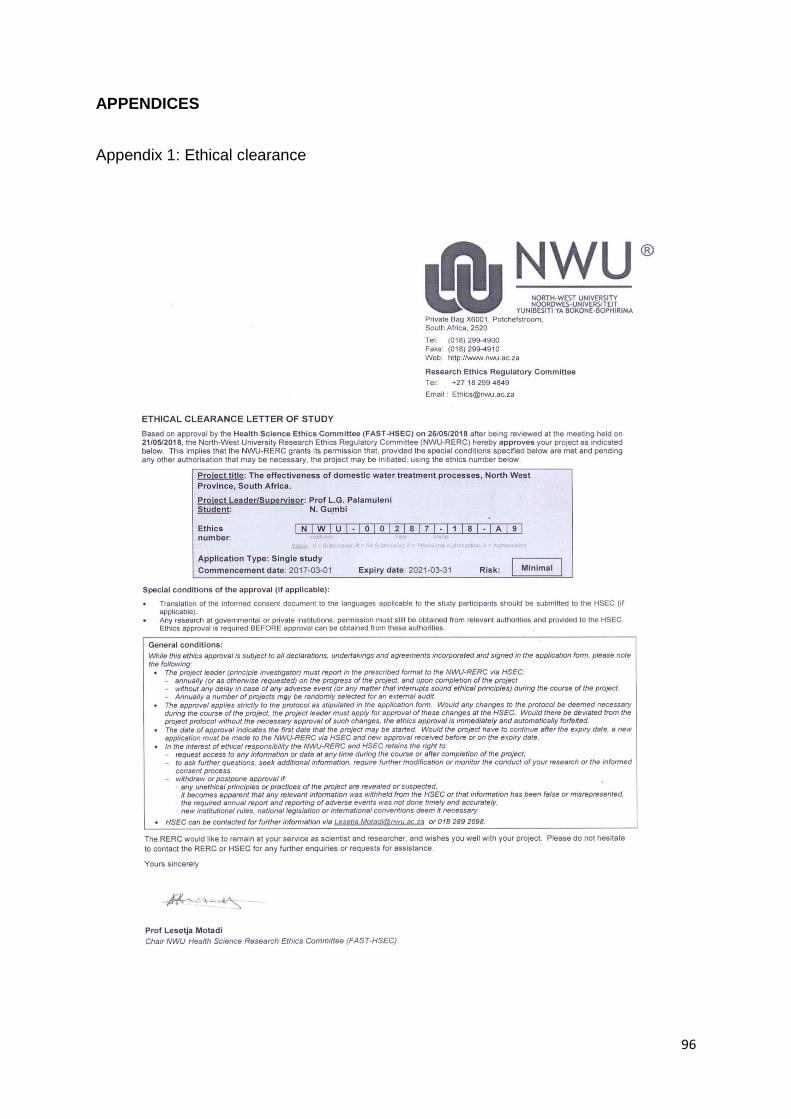
96
APPENDICES
Appendix 1: Ethical clearance

97
Appendix 2: Raw data

98

99