
The effectiveness of computer-assisted instruction and ...
203
University of Massachusetts Amherst University of Massachusetts Amherst ScholarWorks@UMass Amherst ScholarWorks@UMass Amherst Doctoral Dissertations 1896 - February 2014 1-1-1990 The effectiveness of computer-assisted instruction and computer The effectiveness of computer-assisted instruction and computer programming in elementary and secondary mathematics : a meta- programming in elementary and secondary mathematics : a meta- analysis. analysis. Wen-Cheng Lee University of Massachusetts Amherst Follow this and additional works at: https://scholarworks.umass.edu/dissertations_1 Recommended Citation Recommended Citation Lee, Wen-Cheng, "The effectiveness of computer-assisted instruction and computer programming in elementary and secondary mathematics : a meta-analysis." (1990). Doctoral Dissertations 1896 - February 2014. 4568. https://scholarworks.umass.edu/dissertations_1/4568 This Open Access Dissertation is brought to you for free and open access by ScholarWorks@UMass Amherst. It has been accepted for inclusion in Doctoral Dissertations 1896 - February 2014 by an authorized administrator of ScholarWorks@UMass Amherst. For more information, please contact [email protected].
Transcript of The effectiveness of computer-assisted instruction and ...

University of Massachusetts Amherst University of Massachusetts Amherst
ScholarWorks@UMass Amherst ScholarWorks@UMass Amherst
Doctoral Dissertations 1896 - February 2014
1-1-1990
The effectiveness of computer-assisted instruction and computer The effectiveness of computer-assisted instruction and computer
programming in elementary and secondary mathematics : a meta-programming in elementary and secondary mathematics : a meta-
analysis. analysis.
Wen-Cheng Lee University of Massachusetts Amherst
Follow this and additional works at: https://scholarworks.umass.edu/dissertations_1
Recommended Citation Recommended Citation Lee, Wen-Cheng, "The effectiveness of computer-assisted instruction and computer programming in elementary and secondary mathematics : a meta-analysis." (1990). Doctoral Dissertations 1896 - February 2014. 4568. https://scholarworks.umass.edu/dissertations_1/4568
This Open Access Dissertation is brought to you for free and open access by ScholarWorks@UMass Amherst. It has been accepted for inclusion in Doctoral Dissertations 1896 - February 2014 by an authorized administrator of ScholarWorks@UMass Amherst. For more information, please contact [email protected].


The EFFECTIVENESS OF COMPUTER-ASSISTED INSTRUCTION
AND COMPUTER PROGRAMMING IN ELEMENTARY AND
SECONDARY MATHEMATICS: A META-ANALYSIS
A Dissertation Presented
by
WEN-CHENG LEE
Submitted to the Graduate School of the University of Massachusetts in partial fulfillment
of the requirements for the degree of
DOCTOR OF EDUCATION
February 1990
Education

Copyright by Wen-cheng Lee 1990
All Rights Reserved
11
THE EFFECTIVENESS OF COMPUTER-ASSISTED INSTRUCTION
AND COMPUTER PROGRAMMING IN ELEMENTARY AND
SECONDARY MATHEMATICS: A META-ANALYSIS
A Dissertation Presented
by
WEN-CHENG LEE
Approved as to style and content by:
Howard A. Peelle, Chairperson of Committee
School of Education
111

ACKNOWLEDGMENTS
The completion of this dissertation is attributed
not to an individual effort but to that of a group of
people. I would like to express my sincerest gratitude
to those whose generous assistance made this study
possible.
I am deeply indebted to my chairperson, Professor
Howard A. Peelle, for his constant support, encourage¬
ment, and guidance throughout my doctoral program.
I wish also to acknowledge my special thanks to my
committee members. Professor William J. Masalski and
Professor Hui-Kuang Hsieh for their valuable comments
and suggestions.
Many thanks also go to Professor Ronald K. Hambleton
for his valuable help in the dissertation proposal.
The staff of Interlibrary Loan and Statictical Con¬
sulting Center at University of Massachusetts also de¬
serve my thanks for their help in collecting disserta¬
tions and in the processing and analysis of the data.
Most especially, I wish to acknowledge my hearty
gratitude to my family, who went through the pains of
dissertation process. Without the smiles and hugs of
my children, Cho-wei and Joanna, and without the great
patience, support and encouragement of my wife, Su-hui,
this dissertation would have not completed.
IV
ABSTRACT
THE EFFECTIVENESS OF COMPUTER-ASSISTED INSTRUCTION
AND COMPUTER PROGRAMMING IN ELEMENTARY AND
SECONDARY MATHEMATICS: A META-ANALYSIS
FEBRUARY, 1990
WEN-CHENG LEE, B.S., NATIONAL CHENGCHI UNIVERSITY
M.A., NATIONAL CHENGCHI UNIVERSITY
M.A., GEORGETOWN UNIVERSITY
Ed.D., UNIVERSITY OF MASSACHUSETTS
Directed by: Professor Howard A. Peelle
This study attempted to shed some light on effec¬
tiveness of computer-based mathematics instruction by
using meta-analysis to integrate findings from varied
studies. Seventy-two studies were collected from pub¬
lished studies, ERIC documents, and dissertations. Ef¬
fectiveness was measured in terms of math achievement,
problem-solving skills, and attitudes toward mathe¬
matics/instruction and computers.
Overall results indicated that CAI/computer pro¬
gramming had a moderate positive effect on achievement,
a slight positive effect on problem-solving skills and
attitudes toward mathematics/instruction, and a great
positive effect on attitudes toward computers for ele¬
mentary and secondary students. Specific effects found
were: 1) junior high students had higher average effect
v
size in achievement than elementary and senior high stu¬
dents; 2) simulation/gaming CAI had higher effect size
in achievement for higher grade students; 3) CAI was
most effective for low-ability students’ mathematics
achievement; 4) students from average and high-income
families had higher average effect sizes than students
from low-income families; 5) male students learned more
with computers than female students in terms of achieve¬
ment; 6) CAI programs developed by experimenters or
teachers had higher average effect Sxze than programs
which were commercially developed; 7) computers located
in laboratories or in classrooms were equally effective
in enhancing student achievement; 8) CAI was effective
in improving achievement for both normal students and
special students, such as remedial and learning-disad¬
vantaged students; 9) CAI in algebra/arithmetic studying
had higher average effect sizes than in geometry; 10)
published studies yielded the largest effect size in
achievement, and dissertations had the largest effect
size in problem-solving skills; 11) Logo programming was
more effective in enhancing problem-solving skills than
BASIC; and 12) attitudes of male and low-ability stu¬
dents were most positive toward mathematics/instruction.
In light of above positive findings of this meta¬
analysis, educators/teachers may be able to make sound
decisions about implementation of CAI/computer program¬
ming in mathematics instruction.
vi
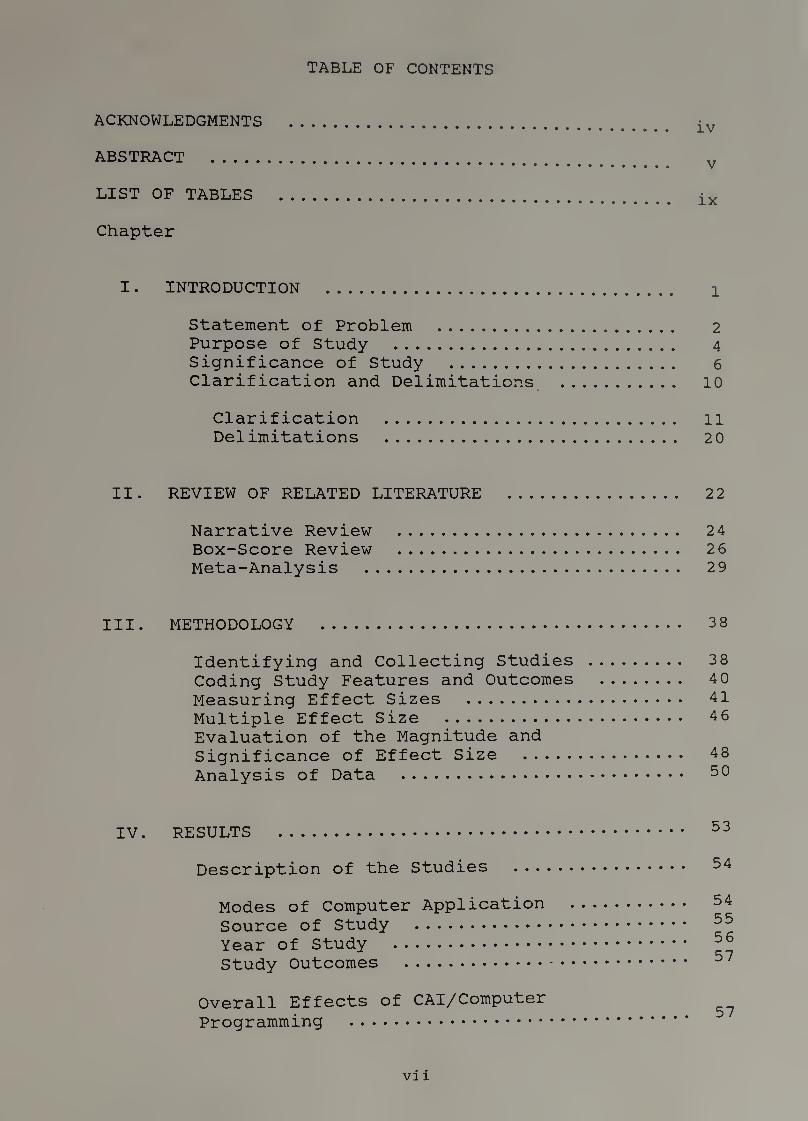
TABLE OF CONTENTS
ACKNOWLEDGMENTS
ABSTRACT .
LIST OF TABLES
Chapter
I. INTRODUCTION
Statement of Problem . 2 Purpose of Study . 4
Significance of Study . 6 Clarification and Delimitations . 10
Clarification . 11 Delimitations . 20
II. REVIEW OF RELATED LITERATURE . 22
Narrative Review . 24 Box-Score Review . 26 Meta-Analysis . 29
III. METHODOLOGY . 38
Identifying and Collecting Studies . 38 Coding Study Features and Outcomes . 40 Measuring Effect Sizes . 41 Multiple Effect Size . 46 Evaluation of the Magnitude and Significance of Effect Size . 48 Analysis of Data . 50
IV. RESULTS .-
Description of the Studies ...
Modes of Computer Application Source of Study . Year of Study . Study Outcomes .
Overall Effects of CAI/Computer
Programming .
vd i
57

Study Features and Study Outcomes . 63
Specific Effects by Subject Characteristics . 65 Specific Effects by Treatment Factors .... 83 Specific Effects by Design Variables . 103 Specific Effects by Study Variables . 116
Attitudes toward Mathematics/Instruction ... 122
V. CONCLUSIONS . 13 2
Summary of Results and Discussion . 132
Overall Effects of CAI/Computer Programming . 13 3 Study Features and Study Outcomes . 138
Implications and Recommendations . 151 Suggestions for Future Research . 155
APPENDICES
A. STUDIES USED IN THE META-ANALYSIS . 158
B. THE LIST OF VARIABLES . 166
C. CODING FORM USED IN THE META-ANALYSIS . 172
D. MEANS AND STANDARD ERRORS OF ACHIEVEMENT EFFECT SIZE FOR DIFFERENT FEATURES OF STUDIES . 175
E. MEANS AND STANDARD ERRORS OF PROBLEM¬ SOLVING EFFECT SIZE FOR DIFFERENT FEATURES OF STUDIES . 177
REFEENCES . 179
vlii

LIST OF TABLES
1. Studies Classified by Source . 55
2. Studies Classified by Year of Publication. 56
3. Studies Classified by Study Outcomes . 57
4. Overall Average Effect Size in Math Achievement, Problem-Solving Skills, and Attitudes toward Math/Instruction and Computers . 59
5. Overall Average Effect Size in Math Achievement by Mode of Computer Applications . 61
6. Overall Average Effect Size in Problem-Solving Skills . 63
7. Average Effect Size in Math Achievement by Grade Level and Mode of Computer Application . 67
8. Correlation between Effect Size in Achievement and Grade Level by Mode of Computer Application . 71
9. Average Effect Size in Problem-Solving Skills by Grade Level and Mode of Computer Application . 73
10. Average Effect Size in Math Achievement by Ability Level and Mode of Computer Application . 75
11. Average Effect Size in Problem-Solving Skills by Ability Level and Mode of Computer Application . 77
12. Average Effect Size in Math Achievement by SES and Mode of Computer Application . 79
13. Average Effect Size in Math Achievement by Sex and Mode of Computer Application . 81
14. Average Effect Size in Problem-Solving Skills by Sex for Computer Programming . 82
15. Average Effect Size in Math Achievement by Role and Mode of Computer Application . 84
16. Average Effect Size in Problem-Solving Skills by Role and Mode of Computer Application . 85
IX

17. Average Effect Size in Math Achievement by Location of Computers . 86
18. Average Effect Size in Problem-Solving Skills by Location of Computers . 87
19. Average Effect Size in Math Achievement by Length of Treatment (in Weeks) and Mode of Computer application .. 88
20. Average Effect Size in Math Achievement by Length of Treatment (in Minutes) . 89
21. Average Effect Size in Problem-Solving skills by Length of Treatment . 90
22. Average Effect Size in Math Achievement by Type of Computer Interaction and Mode of Computer Application . 92
23. Average Effect Size in Problem-Solving Skills by Type of Computer Interaction . 92
24. Average Effect Size in Math Achievement by Authorship and Mode of Computer Application .... 94
25. Average Effect Size in Math Achievement by Intended Audience and Mode'of Computer Application ... 95
26. Average Effect Size in Math Achievement by Computer Programming Language . 96
27. Average Effect Size in Problem-Solving Skills by Computer Programming Language . 97
28. Average Effect Size in Math Achievement by Size of Subjects . 98
29. Average Effect Size in Math Achievement by Math Content and Mode of Computer Application . 100
30. Average Effect Size in Math Achievement by Math Subject and Mode of Computer Application . 102
31. Average Effect Size in Math Achievement by Type of Test and Mode of Computer Application . 104
32. Average Effect Size in Problem-Solving Skills
by Type of Test and Mode of 1Q5
Computer Application .
• r
x

33.
34 .
35.
36.
37.
38.
39.
40.
41.
42.
43 .
44 .
45.
46.
47.
Average Effect Size in Math Achievement by Assignment of Subjects and Mode of Computer Application .
Average Effect Size in Problem-Solving Skills by Assignment of Subjects and Mode of Computer Application .
Average Effect Size in Math Achievement by Historical Effect .
Average Effect Size in Problem-Solving Skills by Historical Effect .
Average Effect Size in Math Achievement by Instructor Effect and Mode of Computer Application . 112
Average Effect Size in Problem-Solving Skills by instructor Effect and Mode of Computer Application . 113
Average Effect Size in Math Achievement by Time-on-Task and Mode of Computer Application . 114
Average Effect Size in Problem-Solving Skills by Time-on-Task . 115
Average Effect Size in Math Achievement by Source of Study and Mode of Computer Application ... 117
Average Effect Size in Problem-Solving Skills by Source of Study and Mode of Computer Application .. 119
Average Effect Size in Math Achievement by Year of Publication and Mode of’ Computer Application . 120
Average Effect Size in Problem-Solving Skills by Year of Publication . 121
Overall Average Effect Size in Attitude vs Math/Instruction .
Average Effect Size in Attitude vs Math/Instruction by Grade Level .
Average Effect Size in Attitude vs Math/Instruction by Ability Level • • •* • • •
123
124
125
XI

48. Average Effect Size in Attitude vs Math/Instruction by Sex . 12 6
49. Average Effect Size in Attitude vs Math/Instruction by Length of Treatment . 127
50. Average Effect Size in Attitude vs Math/Instruction by Instructor Effect . 128
51. Average Effect Size in Attitude vs Math/Instruction by Year of Publication . 13 0
52. Average Effect Size in Attitude vs Math/Instruction by Type of Computer Interaction . 131
Xll

CHAPTER I
INTRODUCTION
As the 21st century approaches, many aspects of our
society, especially education, are being transformed by
the development of computer technology. Although use of
computers in the classroom is still in its infancy and
its exact role in future education is still difficult to
predict due to the rapid evolution in computer technolo¬
gy, the introduction of computers into schools (es¬
pecially with the increase of easy accessibility of in¬
expensive microcomputers) has already had a substantial
impact on school education.
Mathematics education has been one of the most ex¬
tensively explored areas of Computer-Assisted Instruc¬
tion (CAI). It is widely believed that the application
of CAI will inevitably bring about major changes in
mathematics education (Ponte, et al., 1986). The major
modes of CAI used in elementary and secondary school
mathematics education are drill-and-practice, tutorial, » '
simulation, game, and problem-solving. Going beyond
CAI, a widespread approach to using the computer in
mathematics instruction is computer programming. A
variety of important claims have been made about the
effects of computer -programming on mathematics edu¬
cation. For example, Papert (1980) argues that teaching
1
children computer programming, Logo in particular, is
an ideal way to allow children to create their own
learning environment whereby they not only grasp cer¬
tain mathematical ideas and concepts, but also develop
their logical thinking and problem-solving skills. The
National Council of Teachers of Mathematics of the
United States suggested:
Mathematics programs must take full advantage of the power of ...computers at all grade levels... computers should be used in imaginative ways for exploring, discovering, and developing mathematical concepts and not merely for checking computational values or for drill and practice... Schools should insist that materials truly take full advantage of the immense and vastly diverse potential of the new media. (Shuard,1984, p. 27)
Today, mathematics teachers in schools appear to be
more willing and have more experience than ever to use
the computer as a tool to support their classroom in¬
struction. There is no longer a question of whether
teachers should be involved with the computer in their
instruction, but rather how to make best use of this new
instructional medium in classrooms. Educators and edu¬
cational researchers are now examining the potential
benefit of two major computer applications: CAI and com¬
puter programming.
Statement of Problem
It has been more than two decades since the com¬
puter was first introduced into mathematics education,
2

and the application of microcomputers in classrooms is
now ending its first decade (Bozeman & House, 1988).
However, the acceptance of the computer as an effective
instructional aid is, to a certain extent, still an
issue of controversy, primarily due to the lack of
strong and convincing arguments to make sound education¬
al decisions. Time and rapidly increasing use of micro¬
computers in elementary and secondary mathematics educa¬
tion as well as educators' growing experience with this
new instructional medium, have not resulted in reconcil¬
iation of divergent opinions among educators regarding
effectiveness of CAI and computer programming. To be
specific, effects of computer applications on student
achievement, attitudes toward mathematics/instruction,
and especially problem-solving skills remain largely
unknown. There is no general agreement on how to use
the computer effectively in classrooms.
Divergent opinions about effects of computer appli¬
cations on students' learning can have a considerable
influence on future educational planning. Without com- i
plete knowledge of the past achievement of CAI and com¬
puter programming, educators and researchers cannot
be confident in using and designing new instructional
programs and, as a result, would fail to take the po¬
tential advantages of this new instructional medium.
For the most part, the uncertainty about computer-
assisted mathematics education stems from the abundance
3

of inconclusive and conflicting research findings on the
effectiveness of CAI and computer programming. While a
variety of studies has been conducted in an attempt to
determine the effectiveness of CAI and computer program¬
ming as compared with traditional instruction in mathe¬
matics, results from studies were often inconsistent and
even contradictory. The proliferation of experimental
studies in this field without systematic integration of
various findings seems wasteful. Hence, it seems more
important to synthesize and extract the main findings
from previous studies and then to possibly derive new
knowledge that lies untapped in completed research
rather than conduct additional experimental studies.
Purpose of Study
Admittedly, today's educators are facing a major
challenge: how the computer can be most effectively
integrated into instructional processes. Roblyer
catches the essence of the question regarding the ef¬
fectiveness of computers in education by asking "How
much do computers actually improve instructional methods
and, consequently, students' achievement?" (Bozeman &
House, 1988, p. 82) In an attempt to examine the ef¬
fectiveness of CAI and computer programming, a "meta-
analytic" approach developed by Glass (1976) is employed
in this study. This is a kind of statistical analysis
4
for integrating findings from as many experimental
studies of computer-based mathematics education as could
be located.
Using meta—analysis as a tool, the purpose of this
study is to provide educators and/or teachers with an
objective aggregation of findings derived from what edu¬
cational researchers have accomplished to date re¬
garding effectiveness of CAI and computer programming in
elementary and secondary mathematics instruction. Above
all, it is essential to give educators and researchers
feedback through results of this study so they can
implement or modify CAI/computer programming to meet the
needs of mathematics education in the future. Thus this
study attempts to determine the relationship between use
of computers in mathematics education and instructional
outcomes by shedding some light on the following
questions:
First, how effective are CAI and computer program¬
ming in the study of mathematics at elementary and sec¬
ondary levels? In other words, is there any change in
students' mathematics achievement, problem-solving
skills, and in their attitudes toward mathematics/in¬
struction and computers attributable to the application
of CAI/computer programming in mathematics education?
This question is related to overall effects of CAI/com¬
puter programming on mathematics education.
5

Second, is the application of CAI and/or computer
programming in mathematics instruction more effective in
achievement and problem-solving skills for certain types
of students? This question refers to the relationship
of subject characteristics and instructional outcomes.
Third, under what kinds of treatment settings do
CAI and/or computer programming appear to be most ef¬
fective? The answer to this question aims to examine
effects of treatment factors on study outcomes.
Fourth, what is the effectiveness of CAI and/or i
computer programming in achievement and/or problem¬
solving skills as a function of design and study charac¬
teristics of experimental studies?
Lastly, under what kinds of settings is use of CAI/
computer programming more effective in improving student
attitudes toward mathematics/instruction?
Significance of Study
Literature on research relevant to effects of com¬
puter-assisted mathematics education indicates that in¬
tegration of previous studies has been reglected by edu¬
cational researchers. Existing reviews of effects of
computers on mathematics education focus mostly on how
often computer instruction is more effective than tra¬
ditional instruction, rather than the more important
question of why this new instructional medium might be
6

more effective. To date, educational researchers usu¬
ally are interested in how to draw generalizations about
effectiveness of CAI/computer programming in mathematics
instruction from a single setting rather than gener¬
alizations about the effectiveness in a variety of
settings. They usually do not consider impact of vari¬
ables that could affect results of a study in a system¬
atic way.
In addition, methods of integrating findings from
empirical studies have not kept pace with the rapid in¬
crease of literature on effectiveness of CAI and/or com¬
puter programming. Rather crude techniques of tra¬
ditional approaches are still widely used by most re- i
search reviewers to integrate research findings. Gener¬
ally speaking, these traditional approaches of research
integration, such as narrative and box-score reviews,
have been largely not systematic and fail to meet rigor¬
ous scientific standards. The standards of "objectivi¬
ty," "verifiability," "replicability," and "clarity"
used to assess primary empirical studies are usually
overlooked in their aggregation of findings of previous
studies (Kavale & Glass, 1981). This will be further
discussed in the following chapter, Review of Related
Literature.
Accordingly, a new systematic approach is required
to synthesize findings of previous studies and to ex¬
tract knowledge of effectiveness of CAI/computer pro-
7

gramming in mathematics instruction from a variety of
inconclusive study results. In this sense, the approach
of meta-analysis used in this study becomes highly rele¬
vant and important by trying to synthesize findings from
various studies to get a coherent picture. It is an ap¬
propriate quantitative method to overcome the weakness
of traditional methods and to handle the difficulties
stemming from the rapidly increasing and inconclusive
research findings. Glass made it clear:
It (meta—analysis) connotes a rigorous alternative to the casual, narrative discussions of research studies which typify our attempts to make sense of
the rapidly expanding research literature.(1976, p.3)
Instead of the intuitive, subjective, and narrative
manner of traditional approaches to reviewing research,
meta-analysis presents a systematic, objective alterna¬
tive. Whenever a controversy over educational matters
arises, educators usually seek to conduct research in an
attempt to support a particular position. Moreover,
they may be inclined to cite only research findings that
are in favor of their biases. "The old research and the
new, however, often remain isolated and variegated in a
data base filled with conflicting findings." (Brown J.
and Brown, L. , 1987, p.339) Through systematically
aggregating divergent results of primary studies, meta¬
analysis helps educators to deduce objectivity from con¬
flicting research findings.
8

As mentioned earlier, a systematic comparison of
effects of computer-based mathematics instruction and
traditional instruction is clearly needed to help guide
educational policy on use of CAI/computer programming in
mathematics classrooms, especially given the rapid in¬
crease of research studies with inconclusive and con¬
flicting results about the effectiveness of computers
in mathematics education. Although the application of
computers in classrooms has not yet brought about a
revolutionary effect on school mathematics, prospects
for uses of computers in mathematics education is
bright. More and more mathematics educators are already
convinced of the impact of computers (Hatfield, 1982).
There has been, however, a lack of precise and concrete
evidence to indicate the benefits of learning that come
along with use of computers in mathematics instruction.
If the computer is to make permanent changes in school
mathematics, educators need to examine a more important
question of how computers should be effectively used in
mathematics classes, rather than just how often they are
effectively used in classroom instruction (Bell, 1978).
Today, limitations of educators' knowledge of ef¬
fects of computer—assisted mathematics stem not from
shortage of research studies but from lack of appropri
ate approaches to integrate study results about ef¬
fectiveness of implementation of computer-assisted
9

mathematics at elementary and secondary levels. With
the help of meta-analysis, educators could have more
full knowledge of whether findings of various research
studies on computer-assisted mathematics education allow
"accurate conclusions of wide application or complex and
contingent findings of limited applicability" (Kavale &
Glass, 1981, p. 531). If integration of findings brings
about precise and general conclusions, then educators
may make and accomplish their decisions with confidence.
On the other hand, if uncertain and complex conclusions
are drawn from the findings, then educators must be . ’ I
cautious in their decision-making and implementation of
computer-assisted mathematics education (Kavale & Glass, j ’
1981).
In short, the meta-analysis of this study can make
a contribution to the synthesis of research findings and
to the solution of critical issues in application of CAI
and/or computer programming to mathematics classrooms.
Clarification and Delimitations
This section aims to articulate a clear workable
definition 'of terms that will be used throughout the
study and meet the purpose of this study. Further, for
the purpose of keeping this study manageable, a careful
delimination of the study is also offered.
10

Clarification
For the purpose of this study, certain specific
terms are defined as follows:
Meta-analvsis
Meta-analysis, first introduced by Glass in 1976,
was designed initially for handling the difficulties
caused by abundance and diversity of study results in
the social sciences. In an attempt to explain the con¬
cept of meta-analysis, Glass made a distinction among
primary, secondary, and meta-analysis. In his view,
primary analysis is "the original analysis of data in a
research study" (Glass, 1976, p. 3). Secondary analysis
was viewed as "the re-analysis of data for the purpose
of answering the original research question with better
statistical techniques..." (Glass, 1976, p.3) As to the
meta-analysis, Glass simply meant "the analysis of
analyses," or more specific, "the statistical analysis
of a large collection of analysis results from individu¬
al studies for the purpose of integrating the findings"
(Glass, 1976, p.3).
As literature in computer education increases at a
rapid rate, methods of integrating previous study
findings are required. Meta-analysis used in this study
is designed to meet this need.
11

Effect Size
The framework of meta-analysis approach is based on
the concept of "effect size", which is defined by Glass
(1976) as the difference between the mean of the experi¬
mental group and that of the control group, divided by
the standard deviation of the control group. Measure¬
ment of effect size will be described in the chapter
Methodology.
Computer-Assisted Instruction
Computer-Assisted Instruction (CAI), like Computer
Assisted Learning (CAL), and Computer Based Learning
(CBL), is just one of many terms used to mean use(s) of
computers in the process of teaching and learning.
These terms are justified by the argument that use of
computers will facilitate the learning process—"either
by providing the learner with a framework to extend
his/her understanding and investigation of any topic, or
by offering the teacher a tool or resource to exercise
his skills" (Kontos, 1984/85, p. 3).
A literature review on CAI indicates that in the
recent past the term CAI has been used inconsistently
and always with emphasis on the computer’s instructional
function rather than its interacting function (Manion,
1985). For example, in Splittgerber's (1979) view,
12
CAI is basically an instructional medium to deliver
knowledge to students.
This perspective of CAI as an "instructional de¬
livery system" has changed. For example, in contrast to
traditional view of CAI, Morris placed an emphasis on
the computer as an active participant in the learning
process which is under the self-control of the learner
(Morris, 1983). The interaction between learner and
computer in the learning process is being stressed.
While CAI seems to have various different defi¬
nitions, the term can be used to indicate any appli¬
cation of the computer that serves the goals and
functions of instruction. This study, therefore, de¬
fines CAI in mathematics to include any instructional
application that gives either the student or the teacher
a chance to interact with the computer and serves the
goals and functions of mathematics instruction.
There are five generally accepted modes of CAI used
in school mathematics education: drill/practice, tu¬
torial, simulation, gaming, and problem solving. Each
mode has a different purpose and use. They are hier¬
archical in levels of cognitive development, course
objectives, and degree of student interaction. On the
level of cognitive development, the modes of CAI range
from "simple to complex, from concrete to abstract."
From the viewpoint of course objectives, they range
13

"from skill mastery and knowledge acquisition in the
practice and tutorial modes to synthesis and
evaluation in the problem-solving mode." On the level
of degrees of student interaction, the modes of CAI
range from "the more simple type of response required in
drill and practice mode to almost total action on the
part of the student in the higher-level problem-solving
mode" (Manion, 1985, pp„ 26-27).
It is worthwhile to note that an exact classifi¬
cation seems difficult here. One can classify uses of
the computer in education in many ways. The following
CAI modes of delivery and interaction described briefly
only provide a convenient framework for discussion.
Drill and Practice. The earliest mode of CAI is .
drill and practice which was developed from Thorndide's
theory of stimulus-response and Skinner’s development of
teaching machines and programmed learning. According to
Skinner, a programmed learning was designed for the
purpose of constructing a series of questions that stu¬
dents could answer correctly (Bok, 1985). Drill-and-
practice programs are similarly designed to use the com¬
puter to cause students to review and reinforce concepts
and new ideas previously taught by teachers. CAI is
recognized as an ideal medium for presenting drill
and practice to improve certain mathematics learning
(Overton, 1981) , such as number sequences, whole
14

numbers, and factoring, due to its potential of indi¬
vidualized instruction.
Tutorial Programs. Whereas most computer-based
drill and practice programs do not attempt to assume the
role of teaching, in the tutorial mode, CAI takes over
the primary responsibility for teaching and provides
individualized instruction. Tutorial CAI, developed
from information—processing theories and Gagne's con¬
ditions of learning (intellectual skills), is designed
to ihduce students to find correct answers by supplying
text and helpful hints. In this mode, the computer
first presents information on some subject(s) to the
student. After the student giving a response, the
program then judges the student's response to assess
his/her comprehension and gives appropriate feedback to
the student to improve his/her comprehension and per¬
formance. The computer makes a decision based on re¬
sults of an evaluation to determine what information
should be presented next. The main limitations of this
mode are that students are restricted to answer the
specific questions posed by the computer and to choose
among a limited number of responses and that, above all,
there is no way for students to explore mathematical
concepts and skills. Due to these limitations, tutorial
CAI is chiefly used to help students learn new mathe¬
matical concepts or skills, such as arithmetic function,
15
solving equations, ratio and proportion, or area and
perimeter.
Simulation. According to Engel and Payne, a simu¬
lation is defined as "a mode in operation as that its
parts interact with one another as they do in real life.
An educational simulation permits a person to become a
working member of the system, making choices or varying
parameters and analyzing the information" (Engel and
Payne, 1981, pp. 115-116). Different from interactive
tutorials, in a computer simulation lesson, the student
learns by performing activities to be learned in a con¬
trolled environment that is similar to the real world.
Computer simulations are valuable in elementary and
secondary mathematics education because they offer a
closer link between mathematics and the real world. For i , ,
instance, a computer simulation of Time-Rate-Distance
Problem might be an exciting way to introduce algebraic
concepts to secondary students (Engel and Payne, 1981).
By providing the students with highly interesting and
motivating activities, computer simulations can revive
the students' learning of mathematics. It is a creative
and powerful mode for teaching and learning some mathe¬
matics concepts and skills.
Gaming. According to Gibbs, "A game is an activity
which is carried out by cooperating or competing de-
16

cision makers seeking to achieve their objectives within
a framework or rules" (Engel and Payne, 1981, p. 117).
The purpose of such games is to provide an environment
that facilitates learning of skills or ideas. Basically,
there are three types of computer games used in edu¬
cation: First, puzzle games in which one student con¬
trols the input variable(s) in an attempt to reach some
specific objective; Second, computer refereed games in
which two or more students compete with each other while
the computer keeps score and monitors the rules of game;
Third, computer participant games in which the student
competes with the computer which is programmed to re¬
spond to the student's input (Engel and Payne, 1981).
Computer games are quite similar to simulations and
therefore are often discussed together. A computer
simulation can become a computer game by adding specific
objectives and some competitive elements. The use of
computer games in mathematics is one of the most at¬
tractive ways of instruction for students. By providing
a dynamic, graphic, and interactive learning environ¬
ment, a computer game offers the student an opportunity
to learn mathematical concepts and skills in an at¬
tractive way. For example, a computer game called DARTS
(Goldenberg, et al. 1984) provides a visual, dynamic
model to make numbers more comprehensive to students.
17

CAI Problem Solving. Problem-solving is probably
the most essential of all basic skills needed in this
changing society. Teaching students mathematical pro¬
blem-solving skills then becomes one of the most funda¬
mental goals of mathematics education (Dudley-Marling &
Owston, 1988).
In the area of problem-solving, computers can be
used in two ways. The first one, which is a high-level
CAI mode, is using prepared programs (including tools
such as database management, spreadsheet, etc.) de¬
veloped by commercial companies or educators to provide
students with the opportunity to empirically develop
possible solutions to a problem. The second is computer
programming whereby the student implements an algorithm
to solve a specific problem. Writing a computer program
to solve a problem is itself problem solving; besides,
it also may foster children logical and heuristic
reasoning thinking. Therefore, this will be included in
a separate category ("computer programming") as dis¬
tinguished from CAI problem-solving.
Computer Programming
Computer programming, to simplify it, is the ■ i
activity of writing a list of instructions in a way
that allows the computer to perform a specific task or
a series of tasks. Currently, many claims have been
18

made about the positive benefits of computer program¬
ming in mathematics education. Feurzieg et al., for
example, argued for programming languages as a conceptu-
framework for teaching mathematics. They believed
that teaching computer programming in mathematics
classes would provide students with an ideal environment
to explore mathematical concepts and a context to learn
the general skills necessary for problem-solving (Howe,
et al., 1982). Papert (1980) also strongly recommends
teaching children how to learn programming, especially
Logo. He believes that in learning to program Logo,
children are allowed to create their own learning envi¬
ronment whereby they are not only developing logical
thinking but also problem-solving skills.
The process of computer programming involves all
the processes required for effective problem solving.
Polya developed explicit heuristic strategies for
problem-solving. In his view, there are four basic
steps in the classic model of problem-solving: having a
clear understanding of the problem, devising a plan of
solution, executing the solution plan, and evaluating
the solution (Krasnor & Mitterer, 1984). Similarly, in
computer programming, the programmer must first under¬
stand the meaning of the programming task and be able to
explain the problem. He then must devise a program to
solve the problem, carry out the program in the computer,
19

and debug it. By using a programming language, such as
Logo, Basic, Pascal, or APL, the student may become a
"generative problem developer and a problem solver"
(Manion, 1985, p. 27).
Delimitations
Although meta-analysis is not a panacea for the
problems of computer-assisted mathematics education,
it can prove to be quite valuable when applied and in¬
terpreted with care. Educational research by its very
nature is inaccurate and uneven in quality. In order
to avoid generalizing its findings from imprecise data
of primary studies and keep this study manageable, a
careful delimitation of the investigation for this meta¬
analysis is necessary. The delimitations of this study
are as follows:
1. In this study, only CAI and computer program¬
ming are dealt with in depth. No attempt will be made
to study the effects of computer-managed instruction
(CMI) on students' learning of mathematics. In CMI,
the computer is not used as an instructional medium but
as an electronic file manager in which student testing,
grade-keeping, curriculum analyzing, filing, and other
classroom management matters are handled.
2. Only elementary and secondary students are in¬
cluded in the student sample. No attempt will be made
to generalize study results beyond this grade range.
20

3. The previous studies used in this study only
include experimental studies — not qualitative studies.
Specifically, those studies which provide anecdotal
evidence and focus on case studies and observations,
rather than experimental findings are excluded from this
study.
4. The experimental studies which are used in this
meta-analysis had to be conducted in actual classrooms
in stead of laboratory experiments.
5. Only those previous studies in which the ef¬
fectiveness of computer-assisted mathematics education
was compared with that of traditional classroom in¬
struction in terms of achievement, problem-solving
skills, and attitude toward mathematics/instruction and • »
computers are included in this study.
6. In order to understand the general trend of
computer-assisted mathematics education, this study
considers as much available studies (back to 1970) as
possible regardless of their age. As Becker points out,
most early studies, involving older techniques and
approaches, may be less relevant today (Bracey, 1988).
21

CHAPTER II
REVIEW OF RELATED LITERATURE
For purpose of this study and also for convenience
of discussion, the literature to be reviewed here will
focus on research reviews relevant to this study. The
large numbers of primary studies that will be analyzed
in meta-analysis, will not be reviewed in this chapter,
since meta-analysis is based on the proposition that it
seems impossible to summarize vast numbers of studies
sufficiently in narrative terms.
A variety of research has been conducted since the
mid-1960's to examine the effectiveness of CAI in mathe¬
matics education in terms of student achievement, time
savings, student attitudes, and learning retention.
To date the literature is replete with studies of inter¬
est. While such research studies generally concluded
that classroom instruction supported with CAI is at
least as effective as, and often more effective than the
traditional method only (Burns and Bozeman, 1981), find
ings from the studies are often inconclusive and even
contradictory.
As for effects of computer programming, to date
literature related to computer programming, especially
Logo programming, pertains mostly to testimonials, cur¬
riculum guides (Krasnor and Mitterer, 1984), or anec-
22

dotal evidence of studies (e.g., Papert, et al., 1979).
Only a few studies have provided empirical evidence
concerning the effects of computer programming on mathe¬
matics achievement and problem-solving skills (e.g.,
Howe, et al., 1979; Clements, 1985; Kurland and Pea,
1985; Reiber, 1987), and the results were inconsistent
and conflicting. For example, in contrast to Papert,
Pea (1983) and his colleague expressed their serious
doubts about current optimism concerning cognitive bene¬
fits of Logo programming. No precise and concrete evi¬
dence can be offered by any individual study to support
the argument that computer programming is generally ef¬
fective with children's learning.
In view of lack of objective and systematic review
of effects of computer applications, some educational
researchers (e.g., Visonhaler and Bass, 1972; Jamison et
al., 1974; Edwards, et al., 1975; Hartley, 1977; Burns
and Bozeman, 1981) began in early 1970s to attempt to
extract the major findings of a variety of studies on
effectiveness of computer applications by using methods
of research integration. Generally, three basic types
of research integration have been utilized to integrate • i ,
findings on CAI and/or computer programming effective¬
ness in mathematics instruction; narrative reviews, box-
score reviews, and meta-analysis.
23

Narrative Review
Narrative review is one of the early techniques
used for traditional integration. By using this ap¬
proach, reviewers usually describe, analyze and evaluate
selected individual studies in an attempt to draw a
general conclusion about the area of interest (Kavale &
Glass, 1981).
Several researchers have tried to use this method
to review individual primary studies on CAI effective¬
ness in an attempt to identify common findings among
the individual studies. However, their efforts turned
out to be in vain. Their findings were still inconclus¬
ive and conflicting. For example, in his review of
studies of effectiveness of tutorial CAI, Kieren indi¬
cated that due to varied results, it was difficult to
confirm that use of tutorial CAI was an overwhelming
success, but it did provide some benefits including an
apparent increase in student interest (Overton, 1981).
The review by Chambers and Sprecher (1980) is
typical of those using a narrative approach. They re¬
viewed eight studies from a variety of sources to favor
their gereral conclusion that CAI usually has a positive
effect on student achievement and attitudes. Their
findings also suggested that CAI results in a saving of
learning time.
24

Effectiveness of computer programming has also been
the subject of intensive interest of some educational
researchers. However, literature related to research
review of effects of computer programming on achievement
and/or problem-solving skills is quite scanty. In his
review of previous studies on effects of computer pro¬
gramming on students' problem-solving skills, Blume
(1984) concluded that findings from studies supported
the claim that computer programming, to a certain ex¬
tent, had a positive effect on some aspects of mathe¬
matics achievement and the development of problem¬
solving skills. He also found that computer programming
was more effective with junior high than senior high
students.
Narrative review is, basically, an approach of
drawing a conclusion through reasoning, which is com¬
plicated when findings of individual studies are incon¬
sistent or even contradictory. Due to cumbersome and
lengthy resulting narratives, the narrative review
approach usually can not give a general picture of
aggregated knowledge extracted from a vast number of
studies.
In this context, reviewers tend to limit the lit¬
erature to a manageable size by excluding a great
number of studies by means of "arbitrary stipulative de
finitions of concepts and a prior judgments of quality"
25
in order to find the consistency in results of studies
as they expect. As a result, most of the literature is
removed, and the remaining studies display a consistency
but probably not for the right reasons because ways of
excluding contradictory study results usually are ar¬
ranged for the particular purpose and hence are not
objective (Kavale and Glass, 1981).
Box-Score Review
In comparison with narrative review, the box-score
review is a more systematic method of research integra¬
tion. In this approach, the studies are scored concern¬
ing positive significance, negative significance, or
neither positive nor negative significance in the test
of a statistical hypothesis. !The result of review
usually indicates the proportion of studies being in
favor and not in favor of an experimental treatment. In
addition, narrative comments about the studies are on,en
given in this kind of review. Light and Smith (1971)
viewed this approach as the "voting method" of research
aggregation.
In one of the first box-score reviews on CAI,
Vinsonhaler and Bass (1972) summarized findings of ten
individual studies involving use of CAI drill ana prac
tice at elementary level and concluded that children
who received supplementary CAI drill and practice gen-
26

were superior in developing mathematics skills
to children who received traditional classroom instruc¬
tion only.
Jamison, Suppes, and Wells (1974) reached some
tentative conclusions about the effectiveness of CAI,
after their review of over 20 studies on CAI. They
argued that in the cases of CAI being used as a supple¬
ment to traditional instruction at the elementary level,
students' achievement scores were improved, especially
for disadvantaged students. At secondary and college
levels, they concluded that CAI was at least as effec- • )
tive as traditional instruction, and in some cases, CAI
resulted in substantial savings of learning time.
Edwards et al.'s (1975) comprehensive review pro¬
vides a box-score count of studies of CAI effectiveness.
They located studies relevant to various types of CAI,
including drill and practice, tutorials, simulations,
nnd problem solving, used in elementary schools, hiqh
schools, and colleges. Their review of studies on CAI
effectiveness in student achievement, learning time, and
learning retention resulted in conclusions summarized as
follows:
1. All studies reviewed indicated that traditional instruction supplemented by CAI generally was more effective than traditional instruction only.
2. In case of CAI being used as a substitute for traditional classroom instruction, 9 of 20 in¬ dependent studies were in favor of CAI, 8 of 20 studies were not in favor of CAI, and three o
studies showed mixed results.
27
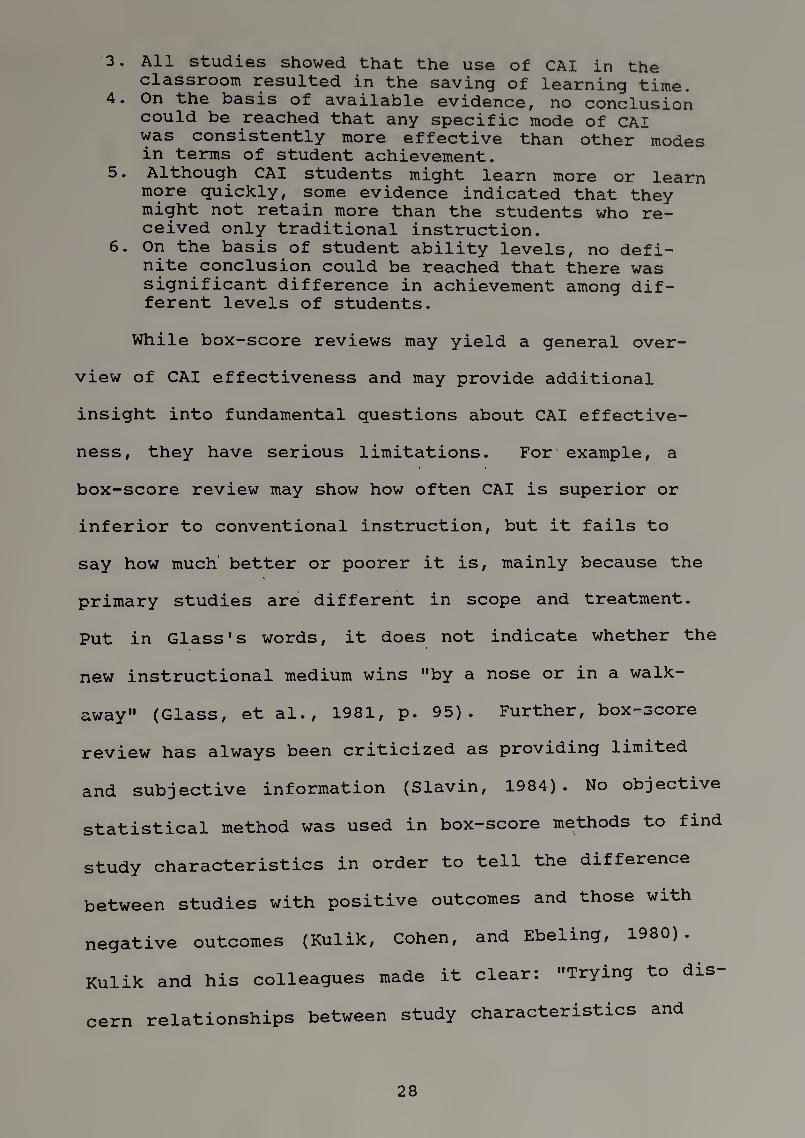
3. All studies showed that the use of CAI in the classroom resulted in the saving of learning time.
4. On the basis of available evidence, no conclusion could be reached that any specific mode of CAI was consistently more effective than other modes in terms of student achievement.
5. Although CAI students might learn more or learn more quickly, some evidence indicated that they might not retain more than the students who re¬ ceived only traditional instruction.
6. On the basis of student ability levels, no defi¬ nite conclusion could be reached that there was significant difference in achievement among dif¬ ferent levels of students.
While box-score reviews may yield a general over¬
view of CAI effectiveness and may provide additional
insight into fundamental questions about CAI effective¬
ness, they have serious limitations. For example, a
box-score review may show how often CAI is superior or
inferior to conventional instruction, but it fails to
say how much better or poorer it is, mainly because the
primary studies are different in scope and treatment.
Put in Glass's words, it does not indicate whether the
new instructional medium wins "by a nose or in a walk¬
away" (Glass, et al., 1981, p. 95). Further, box-score
review has always been criticized as providing limited
and subjective information (Slavin, 1984). No objective
statistical method was used in box-score methods to find
study characteristics in order to tell the difference
between studies with positive outcomes and those with
negative outcomes (Kulik, Cohen, and Ebeling, 1980).
Kulik and his colleagues made it clear: "Trying to dis¬
cern relationships between study characteristics and
28

outcomes without statistics is like trying to grasp the
sense of hundreds of test scores without using statis¬
tical methods to organize, depict, and interpret the
data." (Kulik, Cohen, and Ebeling, 1980, p. 53)
Meta-Analvsis
After meta-analysis was introduced by Glass (1976)
as a more precise and systematic method to integrate
findings from a variety of studies, several researchers
(such as Hartley, 1977; Burn, 1981; Kulick, Bangert, and
Williams, 1983; Kulick, J., Kulick, C., and Bangert,
1985; Niemiec and Walberg, 1985; and Roblyer, Castine,
King, 1988) have applied this method to the field of in¬
structional computing in an attempt to capture the gen¬
eral trend of effectiveness of computer applications in
education.
Generally speaking, users of meta-analysis take a
more quantitative approach to integrate findings of
studies in three ways. First, objective procedures are
applied to select experimental studies to be used in
meta-analysis. Second, quantitative or quasi-quantitat-
ive techniques are used to describe study characteris¬
tics and outcomes. Third, statistical methods are used
to summarize overall findings and examine relation¬
ships between study characteristics and outcomes (Kulik,
et al., 1986).
29

Hartley (1977) was the first to apply meta—analysis
to integrate research results on effectiveness of indi-
vidualized methods in teaching elementary and secondary
school mathematics. Her meta—analysis compared four
instructional techniques used in mathematics education.
They were CAI, tutoring, individual learning packets
(ILP), and programmed instruction (PI). Hartley con¬
cluded, in her meta-analysis, that the average effect of
CAI for grades 1 to 8 was to raise student achievement
by 0.41 standard deviations; to express this in another
way, CAI mathematics instruction could be expected to
shift the position of the average treated students from
the 50th to the 65th percentile of the control group.
She also reported that CAI was less effective than
programs of peer and cross-age tutoring, but it was
still more effective than programmed instruction or
individual learning programs in terms of student mathe¬
matics achievement. In addition, Hartley pointed out
that although the correlations between study character¬
istics and findings were low, effects of a few study
features on study outcomes were significant. For ex¬
ample, an interesting result found in her study was the
difference in effectiveness by students' grade levels.
In the case of CAI mathematics instruction, elementary
school students were superior to secondary school stu¬
dents in mathematics performance.
30

Burns and Bozeman (1981), like Hartley, used meta¬
analysis to review 32 studies on drill/practice and
tutorial mathematics instruction in elementary and
secondary schools. Their study found that tutorial CAI
seemed to have higher overall average effect sizes
(0.45) than that of drill-and-practice CAI (0.34). in
<^r;*-H“an<^-Prac'tice CAI, high-achieving and low-achieving
students had almost same average effect size (0.32 and
0.31, respectively). Elementary students appeared to
have higher average effect size than that of secondary
students in achievement (0.35 and 0.24, respectively).
In addition, male students outperformed female students
(average ES = 0.42 and 0.17, separately). However, in
tutorial CAI, low-achieving students were superior to
high-achieving students in mathematics achievement.
Their average effect sizes were 0.57 and 0.28 respect¬
ively. Secondary students had slight higher average
effect size than that of elementary students (0.52 and
0.43. respectively).
Kulik and his colleagues applied meta-analysis ap¬
proach in separate studies to compare the effectiveness
of computer-based instruction (CBI) and traditional in¬
struction at elementary, secondary, and college levels.
They concluded that use of CBI was more effective than
use of traditional instruction only at all three levels.
Further, CBI was more effective at elementary levels
31

than at secondary and college levels when compared with
traditional instruction; and effects of CBI on low abil¬
ity students were more significant than on average and
above average students (MacArthur, et al., 1986).
In their meta—analysis of 59 independent studies
on CBI effectiveness at college level, Kulik, Kulik, and
Cohen (1980) concluded that CBI had small but signifi¬
cant contributions to students' achievement at the col¬
lege level. To be specific, CBI enhanced achievement
scores of college students by .25 standard deviations.
CBI also had a moderate and positive effect on attitudes
of students toward instruction and toward the subjects
they were studying. In addition, they also reported that
amount of instructional time was substantially reduced
due to use of CBI. However, their review found little
relationship between study outcomes and design charac¬
teristics of experiments, publication features, or set¬
tings for the studies.
Two meta-analysis reviews of studies on effects of
computer-based education (CBE) at the secondary level
were conducted by Kulik and his colleagues (Kulik,
Bangert, and Williams, 1983; Bangert-Drowns, Kulik, and
Kulik, 1985) . Results of both reviews showed that CBE
had positive effects on student achievement in secondary
schools and that overall effectiveness of computer ap¬
plications seemed to be higher at secondary school level
32

than that at college level. Overall effect sizes in
achievement for CBI in these two reviews were quite
close; they were 0.32 and 0.26 respectively. For each
review, effect size, however, differed for different
uses of computers. in the review of 1983, average
effect sizes of drill/practice and tutorial CAI were
0.27 and 0.36 respectively. in simulation mode, average
effect size was 0.49; and in computer programming, aver
age effect size was 0.20. In the latter review (1985),
for studies of CAI drill-and-practice, average effect
size was 0.30; for studies of tutorial CAI, average
effect size was 0.39; and for nine computer programming
studies, it was 0.11.
Results of both two studies also indicated that
computer-based education had positive effects on student
attitudes toward the subjects and, in particular, com¬
puters. Average effect sizes in attitudes toward com¬
puters were 0.61 and 0.62 respectively. In the former
review (1983), only two study features (year of publica¬
tion year and duration of treatment) had slightly posi¬
tive effect on achievement. However, in the latter re¬
view (1985), three study features (more recent studies,
short duration of studies, and lower-aptitude students) , »
were found to be significantly related to higher aver¬
age effect size in achievement.
33

Kulik, Kulik, and Bangert-Drowns (1985) carried out
a meta-analysis to review 32 studies on effects of CAI
and CMI at the elementary level. Results of the study
showed that CAI had positive effects on student achieve¬
ment at the elementary level. Average effect of CAI
represented an increase in elementary students' achieve¬
ment scores of 0.47 standard deviations, or from the
50th to the 68th percentile. For twenty-four studies
of drill-and-practice CAI, average effect size was 0.44;
and for four studies of tutorial CAI, it was 0.63.
However, CMI had only slight positive effect on student
achievement. Average effect size in achievement of CMI
was as low as 0.07. No significant relationship between
study characteristics and study outcomes was found.
Niemiec and Walberg (1985) also concluded in their
meta-analysis that CAI was more effective in enhancing
elementary students's achievement as compared with
classroom instruction. Average effect size for students
at primary grades (grades K-3) was 0.81; for students at
intermediate grades (grades 4-6) and students at upper
grades (grades 7-8), average effect sizes were 0.27 and
0.32 respectively. Among different modes of CAI, drill
and-practice CAI yielded the highest average effect size
(0.47). Tutorial CAI had somewhat more modest average
effect size (0.34). As for problem-solving CAI, it was
as small as 0.12. In addition, average effect size of
34

low-achieving students was 0.44, while that of average
and of high-achieving students were 0.39 and 0.19 re¬
spectively.
Kulik, Kulik, and Shwalb (1986) conducted a meta¬
analysis of 24 studies on effectiveness of computer-
k3-£>ed adult education. A medium positive effect was
found on adult learners. On the average, computer-based
education raised adult students' examination scores by
0.42 standard deviations, or from the 50th to the 66th
percentile. Average effect size of CMI and CEI were
0.72 and 1.13 respectively. However, average effect
size of CAI was only 0.29. The correlation between
tutorial CAI and effect sizes was 0.17 which indicated
that there was slight positive relationship between
these two variables. The correlation between simulation
and effect sizes was -0.18; and the correlation between
computer programming and effect sizes was -0.14.
In their meta-analysis of effects of CAI in sec¬
ondary schools, Samson, et al. (1986) came to the con¬
clusion that CAI programs had significant impact on
students' achievement by raising average performance
0.32 standard deviations, or from the 50th to the 63rd
percentile. CAI drill-and-practice programs appeared to
be relatively less effective with secondary students as
compared with tutoring programs.
35

Kulik and Kulik (1987) applied meta-analysis to
bring together the results of four separate meta¬
analyses (Bangert-Drowns, et al., 1985; Kulik and Kulik,
1986; Kulik et al., 1986; Kulik, et al., 1985) on CBI
ranged from the elementary to the adult levels and con¬
cluded that the average effect of computer-based in¬
struction was to raise achievement by 0.31 standard de¬
viations, or from the 50th to the 61st percentile.
The most recent meta-analysis of impacts of CBI,
especially microcomputer-based, in elementary, sec¬
ondary, and college/adult levels was conducted by
Roblyer, Castine, and King (1988). In contrast to past
reviews of studies which consistently found that com¬
puters had highest impacts on elementary students, this
review found that there were significantly higher ef¬
fects at college/adult levels (ES = 0.66). Effects of
computers at elementary levels (ES = 0.29) were only
slightly higher than those at secondary levels (ES =
0.19). This finding implied that computer applications
at higher grade levels were at least equal or even more
effective than at lower grade levels. Perhaps the most
interesting finding in this review was that use of com
puters in teaching cognitive skills, such as problem¬
solving and critical thinking, produced about the same
effects as use of computers in teaching mathematics.
36

Clearly, most research reviews and meta-analyses
have come to the conclusion that use of computers in
instruction, especially in drill-and-practice and tu¬
torial CAX, for the most part, was more effective in
enhancing students' mathematics achievement in compari¬
son with traditional instruction. However, application
of computers at higher levels (e.g., problem-solving,
simulation, and computer programming) aimed at improving
students' higher order thinking skills had inconclusive
findings in these reviews. For example, little evidence
was found to favor the common-held belief that the use
of Logo programming is more effective in enhancing
students' problem-solving skills than the use of tradi¬
tional methods only.
It is also worthy to note that although reviews of
CBI studies have been conducted in the past twenty
years, most of studies located for the research reviews
(except Roblyer et al's review of 1988) do not reflect
recent development in computer technology or CBI tech¬
niques since 1980 (Gillingham and Guthrie, 1987). Ac¬
cording to Becker's study, in Kulik et al's two most
recent meta-analyses, only one out of 64 studies related
to use of microcomputers; similarily, in Niemiec and
Walberg's meta-analysis, only two out of 224 studies
involved microcomputers (Bracey, 1988).
37

CHAPTER III
METHODOLOGY
The purpose of this chapter is to describe the
methodology of meta-analysis that will be applied to
this study of the effects of CAI/computer programming
on elementary and secondary mathematics education.
In their meta-analysis, researchers are first re¬
quired to identify and collect as many studies as possi¬
ble by clearly specified procedures. They then need to
code the study features and study outcomes in quantitat¬
ive or semiquantitative ways and calculate individual
study effect sizes. Finally, multivariate statistical
techniques are used to describe findings and relate
characteristics of the studies to outcomes.
Identifying ar.d Collecting Studies
The first step in this meta-analysis is to identify
and collect a large number of studies from 1970 to 1988
that compared the effects of CAI/computer programming
with conventional instruction. The number of experi¬
mental studies used and ways studies are collected have
a great impact on results of meta-analysis. Due to lack
of a proper method to decide if a certain number of
38

studies included represent the entire domain of studies
in existence, the best way to ensure representativeness
seems to be to collect as many studies as possible
(Kavale and Glass, 1981, p.532). However, in order to
ensure results of meta—analysis being meaningful and
useful, basic criteria used for selection of studies
were set as follows:
1) Studies must include a comparison of some form of
CAI/computer programming with traditional instruction
in elementary or secondary mathematics.
2) Studies included in this meta-analysis must be
experimental rather than descriptive or theoretical.
3) Studies must provide sufficient data to make cal¬
culation of an effect size possible.
4) Studies are those in which outcome variables are a
measure of student achievement, problem-solving skills,
attitudes toward mathematics/instruction, or attitudes
toward computers.
5) Studies must have no obvious flaws in methodology.
The empirical studies used in this meta-analysis
were mainly derived from three major sources: published
studies, ERIC documents, and dissertations.
A large group of studies was located by computer¬
searching library data base using SilverPlatter informa¬
tion service. The data base searched in this way was
the Educational Resources Information Center (ERIC),
39

which includes two files; Resources in Education and
Current Index to Journal in Education. To perform com¬
puter searches, several keywords and phrases, such as
"Computer-Assisted Instruction", "computer programming",
"mathematics achievement", "problem solving',"elementary
and secondary mathematics", "attitudes toward mathe¬
matics/instruction", and "attitudes toward computers"
were used. A by-hand search of the 1970-1988 issues of
Comprehensive Dissertation Abstracts was also conducted
in order to obtain dissertations of concern. Searches
of studies were further supplemented by reviewing and
checking references of located studies or research
reviews.
As a result of comprehensive search, a total of
approximately 150 studies were obtained and reviewed.
Among these studies, only 72 studies were determined to
meet the basic criteria for inclusion in this meta¬
analysis. A complete list of experimental studies used
in this meta-analysis is included in Appendix A.
Coding Study Features and Outcomes
The next step in this meta-analysis is to describe
as completely as possible the characteristics of the
studies located. The researcher first must develop
variables and categories for describing features of
40

studies. The purpose of coding study characteristics is
to understand whether a given study feature may yield
different results in different settings, or to determine
what kinds of study characteristics may contribute to
higher achievement.
For the purpose of this study, study features were
grouped roughly into five categories: subjects, experi¬
mental treatments, study designs, study variables, and
study outcomes. A total of 26 variables were used to
describe these characteristics. The choice of these
variables was based on a review of variables used by
several past research reviews and meta-analyses of com¬
puter applications in order to determine the variables
appropriate to the topic. The list of variables was
revised after reading studies collected for this meta¬
analysis. A complete list of variables is included in
Appendix B. A coding system was then developed to code
the data of each variable by using the range of values
as presented in Appendix C. Not all studies included in
this analysis provided available information for every
selected variable. In this case, the missing value was
given.
Measuring Effect Sizes
Evaluation of the impact of a given independent
variable on dependent variable(s) by measuring the dif
41

between means is always the major purpose of
an experimental study. In this sense, in meta—analysis
the study features discussed earlier are the independent
variables, and the instructional outcomes pertain to the
dependent variables. Meta-analysis enables the re¬
searcher to examine the relationships between dependent
and independent variables by measuring the effect sizes.
In an attempt to integrate the findings of studies,
the magnitude of experimental effects must be first
transformed to a common scale, called the effect size,
which is defined as the mean difference between the
experimental and control groups divided by the standard
deviation of the control group [Glass, et al., 1981].
The formula is:
Xe - Xc ES = -
Sc
Where Xe = mean of treatment group on outcome measure,
Xc = mean of control group on outcome measure, and
S'c = standard deviation of the control group.
Although the measurement of effect sizes is simple
in appearance, it can be very difficult to calculate ef¬
fect sizes from some research data reports. In measuring
the effect size, different techniques may be used for
different study designs to determine the numerator and
denominator in the formula of the effect size.
42

The denominator in the formula of effect size was
fundamentally determined by the following techniques:
1. whenever the standard deviation of the control
group was reported in the study, it was used as the
denominator in the formula.
2. If a study only reported average scores of a
standardized test, the standard deviation of the norm
group was used as an estimate for the standard deviation
of the control group.
3. When a factorial analysis of variance design was
used to analyze the data of a study, if the means of two
groups were available but the standard deviation of the
control group was not available, the estimate of numer¬
ator of the formula of effect size can be obtained by
the formula:
Where the numerator of the formula is the sum of squares
for all factors except treatment, and the denominator is
the sum of the degree of freedom for all factors except
treatment.
The means used in the numerator of formula were
decided by the design of the study. Glass (1981) re¬
counted various techniques for determining the numerator
in the formula of the effect size as follows:
43

1. Whenever the study in which subjects were ran¬
domly assigned to the treatment and control groups, or
the pretest of the study showed that there was no sig¬
nificant difference between two groups, the difference
of the posttest means was the numerator of the formula
of the effect size.
2. Whenever analysis of covariance was used in the
study and the adjusted means were reported, the numer¬
ator was the difference between the adjusted means.
3. When the gain scores were reported in the study,
the numerator of the equation was the difference between
the two average gain scores. In this sense, the gain
scores were defined as the pretest scores deducted from
the posttest scores for both the treatment and control
groups. The formula is:
Ge — Gc ES = -
Sc
Where Ge = the average gain score of the experimental
group, Gc = the average gain score of the control group,
and Sc = the standard deviation of the control group.
When means and standard deviation of the control
group were not available in research studies, measure¬
ment of effect sizes become more complex and difficult.
In these cases, for the most part, a close estimate of
effect size still can be obtained by using other avail-
44
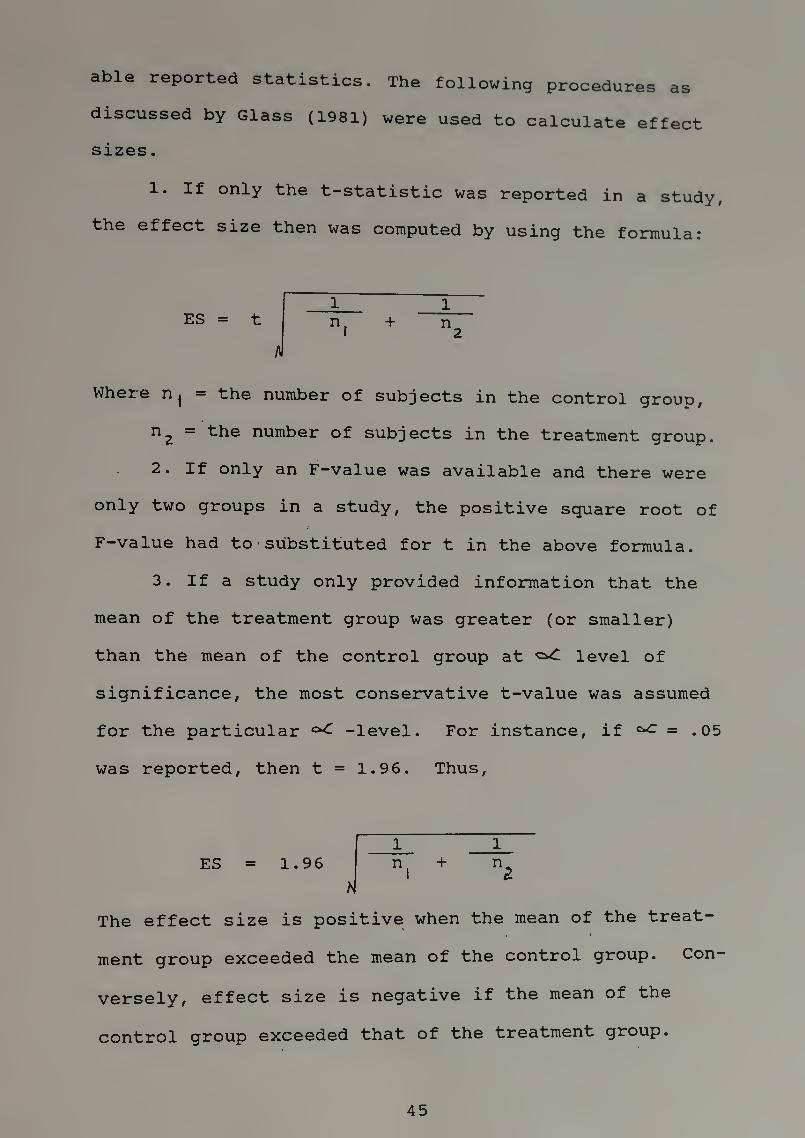
able reported statistics. The following procedures as
discussed by Glass (1981) were used to calculate effect
sizes.
1. If only the t-statistic was reported in a study,
the effect size then was computed by using the formula:
Where n^ - the number of subjects in the control group,
n2 = the number of subjects in the treatment group.
2. If only an F—value was available and there were
only two groups in a study, the positive square root of
F-value had to'substituted for t in the above formula.
3. If a study only provided information that the
mean of the treatment group was greater (or smaller)
than the mean of the control group at level of
significance, the most conservative t-value was assumed
for the particular -level. For instance, if = .05
was reported, then t = 1.96. Thus,
_1_ _1_
ES = 1.9 6 n( + n^
H
The effect size is positive when the mean of the treat¬
ment group exceeded the mean of the control group. Con¬
versely, effect size is negative if the mean of the
control group exceeded that of the treatment group.
45
By calculating effect size, findings of individual
studies are expressed in standard deviation units and
thus transformed into a common metric. In this meta-
^rislysis, instructional outcomes of effects of CAI/com—
puter programming were classified into four major types.
The most often used outcome variable in the studies was
students' mathematics achievement. The next most
frequently measured outcome variable was the score of
problem-solving skills. Other outcome variables measured
in empirical studies were students' attitudes toward
mathematics/instruction and students' attitudes toward
computers. Various techniques of measuring effect size
as mentioned above will be used to quantify outcomes of
studies in each of these areas.
Multiple Effect Size
The required independence of statistical tests
would be violated if a single outcome was presented by
several effect sizes. Furthermore, it would overesti¬
mate effects of studies conducted with multiple groups
and multiple scales (Kulik et al., 1986).
Therefore, caution must be taken in calculating
effect sizes to avoid the problem of multiple effect
size. This problem usually occurs in several ways. For
example, if a study involves more than one treatment or
46

control group, it could bring about the problem of mul¬
tiple effect size. The multiple effect sizes could
also happen due to use of results from subscales and
subgroups to evaluate a single outcome area (Kulik, et
al.,1985). In these cases, it is quite possible that
certain effect sizes could be used duplicately either
in part or whole to evaluate the study outcome. For
example, in a study involving two different levels of
student ability (e.g. low and high ability), three ef¬
fect sizes could be computed for a certain outcome: one
for each ability level and the one for the whole group
which combined two levels. Thus, if all three effect
sizes were taken into account for the overall effect of
the study, the problem of multiple effect size occurred
since the effect sizes of each ability level and the ef¬
fect size of the whole group actually represented the
same results. In order to avoid the problem of multiple
effect sizes, a researcher in this case needs to make a
choice by considering either two effect sizes of each
ability level or effect size of the combined group,
instead of both.
In this meta-analysis, four major procedures were
taken in the process of computing effect sizes in order
to prevent the multiple effect sizes. Firstly, if a
study dealt with two or more grade levels, results from
each grade level rather than results from the whole
47

group were considered in measuring the overall average
effect size. Secondly, in a study where subjects were
tested by both standardized and experimenter-teacher-
developed tests to evaluate a study outcome, effect
sizes derived from either of two tests rather than both
were used in measuring average effect size. Thirdly,
similarly, if a study reported different results of a
given outcome area due to difference in the length of
treatment, results from either the longer or shorter
length of treatment were considered instead of both.
Finally, in a study where effect sizes were calculated
on the basis of both grade level and sex, if average
effect size was measured for a given study outcome, the
effect sizes derived either form grade level or from sex
were used rather than both.
Evaluation of the Magnitude and
Significance of Effect Size
In meta-analysis, findings of studies were analyzed
mainly through use of average effect sizes. Consequent¬
ly, average effect size plays a very important role in
judging results of findings. For the purpose of making
a reliable judgment about the results, a clear under¬
standing of the magnitude and significance of average
effect size is not only necessary but also important
(Athappilly, 1978).
48
measurement of the Effect size is a standardized
effectiveness of treatment as compared with the control
group. Perhaps the most direct and clear-cut meaning of
effect size is the impact of a treatment expressed in
terms of position shift from the midpoint toward the
positive or negative direction of the normal curve.
Standard deviations, which are readily convertible to
percentile score, were used to measure extent of shift.
The greater the average effect size, the greater the
impact of treatment is.
Obtaining of a positive effect size implies that
the findings are in favor of the treatment group, while
a negative one means that the control group is superior
to the treatment group. For example, if the effect size
of a study is 0.49, it means that on the average, a stu¬
dent in the treatment group was 0.49 standard deviations
superior to a student in the control group. This effect
can also be expressed in percentile. Namely, on the av¬
erage, a student in the treatment group had been raised
from the 50th percentile to the 69th percentile of the
control group.
In order to determine the level of significance
level of effect size, Athappily's formula of t-test was
used, and t-value and probabilities corresponding to
each average effect size were calculated. The t-tests
were conducted under the assumption that studies of
49

effects of CAI/computer programming in elementary and
secondary mathematics education formed a sampling dis¬
tribution and the hypothetical mean of the subjects in
traditional instruction group was at the zero point.
Thus, the t—values were calculated from the formula
(Athappily, 1978):
(effect size) - (zero) t — ■' ■ ^^
(Standard error of mean of the effect sizes)
Probabilities corresponding to the t-values were
also computed for the two-tailed test. In the computa¬
tion of t-value and the probability, the degree of free¬
dom was1 obtained by subtracting one from the number of
effect sizes. The probability of making type I error
for this study was set at .05 level. The average effect
size corresponding to each study feature was therefore
considered to be significant or not significant at the
Analysis of Data
Meta-analysis is the analysis of analyses. After
study features were coded in a systematic way and effect * • * *
sizes for each study's variables were calculated, find
ings from independent studies need to be analyzed. This
stage of meta-analysis involves accumulating findings
from separate studies into a review summary.
50
Two categories of results were expected from analy¬
sis of integrated findings. The first one is the overall
effect of CAI/computer programming in terms of achieve¬
ment, problem-solving skills, and attitudes toward
mathematics/instruction and computers. The second cat¬
egory is the relationship between various independent
variables (study characteristics) and the dependent
variable (effect size).
Iri this meta—analysis, calculation of effect sizes
was done by hand-calculator and analysis of data was
done by computer using Statistical Package for Social
Sciences (SPSS). Five SPSS programs were used in analy¬
sis of the data. They are summarized as follows:
1. CONDESCRIPTIVE— This program was used to obtain mean
effect sizes and a complete description of the data
base.
2. FREQUENCIES— This program was used to obtain fre¬
quencies of distribution of selected variables.
3. ONEWAY— This program was employed in order to exam¬
ine the analysis of variance among two dependent
variables and independent variables.
4. PEARSON CORR— This program computes Pearson product-
moment correlations for pairs of variables. The
Pearson correlation coefficient r is used to measure
the strength of linear relationship between two
variables.
51

5. T-TEST— This program was used to determine whether
there is a significant difference between two vari¬
ables. This computer program was also applied to
Athappilly's formula to obtain the t-value corre¬
sponding to each study's features.
52

CHAPTER IV
RESULTS
This chapter presents results of analyzing data
gathered in this study. Results are organized into four
major categories. The first category is a brief descrip¬
tion of the studies located for this meta-analysis.
The second category deals with overall effects of
CAI/computer programming on elementary/secondary mathe¬
matics education. In this part, the overall effect
size, which was measured by averaging effect sizes of
all the studies used in this study, was analyzed in
terms of mathematics achievement, problem-solving
skills, and attitudes toward mathematics/instruction
and computers.
The third category of results includes the relation¬
ship between specific study characteristics coded from
the studies and the corresponding effect sizes. For
convenience of discussion, the effects were grouped into
four subcategories: a) specific effects by subject char¬
acteristics, b) specific effects by treatment factors,
c) specific effects by design variables, and d) specific
effects by study variables. In each subcategory, the
effects will be analyzed in terms of mathematics
achievement as well as problem-solving skills where the
data are available.
53

The last category refers to the effects of CAI/com-
puter programming on student attitudes toward mathe¬
matics/instruction on the basis of specific study fea¬
tures. Due to the quite small number of effect sizes
for most of study variables, this analysis only covers
the variables for which the average effect sizes were
statistically significant.
Description of the Studies
This section attempts to give a general picture of
the nature of the studies used in this meta-analysis by
describing the study characteristics and outcomes as
fully as possible. The 72 studies located for this
analysis were conducted in a variety of settings and
measured outcomes in various ways. In this context, the
modes of computer applications, the sources of the
studies, the publication year of the studies, and study
outcomes are briefly described.
Modes of Computer Application
A variety of computer applications in mathematics
instruction was examined here. Among 72 studies, seven
studies used two or more modes in each study, rest of
them (65) used only one mode of computer application.
In CAI, fifty-four studies investigated the ef¬
fectiveness of various different modes of CAI in mathe- • , - • ■'
54

matics education at the elementary and secondary levels.
Thirty of these CAI studies emphasized drill-and-prac-
tice mode, eleven studies emphasized to tutorial CAI,
eight emphasized,simulation and gaming, three emphasized
CAI problem-solving mode, and two studies involved all
three modes of CAI in the study.
Twenty five studies investigated the effects of
computer programming on achievement, problem-solving
skills, and/or attitudes toward mathematics/instruction
and/or computers. Among them, seventeen studies were
related to effects of computer programming on mathe¬
matics achievement, especially the understanding of
mathematical concepts/applications; fifteen studies
dealt with the effects of computer programming on
problem-solving skills; and seven studies involved the
effects of attitudes toward mathematics/instruction or
computers. As for language(s) used in computer program¬
ming, twelve of these studies dealt with Logo program¬
ming, eleven emphasized BASIC programming, and two
studies related other programming languages including
FOCAL, COBOL, FORTRAN, MACRO, and PASCAL.
Source of Study
All seventy-two studies were located from three
major different sources; published studies, ERIC docu¬
ments, and dissertation abstracts. As indicated in
55

only around 11-6 of the studios were retrieved
from unpublished ERIC documents; the rest of the studies
were equally divided into published studies and disser¬
tations.
Table 1 Studies Classified by Source
Source of Study
Published ERIC Dissertation Total
Number of Studies
32 8 32 72
Year of Study
The studies included in this meta-analysis ranges
from 1970 to 1988. In Table 2, the publication years of
studies were divided into four periods, and the number
of studies in each period is listed. Apparently, the
majority of the studies were conducted during the period
of 1985-89. From 1975-79, the number of the studies
located was as small as 7.
Table 2 Studies Classified by Year of Publication
Year of Publications
1970-74 1975-79 1980-84 1985-88 Total
Number of 15 7 19 31
Studies _
56

Study Outcomes
Among the 72 studies collected, most of studies
investigated two more categories of study outcomes. Ac¬
cording to Table 3, more than half of studies involved
the examination of the effectiveness of CAI/computer
programming in mathematics achievement at the elementary
and secondary levels. Few studies related to study of
student attitudes toward computers.
Table 3 Studies Classified by Study Outcomes
Study Math Prob Attitudes vs Attitudes vs Outcome Achieve Solving Math/Instruc computers
Number of 64 20 17 3 Studies
Overall Effects of CAI/Comouter Programming
The analysis in this section attempts to shed some
light on the question of whether the application of CAI
and/or computer programming in mathematics instruction
is significantly more effective in improving student
mathematics achievement, problem-solving skills, and
attitudes toward mathematics/instruction and toward com¬
puters in comparison with traditional classroom instruc¬
tion. The results were analyzed by using the average
effect size as a common measure of treatment effective-
57
ness. Simple descriptive statistics was also used to
compare the results of computer-based and traditional
classroom teaching.
On the basis of effect size measurement related to
study features, the effect sizes were calculated for
each mode of computer applications under many different
settings. The instructional outcome measured most often
in the 72 studies was student mathematics achievement.
Other outcomes measured in the studies were the scores
of problem-solving skills and change in student atti¬
tudes toward mathematics/instruction and computers. As
a result, as shown in Table 4, in total, 243 effect
sizes in mathematics achievement, 146 effect sizes in
problem-solving skills, 95 effect sizes in attitudes
toward mathematics/instruction, and 8 effect sizes in
attitudes toward computers were obtained from 72 studies
used in this meta-analysis.
The table indicates that the overall mean effect
size in student mathematics achievement was 0.384, a
moderate positive effect size. The overall mean effect
size in problem-solving skills was 0.174, and that in
attitudes toward mathematics and/or instruction was
0.163 and 0.747 in attitudes toward computers.
These data imply that the students in the computer
application group performed superiorly than those in the
traditional classroom instruction group. To be specific,
58

Table 4 Overall Average Effect Size in Math Achieve¬
ment, Problem-Solving Skills, and Attitudes toward Math/Instruction and computers
Math
Achieve Problem Solving
Attitude vs
Math/Instruc Attitude vs Computers
Mean .384 . 174 . 163 .747
SD .582 .639 .371 .370
SE of Mean .037 .053 .038 .131
Number of ESs 243 146 95 8
t-value 10.26* 3.29* 4.27* 5.71*
P-value . 000 .001 .000 . 001
* The null hypothesis, assuming that the mean effect size is zero, is rejected with the probability of Type I error being less than or equal to .05.
the average effect size means that the average score for
the students receiving some form of CAI/computer pro¬
gramming treatment was 0.38 standard deviations greater
in the mathematics achievement measure; 0.17 standard
deviations greater in the problem-solving skills
measure; 0.16 standard deviations greater in the atti¬
tudes toward mathematics/instruction measure; and 0.75
standard deviations greater in the attitudes computers
measure than the average score for the traditional in¬
struction group students.
The mean effect size can also be interpreted in
terms of percentile scores. It shows the percent of the
area of the standard normal curve that falls below a
z-score of a given standard deviation. In this meta¬
analysis, the CAI/computer programming raised an average
59

student from the 50th to the 65th percentile in mathe¬
matics achievement, from the 50th to the 57th percentile
in problem-solving skills, from the 50th to the 56th
percentile in attitudes toward mathematics/instruction,
and from the 50th to the 77th percentile in attitudes
toward computers over the conventional mathematics in¬
struction group.
It is clear that CAI/computer programming had a
moderate positive effect on mathematics achievement, a
slight positive effect on problem-solving skills and
attitudes toward mathematics and/or instruction, and a
great positive effect on attitudes toward computers.
The average of effect sizes in mathematics achieve¬
ment for each mode of computer applications is presented
in Table 5. The data reflect several aspects of the ef¬
fects of CAI/computer programming on student mathematic
achievement.
Firstly, CAI tutorial mode with the average effect
size of 0.549 appeared to be the most effective instruc¬
tional technique. On the average, a student treated by
CAI tutorial mathematics instruction can be expected to
enhance his/her mathematics achievement 0.55 standard
deviation higher than that of the average control group
subject; In other words, CAI tutorial mathematics in¬
struction can be expected to shift the position of the
average treated student from the 50th to the 71st per¬
centile of the control group.
60
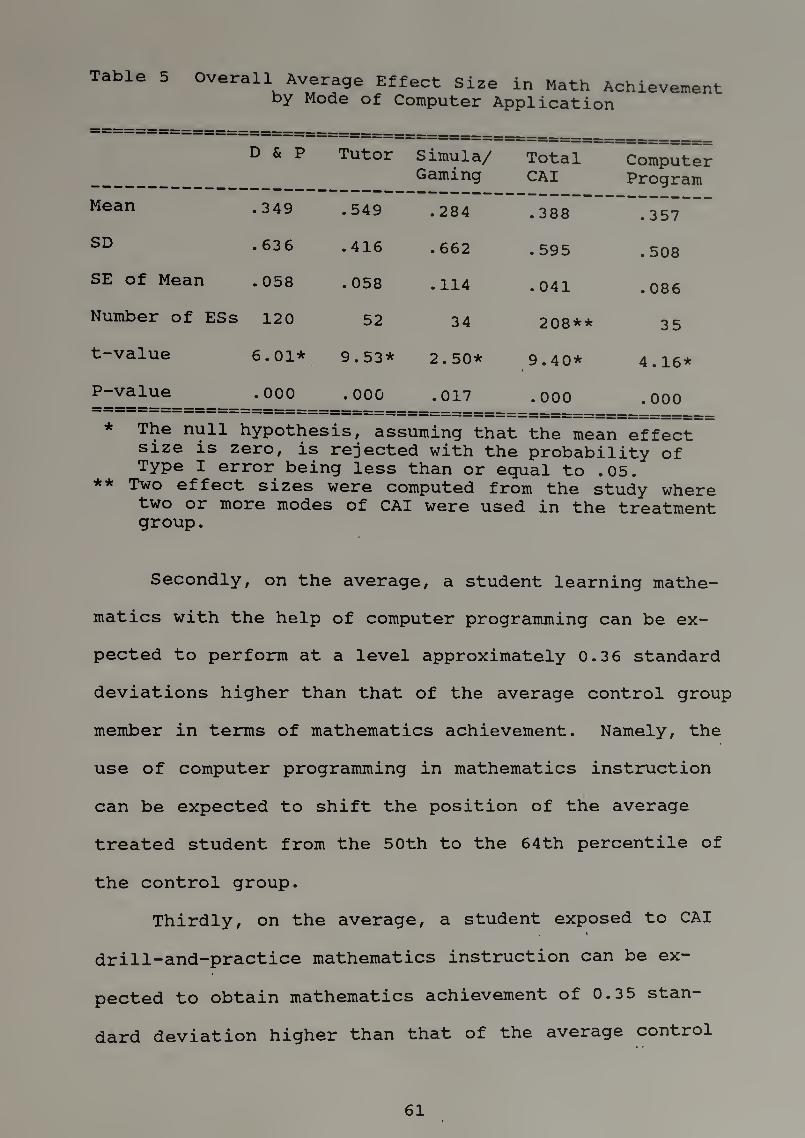
Table 5 Overall Average Effect Size in Math Achievement by Mode of Computer Application
ll II ft
II II II Q
ii
Tutor Simula/ Gaming
Total CAI
Computer Program
Mean .349 .549 .284 .388 .357
SD . 636 .416 . 662 .595 .508
SE of Mean . 058 . 058 .114 .041 .086
Number of ESs 120 52 34 208** 35
t-value 6.01* 9.53* 2.50* 9.40* 4.16*
P-value . 000 . 000 .017 .000 .000
* The null hypothesis, assuming that the mean effect size is zero, is rejected with the probability of Type I error being less than or equal to .05.
** Two effect sizes were computed from the study where two or more modes of CAI were used in the treatment group.
Secondly, on the average, a student learning mathe¬
matics with the help of computer programming can be ex¬
pected to perform at a level approximately 0.36 standard
deviations higher than that of the average control group
member in terms of mathematics achievement. Namely, the
use of computer programming in mathematics instruction
can be expected to shift the position of the average
treated student from the 50th to the 64th percentile of
the control group.
Thirdly, on the average, a student exposed to CAI
drill-and-practice mathematics instruction can be ex¬
pected to obtain mathematics achievement of 0.35 stan¬
dard deviation higher than that of the average control • r
61

group student. Expressed in percentile scores, CAI
drill/practice can be expected to shift the position
of the average treated student from the 50th to the 64th
percentile of the control group.
Fourthly, a student in CAI simulation/gaming group
can be expected similarly to perform at a level approxi¬
mately 0.28 standard deviation higher than that of the
average control group subject in terms of mathematics
achievement. It also means that on the average, simula¬
tion/gaming can be expected to shift the position of
students in treatment group from the 50th to the 61st
percentile of the control group.
Finally, the overall effect size in achievement of
CAI was 0.388, slightly higher than that of computer
programming. It implies that CAI can be expected to en¬
hance student achievement by approximately 0.39 standard
deviations and shift the position of the average treated
student from the 50th to the 65th percentile of the con¬
trol group.
With regard to the effect of individual mode of
computer applications on problem-solving skills, due to
the small number of effect sizes in some CAI modes when
the mean effect size was calculated separately for each
mode, this analysis was not included. Instead, the ef¬
fect sizes were grouped into CAI and computer program¬
ming categories across the various different computer
applications. Table 6 shows that the effect of CAI on
62

problem-solving skills was not statistically signifi¬
cant, while the effect of computer programming was more
effective than the traditional instructional method.
The average effect size in problem-solving skills of
computer programming was 0.234.
Table 6 Overall Average Effect Size in
Problem-Solving Skills
Mean SD SE of
Mean Number of ES
t-value P-value
CAI .060 .464 .066 50 .91 .369
Computer
Program. .234 .708 .072 96 3.23* . 002
* The null hypothesis, assuming that the mean effect size is zero, is rejected with the probability of Type I error being less than or equal to .05.
Study Features and Study Outcomes
Although the application of CAI/computer program¬
ming in mathematics instruction produced a moderate
positive result in the typical study, the extent of
effects in fact varied from study to study. In order to
reach a general and systematic conclusion about effects
of CAI/computer programming on mathematics education,
variation in study outcomes needs to be further ana¬
lyzed. The purpose of the analysis in this section
therefore was to determine whether certain types of
studies under specific settings brought about stronger
effects than others.
63

For convenience, the descriptive variables on which
effect sizes were computed are grouped into four cat¬
egories: 1) subject characteristics, 2) treatment fac¬
tors, 3) study variables, and 4) design variables. For
°f these variables, the mean effect sizes were com¬
puted to describe effects of variables on students' per¬
formance. For some continuous variables, such as stu¬
dents' grade levels, ability levels, socio-economic
status levels, number of subjects, length of treatment,
year of publication, etc., Pearson correlation coeffi¬
cients were also calculated in order to give a better
and more precise description of effects of these vari¬
ables.
It is important to note that most of the studies
cited here related to mathematics achievement at elemen¬
tary and secondary levels. A few studies of problem¬
solving were identified and met minimal criteria for
inclusion. Therefore, in analyzing the outcomes of
mathematics achievement, the data on effect sizes in
each mode of computer applications are provided as fully
as possible. As to the analysis of problem solving
skills, because of the limited number of effect sizes
for some variables, no attempt was made to try to ana¬
lyze the effects of computer applications on the basis
of every variable.
64

Specific Effects by Subject Characteristics
In this subsection, the effects of CAI/computer
programming on students' mathematics achievement and
problem-solving skills will be examined as a function
of subject characteristics.
The subject variables dealt with the major charac¬
teristics of the students who were involved in the ex¬
perimental studies used in this meta-analysis. Four
main subject characteristics—grade levels, ability
levels, the levels of socio-economic status and sex—
were taken into consideration for the analysis of ef¬
fects of these independent variables on instructional
outcome. Subjects were classified on the basis of vari¬
ables discussed in an attempt to provide educators/
teachers with clearer understanding of the effectiveness
of CAI/computer programming used in mathematics instruc¬
tion under various different conditions and settings.
However, it is worth noting that because the classifi¬
cation of student ability levels and socio-economic
status was basically based on subjective opinion and
judgement, the effect sizes derived from these two vari¬
ables were less specific and reliable than those of
grade levels and sex (Athappilly, 1978, p.66).
65

Effect Size by Grade Level
This subsection aims to examine the question: At
which grade level(s) is the application of CAI/computer
mg m mathematics instruction more effective
than traditional classroom instruction only in terms of
student mathematics achievement and problem—solving
skills?
The grade levels considered in this meta-analysis
are elementary (grades 1-6), junior high (grades 7-9),
senior high (grades 10-12). Table 7 shows the effect
size data related to different modes of CAI and computer
programming used in mathematics instruction by general
grade levels.
The data indicate that overall, at all general
grade levels, the use of CAI/computer programming in
mathematics instruction was significantly more effective
in improving student mathematics achievement in compari¬
son with the use of traditional classroom instruction
only. Among the three general grade levels, the junior
high level had the largest mean effect size of 0.466 in
mathematics achievement. The mean effect size in mathe¬
matics achievement for the elementary and senior high
level were 0.367 and 0.316 respectively. However, the
effect sizes were not significantly different for the
three general grade levels, F(2,240) = 0.866, p > .05.
66

Table 7 Average Effect Size in Math Achievement by
Level and Mode of Computer Application
Grade d Level
& P Tutor
Elementary
Mean .342 .492
SD .577 . 320
SE of Mean .060 .072
Number of ESs 92 20
t-value 5.69* 6.87*
P-value .000 . 000
Junior Hiqh
Mean .408 .854
SD .887 .483
SE of Mean . 185 . 117
Number of ESs 23 17
t-value 2.21* 7.28*
P-value . 038 .000
Senior Hiqh
Mean . 192 .280
SD .261 . 167
SE of Mean .117 .043
Number of ESs 5 15
t-value 1.65 6.47*
P-value . 175 .000
Simu/ Gaming
Total CAI
Compu Progra
Total Mean
.236 .342 .764 .367
.706 .574 .309 . 570
. 133 .048 . 103 .046
28 142** 9 151
1.77 7.12* 7.42* 7.91*
.089 .000 . 000 . 000
.451 .584 .093 .466
.212 .734 .449 .706
. 106 .111 . 120 .093
4 44 14 58
4.26* 5.28* .77 5.03*
.024 .000 .453 .000
.632 .292 . 360 .316
.685 .260 .515 .364
.484 .055 .149 .062
2 22 12 34
1.30 5.27* 2.42* 5.06*
.417 .000 .034 .000
* The null hypothesis, which assumes that the mean effect size is zero, is rejected with the probability
of Type I error being less than or equal to 0.05. ** Two effect sizes were computed from the studies where
two or more different modes of CAI were used.
67

The 0.466 average effect size for the junior high
level means that, on the average, a junior high student
treated with CAI/computer programming mathematics in-
can be expected to perform at a level approxi¬
mately 0.466 standard deviations higher than that of the
average control group students relative to a given
achievement measure. In other words, CAI/computer pro¬
gramming mathematics instruction can be expected to
shift the position of the average treated junior high
student from the 50th to the 68th percentile of the con¬
trol group. Similarly, the position of the average
senior high student in treatment group can be shifted
from the 50th to the 63rd percentile of the control
group through the application of CAI/computer program¬
ming to mathematics instruction. For elementary stu¬
dents, it was from the 50th to the 64th percentile of
the control group.
The data in Table 7 also give more detailed infor¬
mation about effects of each mode of computer applica¬
tions on student mathematics achievement. In this con¬
text, the mean effect sizes in mathematics achievement
were classified by general grade level and by mode of
computer applications. The data in the table show the
following information:
Firstly, the application of CAI drill/practice in
mathematics instruction was significantly more effective
in improving student mathematics achievement at both the
68

elementary and the junior high level, but was not sig¬
nificantly effective at the senior high level in com¬
parison with the use of traditional classroom instruc¬
tion only. This was probably due to the small number of
effect sizes at the senior high level. The mean effect
size in mathematics achievement for drill/practice CAI
at junior high level was 0.408, which was the largest
one among the three grade levels. This would indicate
that a: junior high student treated with CAI drill/prac¬
tice mathematics instruction can be expected to perform
at a level approximately 0.41 standard deviations higher
than that of the average control group students relative
to a given achievement measure. Namely, a student at
the 50th percentile of the control group would be ex¬
pected to rise to the 66th percentile of the control
group group after being treated with CAI drill/practice
mathematics instruction.
Secondly, tutorial CAI in mathematics instruction
was significantly more effective than traditional
methods in enhancing student mathematics achievement at
all general grade levels. Especially, studies with
junior high students treated with tutorial CAI had the
highest average effect size (0.854) among all effect
sizes derived on the basis of grade level. A student at
junior high level exposed to tutorial CAI can be ex¬
pected to perform at a level approximately 0.85 standard
deviations higher than that of the average control group
69

students or a shift of the position from the 50th to the
80th percentile of the control group can be expected.
CAI simulation/gaming mode, as shown in
Table 7, the only effect size which was statistically
significant was that of the junior high level (ES= .451).
However, due to the quite small number of available in¬
dividual effect sizes, this result should be interpreted
with caution.
Fourthly, the overall effect of CAI (including
drill“and-practice, tutorial, and simulation/gaming
modes) in mathematics instruction was significantly more
effective in improving student mathematics achievement
at all three general grade levels. The average effect
size of CAI for the elementary level was 0.342; for the
junior high and the senior high levels 0.584 and 0.292
respectively. The effect sizes differed significantly
for the three different grade levels, F(2,205) = 3.170,
p > 0.05. There was a significant difference between
the elementary and junior high levels.
Lastly, as to the effects of computer programming
in mathematics achievement, the data indicate that the
average effect size of computer programming was not
significant at the junior high level (ES = 0.093), but
significant at other two levels; it was 0.7 64 for the
elementary level and was 0.360 for the senior high
level. The effect sizes for the three grade levels were
significantly different, F(2,32) = 6.258, p > 0.05. The
70

effect size difference between the junior high and
senior high levels was too small to be considered stat¬
istically significant, but the differences between the
elementary and junior high levels and between the ele¬
mentary and senior high levels were significant.
An attempt was also made to examine the relation¬
ship between effect sizes in achievement and grade
levels by using the Pearson correlation coefficient.
The data in Table 8 suggest that simulation/gaming CAI
had higher effect sizes for higher grade students, while
the opposite trend was found for other three modes of
computer applications. The overall correlation between
the effect sizes in achievement and grade levels was
0.002 (p > 0.05) which indicates that the relationship
between effect size and grade level in mathematics
achievement was positive, but not significant.
Generally speaking, because of the substantially
larger number of effect sizes contributing to the ele¬
mentary level, findings related to this grade level
seem more reliable than those concerning the junior and
senior high levels.
Table 8 Correlation between Effect Size in Achievement and Grade Level by Mode of Computer Application
D & P Tutor Simula/ Compu Overall Gaming Progra
Grade -.005 -.167 .170 -.269 .002
71

With regard to problem-solving skills, due to the
limited studies relative to problem solving skills as
well as the quite small numbers of individual effect
sizes derived from these studies as classified by each
CAI mode and grade levels, no attempt was made to ana¬
lyze effects of each mode of CAI on students' problem¬
solving skills. Instead, the effect sizes were grouped
into two categories: CAI and computer programming, as
given in Table 9.
The data in Table 9 shows that CAI did not signifi¬
cantly promote student problem-solving skills at all
three grade levels. In computer programming, the aver¬
age effect sizes in problem-solving skills for the
elementary and junior high levels were significant.
On the average, teaching computer programming can be
expected to enhance elementary students' problem-solving
skills by approximately 0.289, or shift the position of
the average treated student from the 50th to the 61st of
the control group. The average effect size of the junior
level was 0.273 which was very close to that of the ele¬
mentary level. The correlation between effect size in
problem-solving skills and grade level in computer pro¬
gramming mode was negative (r = -.005, p >. 005).
72

Table 9 Average Effect Size in Problem-Solving Skills
y Grade Level and Mode of Computer Application
Grade Level CAI Computer Programming
Total Mean
Elementary
Mean .057 .289 . 180
SD .471 .883 .725
SE of Mean . 077 . 136 .082
Number of ESs 37 42 79
t-value .73 2.12* 2.21*
P-value .469 .040 .030
Junior Hiah
Mean .047 .273 .23 6
SD .548 .601 .593
SE of Mean .207 .102 .091
Number of ESs 7 35 42
t-value .23 2.69* 2.58*
P-value .829 .011 . 014
Senior Hiah
Mean . 092 -.040 -.006
SD .386 .259 .294
SE of Mean .158 .063 .061
Number of ESs 6 17 23
t-value .58 -.64 -.10
P-value .585 .530 .925
* The null hypothesis which assumes that the mean effect size is zero, is rejected with the probability of Type I error being less than or equal to 0.05.
73
Effect Size bv Ability Level
As for most of the studies, this analysis compares
the effectiveness of CAI/computer programming in mathe¬
matics education on the basis of student ability clas¬
sified into low, middle, and high ability levels. The
effect sizes calculated from the studies, therefore,
were grouped into these three ability levels. In this
subsection, analysis will focus on the question of
whether application of CAI/computer programming to
mathematics instruction is more effective with specific
levels of student ability.
Referring to this question, as reported in Table 10,
both drill/practice and tutorial CAI programs were sig¬
nificantly more effective in improving low-ability stu¬
dents' achievement as compared with traditional class¬
room instruction. In CAI drill-and-practice, the mean
effect size in mathematics achievement for the low abil¬
ity group was 0.360. The average effect size of tu¬
torial CAI for the low ability level was 0.620. The
average effect size of the middle and high ability
levels were not significant at 0.05 level for any mode
of computer applications. This could be because of the
small number of effect sizes at each category. A cau¬
tion therefore should be taken in the interpretation of
the results. The effects of simulation/gaming CAI on
mathematics achievement is not included in this analysis
74

Table 10 Average Effect Size in Ability Level and Mode
Math Achievement by of Computer application
Ability d Level
& P Tutor Simu/ Gaming
Total CAI
Compu Progra
Total Mean
Low
Mean .360 . 620 . 026 .430 .221 .414
SD .645 .464 — . 606 .271 .589
SE of Mean . 079 .089 — . 062 .096 .058
Number of ESs 67 27 1 95 8 103
t-value 4.56* 6.95* — 6.92* 2.30 7.13*
P-value .000 . 000 — . 000 .055 . 000
Middle
Mean . 161 .203 . 170 . 112 . 149
SD .771 .122 . 678 .494 .606
SE of Mean .233 . 070 . 181 .175 .129
Number of ESs 11 3 — 14 8 22
t-value .69 2.88 .94 .64 1.15
P-value .504 .103 .366 .541 .262
Hiah
Mean .162 .183 .170 . 374 .257
SD .426 . 142 .331 .633 .473
SE of Mean . 190 . 082 .117 .259 .127
Number of ESs 5 3 — 8 6 14
t-value .85 2.24 1.45 1.45 2.03
P-value .443 . 154 .190 .208 . 063
* The null hypothesis which assumes that the mean effect size is zero, is rejected with the probability of Type I error being less than or equal to 0.05.
75

because of no effect size being available at both middle
and high ability levels.
The general trend shown in Table 10 was that as the
student ability goes from the low to high level, the
average effect sizes in mathematics achievement de¬
crease. This evidence was supported by the negative
Pearson correlation coefficient for student ability
level with effect size which was -0.137 (p > .05). The
negative correlation denotes an inverse relationship
between student ability level and effect size. Further,
because the correlation coefficient was close to zero,
it can be assumed that there is little inverse relation¬
ship between two variables.
Due to the limited number of studies in which stu¬
dents' problem-solving skills were tested on the basis
of their ability levels, the size of the effect sizes
computed from these studies was considerably small.
Consequently, the effects of individual mode of computer
applications on problem-solving skills were not covered
in this analysis. Instead, the effect sizes classified
by student ability level and by CAI and computer pro¬
gramming are given in Table 11. No average effect size
was significant at the three ability levels. This could
be because of the quite small number of effect sizes.
76
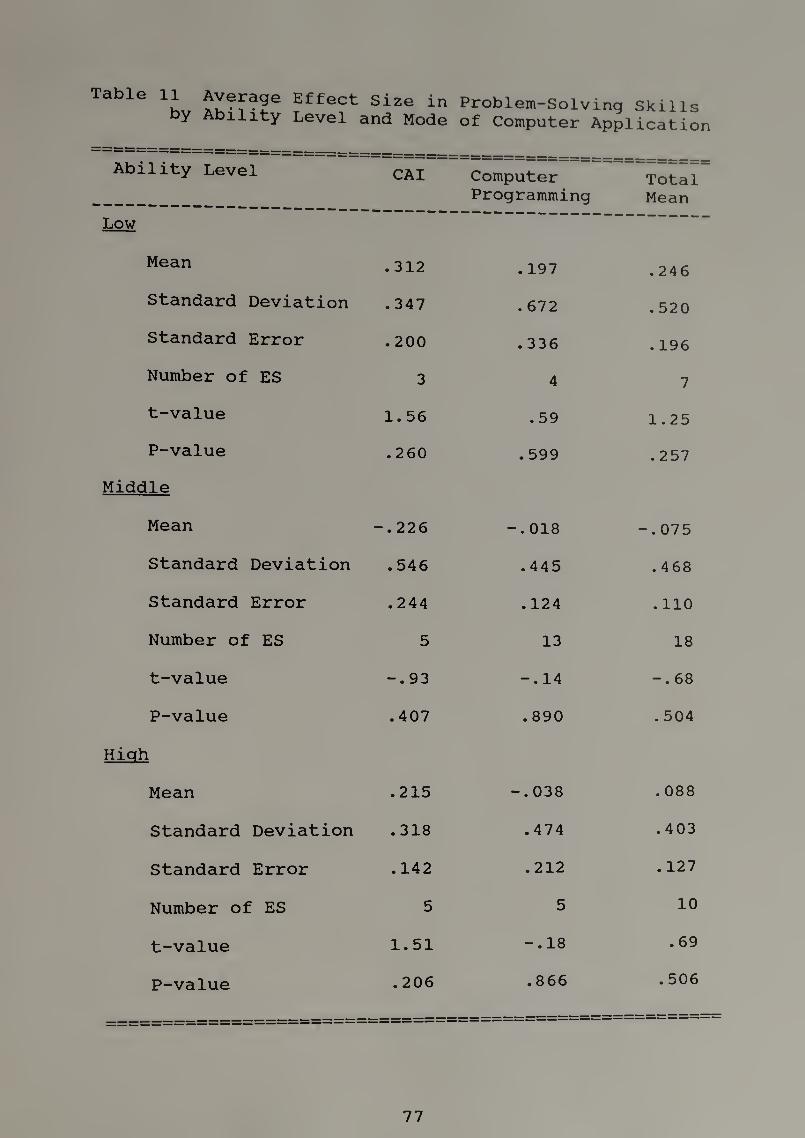
Table 11
by Average Effect Size in Problem-Solving Skills Ability Level and Mode of Computer Application
Ability Level CAI Computer Programming
Total Mean
Low
Mean .312 . 197 .246
Standard Deviation .347 .672 .520
Standard Error .200 .336 . 196
Number of ES 3 4 7
t-value 1.56 .59 1.25
P-value .260 .599 . 257
Middle
Mean -.226 -.018 -.075
Standard Deviation .546 .445 .468
Standard Error .244 . 124 . 110
Number of ES 5 13 18
t-value -.93 -.14 -.68
P-value .407 .890 .504
Hiah
Mean .215 -.038 . 088
Standard Deviation .318 .474 .403
Standard Error .142 .212 . 127
Number of ES 5 5 10
t-value 1.51 -.18 .69
P-value .206 .866 . 506
77
Effect Size by Socio-economic Status
Only 92 effect sizes out 243 in mathematics achieve¬
ment where the students' family socio-economic status
(SES) was identified. There were few cases for each
mode of CAI and computer programming in the case of
average effect size being measured separately for each
SES. Therefore, in this analysis, the effect sizes were
categorized by SES and CAI as well as computer program¬
ming as shown in Table 12.
The data indicate that in comparison with conven¬
tional instruction, CAI mathematics instruction was sig¬
nificantly more effective in enhancing mathematics
achievement for all three SES levels.
Among the three levels of SES, the middle class of
SES had the largest average effect size in mathematics
achievement, which was 0.354 and was very close to the
overall average effect size of this study (0.384). It
illustrates that a CAI student from a middle class
family, can be expected to outperform the average student
in a control group by approximately 0.35 standard devi¬
ations. To express in another way, for the middle class
of SES, the students of CAI group performed at the 64th
percentile on their mathematics achievement examin¬
ations, whereas the students who received only tradi¬
tional instruction performed at the 50th percentile on
the same examination. Slightly smaller than the middle
78
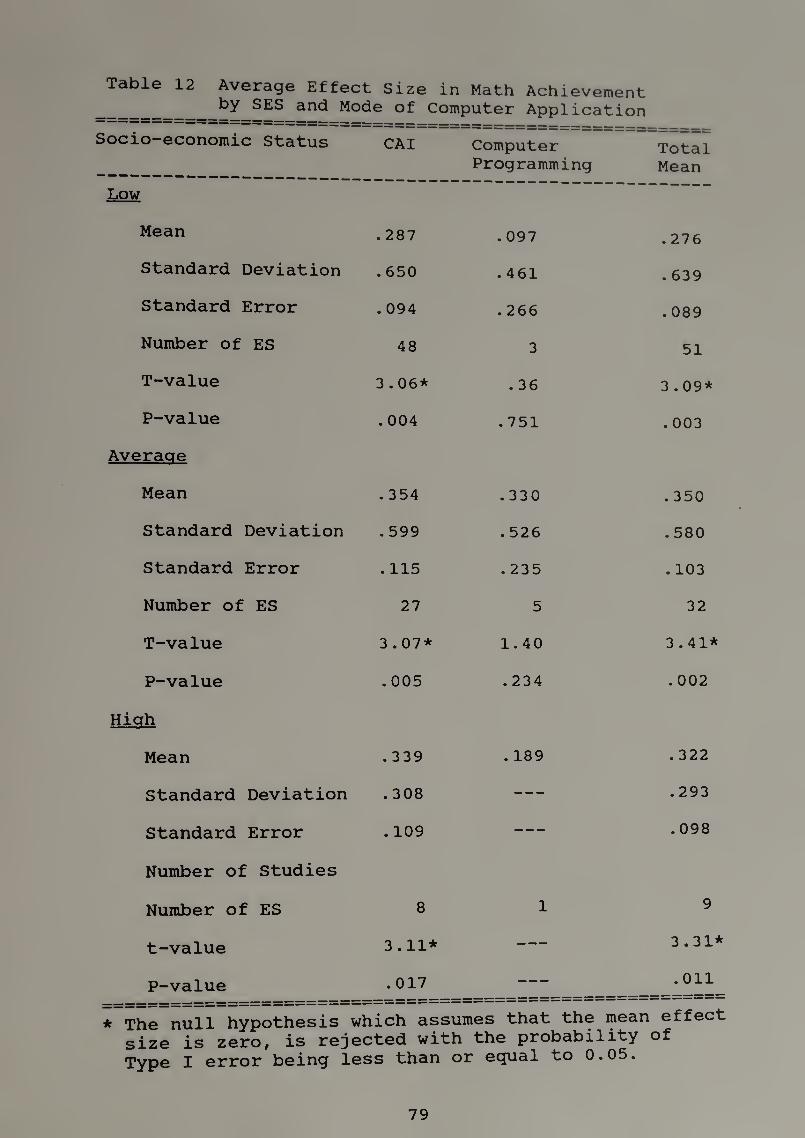
Table 12 Average Effect Size in Math Achievement
by SES and Mode of Computer Application
Socio-economic Status CAI Computer Programming
Total Mean
Low
Mean .287 . 097 .276
Standard Deviation .650 .461 . 639
Standard Error . 094 .2 66 .089
Number of ES 48 3 51
T-value 3.06* .36 3.09*
P-value . 004 .751 . 003
Averaae
Mean .354 .330 .350
Standard Deviation .599 . 526 .580
Standard Error . 115 .235 . 103
Number of ES 27 5 32
T-value 3.07* 1.40 3.41*
P-value .005 .234 .002
Hicrh
Mean .339 . 189 . 322
Standard Deviation .308 — .293
Standard Error . 109 — .098
Number of Studies
Number of ES 8 1 9
t-value 3.11* — 3.31*
P-value .017 — .011
* The null hypothesis which assumes that the mean effect
size is zero, is rejected with the probability of
Type I error being less than or equal to 0.05.
79

class, the average effect size of high level of SES was
0.339. The average effect sizes of low level of SES was
0.287.
Contrary to CAI, the average effect size in achieve¬
ment of computer programming was not significant at all
three levels of SES. The small number of effect sizes
at each category could be the factor to contribute to
this result. Therefore, a caution must be taken in the
interpretation of this result. The correlation between
SES and the effect sizes in mathematics achievement
was 0.47 (p > .05) which indicates that there was a
positive relationship between these two variables, but
it was not significant.
Effect size by Sex
The analysis in this subsection attempts to shed
some light on the issue of whether the effectiveness of
CAI/computer programming mathematics instruction varies
as a function of students' sex in terms of mathematics
achievement and problem-solving skills.
The data in Table 13 indicate that only the male
students' CAI drill/practice average effect size was
significant at 0.05 level. This signifies that mathe¬
matics instruction supported with CAI drill/practice was
significantly more effective in enhancing mathematics
achievement among boys than instruction using only
80

Table 13 Sex^nd Mf^eCt^SiZe in Math Achievement by Sex and Mode of Computer Application
Sex D & p Tutor Simu/ Gaming
Total CAI
Comp
Progra Total
Mean
Male
Mean .306 . 823 .309 .336 .025 .320
SD .416 .231 .833 .606 .771 .607
SE of Mean . 093 . 163 .223 . 101 .545 . 098
Number of ESs 20 2 14 36 2 38
t-value 3.29* 5.02 1.39 3.33* .05 3.25*
P-value . 004 . 125 . 188 .002 .971 . 002
Female
Mean -.055 1.575 . 118 .103 . 103
SD .602 .556 .494 .659 .659
SE of Mean . 135 .393 .132 . 110 .110
Number of ES 20 2 14 36 — 36
t-value -.41 4.01 .89 .94 .94
P-value .687 .156 .388 .355 .355
* The null hypothesis which assumes that the mean effect
size is zero, is rejected with the probability of
Type I error being less than or equal to 0.05
traditional method. The data did not manifest a basis
for drawing similar conclusions relative to achievement
among girls.
In addition, because of the small number of cases
for tutorial CAI and computer programming when average
effect size was calculated separately for males and
females, no conclusion can be drawn from the results,
81

even though both male and females students in tutorial
CAI yielded the highest average effect size. The need
to exercise caution in interpreting of results due to
the minimal number of available effect sizes is reiter¬
ated.
As in the case of the analysis of socio-economic
status, the cell sizes in problem-solving skills were
quite small when the data were analyzed by sex. Only
five studies and 46 concomitant effect size measures
distinguished study findings by sex of subject.
Similar to the analysis by ability level, due to
the small number of studies related to problem-solving
skills in which the sex of the students was identifi¬
able, there were quite few cases for each mode of com¬
puter applications when average effect size was calcu¬
lated separately for males and females. As a result,
this analysis was not included here. Instead, the
effect sizes by sex average across modes are given in
Table 14. A caution must be exercised in the interpre¬
tation of the results.
Table 14 Average Effect Size in Problem-Solving Skills by Sex for Computer Programming
Sex Mean SD SE of Mean
Number of ESs
t-value P-value
Male . 178 .570 .233 6 • 'j
'j
.478
Female .333 .403 . 142 8 2.34 .052
82

Specific Effect Size by Treatment Factors
The treatment variables referred to the type and
content of treatment in which CAI/computer programming
was used in the experimental studies. In this section,
the effects of ten variables of treatment factors are
analyzed. Eight of them dealt with the type of treat¬
ment. They were: l) the role of computer applications,
2) location of computers, 3) duration of treatment (in
weeks and in minutes), 4) the type of computer interac¬
tion, 5) CAI program authorship, 6) CAI program's in¬
tended audience, 7) computer programming language, and
8) the size of subjects per study. The other two
factors related to the treatment were the general mathe¬
matics content area and specific mathematics subject
area.
Effect Size by Role of the Computer Application
Basically speaking, application of computers to
mathematics instruction was either as a supplement to
classroom instruction or as a substitute for it. The
analysis here focuses on which way of computer appli¬
cation was more effective in improving mathematics
achievement and/or problem-solving skills.
The data in Table 15 suggest that tutorial and
simulation/gaming CAI were more effective in a supple-
83

mental mode as compared with the use of conventional
instruction only. Conversely, computer programming as
well as drill/practice CAI was more effective as a sub¬
stitute for classroom instruction. The studies in which
mathematics instruction was supplemented with tutorial
CAI had the highest effect size (0.581).
Table 15 Average Effect Size in Math Achievement by
Role and Mode of Computer Application
Role D & P Tutor Simula/ Gaming
Total CAI
Compu Progra
Total Mean
Substitute
Mean .573 .298 .179 .289 .401 .312
SD . 371 .200 .729 .611 .334 .565
SE of Mean . 124 . 089 . 149 . 097 . 106 . 080
Number of ESs 9 5 24 40** 10 50
t-value 4.64* 3.33* 1.20 3.00* 3.79* 3.90*
P-value .002 . 029 .241 . 005 . 004 . 000
Supplemental
Mean .333 .581 .390 .406 .340 .397
SD . 662 .428 . 650 . 613 .568 . 606
SE of Mean . 064 . 063 . 153 . 047 .114 .043
Number of ESs , 107 46 18 171 25 196
t-value 5.21* 9.21* 2.54* 8.66* 2.99* 9.18*
P-value . 000 . 000 . 021 . 000 . 006 . 000
* The null hypothesis, assuming that the mean effect
size is zero, is rejected with the probability of
Type 1 error being less than or equal to .05. ** Two effect sizes derived from the studies where two
or more different modes of CAI were used in the
treatment group.
84

Table 16 summarizes the effects of CAI/computer
programming on student problem-solving skills. it indi¬
cates that both CAI and computer programming were more
effective in developing student problem-solving skills
when compared with the conventional method. However,
the analogous results were not found in the category of
computers used as substitute for classroom instruction.
Table 16 Average Effect Size in Problem-Solving Skills by Role and Mode of Computer Application
Role D & P Tutor Simu/
Gaming CAI
P.S. Total
CAI Comp Prog
Total Mean
Substitute l
Mean . 092 -.829 . 161 -.017 .076 . 047
SD .386 .782 .359 .552 . 622 .598
SE of Mean . 158 .452 .113 . 127 .097 .077
Number of ESs — 6 3 10 19 41 60
t-value .58 -1.84 1.42 -.13 .78 . 60
P-value .585 .208 .189 .894 .438 .548
SuoDlemental
Mean -.098 .250 .201 . 106 .428 .300
SD .499 — . 325 .403 .746 . 649
SE of Mean . 158 — . 073 . 072 . 109 .073
Number of ESs 10 1 — 20 31 47 78
t-value -.62 2.77* 1.47 3.93* 4.08*
P-value .551 . 012 . 152 . 000 . 000
* The null hypothesis, assuming that the mean effect
size is zero, is rejected with the probability of
Type 1 error being less than or equal to .05.
85

Effect Size by. Location of Computers
Due to the limited number of effect sizes in
achievement identifiable for this variable, no attempt
was made to classify the effect sizes by location of
computers or by each mode of computer application.
Instead, the effect sizes by the location of computers
averaged across modes are given in Table 17.
The results in Table 17 illustrate that no matter
where computers were located— either in the laboratory
or in the classroom— CAI/computer programming in mathe-
matics instruction was more effective in enhancing stu¬
dent mathematics achievement as compared with conven¬
tional instruction. However, the average effect size of
the studies where computers/terminals were located in
the classroom almost doubled that of studies where com¬
puters/terminals were installed in the laboratory. They
were 0.688 and 0.377, respectively.
Table 17 Average Effect size in Math Achievement by Location of Computers
Location Mean SD SE of
Mean
Number
of ES
t-value P-value
Laboratory . 377 . 602 . 066 82 5.67* . 000
Classroom . 688 . 442 . 088 25 7.78* . 000
* The null hypothesis, assuming that the mean effect
size is zero, is rejected with the probability of
Type 1 error being less than or equal to .05.
86

As shown in Table 18, some differences in problem
solving skills appeared as a function of location of
computers, but they were not significant.
Table 18 Average Effect Size in Problem-Solving by Location of Computers
Location Mean SD SE of
Mean Number t-value of ES
P-value
Laboratory . 024 .466 . 087 29 .28 .783
Classroom -.796 1.018 .360 8 -2.21 . 063
Effect Size1by Duration of Treatment
Does the effectiveness of CAI/computer programming
in mathematics instruction become different due to
change in length of treatment in terms of mathematics
achievement or problem-solving skills?
The length of treatment for the studies located
ranged from two to 72 weeks and was classified into
three categories as shown in Table 19. Data pertinent
to the above question is reported in Tables 19, 20, and
21. Table 19 reports the average effect size in mathe¬
matics achievement for each mode of computer application
according to the length of treatment measured in weeks.
In drill/practice CAI, studies with length of treatment
spanning from 19 to 36 weeks had the lowest average ef¬
fect size, which was 0.245. In tutorial CAI, all three
87
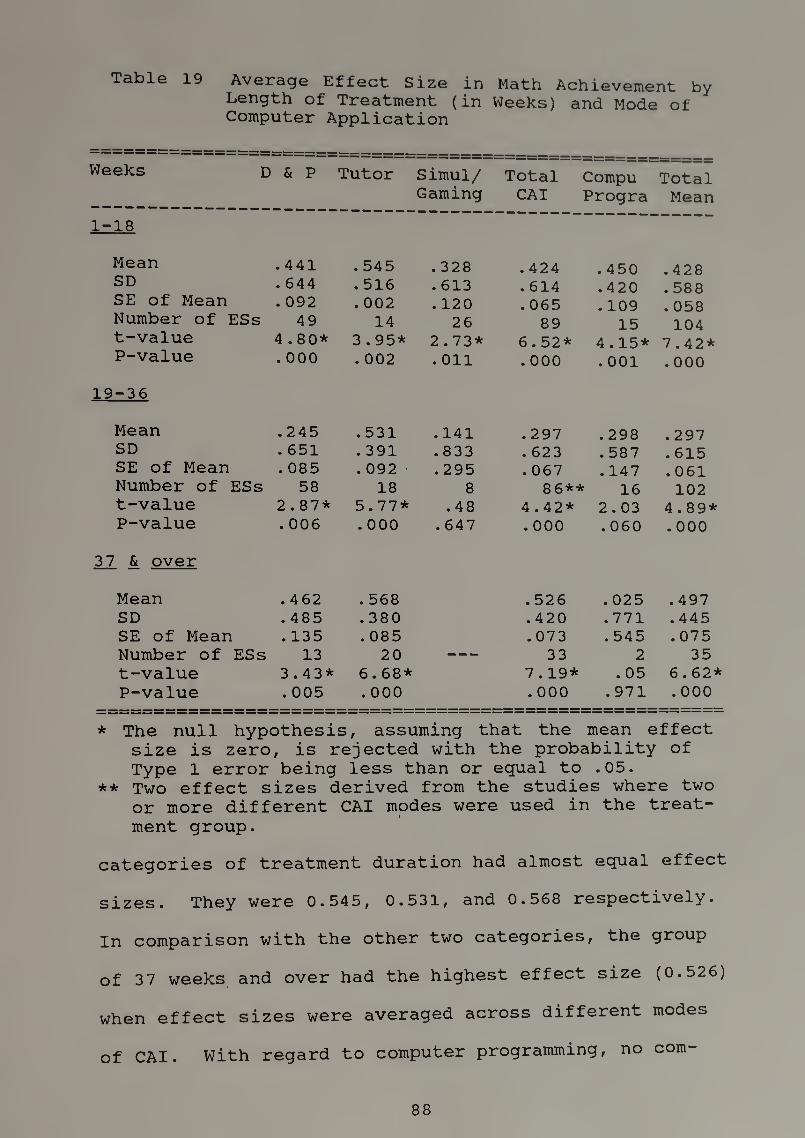
Table 19 Average Effect Size in Math Achievement by Length of Treatment (in Weeks) and Mode of Computer Application
Weeks d & P Tutor Simul/ Gaming
Total CAI
Compu Progra
Total Mean
1-18
Mean . 441 . 545 .328 .424 .450 . 428 SD . 644 . 516 . 613 . 614 .420 .588 SE of Mean . 092 . 002 . 120 . 065 . 109 . 058 Number of ESs 49 14 26 89 15 104 t-value 4.80* 3.95* 2.73* 6.52* 4.15* 7.42* P-value . 000 . 002 .011 . 000 . 001 .000
19-36
Mean .245 .531 . 141 .297 . 298 .297 SD .651 . 391 .833 . 623 .587 .615 SE of Mean . 085 .092 ■ .295 .067 . 147 .061 Number of ESs 58 18 8 86** 16 102 t-value 2.87* 5.77* .48 4.42* 2.03 4.89* P-value . 006 .000 . 647 . 000 . 060 . 000
37 & over
Mean .462 .568 .526 . 025 .497 SD .485 .380 .420 .771 .445 SE of Mean . 135 . 085 . 073 . 545 .075 Number of ESs 13 20 — 33 2 35 t-value 3.43* 6.68* 7.19* .05 6.62* P-value .005 .000 . 000 .971 .000
* The null hypothesis, assuming that the mean effect size is zero, is rejected with the probability of Type 1 error being less than or equal to .05.
** Two effect sizes derived from the studies where two or more different CAI modes were used in the treat¬ ment group.
categories of treatment duration had almost equal effect
sizes. They were 0.545, 0.531, and 0.568 respectively.
In comparison with the other two categories, the group
of 37 weeks and over had the highest effect size (0.526)
when effect sizes were averaged across different modes
of CAI. With regard to computer programming, no com-
88

parison was made due to the quite small number of effect
sizes in the third category.
In the analysis of effects on mathematics achieve¬
ment of total minutes spent in the treatment group, as
shown in Table 20, the total mean effect sizes of CAI
gradually increase as the length of treatment increases.
Thus, findings indicate that CAI mathematics instruction
was significantly more effective than traditional class¬
room instruction with respect to large amount of minutes
spent in studying.
Table 2 0 Average Effect Size in Math Achievement by Length of Treatment (in minutes)
Minutes Mean SD SE of Mean
Number of ESs
t-value P-value
1-999 .320 . 684 . 074 85 4.32* .000
1000-1999 .456 .303 . 045 46 10.19* .000
2000-2999 .547 .470 . 094 25 5.81* .000
3000 & over . 015 .571 .147 15 .10 .920
* The null hypothesis, assuming that the mean effect size is zero, is rejected with the probability of Type 1 error being less than or equal to .05.
With regard to the effectiveness of individual
mode of CAI and computer programming in mathematics
achievement, due to the number of effect sizes in some
cells being either very small or nil when effect sizes
were grouped separately for each mode of computer appli¬
cation, this analysis was not included.
89
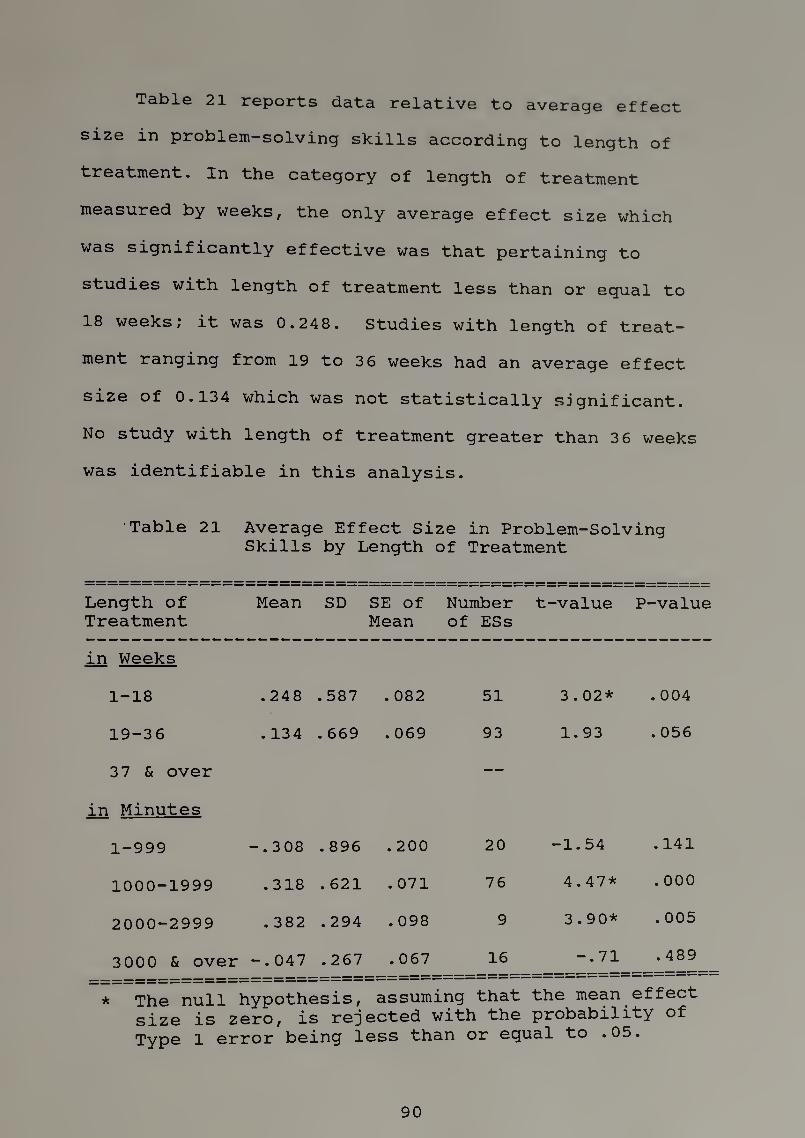
^a^l® 21 reports data relative to average effect
size in problem-solving skills according to length of
treatment. In the category of length of treatment
measured by weeks, the only average effect size which
was significantly effective was that pertaining to
studies with length of treatment less than or equal to
18 weeks; it was 0.248. Studies with length of treat-
flisnt ranging from 19 to 3 6 weeks had an average effect
size of 0.134 which was not statistically significant.
No study with length of treatment greater than 3 6 weeks
was identifiable in this analysis.
Table 21 Average Effect Size in Problem-Solving Skills by Length of Treatment
Length of Treatment
Mean SD SE Of Mean
Number of ESs
t-value P-value
in Weeks
1-18 .248 .587 . 082 51 3.02* . 004
19-36 . 134 . 669 . 069 93 1.93 .056
37 & over —
in Minutes
1-999 -.308 . 896 .200 20 -1.54 .141
1000-1999 .318 . 621 .071 76 4.47* .000
2000-2999 . 382 .294 .098 9 3.90* . 005
3000 & over -.047 .267 .067 16 -.71 .489
* The null hypothesis, assuming that the mean effect size is zero, is rejected with the probability of Type l error being less than or equal to .05.
90

When length of treatment was measured by total
amount of minutes, the average effect size of studies
with length of 'treatment between 1000 to 1999 minutes
and that of studies with length of treatment between
2000 to 2999 minutes were both significant. They were
0.318 and 0.382, respectively. Average effect sizes of
the other two groups of studies were not significant.
Effect Size by; Type of Computer Interacts nn
Table 22 gives an account of the average effect
size in mathematics achievement according to the type of
computer interaction. The data indicate that for drill-
and-practice and tutorial CAI, both interactive use of
microcomputers and terminals access to a mainframe com¬
puter produced effective results in mathematics achieve¬
ment. Use of microcomputers in tutorial CAI yielded the
highest average effect size, which was 0.608. In com¬
puter programming, average effect size of microcomputers
was 0.520, which was second highest. However, average
effect size for mainframe computer programming was not
significant.
The effects of the type of computer interaction on
problem-solving skills were excluded from the analysis,
because when the effect sizes were broken down by this
variable, some differences appear, but they were not
significant, as shown in Table 23.
91

Table 22 Average Effect Size in Math Achievement by Type of Computer Interaction and Mode of Computer Application
Type of Interaction
D & p Tutor Simul/ Gaming
Total CAI
Compu Progra
Total Mean
Mainframe
Mean .367 .455 . 383 .203 .361
SD . 658 .394 . 618 .585 . 615
SE of Mean . 069 . 088 . 059 . 146 . 055
Number of ESs 91 20 — 111 16 127
t-value 5.33* 5.16* 6.54* 1.39 6.61*
P-value . 000 . 000 . 000 . 186 . 000
Microcomputer
Mean .279 . 608 .284 .391 .520 .411
SD . 576 .424 . 662 . 574 .413 .553
SE of Mean . 109 . 075 . 114 . 059 . 100 . 052
Number of ESs 28 32 34 96** 17 113
t-value 2.57* 8.11* 2.50* 6.68* 5.19* 7.89*
P-value . 016 . 000 . 017 . 000 . 000 . 000
* The null hypothesis, assuming that the mean effect size is zero, is rejected with the probability of Type 1 error being less than or equal to .05.
** Two effect sizes derived from the studies where tv or more different modes of CAI were used in the treatment group.
Table 23 Average Effect Skills by Type
Size in Problem-Solving of Computer Interaction
Type of Interaction
Mean SD SE of Number t- Mean of ESs
•value P -value
Mainframe .175 . 454 . 087 27 2.00 . 057
Microcomputer .121 . 667 . 092 52 1.30 .199
92

Effect Size by CAT Program Authorship
The purpose of this variable is to investigate the
effects of CAI program authorship on student mathematics
achievement. For this purpose, effect sizes derived
from this variable were divided into three categories:
commercial, experimenter-/teacher-designed, and both
combined.
As the data in Table 24 indicate, in general for
CAI, especially for both drill-and-practice and tutorial
CAI, the CAI programs which were developed by experi¬
menters or teachers had higher average effect sizes than
those programs which were commercially developed.
Effect Size by CAI Program's Intended Audience
Whether the application of CAI programs made a
significant difference in mathematics achievement when
the results were broken down by the variable of CAI
program's intended audience. According to Table 25,
in tutorial CAI, the average effect sizes of both gen¬
eral audience and specific audience were significant.
Further, the studies where CAI programs were designed
for a specific audience had the highest effect size of
0.580. In drill-and-practice CAI, the average effect
size of general audience was significant, but that of
specific audience was not significant.
93

Table 24 Average Effect Size in Math Achievement by Authorship and Mode of Computer Application
Authorship D & P Tutor Simula/ Gaming
Total CAI
1. Commercial
Mean . 341 . 387 .294 .336
SD . 647 . 152 .599 . 606
SE of Mean . 063 . 044 . 120 . 051
Number of ESs 105 12 25 144**
t-value 5.40* 8.80* 2.45* 6.65*
P-value . 000 . 000 . 022 . 000
2. Exoerimenter/Teacher
Mean .419 .618 .258 .481
SD . 581 .522 .854 .621
SE of Mean . 155 . 114 .285 . 094
Number of ESs 14 21 9 44
t-value 2.70* 5.43* .90 5.14*
P-value . 018 . 000 .397 . 000
3. Both 1 & 2
Mean . 183 . 575 .556
SD — .386 .386
SE of Mean — . 089 .086
Number of ESs 1 19 — 20
t-value — 6.49* 6.44*
P-value — . 000 . 000
* The null hypothesis, assuming that the mean effect size is zero, is rejected with the probability of Type 1 error being less than or equal to .05.
94

Table 25 Average Effect Size Intended Audience and Mode
in Math Achievement of Computer Applicati
by on
Intended Audience
D & p Tutor Simula/ Gaming
Total Mean
Genera]
Mean .365 .287 .327 .353
SD .722 . 172 . 646 . 676
SE of Mean . 082 . 065 . 162 . 067
Number of ESs 78 7 16 103*
t-value 4.47* 4.40* 2.03 5.30*
P-value . 000 . 005 . 061 . 000
Specific
Mean .446 .580 . 539
SD .753 .397 .519
SE of Mean .266 . 094 . 102
Number of ESs 8 18 — 26
t-value 1.68 6.19* 5.29*
P-value .138 . 000 . 000
* The null hypothesis, assuming that the mean effect size is zero, is rejected with the probability of Type I error being less than or equal to .05.
** Two effect sizes derived from the studies where two or more different CAI modes were used in the treat¬ ment group.
In general, the use of CAI in mathematics instruc¬
tion was more effective in improving achievement for
both general and specific students as compared with the
use of traditional classroom instruction only.
95

Effect Size by Computer Programming Language
The data in Table 26 summarize the effectiveness
of computer languages in mathematics achievement. It
indicates that both the use of Logo and BASIC produced
more effectiveness in mathematics achievement than use
of traditional methods only. There was only a minor
ff^^snce of effect sizes between these two computer
languages.
As for effects of computer languages on problem¬
solving skills, they are shown in Table 27. The results
indicate a fairly substantial effect for Logo in enhanc¬
ing problem-solving skills as compared with BASIC lan¬
guage. The average effect size of BASIC was not statis¬
tically significant.
Table 2 6 Average Effect Size in Math Achievement by Computer Programming Language
Language Mean SD SE of Mean
Number of ESs
T-value P-value
Logo .409 .440 . 110 16 3.72* . 002
BASIC .479 .533 . 142 14 3.37* . 005
Others -.151 .399 . 178 5 -.85 .445
* The null hypothesis, assuming that the mean effect size is zero, is rejected with the probability of Type 1 error being less than or equal to .05.
96

Table 27 Average Effect size in Problem-Solving kills by Computer Programming Language
Language Mean SD SE of Mean
Number t-value P-value of ESs
Logo
BASIC
Others
.338
. 192
-.067
852
490
264
. 116
. 094
. 068
54
27
15
2.92*
2.04
-.99
. 005
. 052
.341
The null hypothesis, assuming that the mean effect size is zero, is rejected with the probability of Type 1 error being less than or equal to 05
Effect Size by Size of Subjects per Study
As shown in Table 28, the number of subjects in the
treatment group generally appears to be unrelated to
effect sizes. The highest average effect size in mathe¬
matics achievement was 0.518 resulted from studies in
which the number of subjects was between 201 and 400.
The studies with the subjects of 101 - 200 had typical
average effect size of 0.377 which was only 0.007 stand¬
ard deviation smaller than the grand mean effect size in
mathematics achievement. Studies with students of more
than 400 in the treatment group produced the smallest
average effect size, which was 0.237.
The correlation coefficient between the size of
subjects and the effect sizes was -.0316 (p = 0.626).
The negative correlation for the number of subjects with
the effect sizes indicates that generally, as studies
97

Table 28 Average Effect Size in Math Achievement by Size of Subjects
Size Mean SD SE of Mean
Number of ESs
t-value P-value
1-50 .361 . 657 . 056 137 6.43* . 000
51-100 .406 .483 . 063 58 6.39* .000
101-200 . 377 .475 . 123 15 3.07* . 008
201-400 .518 .512 . 128 16 4.05* .001
over 400 .237 . 151 . 039 15 6.09* . 000
* The null hypothesis, assuming that the mean effect size is zero, is rejected with the probability of Type 1 error being less than or equal to .05.
involved larger numbers of students, the effect sizes
decreased. However, this correlation was not signifi¬
cant because the correlation coefficient was small.
Effect Size by General Treatment Area
A further analysis is done here to determine if
there were differences in effects among types of math
skills and among the modes of computer applications in
mathematics instruction. In this analysis, mathematics
skills were divided into lower level vs. higher level
skills: computation vs. concepts/application. The effect
sizes from studies in which area of emphasis could not
98

be identified as either computation or concepts/applica¬
tion were designated as the third category: combination.
Data summarized in Table 29 suggest that CAI/com-
puter programming was about equally effective with all
three categories of math skills. The highest average
effect size among them was that of computation, with the
average effect size of 0.428. Similar achievement
gains were evidenced in concepts/application and combi¬
nation. Their average effect sizes were 0.369 and 0.349
respectively.
In the category of mathematics computation, only
the effects of simulation/gaming and computer program¬
ming on achievement were not significant. This was
P^-"°ka.bly due to the guite small number of effect sizes
and because the skills aren't applicable. In the cat¬
egory of mathematics concepts/application, the average
effect size of drill/practice CAI and that of simula¬
tion/gaming CAI were not significant. As for the cat¬
egory of combination, the data indicate that both the
use of simulation/gaming CAI and computer programming
were not significantly effective in enhancing mathe¬
matics achievement in comparison with the use of con¬
ventional methods only. Studies which emphasized
improvement of mathematics concepts/application skills
by CAI had the highest effect size, which was 0.633.
99

Table 29 Average Effect Size in Math Achievement by Math Content and Mode of Computer Application
Content d & P Tutor Simula/ Gaming
Total CAI
Compu Progra
Total Mean
Computation
Mean .448 .417 . 609 .445 -.038 . 428 SD .700 . 227 .824 .619 .460 . 619 SE of Mean . 090 . 052 .583 . 068 .265 . 067 Number of ESs 61 19 2 82 3 85 t-value 5.00* 8.01* 1.04 6.50* -.14 6.37* P-value . 000 . 000 .486 . 000 .900 . 000
Concept/Application
Mean . 193 . 633 .240 .315 . 562 .369 SD .492 .476 . 664 .590 . 514 .580 SE of Mean .102 . 119 . 121 .071 . 118 . 062 Number of ESs 23 16 30 69 19 88 t-value 1.88 5.32* 1.97 4.44* 4.77* 5.96* P-value . 073 . 000 . 058 .000 . 000 .000
Combination
Mean .280 .618 .632 .394 . 148 .349 SD .586 .498 . 685 .566 .383 .543 SE of Mean . 098 . 121 .484 . 075 . 106 . 065 Number of ESs 36 17 2 57** 13 70 t-value 2.86* 5.12* 1.30 5.26* 1.40 5.37* P-value .007 . 000 .417 . 000 . 188 . 000
* The null hypothesis, assuming that the mean effect size is zero, is rejected with the probability of Type 1 error being less than or equal to .05.
** Two effect sizes derived from the studies where two or more different CAI modes were used in the treat¬ ment group.
Effect size by Specific Subject Area
This variable was used in an attempt to answer the
question of whether the application of CAI/computer pro¬
gramming in mathematics instruction is more effective
with specific types of mathematics content.
100

In answering this question, effect sizes computed
from the studies were classified into areas of arithme¬
tic, algebra, and geometry. The fourth category con¬
sisted of studies where no specific subject area was
identifiable.
Again, because the number of effect sizes in some
cells was quite small or nil when the effect sizes were
broken down by each mode of computer applications and by
the specific subject areas, no analysis about effects of
individual CAI modes will be done here. Instead, the
analysis will focus on overall effects of CAI and com¬
puter programming in mathematics achievement. As shown
in Table 30, in CAI,the average effect sizes of algebra,
arithmetic, and geometry were 1.056, 0.433, and 0.278,
respectively. The results suggest that the use of CAI
in algebra or arithmetic studying was more effective
than geometry learning. CAI mathematics programs can be
expected to raise an average treated student from the
50th to the 86th percentile in algebra, from 50th to the
67th percentile in arithmetic, and from the 50th to the
61st percentile in geometry.
In computer programming, the highest average effect
size pertained to geometry (ES = 0.68). However, in the
interpretation of this finding, caution must be exer¬
cised because of the quite small number of effect sizes
in the category of arithmetic.
101
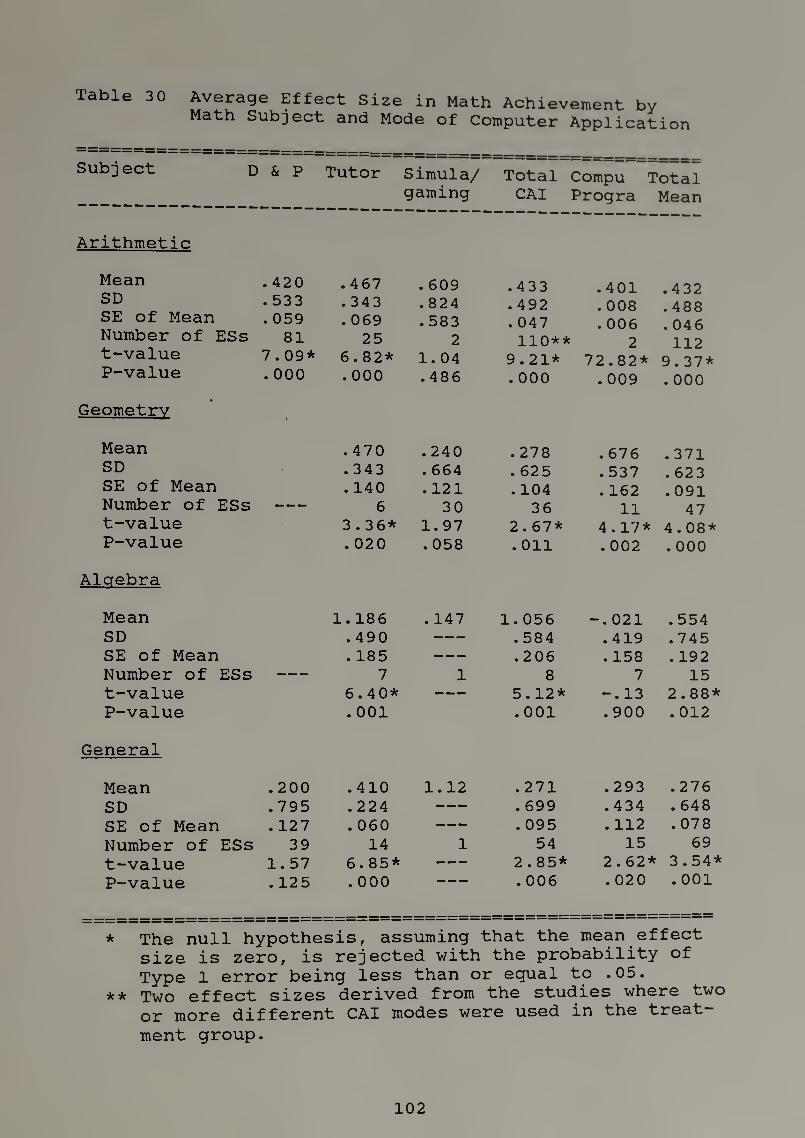
Table 30 Average Effect Size in Math Achievement by Math Subject and Mode of Computer Application
Subject D & P Tutor Simula/ gaming
Total CAI
Compu Progra
Total Mean
Arithmetic
Mean . 420 .467 . 609 .433 .401 .432 SD .533 .343 .824 .492 . 008 .488 SE of Mean . 059 . 069 .583 . 047 . 006 . 046 Number of ESs 81 25 2 110** 2 112 t-value 7.09* 6.82* 1.04 9.21* 72.82* 9.37* P-value . 000 .000 .486 . 000 . 009 .000
Geometry
Mean .470 .240 .278 .676 .371 SD .343 . 664 . 625 .537 .623 SE of Mean . 140 . 121 . 104 . 162 .091 Number of ESs — 6 30 36 11 47 t-value 3.36* 1.97 2.67* 4.17* 4.08* P-value . 020 . 058 . Oil . 002 .000
Alcrebra
Mean 1.186 . 147 1.056 -.021 .554 SD .490 — . 584 .419 .745 SE of Mean . 185 — .206 . 158 . 192 Number of ESs — 7 1 8 7 15 t-value 6.40* — 5.12* -.13 2.88* P-value . 001 .001 .900 . 012
General
Mean .200 .410 1.12 .271 .293 .276
SD .795 .224 — . 699 .434 .648
SE of Mean . 127 . 060 — . 095 . 112 . 078
Number of ESs 39 14 1 54 15 69
t-value 1.57 6.85* — 2.85* 2.62* 3.54’
P-value . 125 . 000 . 006 . 020 . 001
* The null hypothesis, assuming that the mean effect size is zero, is rejected with the probability of Type 1 error being less than or equal to .05.
** Two effect sizes derived from the studies where two or more different CAI modes were used in the treat¬
ment group.
102

Specific Effects by Design Variables
This category refers to research design variables
which were used to measure effects of different charac¬
teristics of the research design on study outcomes.
For this purpose, five independent variables describing
methodological characteristics of study design were
chosen to assess the dependent variables. They were:
1) type of test used to evaluate the instructional out¬
comes, 2) assignment of subjects, 3) control of histori¬
cal effect, 4) control of instructor effect, and 5) con¬
trol of time-on-task.
Effect Size by Type of Test
Basically, there were two categories of tests used
in the studies: standardized/commercial tests and ex-
perimenter-/teacher-developed tests. Data in Table 31
report effects of type of instrument used to assess
mathematics achievement. In the category of standard¬
ized tests, every average effect size of computer appli¬
cations except computer programming was statistically
significant. Similarly, in the category of experi-
menter-/teacher-designed tests, only the average effect
size of simulation/gaming CAI was not significant. In
computer programming, average effect size of experi-
menter-/teacher-developed tests (0.498) was much higher
than that of standardized tests (0.194). However, in
103

CAI, as a whole, average effect sizes of two types of
tests were almost identical. The difference between
them was just 0.004.
Generally, studies using standardized tests to
assess student mathematics achievement tended to have
slightly lower average effect sizes.
Table 31 Average Effect Size in Math Achievement by Type of Test and Mode of Computer Application
Type of Test D & P Tutor Simu/ Gaming
Total CAI
Compu Prog
Total Mean
Standardized
Mean .357 .518 .464 .408 . 194 .383
SD . 663 . 363 . 329 . 576 .430 .564
SE of Mean . 066 .055 . 110 . 046 . 094 . 042
Number of ESs 101 44 9 156** 21 177
t-value 5.41* 9.48* 4.24* 8.86* 2.07 9.03*
P-value . 000 .000 . 003 . 000 . 052 . 000
Experimenter/Teacher
Mean .366 . 688 .219 .404 .498 .426
SD .532 .459 .742 . 640 .543 . 616
SE of Mean . 148 . 108 .148 . 085 . 132 .072
Number of ESs 13 18 25 56 17 73
t-value 2.48* 6.35* 1.48 4.73* 3.78* 5.91*
P-value . 029 . 000 . 152 . 000 . 002 . 000
* The null hypothesis assuming that the mean effect size is zero is rejected with the probability of Type I error is less than or equal to .05.
** Two effect sizes derived from the study where two more CAI modes were used in the treatment group.
104

Table 32 summarizes effects of two types of tests on
problem-solving skills, it indicates that average effect
size of experimenter-/teacher-developed tests relative
to computer programming was the only one which was sig¬
nificant. On the whole, studies with outcomes being
measured by experimenter-/teacher-developed tests had a
higher average effect size in problem-solving skills.
Table 32 Average Effect Size in Problem-Solving Skills by Type of Test and Mode of Computer Application
Type of Test CAI Computer Programming
Total Mean
Standardized
Mean -.005 .204 .129
Standard Deviation .434 . 568 . 529
Standard Error of Mean . 102 . 100 .075
Number of Effect Sizes 18 32 50
t-value -.05 2.03 1.72
P-value .961 .051 . 091
ExDerimenter-/Teacher-desicmed
Mean . 096 .269 .209
Standard Deviation .483 .763 . 681
Standard Error of Mean . 085 . 099 . 071
Number of Effect Sizes 32 60 92
t-value 1.12 2.73* 2.94*
P-value .270 . 008 .004
* The null hypothesis assuming that the mean effect size is zero is rejected with the probability of Type I error is less than or equal to .05.
105

Effect Size by Assignment of Subjects
In analyzing the influence of this variable on
achievement and problem-solving skills, studies were
categorized on the basis of whether subjects were
randomly or not randomly assigned to treatment or con¬
trol group. Table 33 shows that about two-thirds of
sizes in mathematics achievement were derived
from studies where subjects were not randomly assigned
to treatment or control groups.
Data in Table 33 indicate that in CAI drill-and-
practice, studies with subjects being randomly assigned
had lower average effect sizes as compared with studies
using non-random assignment. Their average effect sizes
were 0.364 and 0.299 respectively. On the contrary,
in tutorial CAI, studies with random assignment had a
higher average effect size (0.747) than studies with
non-random assignment had (0.508). It is worth noting
that although studies with non-random assignment in
simulation/gaming CAI had the highest average effect
size (0.818), it is impossible to reach a conclusion
from this result due to the quite small number of effect
sizes in this cell. To take various different modes of
CAI as a whole, studies with subjects not being randomly
assigned had a higher average effect size (0.418) than
those studies the subjects being randomly assigned
106

program- (0.328). Similar to CAI, studies in computer
ming using non-random assignment had average effect size
much higher than that of studies with random assignment.
They were 0.412 and 0.172 respectively.
Table 33 Average Effect Size in Math Achievement by Assignment of Subjects and Mode of Computer Application
Assignment D & p Tutor
Random
Mean .299 .747
SD .345 .554
SE of Mean . 065 .185
Number of ESs 28 9
t-value 4.59* 4.04*
P-value . 000 . 004
Non-random
Mean .364 .508
SD .701 .376
SE of Mean . 073 . 057 i
Number of ESs 92 43
t-value 4.97* 8.86*
P-value . 000 . 000
Simu/ Gaming
Total CAI
Compu Progra
Total Mean
.233 .328 . 172 .312
.654 .545 .587 .547
.118 . 065 .207 . 062
31 70** 8 78
1.98 5.04* .83 5.03*
. 057 . 000 .435 . 000
.818 .418 .412 .417
.583 . 619 .480 .597
.336 . 053 . 092 . 046
3 138 27 165
2.43 7.94* 4.45* 8.98*
. 135 . 000 . 000 . 000
* The null hypothesis assuming that the mean effect size is zero is rejected with the probability of Type I error is less than or equal to .05.
** Two effect sizes were computed from the study where two more different CAI modes were used in the treat¬ ment group.
107
Generally speaking, the average effect size in
achievement of CAI/computer programming studies with
non-random assignment was higher than that of studies
with random assignment. The average effect size of the
former studies was 0.417 and that of the latter studies
was 0.312.
As indicated in Table 34, the only average effect
size in problem-solving skills which was significant at
0*05 level was that of studies with random assignment
relative to computer programming. As a result, overall
effect size in problem-solving skills of studies with
random assignment (0.229) was much higher than that of
studies with non-random assignment (0.038).
Effect Sizes by Historical Effect
As shown in Table 35, mean effect size of studies
where subjects in treatment and control groups were
taught concurrently was statistically significant,
whereas average effect size was not significant for
studies where subjects in two groups were not taught at
the same time. However, caution must be taken in inter¬
pretation of results. When effect sizes in mathematics
achievement were broken down by this variable, only
five out of 231 effect sizes pertained to studies where
subjects of treatment and control groups were not taught
108

Table 34 Average Effect Size in Problem-Solving Skills by Assignment of Subjects and
Assignment CAI Computer Programming
Total Mean
Random
Mean . 101 .289 .229
Standard Deviation . 476 .778 .700
Standard Error of Mean . 083 . 092 . 069
Number of Effect Sizes 33 71 104
t-value 1.21 3.13* 3.34*
P-value .234 . 003 .001
Non-random
Mean -.020 . 077 . 038
Standard Deviation .442 .429 .432
Standard Error of Mean . 107 .086 . 067
Number of Effect Sizes 17 25 42
t-value -.19 .89 .56
P-value .854 .380 .576
* The null hypothesis assuming that the mean effect size is zero is rejected with the probability of Type I error is less than or equal to .05.
Table 35 Average Effect Size by Historical Effect
in Math Achievement
Historical Mean SD Effect
SE of Number t-value Mean of ESs
P-value
Concurrently .362 .582 .039 226 9.36* . 000
Not concur. .601 .813 .364 5 1.65 .174
* The null hypothesis assuming that the mean effect
size is zero is rejected with the probability of Type I error is less than or equal to .05.
109

simultaneously. Since size of effect sizes pertaining
to studies with the subjects being taught concurrently
is not comparable to that of studies with the subjects
not being taught concurrently, it seems impossible to
draw a reliable conclusion about the relative effective¬
ness of CAI/computer programming between these two
categories under the variable of historical effect.
As in the analysis of historical effects in mathe¬
matics achievement, size of effect sizes in problem-
solvirig skills in relation to studies where the subjects
in treatment and control groups were not taught concur¬
rently was quite small as compared with that of studies
where two groups were taught concurrently. The number
of effect sizes for the latter was 138, but that for the
former was only eight. Therefore, the comparison of the
effectiveness of these two categories in developing
problem-solving skills appears not reliable.
Data in Table 3 6 indicate that studies with both
treatment and control groups being taught at the same
time had a minor positive effectiveness in improving
student problem-solving skills. Average effect size
was 0.190. However, average effect size for studies
where subjects in treatment and control groups were
not taught concurrently was not statistically signifi¬
cant .
110

Table 36 Average Effect Size in Problem-Solving Skills by Historical Effect
Historical Effect
Mean SD SE of Mean
Number of ESs
t-value P-value
Concurrently . 190 . 637 .054 138 3.50* . 001
Not Concur. -.098 . 646 .229 8
II
II II r>
II ^
II •
II 1
II II II
. 681
* The null hypothesis assuming that the mean effect size is zero is rejected with the probability of Type I error is less than or equal to .05.
Effect Sizes by Instructor Effect
In this subsection, the issue of whether the ef¬
fectiveness of CAI/computer programming in mathematics
achievement varies as a function of instructor effect
will be examined. Due to small number of effect sizes
in some cells being classified by each mode of computer
application, this analysis has no attempt to analyze
effects of each mode of computer application, but rather
focuses on the overall effect of CAI and computer pro¬
gramming.
Data in Table 37 indicate that in computer program¬
ming, studies where the same instructor taught both
treatment and control groups was not more effective in
increasing student problem-solving skills; whereas
studies with different instructors in two groups were
more effective, as compared with traditional instruc¬
tion.
Ill

With regard to overall effect of CAI, both studies
with the same instructor and with different instructors
teaching in treatment and control groups were more ef
fective in comparison with use of conventional methods
only.
Table 37 Average Effect Size in Math Achievement by Instructor Effect and Mode of Computer Application
Instructor D & P Tutor Simu/ Gaming
Total CAI
Compu
Progra Total
Mean
Same
Mean .234 .496 . 620 .385 .300 .341
SD .312 — . 619 .440 .653 .551
SE of Means . 118 — .310 . 127 . 181 . 110
Number of ESs 7 1 4 12 13 25
t-value 1.98 — 2.00 3.03* 1.65 3.09*
P-value . 094 — . 139 . Oil . 124 .005
Different
Mean .307 .560 . 141 .381 .390 . 382
SD .634 .424 .833 .593 .434 .576
SE of Mean . 066 .061 .295 . 048 . 097 .044
Number of ESs 92 49 8 151** 20 171
t-value 4.64* 9.24* .48 7.89* 4.01* 8.67*
P-value .000 . 000 .647 . 000 .001 . 000
* The null hypothesis assuming that the mean effect
size is zero is rejected with the probability of
Type I error is less than or equal to .05. ** Two effect sizes were computed from the study where
two or more different modes of CAI were used in the
treatment group.
112

In Table 38, data indicate that when the same in¬
structor taught both treatment and control groups, stu¬
dents' problem-solving skills in CAI or computer pro¬
gramming did not significantly improve. In contrast,
different teachers teaching the two groups did signifi¬
cantly promote students' problem-solving skills, but the
influence was minor.
Table 38 Average Effect Size in Problem-Solving Skills
y Instructor Effect and Mode of Computer Application
Instructor CAI Computer
Programming Total Mean
Same Instructor
Mean . 066 .262 . 178
Standard Deviation .534 1.098 . 897
Standard Error of Mean .114 .204 . 126
Number of Effect Sizes 22 29 51
t-value .58 1.29 1.41
P-value .568 .209 . 164
Different Instructor
Mean . 101 .221 . 191
Standard Deviation .413 .458 .448
Standard Error of Mean . 086 . 056 . 047
Number of Effect Sizes 23 67 90
t-value 1.17 3.95* 4.04*
P-value .253 . 000 .000
* The null hypothesis assuming that the mean effect
size is zero is rejected with the probability of
Type I error is less than or equal to .05.
113

Effect Size by Time-on-Task
As shown in Table 39, in drill/practice and tutori¬
al CAI, studies where subjects in the treatment and con¬
trol groups studying the same amount time were more ef¬
fective. Conversely, in computer programming, average
Table 39 Average Effect Size in Math Achievement by Time-on-Task and Mode of Computer Application
Time-on-Task O
II ii ii ii ►tf
ii ii ii
Tutor Simu/ Gaming
Total CAI
Compu Progra
Total Mean
More -
Mean . 194 .413 .227 .236 .375 .253
SD .739 . 157 .799 . 686 .548 . 668
SE of Mean .123 . 052 .253 . 092 . 194 . 084
Number of ESs 36 9 10 55 8 63
t-value 1.57 7.91* .90 2.55* 1.93 3.01*
P-value . 124 . 000 .393 . 014 . 094 . 004
Same
Mean .312 .582 . 670 .418 . 241 .394
SD .529 .438 .739 .508 .551 .515
SE of Mean .073 . 077 .522 .054 . 147 . 051
Number of ESs 52 32 2 88** 14 102
t-value 4.23* 7.52* 1.28 7.72* 1.64 7.72*
P-value . 000 . 000 .422 . 000 . 126 . 000
* The null hypothesis assuming that the mean effect size is zero is rejected with the probability of Type I error is less than or equal to .05.
** Two effect sizes were computed from the study where two more CAI modes were used in the treatment group.
114
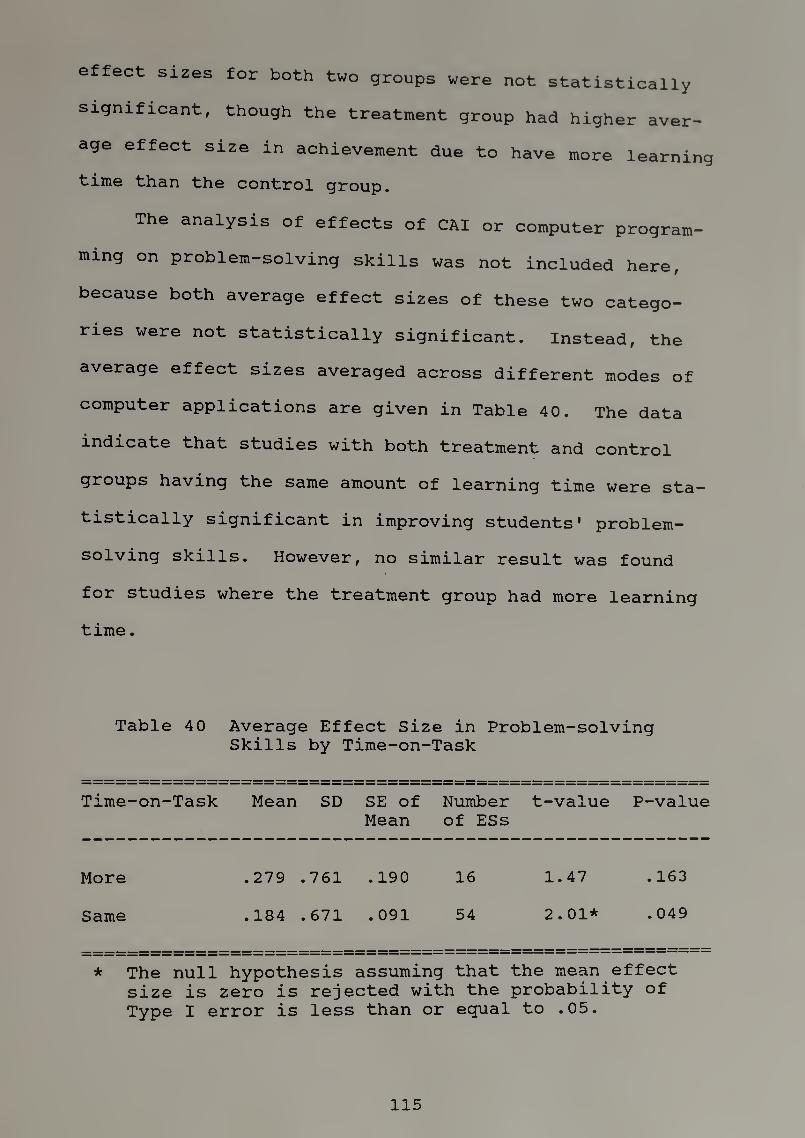
effect sizes for both two groups were not statistically
significant, though the treatment group had higher aver¬
age effect size in achievement due to have more learning
time than the control group.
The analysis of effects of CAI or computer program¬
ming on problem-solving skills was not included here,
because both average effect sizes of these two catego¬
ries were not statistically significant. Instead, the
average effect sizes averaged across different modes of
computer applications are given in Table 40. The data
indicate that studies with both treatment and control
groups having the same amount of learning time were sta¬
tistically significant in improving students' problem¬
solving skills. However, no similar result was found
for studies where the treatment group had more learning
time.
Table 40 Average Effect Size in Problem-solving Skills by Time-on-Task
Time-on-Task Mean SD SE of Number t-value P-value
Mean of ESs
More .279 . 761 .190 16 1.47 .163
Same .184 . 671 . 091 54 2.01* .049
* The null hypothesis assuming that the mean effect
size is zero is rejected with the probability of
Type I error is less than or equal to .05.
115
Specific Effects by Study Variables
Study variables deal with characteristics that
could not be managed or controlled skillfully by the
experimenter but were related to study outcomes. In
this category, source of study and year of publication
were taken into consideration. They were both examined
in terms of average effect sizes. In addition, in order
to give more precise information about the relation be¬
tween year of publication and effect sizes, the Pearson
correlation coefficient was also applied.
Effect Size by Source of the Study
Studies used in this meta-analysis were derived
from three different sources: published studies in a
variety of journals, unpublished studies from ERIC
documents, and doctoral dissertations. As reported in
Table 41, all average effect sizes in mathematics
achievement for three different sources of studies were
significant at 0.05 level. Among them, as a whole,
published studies had the largest average effect size
of 0.433 as compared with ERIC documents and disserta¬
tions.
116

Tabl%“ *Ve?af: “fect Size in Math Achievement by _?°af°fLf£_Study and Mode of Computer Application
Source D & P Tutor Simu/ Gaming
Total CAI
Compu
Program Total
Mean
Published Studies t
Mean .319 .989 .347 .414 .519 .433
SD . 571 .529 .664 . 614 .523 .597
SE of Mean .082 . 167 . 171 . 071 . 127 . 062
Number of ESs 48 10 15 75** 17 92
t-value 3.87* 5.91* 2.03 5.84* 4.09* 6.96*
P-value . 000 .000 .062 . 000 . 001 . 000
Unpublished Studies
Mean .463 .503 . 188 . 343 .303 .338
SD .716 .082 .679 .675 .254 .632
SE of Mean . 169 . 047 . 165 . 109 . 104 . 095
Number of ESs 18 3 17 38 6 44
t-value 2.74* 10.66* 1.14 3.13* 2.92* 3.54*
P-value .014 .009 .271 .003 . 033 .001
Dissertation
Mean . 337 .440 .632 .386 .155 .360
SD . 670 .319 .685 . 550 .531 .551
SE of Mean .091 .051 .484 .056 .153 .053
Number of ESs 54 39 2 95 12 107
t-value 3.70* 8.60* 1.30 6.83* 1.01 6.76*
P-value .001 . 000 .417 . 000 .335 . 000
* The null hypothesis assuming that the mean effect
size is zero is rejected with the probability of
Type I error is less than or equal to .05.
** Two effect sizes derived from the study where two
more CAI modes were used in the treatment group.
117

Table 42 shows data for effect sizes in problem¬
solving skills for computer programming and various dif¬
ferent CAI modes (drill-and-practice, tutorial, simula¬
tion/gaming, and problem solving). The data illustrate
that studies collected from doctoral dissertations had
larger mean effect sizes than those found in published
and unpublished studies.
Effect Size by Publication Year of the study
As the data given in Table 43 show, the general
trend in relation to effects of CAI on achievement was
that later studies had smaller average effect size than
early studies. Studies ranging from 1985 to 1989 had
the smallest average effect size of 0.290. Studies from
1970 to 1974 had the largest average effect size of
0.556. The average effect size of studies ranging from
1975 to 1979 and of studies from 1980 to 1984 were 0.480
and 0.376 respectively.
It is interesting to note that contrary to CAI, in
computer programming, the later studies tended to have
larger average effect sizes than the early studies.
However, caution must be exercised in the interpretation
of this result, due to the small number of effect sizes
in two cells.
118

Table 42 ETfFV""* Si2e in Problem-Solving Skills by Source of Study and
Mode of Computer Application
Source CAI Computer
programming Total Mean
Published Studies
Mean .096 .226 .186
Standard Deviation .483 .788 .709
Standard Error of Mean .085 .092 . 069
Number of Effect Sizes 32 73 105
t-value 1.12 2.45* 2.69*
P-value .270 . 017 .008
Unpublished Studies
Mean -.263 -.023 -.160
Standard Deviation .316 .352 .328
Standard Error of Mean .158 .203 . 124
Number of Effect Sizes 4 3 7
t-value -1.67 -.11 -1.29
P-value . 194 .919 .243
Disserta.
Mean . 069 .300 .205
Standard Deviation .444 .358 .406
Standard Error of Mean .119 . 080 .070
Number of Effect Sizes 14 20 34
t-value .58 3.75* 2.94*
P-value .572 .001 . 006
* The null hypothesis assuming that the mean effect
size is zero is rejected with the probability of
Type I error is less than or equal to .05.
119

Table 43 Average Effect Size in Math Achievement by Year of Publication and Mode of Computer Application
Year d & P Tutor Simu/ Total Gaming CAI
Compu Program
Total Mean
1970-74
Mean .632 .507 . 556 .205 .457 SD .881 .404 . 623 . 663 . 646 SE of Mean .266 . 098 . 118 .200 . 103 Number of ESs 11 17 —— 28 11 39 t-value 2.38* 5.17* 4.72* 1.02 4.42* P-value . 039 . 000 .000 .331 . 000
1975-79
Mean .499 . 082 .480 .401 .477 SD .429 . 006 .428 . 008 .419 SE of Mean .065 . 004 . 064 .006 . 061 Number of ESs 43 2 — 45 2 47 t-value 7.62* 20.50* 7.52* 72.82* 7.80* P-value .000 . 031 . 000 . 009 . 000
1980-84
Mean . 115 .517 1.154 .376 .439 .382 SD .765 .338 . 054 . 600 . 685 . 601 SE of Mean . 167 .064 .038 .084 .306 .080 Number of ESs 21 28 2 51 5 56 t-value .69 8.10* 30.37* 4.48* 1.43 4.75* P-value .501 . 000 .021 . 000 .225 . 000
1985-89
Mean .245 1.058 .230 .290 .426 .313 SD . 629 .575 . 644 .647 .364 .609 SE of Mean . 094 .257 .114 .071 . 088 .061 Number of ESs 45 5 32 84** 17 101
t-value 2.62* 4.11* 2.02 4.10* 4.83* 5.15*
P-value .012 .015 , .052 . 000 .000 .000
* The null hypothesis assuming that the mean effect size is zero is rejected with the probability of Type I error is less than or equal to .05.
** Two effect sizes were computed from the study where two or more different modes of CAI were used in the treatment group.
120

CAI on mathe- As to effects of individual mode of
matics achievement, in drill/practice CAI, the distribu¬
tion of average effect sizes was generally consistent
with that of CAI. in tutorial CAI, year in which a
study was published seemed to have no consistent re¬
lationship with effect sizes.
With respect to effects of CAI/computer programming
on problem-solving skills, as the data show in Table 44,
there was no consistent relationship between publication
year of studies and effect sizes. This finding was sup¬
ported by the evidence of negative correlation of -.062
between publication year and effect size in problem¬
solving skills.
Table 44 Average Effect Size in Problem-Solving Skills by Year of Publication
Year Mean SD SE of Mean
Number of ESs
t-value P-value
1970-74 .272 .424 . 110 15 2.48* .026
1975-79 . 092 .386 . 158 6
CO in • .585
1980-84 . 100 .373 .124 9 .80 .446
1985-89 . 171 .689 .064 116 2.68* . 008
* The null hypothesis assuming that the mean effect size is zero is rejected with the probability of Type I error is less than or equal to :05.
121

Attitudes toward Mathematics/Instruction
It is widely recognized that students' attitudes
play an important role in and have a critical effect on
student learning. Mathematics teachers/educators are
therefore as interested in effects of student attitudes
toward mathematics/instruction as they are in student
mathematics achievement per se. Hence, the purpose of
this section was to determine if student attitudes
toward mathematics/instruction improve as a result of
using CAI/computer programming in mathematics instruc¬
tion.
Due to the limited number of studies relating at¬
titude to mathematics/instruction, in this analysis,
there is no attempt to analyze effects of all variables,
as has been done in previous sections. Instead, the
following questions will be addressed and discussed in
this section about the effects of CAI/computer program¬
ming on student attitudes mathematics/instruction.
Question 1: What is the overall effect of CAI/computer
programming on student attitudes toward mathematics/in-
struction?
Only 95 effect sizes were calculated from 16
studies relative to the effects of CAI/computer program
ming on student attitude toward mathematics/instruction
As data show in Table 45, among various different modes
122

of CAI, only the average effect size of drill/practice
(0.231) was statistically significant; whereas, those
average effect sizes of tutorial and simulation/gaming
modes were not significant. This result could be due to
the quite small number of effect sizes in these two
categories. The average effect size of computer pro¬
gramming was not significant at the .05 level. Overall
average effect size of student attitudes toward mathe¬
matics/instruction was 0.163, a small positive effect.
Table 45 Overall Average Effect Size in
Attitude vs Math/Instruction
Attitudes vs
Mathematics/
Instruction
D & P Tutor Simu/ Gaming
Total
CAI Comp
Progra Total Mean
Mean of ESs .231 . 024 .241 . 130 .292 . 163
SD .337 . 122 .298 .255 . 652 .371
SE of Mean .060 . 087 .211 . 029 . 150 . 038
Number of ESs 32 2 2 76* ** * 19 95
t-value 3.87* .27 1.14 4.45* 1.95 4.27*
P-value .001 .831 .458 . 000 .067 . 000
* The null hypothesis assuming that the mean effect
size is zero is rejected; the probability of
Type 1 error is less than or equal to .05. ** 40 effect sizes calculated from the study where two
more different modes of CAI were used in the treat¬
ment group.
123

Question 2: For what specific grade levels is the ap¬
plication of CAI/computer programming more effective in
improving student attitudes toward mathematics/instruc¬
tion?
According to Table 46, at all grade levels, the
application of CAI/computer programming to mathematics
teaching was significantly more effective in improving
student attitudes toward mathematics/instruction in
comparison with use of conventional methods only.
However, the influence was minor, since average effect
sizes for three grade levels were only 0.188, 0.128, and
0.197 respectively.
Table 46 Average Effect Size in Attitude vs Math/Instruction by Grade Level
Grade
Level
Mean SD SE of
Mean
Number t-value
of ES
P-value
Elementary
(Grade 1-6)
. 188 .320 . 056 32 3.32* .002
Junior
(Grade
High
7-9)
. 128 .417 . 058 51 2.19* .033
Senior
(Grade
High
10-12)
. 197 .257 .078 11 2.54* . 030
* The null hypothesis assuming that the mean effect size is zero is rejected; the probability of Type 1
qjctot is less than or equal to .05.
124

Question 3: For what specific level of student ability,
is use of CAI/computer programming more effective in
promoting student attitudes toward mathematics/instruc¬
tion?
Data in Table 47 show that use of CAI/computer pro¬
gramming in mathematics instruction was more effective
in improving student attitudes toward mathematics/in-
s^*ruc^--i-on only for low ability students as compared with
traditional classroom instruction only. Although
studies with high ability students had the largest aver¬
age effect size (0.484) among three ability levels,
average effect size was' not statistically significant.
This result was probably due to the quite small number
of effect sizes in this category.
Table 47 Average Effect Size in Attitude vs
Math/Instruction by Ability Level
Ability Mean SD SE of Mean
Number
of ES
t-value P-value
Low .257 .503 .082 38 3.15* .003
Middle .249 .384 . 136 8 1.83 . 110
High .484 .773 .546 2
CO
C
O • .539
* The null hypothesis assuming that the mean effect
size is zero is rejected with the probability of
Type 1 error is less than or equal to .05.
125

Correlation between student ability level and ef¬
fect size was r = - 0.003 (p < .05). The value of r is
negative that means as students' ability level becomes
higher, effect size tends to decrease. However, due to
the value of r close to zero, it can be assumed that
there is little or no linear relationship between abil¬
ity level and effect size. This finding supports the
findings from the average effect sizes.
Question 4: What is the effect of CAI/computer program¬
ming on student attitudes toward mathematics/instruction
as a function of the student's sex?
Findings from Table 48 indicate that application of
CAI/computer programming was in favor of male students
in terms of attitudes toward mathematics/instruction.
Average effect size in attitudes toward mathematics/
instruction for males was 0.222, while that for females
was not statistically significant.
Table 48 Average Effect Size in Attitude vs Math/Instruction by Sex
Sex Mean SD SE of
Mean
Number
of ESs
t-value P-value
Male .222 .210 .036 33 6.09* . 000
Female . 026 .236 .040 35 .64 .525
* The null hypothesis assuming that the mean effect
size is zero is rejected with the probability of
Type 1 error is less than or equal to .05.
126

Question 5: What is the impact of length of treatment
on student attitudes toward mathematics/instruction?
Table 49 summarizes average effect size in attitudes
toward mathematics/instruction according to length of
treatment, measured by weeks and by minutes. Studies
with length of treatment less than or equal to 18 weeks
had the largest average effect size (0.624). Studies
with length of treatment from 19 to 36 weeks had the
smallest average effect size of 0.055.
Table 49 Average Effect Size in Attitude vs
Math/Instruction by Length of Treatment
Length of
Treatment Mean SD SE of
Mean Number of ES
t-value P-value
in Weeks
1-18 .624 . 822 .260 10 2.40* . 040
19-36 .055 . 152 . 020 58 2.77* . 008
37 & over .303 .301 . 069 19 4.38* . 000
in Minutes
1-999 . 076 . 340 . 085 16 .89 . 386
1000-1999 1.085 1.075 .538 4 2.02 . 137
2000-2999 .334 .277 . 065 18 5.11* . 000
3000 . 059 .295 . 098 9 . 60 .562
* The null hypothesis assuming that the mean effect
size is zero is rejected with the probability of
Type 1 error is less than or equal to .05.
127

In the case of length of treatment being measured
by minutes, the only average effect size which was
statistically significant pertained to studies with
length of treatment ranging from 2000 to 2999 minutes.
The correlation between number of weeks and effect
size was r = -.111. it supports the evidence obtained
from the average effect size. Increase of length of
treatment does not necessarily increase average effect
size in attitudes toward mathematics/instruction.
Question 6: Does effectiveness of CAI/computer program¬
ming in student attitudes toward mathematics/instruction
vary as a function of instructor effect?
Table 50 suggests that both studies of CAI/computer
programming with the same or different teacher(s)
teaching in treatment and control groups were more ef¬
fective in improving student attitudes toward mathe¬
matics/instruction as compared with conventional in-
Table 50 Average Effect Size in Attitude vs Math/Instruction by Instructor Effect
Instructor Mean SD SE of Mean
Number
of ESs
t-value P-value
Same .330 .324 . 115 8 2.88* . 024
Different . 147 .373 .040 87 3.68* .000
* The null hypothesis assuming that the mean effect
size is zero is rejected with the probability of
Type 1 error is less than or equal to .05.
128

same struction. Average effect size of studies with the
instructor teaching both treatment and control groups
was 0.330 which was twice as much that of studies with
different instructors teaching in two groups.
Question 7: What is the relationship between publica¬
tion year of studies and student attitudes toward mathe¬
matics/ instruction?
Under this variable, effect sizes were grouped into
four1 catetories. Specifically, they were studies ranging
from: 1) 1970 to 1974, 2) 1975 to 1979, 3) 1980 to 1984,
and 4) 1985 to 1989. According to data in Table 51,
only studies from 1975 to 1979 and studies from 1985 to
1989 were more effective in developing student attitudes
toward mathematics/instruction. Of these two categories
of studies, studies ranging from 1985 to 1989 had the
largest average effect size, which was 0.324. The aver¬
age effect size of studies from 1975 to 1979 was as low
as 0.052.
Correlation between publication year of studies and
effect size in attitudes toward mathematics/instruction
was r = 0.281 (p > .05). It means that in general,
early studies had smaller effect sizes than the later
studies.
129
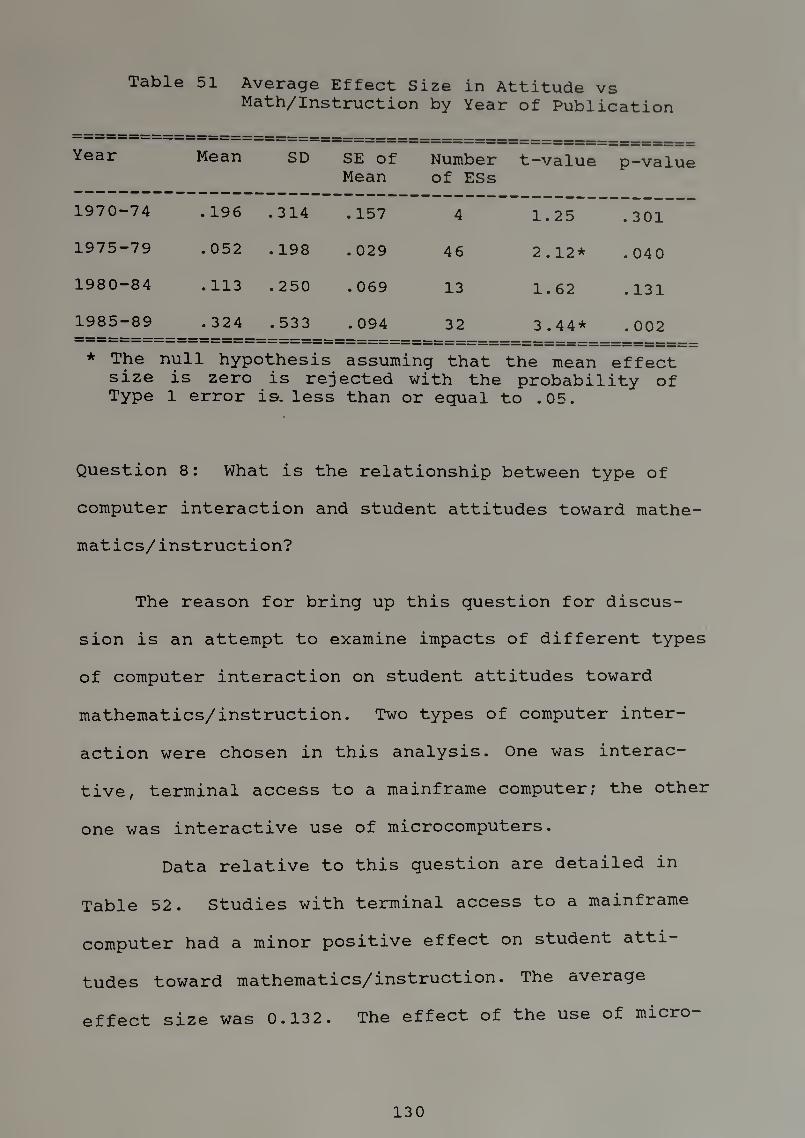
Table 51 Average Effect Size in Attitude vs
Math/Instruction by Year of Publication
Year Mean SD SE of
Mean
Number
of ESs t-value p-value
1970-74 . 196 .314 . 157 4 1.25 .301
1975-79 . 052 . 198 . 029 46 2.12* . 040
1980-84 . 113 .250 . 069 13 1.62 . 131
1985-89 .324 . 533 . 094 32 3.44* . 002
* The null hypothesis assuming that the mean effect
size is zero is rejected with the probability of
Type 1 error is. less than or equal to .05.
Question 8: What is the relationship between type of
computer interaction and student attitudes toward mathe¬
matics/instruction?
The reason for bring up this question for discus¬
sion is an attempt to examine impacts of different types
of computer interaction on student attitudes toward
mathematics/instruction. Two types of computer inter¬
action were chosen in this analysis. One was interac¬
tive, terminal access to a mainframe computer; the other
one was interactive use of microcomputers.
Data relative to this question are detailed in
Table 52. Studies with terminal access to a mainframe
computer had a minor positive effect on student atti¬
tudes toward mathematics/instruction. The average
effect size was 0.132. The effect of the use of micro-
130

computers was not statistically significant, although
studies with microcomputers had higher average effect
size than studies with a mainframe computer.
M^h/r52^ A^rra9e Effect Size in Attitude vs Math/Instruction by Type of Computer Interaction
Type of
Computer Mean SD SE of
Mean Number
of ES t-value P-value
Mainframe . 132 .255 .029 79 4.58* . 000
Micro¬
computer
.316 .703 . 176 16 1.80 .093
* The null hypothesis assuming that the mean effect
size is zero is rejected with the probability of
Type 1 error is less than or equal to .05.
131

CHAPTER V
CONCLUSION
The primary purpose of this chapter is to interpret
and discuss results of the study as given in the previ¬
ous chapter. Hopefully, this will shed some light on
questions addressed in the very beginning of this study
about how to effectively incorporate computers into
mathematics classrooms. As a rule, the interpretation
and discussion herein will focus on findings which were
satistically significant. Secondly, the findings of
this meta-analysis suggest some possible implications
about uses of computers in mathematics classrooms which
are discussed here. Finally, some recommendations about
new directions for further research are offered.
Summary of Results and Discussion
For sake of convenience, the interpretation and
discussion are divided into two categories: overall ef¬
fects of CAI/computer programming and specific effects
of study characteristics on mathematics achievement,
problem-solving skills, and attitudes toward mathe¬
matics/instruction.
132

Overall Effects of CAI/Computer Programming
Results of this meta-analysis provided support to
the general conclusion that incorporation of computers
into mathematics instruction was, for the most part,
significantly more effective in improving students*
achievement in comparison with use of traditional class¬
room instruction only.
This analysis found that CAI/computer programming
have a moderate positive effect on student mathematics
achievement at elementary and secondary levels. In the
typical study, CAI/computer programming promotes student
mathematics achievement by 0.38 standard deviations
higher, or shifts position from 50th to 65th percentile
as compared with coventional instruction.
In the literature, only a few meta-analyses re¬
ferred to effects of teaching computer programming on
students' achievement, and their findings were varied.
For example, in Kulik, Bangert, and Williams' (1983)
meta-analysis, the average effect size of 8 studies
about effects of computer programming on achievement was
0.20; while in Kulik and Kulik's (1985) review of 9
studies, the average effect size was 0.11.
In this meta-analysis, the average effect size in
mathematics achievement for 17 studies of computer pro¬
gramming was 0.36, which was much higher than those
133

of the two above mentioned reviews. Use of computer
programming in mathematics instruction can be expected
to enhance student achievement by approximately 0.36
standard deviations, or shift the position from 50th to
64th percentile of the control group. Computer program¬
ming in mathematics instruction was almost as effective
as CAI in achievement, in comparison with traditional
instruction.
As for CAI, average effect size in mathematics
achievement was 0.3 9 for elementary and secondary stu¬
dents, which was very close to the results of Hartley's
(1977) and Burns'(1981) reviews on effectiveness of CAI
in elementary and secondary mathematics achievement.
Overall average effect sizes in achievement of their
meta-analyses were 0.41 and 0.35 respectively. In their
reviews of effectiveness of CAI in elementary and sec¬
ondary school education, Kulik, and his colleague
(Kulik, et al., 1983; Bangert-Drowns, et al., 1985),
also found approximately the same effect sizes in
achievement (0.47 and 0.36, respectively).
To date, in spite of the fact that no final con¬
clusive finding about effectiveness of computer applica¬
tions can be reached, consistency of findings from
varied research reviews indeed reflects that use of
computers in instruction, especially in CAI mode, had
significant positive effect on achievement.
134

Use of computer programming as a tool of teaching
problem-solving skills has provoked widespread interest
of educators, especially since the introduction of
microcomputers. However, reviewing literature relevant
to effects of computer programming on problem-solving
skills is not an encouraging enterprise. The impact of
computer programming on the development of childrens'
P^-"°klem—solving skills is still an issue of controversy.
There is little concrete and precise evidence to support
or disprove use of computer programming to promote
problem-solving skills.
A small but positive effect of CAI/computer pro¬
gramming on problem-solving skills was found in this
meta-analysis. The overall average effect size was
0.174. The average effect size for computer programming
was 0.234 and that for CAI was 0.060. Teaching computer
programming appeared to have a slight effect on problem¬
solving ability; whereas, the effect of CAI on problem¬
solving skills was not statistically significant. This
finding is consistent with the result of Roblyer,
et al.'s (1988) meta-analysis that Logo programming was
significantly effective in enhancing problem-solving
skills; while the effect of problem-solving CAI was in¬
significant. Average effect sizes of Logo programming
and problem-solving CAI were .39 and -.01 respectively.
Similar to these results, a slight positive effect
of CAI and/or computer programming on attitudes toward
135

mathematics/instruction was also found in this meta¬
analysis. The average effect of computer applications
in teaching was to raise students' attitudes toward
mathematics/instruction by 0.16 standard deviations.
This finding supports the result from Kulik and Kulik's
(1987) review which indicated that the average effect
size in attitudes toward instruction was 0.28.
Reasons why computer-based instruction is more
effective in improving students' attitudes toward mathe¬
matics/instruction are not quite clear to educators.
However, multiple factors could contribute to this re¬
sult. For example, compared to traditional classroom
instruction, CAI offers the important advantage of being
able to allow individual student to learn at a proper
level of difficulty and at an appropriate pace for him/
her. Another major advantage readily apparent in a CAI
system is that it can involve an individual student
actively in the learning process. Besides, certain
features of the computer make it an especially attrac¬
tive instructional medium, such as graphics, simulated
motion, sound effects, etc. Generally, computer-based
mathematics lessons appear to have advantages over tra¬
ditional lessons taught by teachers because many com¬
puter lessons have been designed visually and auditorily
in an attractive and engaging way.
136

In addition, this study also found that elementary
and secondary students developed more positive attitudes
toward computers after they received computer-based
instruction in schools. The overall effect size in at¬
titudes toward computers was 0.75, which was higher than
that of Kulik et al.'s(1983) and Bangert-Drowns et al.'s
(1985) review (ES = 0.61 and 0.62, respectively) and was
more than twice that of Kulik and Kulik's (1987) finding
(ES = 0.33). A student after receiving CAI/computer
programming instruction can be expected to enhance his
attitudes toward computers approximately 0.75 standard
deviations, or from the 50th to the 77th percentile over
a student in the traditional instruction group.
This is an encouraging finding, since success or
failure of implementation of computer-based mathematics
instruction heavily depends on students' attitudes
toward computers. Computer anxiety has been considered
one of the major barriers to application of computers in
schools. This suggests that a more positive attitude
toward computers needs to be developed.
Based on average effect sizes broken down by each
mode of computer applications, tutorial CAI was the most
effective in mathematics achievement among four differ¬
ent modes of computer applications. This finding was
consistent with Burns'(1981) finding. In Burn's meta¬
analysis, tutorial CAI had the highest average effect
size of 0.45.
137

Study Features and Study Outcomes
Similar to past meta-analyses, this review also
failed to find significant relations between many study
features and instructional outcomes. However, this
analysis still showed relative strengths and weaknesses
of CAI/computer programming in several specific areas.
Means, stanard errors, and t values of mathematics
achievement and of problem-solving skill effect sizes
for different study features are listed in Appendix D
and E, respectively. Interpretation and discussion of
relations between study features and study outcomes here
are categorized under four sets of variables: subject
characteristics, treatment factors, design variables,
and study variables.
Subject Characteristics
Under this variable, four subcategories of subject
characteristics will be interpreted and discussed. They
are: students' grade levels, ability levels, socio¬
economic status, and sex.
Grade Level■ Findings of this meta-analysis
offer some support to the notion that effectiveness of
computer applications varies as a function of changes
138

m grade levels and/or inodes of computer uses. The major
finding in this analysis was that in general, drill-and-
practice and tutorial CAI appeared to have higher ef¬
fects for elementary and/or junior high students? their
effects appear to be smallest in senior high schools.
This finding, to a certain extent, supports Hartley's
review that CAI had higher effect size for younger
students.
Drill"and“Practice and tutorial CAI are highly
s^ructured programs by nature and are primarily designed
for the mastery of basic skills. Generally speaking,
younger students seem to get more benefit from highly
structured and interactive instruction provided in
drill-and-practice and tutorial CAI than older students
do. Older students, for the most part, may be able to
acquire basic concepts and skills from textbooks without
the cues and immediate feedback provided by drill-and-
practice and tutorial CAI lessons (Kulik, et al., 1985,
P-71)
In sharp contrast to Bangert-Drowns, Kulik, and
Kulik's finding that older students seem to profit more
than younger ones from computer programing, the result
of this meta-analysis indicated that computer program¬
ming had its strongest effect on elementary students'
performance in mathematics achievement; its effect was
weaker on secondary students.
139

Similar to effects of computer programming on
students' achievement, the use of computer programming
to develop students' problem-solving skills was more
effective at both elementary and junior high levels,
but not significant at senior high level. As to effects
of CAI on problem-solving skills, no significant effect
was found at any general grade level.
The result that younger students gained more bene¬
fit than older students from computer programming in
mathematics learning and the development of problem¬
solving skills could be due to the fact that Logo has
been widely recognized as a programming environment
suitable for young children and is now commonly used in
elementary schools.
Ability Level. A widespread belief in the
literature is that computer applications in mathematics
education are usually more effective with low-achieving
students than' with average or high-achieving students.
Results of this study support this argument: As the
student ability goes from low to high level, the average
effect size in mathematics achievement decreases. This
meta-analysis also provided evidence that drill-and-
practice and tutorial CAI had especially positive con¬
tributions to low-ability students' mathematics achieve¬
ment at elementary and secondary levels. However,
achievement of average and high ability students were
140

not significantly enhanced by these two CAI inodes. This
result supports Burns' (1981) meta-analysis finding.
Burns concluded that both drill/practice and tutorial
programs were significantly more effective in
fostering mathematics achievement for disadvantaged
students.
Computer-based mathematics instruction had its
stronger effects in studies of low ability students;
whereas, effects were much smaller in studies of high
akility students. This could be interpreted to mean
that due to their inherent intellectual acumen, high
ability students usually do not depend heavily upon
the kind of treatment as much as the low ability stu¬
dents do in their understanding of mathematics concepts
(Athappilly, 1978).
Socio-economic Status. This analysis found that
among different levels of socio-economic status, stu¬
dents from middle class and high-income families had
higher average effect sizes than students from low-
income families. Two major reasons could help interpret
this result. First of all, this could be due to parental
help, because parents of average and high-income fam¬
ilies usually received better education and they were
more likely to have some computer literacy. Secondly,
these students might have more access to computers at
home, especially with microcomputers being promoted as
141

"personal", or "home" computers. Prior computer experi¬
ence may have a great impact on attitude toward com¬
puters. If students have a positive attitude toward
computers, they usually tend to do more with computers
(Suydam, 1986; Bell, 1978).
In this variable, the only average effect
size in achievement which was statistically significant
was that of drill and practice CAI for male students
(ES = 0.31). This finding seems to be consistent with
the commonly held belief that male students learn more
with computers than female students do (Athappilly,
1978) . However, due to the small number or nil effect
sizes available for tutorial CAI and computer program¬
ming, caution must be taken in the interpretation of
this finding.
Treatment Factors
The following interpretation and discussion are
based on analysis of relations between study outcomes
and variables related to the treatment.
Type of Computer Interaction. In this review,
mainframe-based studies tended to have higher average
effect size in achievement than microcomputer-based
studies in drill/practice CAI, while the opposite trend
142

was found in tutorial CAI and computer programming. The
average effect sizes for microcomputers in tutorial CAI
and computer programming were 0.61 and 0.52, respective¬
ly; whereas for mainframe were 0.46 and 0.20, respect¬
ively. This may suggest that use of microcomputers is
more effective in higher level of computer application
and/or that tutorial is more suitable/effective on
mainframes. Mainframes were mostly used in earlier
studies where drill-and-practice CAI were primarily em¬
phasized. Witn the rapid development of microcomputers,
software designers are showing their great interest in
higher level of instructional computing. For example,
especially, the amount of software on problem solving
has been increasing since the mid 1980s (Suydam, 1986).
Duration of Treatment. The most dramatic finding
in this meta-analysis is related to length of treatment.
In this context, the general trend of effects of CAI on
achievement was that average effect size gradually de¬
creases from less than 18 weeks until the length of
treatment was between 19 to 36 weeks; but after 36
weeks, the average effect size gradually increases. The
high average effect size at the beginning was probably
due to the novelty effect of new instructional medium.
The gradual decrease of average effect size may indicate
that students experienced the rigor of computer lessons.
Perhaps, after they tide themselves over the tough
143

period, students began making steady improvements in
their performance (Athappilly, 1978).
CAI Program Authorship. In drill/practice and
tutorial CAI, experimenter-/teacher-developed programs
were superior to commercial programs; while in simula¬
tion/gaming, commercial programs were significantly
effective, but not for experimenter-/teacher-developed
programs. The reason why this pattern was developed is
not clear. In the early years, probably due to the lack
of experience, most software on the market emphasized on
drill-and-practice or tutorial and the programs were not
of truly high quality. To meet the need of classroom
instruction, experimenters or teachers with competent
knowledge of programming and curriculum design developed
their own software. As developers and producers of edu¬
cational software gained experience, quality improved
(Komoski, 1984) . Recently, more and more software has
been developed to supplement the curriculum by providing
simulation/gaming or problem-solving rather than merely
providing drill and practice. This complex and high-
level software, however, is not easy for experimenters
or teachers to design because usually they are ill-
prepared, underfunded and don't have sufficient time
(Komoski, 1984).
144

Programming Language. An interesting and also con¬
troversial issue among educators is: How effective is
Logo and other programming languages for improving
students' achievement and/or problem-solving skills?
The results of this analysis indicated that Logo and
BASIC had almost equal effects on math achievement.
There was, however, a substantial difference in their
effects on problem-solving skills. In a typical study,
instruction of Logo programming can be expected to en¬
hance students' problem-solving skills by 0.34 standard
deviations, or shift the position from the 50th to the
63rd percentile of the control group; while the effect
of BASIC was not statistically significant.
On the basis of this finding, Logo shows promise as
a medium for improving students' problem-solving skills.
In Papert's view, by manipulating the 'turtle', children
learn problem-solving skills in a concrete way. Once
children begin to experience Logo programming, they
begin to think about the precise strategies to instruct
the 'turtle' to do what they desire. Developing these
strategies involves problem-solving (Nolon & Byba,1986).
Mathematics Content. Among three different cat¬
egories of mathematics content, drill-and-practice CAI
had its highest average effect size associated with
computation skills. It can be expected to promote a
student's mathematics achievement in computation by
145

approximately 0.49 standard deviation, or shift the
position from 50th to 69th percentile of the control
group. In tutorial CAI, the highest average effect size
pertained to the category of mathematics concepts/appli¬
cation (ES = 0.63). It can expected to shift the posi¬
tion of the average treated student from 50th to 74th
percentile of the control group.
The reason why drill-and-practice CAI was most ef¬
fective in computation seems clear, since this mode of
CAI is chiefly designed to help students in their
mastery of computation skills. A similar reason is also
applicable to explain why tutorial CAI was most effec¬
tive in concept understanding and application.
In computer programming, only the average effect
size of concept/application was statistically signifi¬
cant. In this context, it seems clear that the teaching
of computer programming, either Logo or BASIC, is effec¬
tive in improving students' understanding of mathematics
concepts and their application.
Results of this meta-analysis made it clear that
drill-and-practice CAI was most suitable for arithmetic
learning; Computer programming, especially Logo, was
most appropriate for exploring geometric concepts/appli¬
cation; and tutorial CAI was most effective in algebra
study. Their average effect sizes were 0.42, 0.68, and
1.19, respectively.
146

Design Variabl
For the most part, design features of experiments
had less influence on instructional outcomes as compared
with other study features. in some design features,
there was no evidence to suggest that study outcomes
(achievement and/or problem-solving skills) varied as a
function of the design variable. For example, experi¬
ments with the same instructor taught in treatment
and control groups yielded similar results as experi
ments with different instructors. Consisting with the
finding of Bangert-Drowns, Kulik, and Kulik's (1984)
analysis, this study failed to find that studies with
sukjscts being randomly assigned to the treatment group
or control group produced significantly different
results from studies with subjects not being randomly
assigned.
This analysis also did not produce conclusive evi¬
dence of a relationship between the variables of his¬
torical effect and achievement outcomes of CAI/computer
programming studies. Although studies without control
for historical effects had higher average effect size as
compared with studies with historical controls, size of
the former was not comparable to that of the latter.
As a result, it seems not possible to reach a reliable
conclusion.
147

In addition, experimenter-/teacher-developed tests
were designed specially for a study to test objectives
that type of instruction and would be expected to be
associated with higher effect sizes. However, in this
analysis, there was no significant difference in average
effect size of achievement between commericially stand¬
ardized tests and experimenter-/teacher-designed tests.
The variable of time-on-task might explain some of
the variation in outcomes of application of CAI/computer
programming. Kulik, Bangert, and Williams (1983) have
suggested that CBE programs are growing more effective
with time. In contrast to Kulik, et al.'s finding, this
meta-analysis indicated a general trend in CAI studies
where subjects in both treatment and control groups
studying the same amount time had higher average effect
size than studies with the treatment group receiving
more learning time. It seems perplexing to give an in¬
terpretation to this result.
Study Variables
Under this variable, two aspects of study variable
are discussed and interpreted. They are sources of
studies and the publication year of studies.
148
Sources of Studies. As reported in Kulik and his
colleagues' meta-analyses (Kulik, et al., 1983; Kulik,
et al., 1985; Kulik, et al.,1986) that published studies
had consistently larger average effect sizes in compari¬
son with unpublished studies and dissertations, this
meta-analysis also found that published studies yielded
the highest average effect size in achievement. Unpub¬
lished studies had the smallest mean effect size.
Factors that contributed to this result are not clearly
understood. One factor could be that reports from l
published studies usually had a tendency to convince
readers to favor the application of a new instructional
medium.
Publication Year. The other study feature sig¬
nificantly related to effectiveness of CAI/computer pro¬
gramming was publication year of study. In sharp con¬
trast to findings of other past reviews (e.g., Kulik,
et al., 1983; Cohen, et al., 1981), an interesting re¬
sult found in this analysis was that the publication
year of study had no consistent relationship with effect
sizes for CAI and computer programming. In CAI, the
earlier studies reported the highest average effect
size; while results produced from more recent studies
were less favorable to CAI. The general trend of aver¬
age effect sizes for computer programming was opposite
to this direction.
149
Attitudes toward Mathimatics/Tnstruction
Discussion and interpretation in this section
focuses on effects of CAI and/or computer programming on
students' attitudes toward mathematics/instruction as a
function of some specific study variables. Due to the
small number of studies related to this variable, not
all study variable chosen for this meta-analysis will be
included in this discussion and interpretation.
This study reported that for both elementary and
secondary students, use of CAI/computer programming had
a slight positive effect on students' attitudes toward
mathematics/instruction. The finding was in favor of
male students rather than female students. In addition,
CAI/computer programming was more effective in improving
low-achieving students' attitudes toward mathematics/
instruction.
These findings are basically consistent with other
past reviews of students' attitudes toward mathematics/
instruction. In order to obtain a more precise and
concrete finding, a wider range of reviews on effects of
computer applications on attitudes toward mathematics/
instruction needs to be done. Educational researchers
have repeatedly examined computer effects on mathematics
achievement, but they have given inadequate attention to
the computer's effects on attitudes toward mathematics
and/or instruction.
150

Implications and Recommendatinns
The findings of this meta-analysis, to a certain
extent, have important implications on decision making
and implementation of computer-based mathematics
instruction. They should encourage educators and/or
teachers to introduce computers into mathematics class¬
rooms in order to meet the needs of our changing
society.
Educators/teachers have become increasingly con¬
scious of the great potential of computers, especially
microcomputers, as a new instructional medium of mathe¬
matics education. Both elementary and secondary schools
are purchasing microcomputers at a rapid rate. However,
the past two decades, aggregate findings of studies
about effectiveness of CAI and/or computer programming
in mathematics instruction are inconclusive and even
conflicting. Consequently, educators/teachers can have
little confidence in their decision-making or implemen¬
tation of computer-based mathematics education due to
the lack of precise and concrete evidence.
Meta-analysis is a useful method for integrating
results of varied studies in order to draw exact con¬
clusions about them. The overall findings of this meta¬
analysis, which are basically consistent with results
reported in other past meta-analyses, show beneficial
151

effects of CAI/computer programming in terms of improve¬
ment in achievement and attitude. In light of these
findings, it would encourage educators/teachers to advo¬
cate computer-based mathematics instruction as superior
to tradidional classroom instruction.
Information related to general effectiveness of
CAI/computer programming is useful, but educators also
need more specific data on which to base their decisions
about how to make the best use of computers in various
different settings. To this end, relationships between
study features and instructional outcomes were investi¬
gated in this meta-analysis. Implications based on
findings from specific study features considered in this
analysis are varied. The following discussion attempts
to examine major findings of some important study fea¬
tures which may have great implications on decision¬
making and implementation of CAI and/or computer pro¬
gramming in elementary and/or secondary mathematics
education. In particular:
1) In mathematics achievement, among three general
grade levels, students at junior high level had the
highest average effect size in achievement for CAI and
students at elementary level had the highest average
effect size for computer programming. This suggests
that in the application of CAI (especially tutorial
mode) to mathematics instruction, the most appropriate
152

grade level is the junior high and similiarly, the most
appropriate grade level for computer programming (pri-
marilY Logo) is the elementary level.
As for problem-solving skills, either elementary or
junior high students, in contrast with senior high stu¬
dents, are the most appropriate subjects for learning
computer programming to improve their problem-solving
skills.
2) On the basis of student ability levels, use of
CAI was most effective for low-achieving students.
Therefore, in implementation of CAI, if a choice of
students' ability levels is required, the decision
should be in favor of low-ability students for applica¬
tion of CAI in mathematics instruction.
3) CAI, especially tutorial, was effective as a
subtitute for classroom instruction, but was more ef¬
fective as a supplement to classroom instruction in
fostering students' achievement at elementary and secon¬
dary levels. Similarily, teaching of computer program¬
ming was more effective as a supplement to rather than
as a subtitute for traditional methods in improving
student problem-solving skills.
4) Either BASIC or Logo programming was effective
in enhancing elementary and secondary students' mathe¬
matics achievement. However, with respect to improve¬
ment of problem-solving skills, Logo programming was
significantly effective, but BASIC was not.
153

5) Findings in general mathematics content indi¬
cated that CAI was slightly more effective in mathe¬
matics computation as compared with mathematics concept/
application. Computer programming, however, was much
more effective in mathematics concept and/or application
than in mathematics computation.
6) The relatively high average effect size of CAI
in the subject of algebra revealed that CAI was par¬
ticularly effective in learning algebra. Similarly, ef¬
fectiveness of computer programming was far better in
geometry study.
In sum, overall findings and findings in those spe¬
cific areas will enable mathematics educators/teachers
to make sound decisions about implementation of CAI
and/or computer programming in mathematics instruction.
However, caution must be taken with this conclusion:
effectiveness of computer applications in instruction is
always under the impact of a variety of variables. Some
of these variables are even uncontrollable. Failure to
take into account the moderating influence of such vari¬
ables may result in a great difference in effectiveness
(Burns and Bozeman, 1981). In addition, educators and
researchers should keep in mind that meta-analysis used
in this study is an approach of intergrating the find¬
ings of previous research on effectiveness of CAI/com-
puter programming in mathematics education rather than
154

of predicting the effectiveness of CAI/computer program¬
ming (Bangert-Drown, et al., 1985). Cautions must be
exercised in applying findings from this analysis to the
implementation of computer-based math instruction.
Suggestions for Future Research
This meta-analysis has provided a variety of subs¬
tantial information about effects of various study fea¬
tures on mathematics education in implementation of
CAI/computer programming. In some cases, findings were
consistent with results of other past research reviews.
In other cases, findings were not consistent with or
have not yet been examined by previous reviews. This
section, therefore, attempts to make some suggestions
for further study in order to draw more precise and
concrete conclusions about computer applications in
mathematics instruction. In this connection, those
findings of this meta-analysis which need further clari¬
fication, need more evidence to support, or have not
been previously studied raise the following questions
for further study:
a. Success of implementation of CAI/computer pro¬
gramming mathematics programs heavily depends on devel¬
opment of students' positive attitudes toward mathe¬
matics/instruction. This suggests that mathematics
155

attitudes achievement should closely correlate with
toward mathematics/instruction. However, overall re¬
sults of this meta-analysis indicated that improvement
of attitudes toward mathematics/instruction did not
compare with that of achievement. Discrepancy between
gains of these two dependent variables has raised a
question which is difficult to explain. Clearly, further
study about effects of CAI/computer programming on
achievement and attitudes toward mathematics/instruction
seems necessary.
b. Another unanticipated problem of this analysis
was the small number of studies in some categories. For
example, it was not anticipated that so few studies of
higher-level CAI modes, such as simulation/gaming and
problem-solving CAI would be found for this study. As
more research involving use of these modes of computer
applications in mathematics instruction becomes avail¬
able, it can be expected that more detailed and precise
information on how to use them most effectively can be
examined through further meta-analyses.
c. This analysis suggests that computer program¬
ming, especially Logo programming, can be taught effec¬
tively at elementary school level. Further research of
meta-analysis, if data are available, is necessary to
determine which way(s) of teaching computer programming,
are more effective in enhancing students' problem¬
solving skills.
156

d. Senior high students had less success with
drill/practice and tutorial CAI in achievement and less
success with computer programming in problem-solving
skills. Further study on the effects of CAI/computer
programming should be conducted to try to explain this.
e. In this meta-analysis, the pattern of effective¬
ness of CAI/computer programming as a function of number
of subjects in the treatment group was difficult to ex¬
plain. Further study is required to clarify the rela¬
tionship between size of subjects and study outcomes.
f. Perhaps researchers or educators will have to
give much more attention in the future to effects of
Intelligent Computer Assisted Instruction (ICAI)
(Swigger, 1985; Merrill, 1988) on mathematics instruc¬
tion. Although effectiveness of ICAI remains somewhat
unclear to most educators, its potential in improving
mathematics education should not be neglected.
157

APPENDIX A
STUDIES USED IN THE META-ANALYSIS
Published Studies:
Bass, G. , Ries, R., & Sharpe, W. (1986). Teaching basic skills through microcomputer assisted instruction. Journal of Educational Computing Research. 2(2) . 207-219.
Battista, M. T. & Clements, D. H. (1986). The effects of Logo and CAI problem-solving environments on problem-solving abilities and mathematics achieve- ment. Computers in Human Behavior. 2.(3), 183-193.
Berlin, D. & White, A. (1986). Computer simulations and the transition from concrete manipulation of objects to abstract thinking in elementary school mathematics. School Science and Mathematics. 86(6), 468-479.
Blume, G. W. & Schoen, H. L. (1988). Mathematical pro¬ blem-solving performance of eighth-grade program mers and non-programmers. Journal for Research in Mathematics Education. 19(2), 142-156.
Campbell,- D. L. , Peck, D. L., Horn, C. J. & Leigh, R. K. (1987). Comparison of computer-assisted instruction and print performance: a research note. Educational Communication and Technology Journal. 35(2).95-103.
Carrier, C., Post, T. R. , & Heck, W. (1985, January). Using microcomputers with fourth-grade students to reinforce arithmetic skills. Journal for Research in Mathematics Education. 45-51.
Clements, D. H. (1986). Effects of Logo and CAI environ¬ ments on cognition and creativity. Journal of Edu¬ cational Psychology. 78.(4) , 309-318.
Crawford, A. N. (1970). A pilot study of computer- assisted drill and practice in seventh grade re¬ medial mathematics. California Journal of Educa¬
tional Research, 2_1(4) , 170-181.
158

(1986) . Evaluating the impact of CAI on mathematics learning: computer immersion project.
*327—336 ~ Educational Computing Research. 2(3),
Gershman, J. & Sakamoto, E. (1981). Computer-assisted remediation and evaluation: a CAI project for Ontario secondary schools. Educational 21(3), 40-43. -
Technology.
Hal1, K.A. & Mitzel, H.E. (1974). A pilot program of high school computer-assisted instruction mathe¬ matics courses. Journal of Educational Technoloov Systems. 2(3), 157-174.
Handerson, R. W. , Landesman, E. M., & Kachuck, 1.(1985). Computer-video instruction in mathematics: field test of an interactive approach. Journal for Re¬ search rn Mathematics Education. .16(3) , 207-224.
Horner, C. M. & Maddux, C. D. (1985). The effect of Logo on attributions toward success. Computers in the Schools. 2(2-3), 45-54.
Horton, J. & Ryba, K. (1986). Assessing learning with Logo: a pilot study. The Computing Teacher. 14 (’ll. 24-28.
Howe, J.A.M., O'Shea, T. & Plane F. Teaching mathematics through Logo programming: an evaluation study, in Lewis, R. and Tagg, E.D eds. (1980). Computer assisted Learning: Scope. Progress and Limits. New York: North-Holland Publishing Co.
Hughes, H. S. (1970, February). An experimental program in computer-assisted mathematics. The Bulletin of the National Association of Secondary School Principals. No. 343, 85-90.
Jamison, D. T., et al. Cost and performance of computer- assisted instruction for education of disadvantaged children. in Froomkin, J. T., Jamison, D. T., & Radner, R. eds. (1976) Education As an Industry. Cambridge, Mass: Ballinger Publishing.
Kraus, W. H. (1981, March). Using a computer game to reinforce skills in addition basic facts in second grade. Journal for Research in Mathematics Educa¬
tion . 12.(2), 152-155.
159

Kurland, D. M. Pea R. D., Clement, C., & Mawby, R. (1986). A study of the development of programming ability and thinking skills in high school stu¬ dents. Journal of Educational Computing Research. 2(4), 429-458. -
Lehrer, R. & Randle, L. (1987). Problem solving, meta- cognition and composition: the effects of inter¬ active softrare for first-grade children. Journal
Educational Computing Research, 3.(4) , 409-427.
Many, W.A., Lockard, J., Abrams, P.D., & Friker, W. (1988). The effect of learning to program in Logo on reasoning skills junior high school students. Journal of Educational Computing Research. A(?\ . 203-213. '
McClurg, P.A. & Chaille, C. (1987). Computer games: environments for developing spatial cognition? Journal of Educational Computing Research. 2(1), 95-111.
Mevarech, Z. R. (1985). Computer—assisted instruction methods: a factorial study within mathematics dis¬ advantaged classrooms. The Journal of Experimental Education. 54.(1), 22-27.
Mevarech, Z. R. & Rich, Y. (1985). Effects of computer- assisted mathematics instruction on disadvantaged pupils1 cognitive and affective development. The Journal of Educational Research. 79.(1) , 5-11.
Poore, J.H. & Hamblen, J.W. (1983, Summer). Improvement of basic mathematical skills with PLATO: an experi¬ ment. AEDS Journal. 244-259.
•
Rieber, L. P. (1987). Logo and its promise: a research report. Educational Technology. 27.(2) , 12-16.
Saracho, 0. N. (1982). The effects of a computer- assisted instruction program on basic skills achievement and attitudes toward instruction of Spanish-speaking migrant children. American Educa¬ tional Research Journal, 19(2), 201-219.
Saunders, J. & Bell, F. H. (1980). Computer-enhanced algebra resources: their effects on achievement and ettitndes.International Journal of Mathematical Education in Science and Technology, 11(4),465-473.
160

Thompson, A. D. & Wang, H. C. (1988). Effects of a Loan
ceDt°W°Tnf °n1St“d6nt ability to transfer a con- 9
iOK 33^347:' ~ E^03*10"31 Sg-fputing Research.
Turner, s of a
school
t nan ?d' *? * L* (1988). Cognitive effects Logo-enriched mathematics program for middle
students. Journal of Educational Research, 4(4), 443-452.
Computing
Watkins, M.W. (1986). Microcomputer-based math instruc-
Behavior, 2.StUdents^• S-^ters in Human
Watkins, M. W. s Webb, c. (1981). Computer assisted
instruction with learning disabled students. cational Computer Magazine. 1(3), 24-27
Edu-
ERIC Documents;
Dalton, D. W. (1986, January). A comparison of the ef¬
fects of Logo use and teacher-directed problem-
solving instruction on the problem-solving skills, achievement, and attitudes of low, average, and high achieving junior high school learners. ERIC: ED 267-761.
Dunn, A. ed. (1974). Computer-assisted instruction pr
gram: a three year report covering July 1, 1971
through June 30, 1974. Rockville, MD: Montgomery County Public Schools. ERIC: ED 100-361.
Durward, M. L. (1973). Computer-assisted instruction in arithmetic at South Hill Elementary School. ERIC: ED 088-915.
Hotard, S.R. & Cortez, M.J. (1983). Computer assisted
instruction as an enhancer of remediation. ERIC: ED 236-262.
Lavin, R. J., et al. (1981). Evaluation of the computer assisted instruction title 1 project, 1980-81.
ERIC: ED 233-122.
Morgan, C. E. et al. (1977). Evaluation of computer-
assisted instruction, 1975-76. Montgomery County
Public Schools, Rockville, MD. ERIC: ED 139-655.
161

Palmer, H. (1973). Three evaluation reports of computer
assisted instruction in drill-and-practice mathe¬ matics. ERIC: Ed 087-422.
Spivey, P. M. (1985). The effects of computer-assisted
instruction on student achievement in addition and subtraction at first grade level. ERIC: ED 263-874.
Dissertation:
Abram, S. L. (1984). The effect of computer assisted
instruction on first grade phonics and mathematic achievement computation. Doctoral dissertation, Northern Arizona University.
Casner, J. L. (1977). A study of attitudes toward
mathematics of eighth grade students receiving com¬ puter assisted instruction and students receiving
conventional classroom instruction. Doctoral dis¬ sertation, the university of Kansas.
Cole, W. L. (1971). The evaluation of a one-semester
senior high school mathematics course designed for acquiring basic mathematics skills using computer- assisted instruction. Doctoral dissertation, Wayne
State University.
Confer, R. W. (1971). The effect of one style of com¬
puter assisted instruction on the achievement of students who are repeating general mathematics.
Doctoral dissertation, University of Pittsburg.
Cranford, H. R. (1976) . A study of the effects of com¬
puter-assisted instruction in mathematics on the
achievement and attitude of pupils in grade 5 and 6
in a rural setting. Doctoral dissertation,
University of Southern Mississippi.
Davidson, M. S. (1984) . Computer assisted instruction in arithmetic for specific learning disabilities stu¬
dents in the elementary school. Doctoral disserta¬
tion, the University of South Florida.
Davidson, R. L. (1985). The effectiveness of computer assisted instruction of chapter I students in sec
ondary schools. Doctoral dissertation, The Uni
versity of Tennessee.
162

aStSslsted inst' (I®82)• The effects of computer as- insfn^H t™tl°n as a suPPlement to classroom ti^ Doctor1? ^adln9 comprehension and arithme- University dissertation, North Texas state
Englebert, B. B. (1983). A study of the effectiveness f microcomputer-assisted math instruction on the
disabled'^?? ?f ®elected secondary specific learning ?? S ? ?? ??' Doctoral dissertation, Universi? ty of Southern Mississippi.
EVanSfflinri ?;VJrV-1984)-’ S°me effects of L°go program¬ ming instruction with fourth grade children (pro¬ blem solving, math attitudes, motivation). Doctoral dissertation, University of Virginia.
Foley, M. U. (1984). Personal computers in high school general mathematics: effects on achievement, atti¬ tude, and attendance. Doctoral dissertation, the University of Maryland.
Ford, M. S. (1984). The effects of computer programming on the problem solving abilities of sixth grade students. Doctoral dissertataion, Arizona State University.
Foster, T. E. (1972). The effect of computer program¬ ming experiences on student problem solving be¬ haviors in eighth grade mathematics. Doctoral dis¬ sertation, the University of Wisconsin.
Franke, R. J. (1987). An evaluation of a computer- assisted instruction program in seventh grade mathematics: implications for curriculum planning. Doctoral dissertation, the State University of New York at Buffalo.
Hallett, M. (1984). The effectiveness of microcomputer assisted instruction for fourth, fifth and sixth grade students in spelling, language skill develop¬ ment, and math. Doctoral dissertation, University of Idaho.
Hoffman, I. J. (1971). Effects of computer application on generalization skills and achievement in a second year algebra course. Doctoral dissertation, University of Denver.
Ignatuk, N. Jr. (1985) . An Analysis of the effects of computer programming on analytical and mathematical skills of high school students. Doctoral disserta¬
tion, Temple University.
163

Katz, S. M. (1971). a comparison of two computer based methods for the learning of algebra with traditional methods for the learning of algebra and a comparison of the two computer based methods. Doctoral dissertation, Temple University.
Levy, M.H. (1985). An evaluation of computer assisted instruction upon the achievement of fifth grade students as measured by standardized tests. Doctor¬ al dissertation, University of Bridgeport.
Mandelbaum, J. (1973). A study of the effects, on achievement and attitude, of the use of the com¬ puter as a problem solving tool with low performing tenth grade students. Doctoral dissertation, Temple University.
Marty, J. F. (1986). Selected effects of a computer game on achievement, attitude, and graphing ability in second school algebra. Doctoral dissertation, Oregan State University.
Mason, M.M.T. (1984). A longitudinal study of the ef¬ fects of computer assisted instruction on the mathematics achievement of the learning disabled and educable mentally retarded. Doctoral disserta¬ tion, the University of Iowa.
Modisett, D. M. (1980). Effects of computer-assisted instruction on achievement in remedial secondary mathematical computation. Doctoral dissertation, Fordham university.
Opera, J. M. (1984). The effects of computer program¬ ming on a student's mathematical generalization and understanding of variables. Doctoral dissertation, The Ohio State University.
Payne, C. I. (1979). The effects of computer mathe¬ matics instruction on achievement, problem solving and attitudes in a public high school. Doctoral dissertation, Indianna University at Bloomington.
Pflug, E. A. (1987) . A comparison of the effect of com- puter-assisted-instruction and same-age peer-tutor¬ ing on math achievement of fourth grade students. Doctoral dissertation, Oregon State University.
Philips, C. A. (1972). A study of the effect of com¬ puter assistance upon the achievement of students utilizing a curriculum based on individually pre¬ scribed instruction mathematics. Doctoral disser¬
tation, Temple University.
164

high school mathematics. E the University of Michigan.
Shanoski, L. A. (1986). An An analysis of the effective¬ ness of using microcomputer assisted mathematics instruction with primary and intermediate level students. Doctoral dissertation, Indiana University of Pennsylvania.
Todd, W. E. (1985). Effects of computer-assisted in¬ struction on attitudes and achievement of fourth grade students in reading and mathematics. Doctoral dissertation, the North Texas State university.
Vincent, A. T. (1977). The effects of supplementary computer assisted instruction on the mathematics achievement and attitude toward mathematics of EMR high school students. Doctoral dissertation, University of Cincinnati.
165

APPENDIX B
THE LIST OF VARIABLES
I. Subject characteristics
A. Grade level.
1. Elementary school (grades 1-6)
2. Junior high school (grades 7-9)
3. Senior high school (grades 10-12)
4. Unspecified
B. Sex
1. All male
2. All female
3. Mixed
4. Unspecified
C. Student ability level
1. Below average
2. Average
3. Higher than average
4. Mixed
5. Unspecified
D. Socio-economic Status
1. Low
2. Average
3. High
4. Mixed
5. Unspecified
166

II. Characteristics of experimental treatment
A. Modes of computer application in instruction
1. CAI drill and practice
2. Tutorial CAI
3. CAI simulation/gaming
4. CAI problem-solving
5. Computer programming
B. Different roles of computers in classrooms
1. Substitute for traditional instruction in
classroom
Supplement to traditional instruction in
classroom
3. Other
4. Unspecified
C. Location of computers
1. in laboratory
2. in classroom
3. Other
4. Unspecified
D. Duration of treatment
1. by weeks
a. 1-18 week(s)
b. 19-36 weeks
c. 37 weeks and over
167
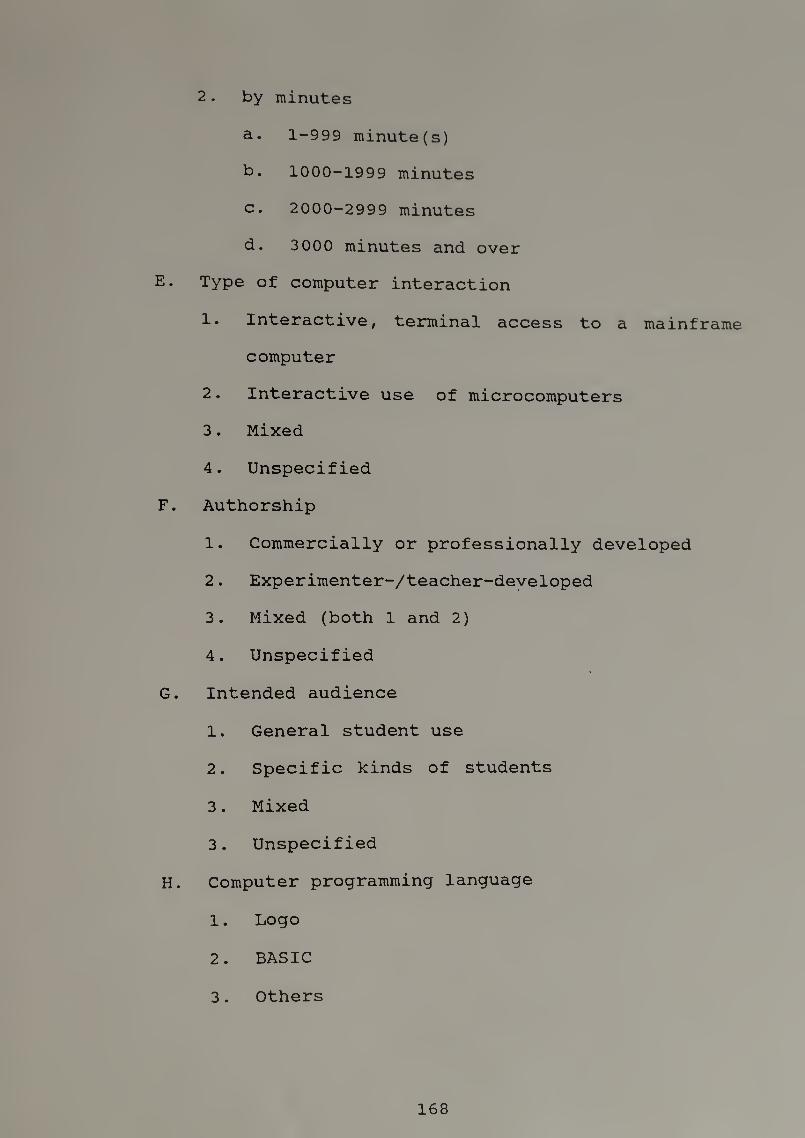
2. by minutes
a. 1-999 minute(s)
b. 1000-1999 minutes
c. 2000-2999 minutes
d. 3000 minutes and over
E. Type of computer interaction
1. Interactive, terminal access to a mainframe
computer
2. Interactive use of microcomputers
3. Mixed
4. Unspecified
F. Authorship
1. Commercially or professionally developed
2. Experimenter-/teacher-developed
3. Mixed (both 1 and 2)
4. Unspecified
G. Intended audience
1. General student use
2. Specific kinds of students
3. Mixed
3. Unspecified
H. Computer programming language
1. Logo
2. BASIC
3. Others
168

I* Size of subjects in treatment group
1. 1-50
2. 51-100
3. 101-200
4. 201-400
5. Over 400
J. Math content
1. Computation
2. Concept/application
3. Combination
K. Math subject
1. Arithmetic
2. Geometry
3. Algebra
4. General math
III. Methodological characteristics of study design
A. Assignment of subjects
1. Random assignment
2. Nonrandom assignment
3. Unspecified
B. Test-author bias
1. Commercial standardized test
2. Experimenter-/teacher-designed test
3. Unspecified
169

C. Historical effect
1. Subjects were taught concurrently in
experimental and control groups.
2. Subjects were not taught concurrently in
two groups.
3. Unspecified
D. Instructor effect
1. Same instructor taught both experimental
and control
groups.
2. Different instructors taught the two
groups.
3. Unspecified
E. Time-on-task
1. Students in experimental group received
regular instruction time plus supplemental
CAI time.
2. Students in experimental group received
same total amount of instructional time
as students in control group.
3. Unspecified
IV. Educational Outcomes
A. Mathematics achievement
B. Problem-solving skills
C. Attitudes toward mathematics/instruction
D. Attitudes toward computers
170
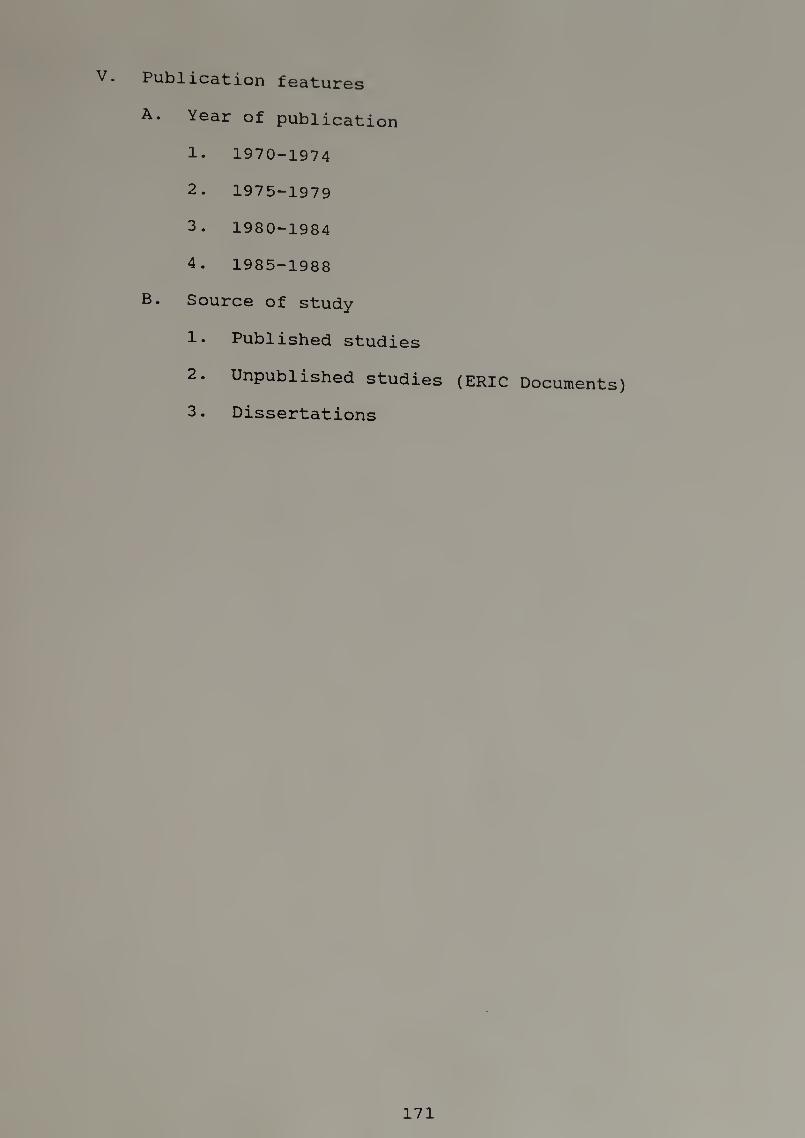
v. Publication features
A. Year of publication
1. 1970-1974
2. 1975-1979
3. 1980-1984
4. 1985-1988
B. Source of study
1. Published studies
2. Unpublished studies (ERIC Documents)
3. Dissertations
171

APPENDIX C
CODING FORM USED IN THE META-ANALYSIS
Variables Column(s)
Study ID number Data set Mode
1-3 4-6 8
Role 9
Location 10
Length of treatment (in Week)
11-13
Length of treatment (in Minutes)
14-17
Type of computer interaction
19
Authorship 20
Intended audience 21
Computer program¬ ming language
22
Value
001-999 001-099
1 = drill/practice CAI 2 = tutorial CAI 3 = simulation/gaming 4 = problem-solving CAI 5 = computer programming 6 = mixed
1 = substitute 2 = supplement 9 = missing value
1 = laboratory 2 = classroom 9 = missing value
number of weeks 999 = missing value
total amount of minutes 9999 = missing value
1 = mainframe 2 = microcomputer 9 = missing value
1 = commercially developed 2 = experimenter-/teacher-
developed 9 = missing value
1 = for general students 2 = for specifal students 9 = missing value
1 = Logo 2 = BASIC 3 = others 9 = missing value
172

Assignment of subject
Grade level 24
Sex 25
Ability level 26
Socio-economic 27 status
Test-author bias 29
Historical effect 30
Instructor effect 31
Time-on-task 32
Source of study 33
1 - random assignment 2 = Nonrandom assignment 9 = missing value
1 = grades 1-6 2 = grades 7-9 3 = grades 10-12 9 = missing value
1 = all male 2 = all female 3 = mixed 9 = missing value
1 = below average 2 = average 3 = higher than average 9 = missing value
1 = low 2 = average 3 = high 9 = missing value
1 = standardized test 2 = experimenter-/teacher-
designed test 9 = missing value
1 = taught concurrently 2 = not taught concurrently 9 = missing value
1 = same instructor 2 = different instructors 9 = missing value
1 = more time 2 = same amount of time 9 = missing value
1 = published studies 2 = ERIC documents 3 = dissertations
Publication year 34 1 = 1970-1974 2 = 1975-1979 3 = 1980-1984 4 = 1985-1988
Size of sample 39-42 number of subjects in treatment group 9999 = missing value
173

Study outcomes
Math content
Math subj ect
Effect Size
44 1 = math achievement 2 = problem-solving skills 3 = attitude vs math/
instruction 4 = attitude vs computers
45 1 = computation 2 = concept/application 3 = combination 9 = missing value
46 1 = arithmetic 2 = geometry 3 = algebra 4 = general math 9 = missing value
48-53 -9.999 to 99.999
174

APPENDIX D
MEANS AND STANDARD ERRORS OF ACHIEVEMENT EFFECT SIZE
FOR DIFFERENT FEATURES OF STUDIES
Study Features_Number of F.Sg Grade Level
Elementary 151 Junior High 58 Senior High 34
Student Ability Level Low 103 middle 22 High 14
Socio-Economic Status Low 51 Middle 32 High 9
Sex Male 38 Female 36
Role of Computer Application Substitute 50 Supplemental 196
Location of Computer Laboratory 82 Classroom 25
Duration in Weeks 1 - 18 104 19 - 36 102 37 & over 35
Duration in Minutes 1 - 999 85 1000 - 1999 46 2000 - 2999 25 3000 & over 15
Computer Interaction Mainframe 127 Microcomputer 113
CAI Program Authorship Commercial 144 Experimenter/Teacher 44 Both 20
Intended Audience General 103 Specific 26
(to be continued)
Effect Size
Mean_SE t-value p-value
.367 .046 7.91 .000*
.466 .093 5.03 .000*
.316 .062 5.06 .000*
.414 .058 7.13 .000*
.149 .129 1.15 .262
.257 .127 2.03 .063
.276 .089 3.09 .003*
.350 .103 3.41 .002*
.322 .098 3.31 .011*
.320 .098 3.25 .002*
.103 .110 .94 .355
.312 .080 3.90 .000*
.397 .043 9.18 .000*
.377 .066 5.67 .000*
.688 .088 7.78 .000*
.428 .058 7.42 .000*
.297 .061 4.89 .000*
.497 .075 6.62 .000*
.320 .074 4.32 .000*
.456 .045 10.19 . 000*
.547 .094 5.81 .000*
.015 .147 .10 .920
.361 .055 6.61 .000*
.411 .052 7.89 .000*
.336 .051 6.65 .000*
.481 .094 5.14 .000*
.556 .086 6.44 .000*
.353 .067 5.30 .000*
.539 .102 5.29 .000*
175

(continue) Programming Language
LOGO 16 BASIC 14 Others 5
Size of Subjects 1 - 50 137 51 - 100 58 101 - 200 15 201 - 400 16 over 400 15
General Treatment Area Computation 85 Concept/Application 88 Combination 70
Specific Subject Area Arithmetic 112 Geometry . 47 Algebra 15 General 69
Type of Test. Standardized 177 Experimenter/Teacher 73
Assignment of Subjects Random 78 Non-random 165
Historical Effect Concurrently 226 Not Concurrently 5
Instructor Effect Same 25 Different 171
Time-on-Task More 63 same 102
Source of Studies Published 92 Unpublished 44 Dissertation 107
Year 'of Publication 1970 -74 39 1975 - 79 47 1980 - 84 56 1985 - 88 101
.409 .110 3.72 .000*
.479 .142 3.37 .005*
.151 .178 -.85 .445
.361 .056 6.43 .000*
.406 .063 6.39 .000*
.377 .123 3.07 .008*
.518 .128 4.05 .001*
.237 .039 6.09 .000*
.428 .067 6.37 .000*
.369 .062 5.96 .000*
.349 .065 5.37 .000*
.432 .046 9.37 .000*
.371 .091 4.08 .000*
.554 .192 2.88 .012*
.276 .078 3.54 .001*
.383 .042 9.03 .000*
.426 .072 5.91 .000*
.312 .062 5.03 .000*
.417 .046 8.98 .000*
.362 .039 9.36 .000*
.601 .364 1.65 .174
.341 .110 3.09 .005*
.382 .044 8.67 .000*
.253 .084 3.01 .004*
.394 .051 7.72 .000*
.433 .062 6.96 .000*
.338 .095 3.54 .001*
.360 .053 6.76 .000*
.457 .103 4.42 .000*
.477 .061 7.80 .000*
.382 .080 4.75 .000*
.313 .061 5.15 .000*
* The null hypothesis, assuming that the mean effect size is zero, is rejected with the probability of Type I error being less than or equal to .05.
176

appendix e
means ANN STANDARD ERRORS.OP PROBLEN-SOLVING EFFECT SIZE mn ---x - OVJL.V 1 IN
FOR DIFFERENT FEATURES OF STUDIES
Study Featurp.fi Grade Level
.Number of ESs Effect iSi?p
Mean SE t-value >-value
Elementary 79 Junior High 42 Senior High 23
Student Ability Level Low 7 middle 18 High 10
Sex Male 6 Female 8
Role of Computer Application Substitute 60 Supplemental 78
Location of Computer Laboratory 29 Classroom 8
Duration in Weeks 1 - 18 51 19 - 36 93
Duration in Minutes 1 - 999 20 1000 - 1999 76 2000 - 2999 9 3000 & over 16
Computer Interaction Mainframe 27 Microcomputer 52
Programming Language LOGO 54 BASIC 27 Others 15
Type of Test Standardized 50 Experimenter/Teacher 92
Assignment of Subjects Random 104 Non-random 42
Historical Effect Concurrently 138 Not Concurrently 8
(to be continued)
.180 .082 2.21 .030*
.236 .091 2.58 . 014* - .006 .061 - .10 .925
.246 .196 1.25 .257 - .075 .110 - .68 .504
.088 .127 .69 .506
.178 .233 .77 .478
.333 .142 2.34 .052
.047 .077 .60 .548
.300 .073 4.08 .000*
.024 .087 .28 .783 -.796 .360 -2.21 .063
.248 .828 3.02 .004*
.134 .069 1.93 .056
-.308 .200 -1.54 .141 .318 .071 4.47 .000* .382 .098 3.90 .005*
- .047 .067 -.71 .489
.175 .087 2.00 .057
.121 .092 1.30 .199
.338 .116 2.92 .005*
.192 .094 2.04 .052
.067 . .68 - .99 .341
.129 .075 1.72 .091
.209 .071 2.94 .004*
.229 .069 3.34 .001*
.038 .067 .56 .576
.190 .054 3.50 .001* -.098 .229 -.43 .681
177

(continue) Instructor Effect
Same Different
Time-on-Task
51 90
.178
.191 .126 .047
1.41 4.04
.164
.000*
More same
Source of Studies
16 54
.279
.184 .190 .091
1.47 2.01
.163
.049*
Published Unpublished Dissertation
Year of Publication
105 7
34
.186 - .160
.205
.069
.124
.070
2.69 -1.29 2.94
.008*
.243
.006*
1970 - 74 1975 - 79 1980 - 84 1985 - 88
15 6 9
116
.272
.092
.100
.171
.110
.158
.124
.064
2.48 .58 .80
2.68
.026*
.585
.446
.008* * The null hypothesis,
is rejected with the or equal to .05.
assuming that the mean etfect size is zero, probability of Type I error being less than
178
REFERENCES
Athappilly K.K. (1978). a meta-analysis of the effects
?fona?e^ath:-atiCS in comParision with tra“! system ma^he™atl°s in the american educational
University dissertation, Florida state
Athappilly K K. S Kofel, J. w. (1983). Acomputer-
a” yS1S °f.the effeots Of modern mathe- Educationa?'°™paFls°1? Wlth traditional mathematics. 485-493 Evaluation and Policy Analyses. 5(4) ,
Bangert-Drowns, R. L., Kulik, J. A., s Kulik, c. c. (1985). Effectiveness of computer-based education in secondary school. Journal of ComDuter-R^pH Instruction. 12(3), 59-68. --
Bar On, E. (1987). A programming approach to mathe¬ matics. Computer Education, .10(4) , 393-401.
Battista, M. T. (1987). The effectiveness of using Logo to teach geometry to preservice elementary teachers. School Science and Mathematics r 87.(4) , 286-296.
Becker, H. J. (1988) . The impact of computer use on children's learning: what research has shown and what it has not. Center for Research on Elementary and Middle Schools. The John Hopkins University.
Bell, F. H. (1978, May). Can computers really improve school mathematics? Mathematics Teacher. 428-433.
Blosser, P. E. (1986). What research says meta-analysis research on science instruction. School Science and Mathematics. £6(2), 166-170.
Blume, G. W. (1984, April). A review of research on the effects of computer programming on mathematical problem solving. Paper presented at the meeting of the American Educational Research Association, New Orleans.
Bok, D. (1985, May-June). Looking into education's high- tech future. Harvard Magazine. 29-38.
179
Bozeman, W. C. & House, J. E. (1988).
in education: the second decade, Horizons Education, 15(6), 82-86.
Microcomputers Technological
Bracey, G. W. (1982, November/December),
education: what the research shows. Learnings. 51-54.
Computer in Electronic
Bracey, G. (1988). Computers and learning: the research
jury is still out. Electronic Learning, 8(2),28;30.
Bright, G. W. (1983). Explaining efficiency of computer
assisted instruction. AEDS Journal . 16 (3), 144-152.
Bright, G. W. (1988). Computers and learning: the re¬ search jury is still out. Electronic Learning. 8(2), 28 & 30.
Brown, J. & Brown, L. (1987). Meta-analysis: unraveling
the mystery of research articles. The Volta Review 89(7), 339-345.
Burns, P. K. (1981). A quantitative synthesis of
research findings relative to the pedagogical ef¬
fectiveness of computer-assisted mathematics in¬ struction in elementary and secondary schools. Doctoral dissertation, University of Iowa.
Burns, P.K. & Bozeman, W.C. (1981). Computer-assisted
instruction and mathematics achievement: is there a relationship? Educational Technology. 21(10), 32-39.
Burns, R. B. & Lash; A. A. (1986). A comparison of
activity structures during basic skills and
problem-solving instruction in seventh-grade mathe¬ matics. American Educational Research Journal, 23(3), 393-414.
Campbell, P. F. (1988). Microcomputers in the primary
mathematics classroom. Arithmetic Teacher, 35.(6) ,
22-30.
Carlberg, C. G. & Walberg, H. J. (1984) . Techniques of research synthesis. The Journal of Special Educa¬
tion . 18(1), 11-26.
Chamber, J. A. & Sprecher, J.W. (1980). Computer as¬ sisted instruction: current trends and critical
issues. Communications of the ACM, 23.(6), 332-342 .
180

Charp, s. (1981). struction.
57(2), 13-22
Effectiveness of computers in in-
Y^gwPolnts in leaching and Learninn
Clark, R. e. DUter-h*^8^ *4. for confounding in com- puter based instruction studies: analyzing the
Techno?nlYSTS* Mucational Communication Technology Journalr 33(4), 249-262.
and
Clements, D. H, & Gullo, D. F. (1984). puter programming on young children Journal of Educatinnai
Effects of com- s cognition.
Psychology, 76 (6) ,1051-1058
Cohen, P.A. anal v«=i c^b<plln?/ B*J*' & Kuli*, J. A. (1981). analysis of outcome studies of visual-based
A meta- in-
^S?nk!iy7^tT ** Technology
&^CO°5' M*S* <1982)- Meta-analyses and the effects of various reward systems: some differ- ent condusions from Johnson et al. Psvchol oai r.ai Bulletin, 92 (1), 176-183. —-^
Curlette, W. L. (1987) . The meta-analysis effect size
calculator: basic program for reconstructing
unbiased effect sizes. Educational and Psvchol ocri- cal Measurement. 7(1), 107-109.
Dudley-Marling, C. & Owston, R. D. (1988). Using micro¬ computers to teach problem solving: a critical review. Educational Technology r 28.(7), 27-33.
Edwards, J. , et al. (1975, November). How effective is
CAI? a review of the Research. Educational Leader¬ ship, 147-151.
Engel & Payne, Jr. (1981). Computer simulation in
secondary school mathematics. Viewpoints in Teaching and Learning. 57(2), 114-128.
Feleman, K. A. (1971) . Using the work of others: some
observation of reviewing and integration. Sociology of Education. 44. 86-102.
Gallini, J. K. (1987). A comparison of the effects of
Logo and a CAI learning environment on skills ac¬
quisition. Journal of Educational Computing Re¬
search. 3(4), 461-477.
Gillingham, M. G. & Guthrie, J. T. (1987) . Relationships
between CBI and research on teaching. Contemporary
Educational Psychology. 12.(3), 189-199.
181

Glass, G. V c=vni-hoc-i i19^2) * Meta"analysis: an approach to the synthesis of research results. Journal in Science Teachingf 19(2), 93 — 112.
of Research
Glass, G. V. (1976, November).
meta-analysis of research 3-8.
Primary, secondary, and
Educational Researcher,
GlaSS;dG'n«n?UmI"f,riZing effeCt sizes‘ in R°senthal, R. ed. (1980). New directions for methodology of
-ocial behavioral sciences: cruantitativp as¬ sessment of research domains. San Francisco: Jossey-Bass Inc., Publishers.
Glass, G.V. Integrating findings: the meta-analysis of research, in Shulman L. S. ed. (1978). Review of research in education. F. E. Peacock Publishers Inc. '
Glass, G. V. , McGaw, B. & Smith, M. L. (1981). Meta-
analysis in social research. Beverly Hills, California: Sage Publications, Inc.
Glass, G. V. & Smith, M. L. (1979) . Meta-analysis of
research on class size and achievement. Educational Evaluation and Policy Analysis. jL(i) , 2-16.
Goldenberg, E.P., Carter, C.J., Stokes, S., & Kelman, P.
(1984) . Computers, education and special needs. Reading, M.A.: Addison-Wesley Publishing Co.
Gorman, H., Jr. (1983). Learning to think by learning
Logo: rule learning in third-grade computer pro¬ grammers. Bulletin of the Psvchonomic Society. 2_1 (3) , 165-167.
Grayson, L. P. (1970). A paradox: the promises and pitfalls of CAI. EDUCOM Bulletin. 1-3.
Greenes, C. (1981, November). The computer in mathe¬ matics education. Mathematics Teacher. 588-589.
Harris, A.L. & Harris, J.M. (1987). Reducing mathematics anxiety with computer assisted instruction. Mathe¬
matics and Computer Education. 21(1), 16-24.
Hartley, S. S. (1977). Meta-analvsis of the effects of
individually paced instruction in mathematics.
Doctoral dissertation, University of Colorado at
Boulder.
182

(lasselbring T s ^966) Researcli on the effectiveness
Hasselbring,
special in
T. S. (1987)
education: what Effective computer use in
i - does the research tell ue;'? 21 H'icrocomnntev, 11 US
2 r1:ino, CA: Apple Computer, Inc. io education.
Hatfield, L. L. (1982). Instructional computing in mathematics teacher education. fLnd Development Journal of Research
in Education, 15(4), 30-44.
Holmes, c. T. (1984). Effect size estimation in meta-
lon,
Howe, J., O'Shea, T., & Plane, F. (1979).
mathematics through Logo programming: study. DAI Research Paper. No. 115.
Teaching
an evaluation
HUnteJ/i-J' E*' Schmidt' F- L. & Jackson, G. B. (1982) Mgta-analysis: cumulating research findings across studies. Beverly Hills, CA: Sage Publication^
Jackson, G. B. (1980). Methods for integrative reviews Review of Educational Research. 50.(3), 438-460.
Jamison, D. T. , Suppes, P. & Wells, S. (1974). The ef¬
fectiveness of alternative instructional media: a survey. Review of Educational Research, 4_4, 1-61.
Kavale, K. A. (1984). Potential advantages of the meta¬ analysis technique for research in special educa¬ tion. The Journal of Special Education. 18(1), 61-72.
Kavale, K. A. & Glass, G. V. (1981). Meta-analysis and
the integration of research in special education. Journal of Learning Disabilities. 14(9)/ 531-538.
Komoski, P. K. (1984, December). Educational computing:
the burden of insuring quality. Phi Delta Kappan. 244-248.
Kontos, B. (1984-1985). Instructional computing: in
search of better methods for the production of CAI
lessons. Journal of Educational Technoldcv systems.
13(1), 3-14.
183

KraS"dIvelot>ment “jtterer' J- (1984). Logo and the ,,, pment of general problem-solving skills The
Journal of Educational Research,J, —
Kulik, C.C., Kulik, J.A., & Shwalb, B.J. (1986). The
effectiveness of computer-based adult education:
Research1131,^1'5- 2ifzf§|1 31 Computing
Kulik, J. A.
Effects school 75(1),
, Bangert, R. L., & Williams, G. W. (1983).
of computer-based teaching on secondary students. Journal of Educational Psychology. 19—26.
1 k' ‘J* t’ ' Cohen' P- A., & Ebeling, B. J. (1980). Effectiveness of programmed instruction in higher education: a meta-analysis of findings. Educational Evaluation and Policy Analysis. 2.(6) , 51-64.
Kulik, J. A. & Kulik, C. C. (1987). Computer-based
instruction: what 200 evaluations say. ERIC* ED 285-521.
Kulik, J. A. & Kulik, C. C. (1987) . Review of recent
research literature on computer-based instruction. Contemporary Educational Psychology. 12(3^.222-230.
Kulik, J. A. , Kulik, C. C. , & Bangert-Drowns, R. L.
(1985). Effectiveness of computer-based education in elementary schools. Computers in Human Behavior. 1(1), 59-74.
Kulik, J. A., Kulik, C. C., & Cohen, P. A. (1980). Ef¬
fectiveness of computer-based college teaching: a
meta-analysis of findings. Review of Educational Research, 50.(4), 525-544.
Light, R. T. & Smith, P. V. (1971) . Accumulating evi¬ dence procedures for resolving contradictions among
different research studies. Harvard Educational
Review. 41. 429-471.
Loyd, B. H. & Gressard, C. (1984, Winter). The effects of sex, age, and computer experience on computer
attitudes. AEDS Journal, 67-77.
MacArthur, C. A., Haynes, J. A. & Malouf, D. B. (1986).
Learning disabled students engaged time and class¬
room interaction: the impact of computer assisted
instruction. Journal of Educational Computing
Research. 2.(2), 189-198.
184
Manion, M. H. (1985,
and interaction applications.
January) . CAI inodes of
: new perspectives for Educational Technology,
delivery expanding 25-28.
McGaw, B. & Glass, G,
for effect size' tional Research
.V. (1980). Choice of the metric in meta-analysis. American !^°urnal, 12(3), 325^3W.
Educa-
Merrill, M. D. (1988)
ential modes in cationa1 Techno!
. The role of tutorial and experi- mtelligent tutoring systems. Edu-
28(7), 7-13. -
Morris, J. m.
toward a 12-14.
(1983 , May) .
new direction. Computer-aided instruction:
Educational Technology,
* ”^ber9' ?. J- (1987). Comparative ef- te^ts of computer-assisted instruction: a synthesis
search .*"m? ,~ BdPCati°nal- Smmtim Rec
Niemiec, R. p. &
achievement Educational
Walberg, H. J. (1985). Computers and
m the elementary schools. Journal of Computing Research, 1(4), 435-440.
Overton, V. (1981, Spring). Research in
computing and mathematics education. Teaching and Learningr 23-36.
instructional Viewpoints in
Papert, S. (1980). Mmdstorms: children, computers, and powerful Ideas. New York: Basic Books, Inc. Publishers.
Papert, S., Watt, D., diSessa, A., & Weir, S. (1979).
£-inai report of the Brookl ine Logo proj ect. part II; project summary and data analysis. MIT Logo Memo #53.
Pachter, S. N. (1979). A computer assisted tutorial
module for the teaching the factoring of second degree polynomials to regents level ninth year
mathematics students. Doctoral dissertation, Columbia University Teachers College.
Pea, R. D. (1983). Logo programming and problem solving,
Technical Report No. 12. New York: Bank Street College of Education, Center for Children and Technology.
Ponte, J. et al. (1986). Evaluation of an instructional
computing inservice course for elementary and
middle school teachers. School Science and Mathe¬
matics . 86(5), 375-385.
185

Roblyer, M. D. , Castine, W. H. , & King, F. J. (1988).
Assessing the impact of computer-based instruction. Computers in the Schools. 5(3/4), 1-149.
Ross, P. & Howe, J. Teaching mathematics through pro¬ gramming: ten year on. in Lewis, B. & Tagg, D. ed. (1981). Computers in Education. New York: North- Holland Publishing Company.
Samson, G.E., Niemiec, R., Weinstein, T. & Walberg, H.J.
(1986). Effects of computer-based instruction on secondary school achievement: a quantitative syn¬ thesis. AEDS Journal. 19(4), 312-326.
Schaefer, L. & Sprigle, J. E. (1988). Gender differ¬
ences in the use of the Logo programming language. Journal of Educational Computing Research. 4(1), 49-55.
Sekyra, F. & Loree, M. R. (1970, October). Taped in¬
struction effects on problem-solving skills of seventh-grade children. The Journal of Educational Research. 64. 86-93.
Shapiro, D. A. & Shapiro, D. (1982). Meta-analysis of comparative therapy outcome studies: a replication and refinement. Psychological Bulletin. 92(3), 581-604.
Shively, J. E. (1984). Computer utilization in educa¬ tion: problems and prerequisites. AEDS Journal.
17(3), 24-34.
Shuard, H. Contemporary trends in primary-school mathe¬
matics: implications for teacher education. in Morris, R. ed. (1984). Studies in Mathematics Edu¬
cation: The Mathematical Education of Primary-
school Teachers. 3, 23-50.
Sindelar, P. T. & Wilson, R. J. (1984) . The potential effects of meta-analysis on special education prac¬
tice. The Journal of Special Education. 18(1),
81-92 .
Slavin, R. E. (1984) . Meta-analysis in education: how has it been used? Educational Research. .13.(8) ,
6-15.
Splittgerber, F. L. (1979). Computer-based instruction:
a revolution in the Making? Educational Technology,
19(1), 20-25.
186

Stock, W. A. et
thesis: a
analysis.
al. (1982, July). Rigor in data case study of reliability in meta- Educational, Researcher. 10-14; 20
syn-
Stone, c.L. studies 51(4),
A meta-analysis of advance organizer • Journal of Experimental Education. 194-199. -'
Suydam, M. N. (1986). An overview of
puters in mathematics education ED 276-629. '
research: com- k-12. ERIC:
Swigger, K. M.
systems: a (1985, March/April). Intelligent tutoring tutorial. AEDS Monitor, 6-9.
Thomas, D. B. (1979, Spring).
computer—assisted instruction AEPS Journal. 103-116.
The effectiveness of in secondary schools.
Vmsonhaler, J. F. & Bass, R. k. (1972). A summary of
ten major studies on CAI drill and practice. Educa¬ tional Technology, 12(7), 29-32.
187


![Innovative Methods Computer Assisted Instruction [ CAI ]](https://static.fdocuments.in/doc/165x107/56812db6550346895d92e888/innovative-methods-computer-assisted-instruction-cai-.jpg)

