The effectiveness and costs of population interventions … · 1 The effectiveness and costs of...
35
1 The effectiveness and costs of population interventions to reduce salt consumption Background paper prepared by Bruce Neal with assistance from Wu Yangfeng and Nicole Li to the WHO Forum and Technical meeting on "Reducing Salt Intake in Populations" 5–7 October 2006 Paris, France Author for correspondence Dr Bruce Neal The George Institute for International Health PO Box M201 Missenden Road Sydney, NSW 2050, Australia Tel: +612 9993 4558 Fax: +612 9993 4502 E-mail [email protected]
Transcript of The effectiveness and costs of population interventions … · 1 The effectiveness and costs of...
1
The effectiveness and costs of population interventions to reduce salt consumption Background paper prepared by Bruce Neal with assistance from Wu Yangfeng and Nicole Li to the WHO Forum and Technical meeting on "Reducing Salt Intake in Populations" 5–7 October 2006 Paris, France
Author for correspondence Dr Bruce Neal The George Institute for International Health PO Box M201 Missenden Road Sydney, NSW 2050, Australia Tel: +612 9993 4558 Fax: +612 9993 4502 E-mail [email protected]

2
WHO Library Cataloguing-in-Publication Data : Neal, Bruce. The effectiveness and costs of population interventions to reduce salt consumption / prepared by Bruce Neal with
assistance from Wu Yangfeng and Nicole Li
1. Diet, Sodium-restricted - utilization. 2.Diet, Sodium-restricted - economics. 3.Cardiovascular diseases - prevention and control. 4.Hypertension - prevention and control. 5.Cost-benefit analysis. I.Yangfeng, Wu. II.Li, Nicole. III.World Health Organization. IV.Title. ISBN 978 92 4 159592 8 (NLM classification: WB 424)
© World Health Organization 2007
All rights reserved. Publications of the World Health Organization can be obtained from WHO Press, World Health Organization, 20 Avenue Appia, 1211 Geneva 27, Switzerland (tel.: +41 22 791 3264; fax: +41 22 791 4857; e-mail: [email protected]). Requests for permission to reproduce or translate WHO publications – whether for sale or for noncommercial distribution – should be addressed to WHO Press, at the above address (fax: +41 22 791 4806; e-mail: [email protected]).
The designations employed and the presentation of the material in this publication do not imply the expression of any opinion whatsoever on the part of the World Health Organization concerning the legal status of any country, territory, city or area or of its authorities, or concerning the delimitation of its frontiers or boundaries. Dotted lines on maps represent approximate border lines for which there may not yet be full agreement. The mention of specific companies or of certain manufacturers’ products does not imply that they are endorsed or recommended by the World Health Organization in preference to others of a similar nature that are not mentioned. Errors and omissions excepted, the names of proprietary products are distinguished by initial capital letters. All reasonable precautions have been taken by the World Health Organization to verify the information contained in this publication. However, the published material is being distributed without warranty of any kind, either expressed or implied. The responsibility for the interpretation and use of the material lies with the reader. In no event shall the World Health Organization be liable for damages arising from its use.
The named authors alone are responsible for the views expressed in this publication.
3
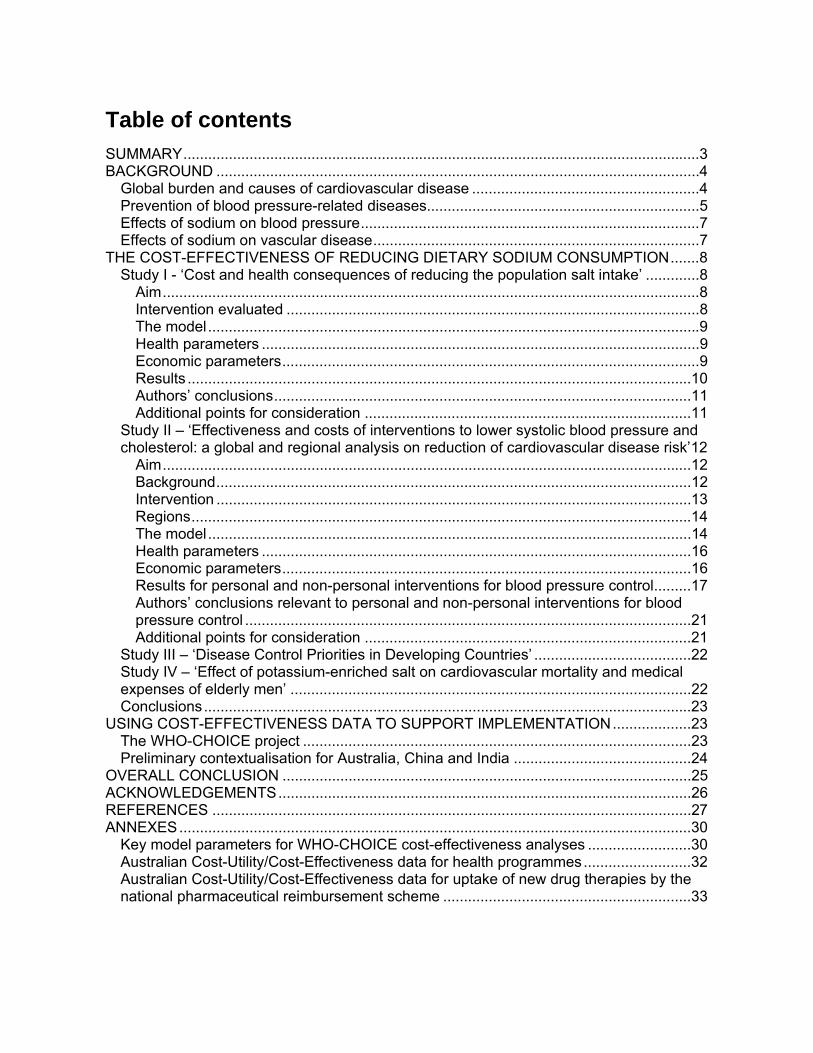
Table of contents SUMMARY.............................................................................................................................3 BACKGROUND .....................................................................................................................4
Global burden and causes of cardiovascular disease .......................................................4 Prevention of blood pressure-related diseases..................................................................5 Effects of sodium on blood pressure..................................................................................7 Effects of sodium on vascular disease...............................................................................7
THE COST-EFFECTIVENESS OF REDUCING DIETARY SODIUM CONSUMPTION.......8 Study I - ‘Cost and health consequences of reducing the population salt intake’ .............8
Aim..................................................................................................................................8 Intervention evaluated ....................................................................................................8 The model.......................................................................................................................9 Health parameters ..........................................................................................................9 Economic parameters.....................................................................................................9 Results ..........................................................................................................................10 Authors’ conclusions.....................................................................................................11 Additional points for consideration ...............................................................................11
Study II – ‘Effectiveness and costs of interventions to lower systolic blood pressure and cholesterol: a global and regional analysis on reduction of cardiovascular disease risk’12
Aim................................................................................................................................12 Background...................................................................................................................12 Intervention ...................................................................................................................13 Regions.........................................................................................................................14 The model.....................................................................................................................14 Health parameters ........................................................................................................16 Economic parameters...................................................................................................16 Results for personal and non-personal interventions for blood pressure control.........17 Authors’ conclusions relevant to personal and non-personal interventions for blood pressure control ............................................................................................................21 Additional points for consideration ...............................................................................21
Study III – ‘Disease Control Priorities in Developing Countries’ ......................................22 Study IV – ‘Effect of potassium-enriched salt on cardiovascular mortality and medical expenses of elderly men’ .................................................................................................22 Conclusions......................................................................................................................23
USING COST-EFFECTIVENESS DATA TO SUPPORT IMPLEMENTATION...................23 The WHO-CHOICE project ..............................................................................................23 Preliminary contextualisation for Australia, China and India ...........................................24
OVERALL CONCLUSION ...................................................................................................25 ACKNOWLEDGEMENTS....................................................................................................26 REFERENCES ....................................................................................................................27 ANNEXES............................................................................................................................30
Key model parameters for WHO-CHOICE cost-effectiveness analyses .........................30 Australian Cost-Utility/Cost-Effectiveness data for health programmes..........................32 Australian Cost-Utility/Cost-Effectiveness data for uptake of new drug therapies by the national pharmaceutical reimbursement scheme ............................................................33
3
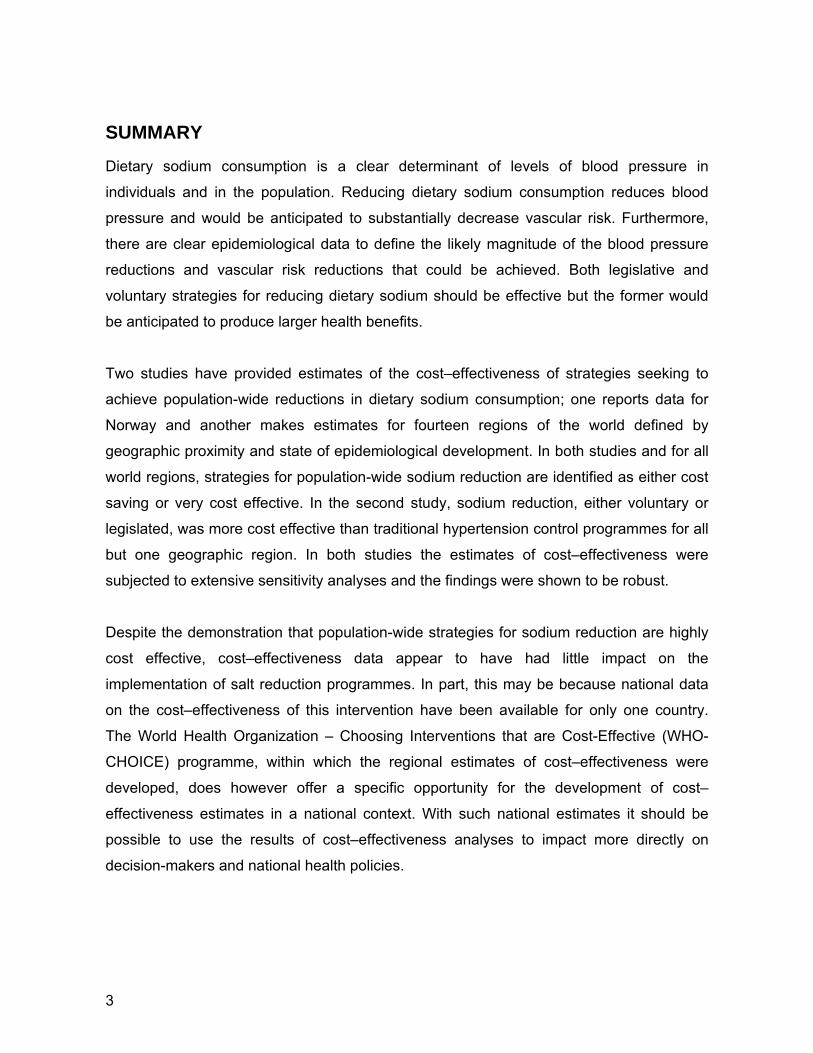
SUMMARY
Dietary sodium consumption is a clear determinant of levels of blood pressure in
individuals and in the population. Reducing dietary sodium consumption reduces blood
pressure and would be anticipated to substantially decrease vascular risk. Furthermore,
there are clear epidemiological data to define the likely magnitude of the blood pressure
reductions and vascular risk reductions that could be achieved. Both legislative and
voluntary strategies for reducing dietary sodium should be effective but the former would
be anticipated to produce larger health benefits.
Two studies have provided estimates of the cost–effectiveness of strategies seeking to
achieve population-wide reductions in dietary sodium consumption; one reports data for
Norway and another makes estimates for fourteen regions of the world defined by
geographic proximity and state of epidemiological development. In both studies and for all
world regions, strategies for population-wide sodium reduction are identified as either cost
saving or very cost effective. In the second study, sodium reduction, either voluntary or
legislated, was more cost effective than traditional hypertension control programmes for all
but one geographic region. In both studies the estimates of cost–effectiveness were
subjected to extensive sensitivity analyses and the findings were shown to be robust.
Despite the demonstration that population-wide strategies for sodium reduction are highly
cost effective, cost–effectiveness data appear to have had little impact on the
implementation of salt reduction programmes. In part, this may be because national data
on the cost–effectiveness of this intervention have been available for only one country.
The World Health Organization – Choosing Interventions that are Cost-Effective (WHO-
CHOICE) programme, within which the regional estimates of cost–effectiveness were
developed, does however offer a specific opportunity for the development of cost–
effectiveness estimates in a national context. With such national estimates it should be
possible to use the results of cost–effectiveness analyses to impact more directly on
decision-makers and national health policies.

4
BACKGROUND
Global burden and causes of cardiovascular disease Cardiovascular diseases are a large and growing cause of death and disability in developed and developing
countries (Figure 1) (1–4). These conditions currently account for about 20% of all disability adjusted life
years (DALYs) in developed countries and 8% of DALYs in developing countries. Furthermore, while the
proportion of DALYs due to cardiovascular diseases is projected to remain approximately constant in
developed countries it is anticipated to increase sharply in developing countries (5).
The World Health Report 2002 (5) identified a number of key risk factors and quantified the contribution of
each to the global burden of cardiovascular disease. These risk factors are tobacco use, alcohol
consumption, high cholesterol concentrations, high blood pressure levels, low intake of fruit and vegetables,
insufficient physical activity and elevated body mass index. While the impact of these risks overlaps because
of the multicausality of cardiovascular disease and joint effects of risk factors (6), the risk making the largest
contribution was blood pressure. Worldwide in 2000, about 7.1 million (13%) deaths were calculated to be
attributable to blood pressure levels above an optimum systolic pressure of 115 mmHg (5).
Figure 1: Numbers of cardiovascular deaths (adapted from (5)
There are several key underlying considerations that have led to the predominance of blood pressure
amongst the risks identified for cardiovascular disease. First, the estimates made for the 2002 World Health
Report (5) acknowledged the continuous positive nature of the association of blood pressure with the risks of
vascular disease across a broad range of hypertensive and non-hypertensive levels of blood pressure (7, 8).
Accordingly, these estimates recognize the role of blood pressure in cardiovascular disease causation at all
levels of blood pressure and the full effects of blood pressure on cardiovascular risk. Second, the estimates
of the effects of blood pressure on cardiovascular disease were based on epidemiological studies that
Numbers of cardiovascular deaths estimated for 2002 and projected for 2020 in higher and
lower income countries
2002
2020
20202002
-
10,000,000
20,000,000
30,000,000
40,000,000
Lower income Higher income
5
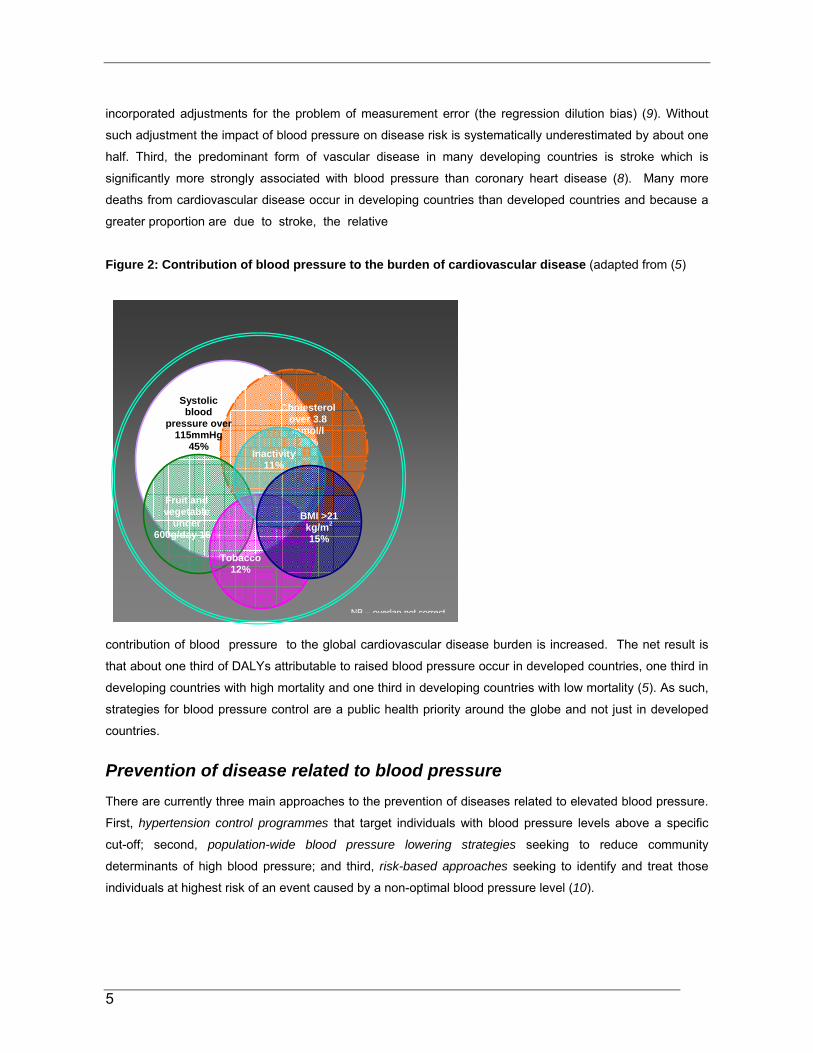
Cholesterol over 3.8 mmol/l
28%
Systolic blood
pressure over 115mmHg
45%
Fruit and vegetable
under 600g/day 16%
Tobacco
12%
Inactivity 11%
BMI >21 kg/m2
15%
NB – overlap not correct
incorporated adjustments for the problem of measurement error (the regression dilution bias) (9). Without
such adjustment the impact of blood pressure on disease risk is systematically underestimated by about one
half. Third, the predominant form of vascular disease in many developing countries is stroke which is
significantly more strongly associated with blood pressure than coronary heart disease (8). Many more
deaths from cardiovascular disease occur in developing countries than developed countries and because a
greater proportion are due to stroke, the relative
Figure 2: Contribution of blood pressure to the burden of cardiovascular disease (adapted from (5)
contribution of blood pressure to the global cardiovascular disease burden is increased. The net result is
that about one third of DALYs attributable to raised blood pressure occur in developed countries, one third in
developing countries with high mortality and one third in developing countries with low mortality (5). As such,
strategies for blood pressure control are a public health priority around the globe and not just in developed
countries.
Prevention of disease related to blood pressure There are currently three main approaches to the prevention of diseases related to elevated blood pressure.
First, hypertension control programmes that target individuals with blood pressure levels above a specific
cut-off; second, population-wide blood pressure lowering strategies seeking to reduce community
determinants of high blood pressure; and third, risk-based approaches seeking to identify and treat those
individuals at highest risk of an event caused by a non-optimal blood pressure level (10).

6
Hypertension control programmes have been the mainstay of blood pressure management for decades (11–
13) but are now widely considered to be a relatively inefficient use of resources (14). Blood pressure levels
alone are a poor discriminator of the risk of a vascular event and hypertension control programmes result in
the treatment of large numbers of individuals at low risk. While some drug-based blood pressure lowering
therapies are now very low cost, physician time is expensive and clinical hypertension management remains
relatively costly. In addition, individuals at high risk of events related to blood pressure but with ‘normal’
blood pressure levels are denied therapy by such programmes, despite having far more to gain from
treatment than individuals with uncomplicated hypertension (15, 16).
Population-wide blood pressure lowering strategies seek to achieve relatively small reductions in blood
pressure, but by achieving these amongst everyone in the population, achieve large health gains (10). The
population-wide approach involves risk factor modification in everyone but gains most of its benefits from the
blood pressure reductions achieved in people at moderate and high risk. Huge numbers of individuals at low
risk must also be covered by population-wide programmes to achieve these results and in the short and
medium term the treatment of such individuals is inefficient. If a longer-term view is taken it can be argued
that population-wide approaches to blood pressure control that include lower risk younger individuals will
reap large benefits. In the case of sodium reduction, the progressive rise of blood pressure with age
attributable to sodium might be attenuated with significant numbers of disease events averted many decades
later (17). The cost of the intervention is key to population-wide approaches to disease control because such
large numbers of individuals must be included in the programme.
Risk-based approaches to cardiovascular disease prevention have gained considerable credence over the
last two decades (18). Risk-based approaches embrace the multicausality of cardiovascular diseases and
the joint effects of risk factors (6). Individuals are selected for blood pressure lowering on the basis of their
risk of a cardiovascular event estimated by an assessment of all their cardiovascular risk factors. While blood
pressure levels contribute to this assessment the decision to recommend blood pressure lowering
interventions is heavily influenced by the levels of other vascular risk factors. The precise combination and
contribution of other risk factors varies between risk calculators but may include age, sex, diabetes, lipid
levels, left ventricular hypertrophy and smoking. Risk-based approaches are a very efficient means of
preventing events in the short term but are profoundly influenced by age which is the strongest predictor of
the risk of cardiovascular death in most models. This results in the majority of treatments being allocated to
the elderly and the approach has been criticized for failing to adequately take into account the long-term
effects of moderate elevations of risk factors and the health gains that might be accrued from their lowering.
Reduction in dietary sodium consumption could clearly contribute to all three of these approaches to the
control of diseases related to elevated blood pressure, but in practice it is to population-wide approaches that
it has the most to offer. Significant or sustained reductions in blood pressure are rarely achieved with sodium
reduction in the clinical setting (19) and while hypertension guidelines recommend a low salt diet for the
7
management of elevated blood pressure levels (13, 20) the utility of these recommendations is widely
recognized to be limited.
Effects of sodium on blood pressure The effects of sodium on blood pressure are unequivocal with overwhelming data available from a broad
range of animal and human studies (21–25). Particularly convincing evidence is provided by large-scale
epidemiological studies and randomized trials of sodium reduction. While these studies have required careful
and repeated analysis (19) they provide robust epidemiological inputs for cost–effectiveness models.
Observational studies – The single most comprehensive and widely-cited observational evaluation of the
association of blood pressure with sodium consumption is INTERSALT (17). First reported in 1988, this study
identified significant positive associations of 24-hour urinary sodium excretion with systolic and diastolic
blood pressure in two sets of investigations: in cross-population analyses for 52 population samples, and at
the individual level for the 10 079 participants aged 20–59 years. Overviews of observational studies
comparing sodium consumption and blood pressure between populations, and between individuals within the
same population, have confirmed these findings. The effects of sodium on blood pressure were observed to
be greater amongst older individuals and amongst individuals with higher baseline blood pressure levels (21,
22).
Intervention studies – There have been many high quality randomized trials of the effects of reducing dietary
sodium consumption on blood pressure and a series of overviews of the outcomes of these studies (23–25).
The results of these trials are highly consistent with the findings of the observational studies – reducing
dietary sodium decreases blood pressure with greater effects in the elderly and amongst individuals with
higher starting blood pressure levels. It is of note that blood pressure lowering effects related to sodium
reduction were observed amongst individuals with normal blood pressure as well as amongst people with
high blood pressure providing a strong rationale for population-wide implementation of salt reduction
programmes.
Effects of sodium on vascular disease Direct evidence of the beneficial effects of sodium reduction on major vascular events is absent.
Randomized trials of sufficient size to show such effects have not been completed and systematic overviews
of the multiple small trials that have been done are inadequately powered to detect the most plausible effects
of sodium reduction on vascular events (26). The primary reason for this is that most of the trials have been
small, short term and recorded few vascular events. The larger community trials that have been completed
have achieved reductions in sodium consumption in the intervention groups too modest to produce
detectable effects on blood pressure and major vascular outcomes (27).
8
The evidence linking higher sodium consumption to higher blood pressure and lower sodium consumption to
lower blood pressure is, however, conclusive (21–23). Similarly conclusive is the link between higher levels
of blood pressure and greater risks of vascular events (7, 8) and the lowering of that risk with agents that
reduce blood pressure (28). In the context of the profound effects of blood pressure on risk and the clear
effects of sodium on blood pressure, the link between sodium and vascular risk is accepted by most. While
there are some observational studies reporting neutral or even inverse associations between sodium
consumption and vascular disease (29), the confounding to which these studies are prone is too great for
their findings to seriously impact upon conclusions about the adverse effects of sodium on vascular disease.
THE COST–EFFECTIVENESS OF REDUCING DIETARY SODIUM CONSUMPTION A search for studies reporting the cost–effectiveness of interventions to reduce population salt consumption
was undertaken and two substantive reports were identified. The first (Study I), published in 2000, estimates
the cost and health consequences of reducing population salt intake in the population of Norway (30). The
second (Study II), published in 2003, describes the cost–effectiveness of reducing population salt intake in
comparison to and in conjunction with a range of interventions for the lowering of blood pressure and/or
cholesterol levels (6). The chief components and findings of each study are summarized below. Two further
reports were also identified but each was of only limited relevance. One (Study III) is a brief report from the
Disease Control Priorities in Developing Countries Project (31), and the other (Study IV) (32) is a trial of the
effects of salt substitution that includes a report on the impact of the intervention on health-care expenditure
during the trial.
Study I - Cost and health consequences of reducing the population salt
intake (30)
Aim
To estimate the health and economic consequences of interventions to reduce the intake of salt in line with
the recommendations of the Norwegian National Council on Nutrition and Physical Activity (30, 33).
Intervention evaluated
The proposed intervention was that recommended by the Norwegian National Council on Nutrition and
Physical Activity. This comprised the following components:
• population-wide and targeted information campaigns
• decreases in salt content of processed foods
• declaration of salt content of processed foods through labelling
• taxation of processed foods with high salt content

9
• subsidization of foods with low salt content.
The assumption was that this package of interventions would halve daily salt consumption from a mean of 11
g/day to a mean of 5.5 g/day. This corresponds to a decrease in sodium consumption of 100 mmol/day. The
authors noted that in INTERSALT this was associated with a difference in systolic blood pressure of 3–6
mmHg (17). However, for the base case a conservative 2 mmHg lowering of systolic blood pressure was
assumed to be achieved with this reduction in daily sodium consumption. Sensitivity analyses were also
done assuming 1 mmHg and 4 mmHg lowering of systolic blood pressure.
The model
A Markov model was used with life years saved as the measure of health benefit. There were two principal
health states in the model (dead or alive). The model exposed the Norwegian population aged ≥ 40 years to
age- and sex-specific yearly risks of fatal and non-fatal myocardial infarction, fatal and non-fatal stroke and
death from all other causes (34). New generations entered the model as they reached 40 years of age and
the baseline population was that of Norway on 1 January 1995. The effects of the intervention were modeled
over 25 years with the assumption that they appeared gradually over the first 5 years. Potential life years
saved after 25 years of interventions were estimated by applying pre-intervention mortality rates.
Health parameters
Reductions in myocardial infarction and stroke were modeled on the basis of the assumed systolic blood
pressure reduction (2 mmHg) and the known association of systolic blood pressure with stroke and heart
attack (35). Rates of all other causes of mortality were kept constant at 1995 levels. The ratios of non-fatal to
fatal heart attack were set at 2:1 and non-fatal to fatal stroke at 3:1 (36). The strengths of the associations
between systolic blood pressure and these vascular outcomes were based on the associations of 2 mmHg
systolic blood pressure with stroke mortality (4.2% per 2 mmHg systolic blood pressure) and coronary heart
disease mortality (3.8% per 2 mmHg systolic blood pressure) from a cohort study done in Bergen, Norway
(37). These estimates include adjustment for the regression dilution bias with adjustment upwards of the
strengths of the associations by 1.4 in women and 1.5 in men. It was also assumed that 100% of the effect of
higher systolic blood pressure levels on risk could be reversed by blood pressure lowering achieved with
dietary sodium reduction.
Economic parameters
All the costs (Table 1) were recorded in 1997 Norwegian Kroner (Kr) but are presented in US$ (in 1997 US$
1 = Kr 7). The programme costs were based on expert opinion and the welfare costs associated with
taxation/subsidy were estimated on the basis of weight of salty food purchased each year, the cost per kilo of
such food and on the price elasticity of such food depending upon supply and demand. The estimates of cost
savings from reduced drug use were based on local data relating systolic blood pressure levels to the odds
of being treated (38). Costs of care were derived from local diagnosis-related group (DRG) data (39, 40).

10
Table 1 Key economic parameters used in the model in Study 1 Parameter Base case assumptions Cost of information campaigns and development of new products with less salt (new recipes)
US$ 2.9 million/year
Welfare losses from taxation/subsidization US$ 14 million/year Cost savings from reduced antihypertensive treatment
US$ 6 million per 2 mmHg reduction in systolic blood pressure
Cost of in-hospital care for myocardial infarction US$ 7143 Cost of care for non-fatal stroke (one year cost) US$ 14 286 Cost of care for fatal stroke US$ 7857 Cost of in-hospital care for other conditions during extended life
Age/sex specific DRG utilization rates
Mean annual income including employer tax US$ 31 429 Proportion non-retired Age/sex specific rates Elasticity factor 0.8 Discount rate 5% Since avoiding strokes meant avoiding nursing-home care as well as hospital inpatient costs, one year of
nursing care for each non-fatal stroke was included as a cost saving for each non-fatal stroke averted.
Productivity gains were based on known age- and sex-specific retirement rates and average annual incomes
adjusted down by 20% (41). The discount rate for both future costs and health gains was set at 5%. For each
of these parameters substantive sensitivity analyses were done to test the robustness of the findings (42).
Results
Lives saved - The reductions in death from stroke and heart attack reduced overall mortality by 1–2% and
increased mean life expectancy by 1.8 months for 40 year-old men and 1.4 months for 40 year-old women.
During the 25-year treatment period there would be about 7000 fewer fatal heart attacks and 4500 fewer
fatal strokes with about 87 000 life years saved. Proportionately more non-fatal events would also be
prevented. Six thousand more people would be alive at the end of the 25-year period than without the
intervention and those that avoided an event would be expected to live about another 10 years after the
programme completed. In total therefore some 147 000 life years would be saved (or 52 000 when
discounted at 5%).
Blood pressure lowering treatment averted – The number of people requiring blood pressure lowering
treatment would be reduced by 4.9%.
Economic consequences – An estimated net saving of US$ 270 million was accrued over the 25 years of the
intervention programme (or US$ 120 million when discounted at 5%). The savings until all treated persons
died would be US$ 240 million (or US$ 120 million when discounted at 5%).

11
Sensitivity analyses – There were net cost savings unless the systolic blood pressure fall was only 1 mmHg,
unless welfare losses were high (i.e. taxation/subsidy cost a lot) or if productivity gains were disregarded.
The cost was greatest if there was only a small blood pressure reduction and welfare costs were high. The
intervention was, however, cost saving in the base case and the majority of sensitivity analyses. In the worst
case the cost per life year saved was US$ 70 534.
Summary of the study authors’ conclusions
Population decrease in sodium consumption will increase life expectancy and save money. While this
conclusion was sensitive to some of the assumptions made, the base case is probably conservative and the
non-cost-saving scenarios were considered unlikely to occur in the Norwegian setting.
The main reasons cited for the base case assumptions being conservative were:
• The assumed blood pressure reduction, 2 mmHg systolic pressure, was likely to be an underestimate of
what could be achieved.
• The strengths of the associations used between systolic blood pressure and disease were at the lower
end of those considered most likely.
• The analyses did not include possible further beneficial effects achieved through slowing of age-related
increases in blood pressure.
• Beneficial effects on other outcomes such as gastric cancer (43), osteoporosis (44) asthma (45, 46),
cataracts (47), new diabetes (48) and kidney stones (44) were not incorporated. It was also noted that
there are no known adverse effects of reducing sodium consumption.
In contrast, possible overestimation of the cost–effectiveness of the intervention may have resulted from
inadequate accounting of the additional health-care costs associated with longer life since only hospital costs
were included. Future costs incurred would, however, have been minimized by the discounting process
utilized.
While there are no earlier published reports of the cost–effectiveness of population sodium reduction, cost–
effectiveness analyses of comparable interventions for cholesterol lowering have been reported. Studies
done in Norway and the United States of America have suggested that population cholesterol lowering would
be cost saving or would cost very little for each life year saved (49, 50). This comparability of findings was
considered to provide some reassurance that the conclusions of the present study were likely to be reliable.
Additional points for consideration
In review of this paper there are some additional points to consider. First, associations of blood pressure and
disease in epidemiological studies are age-dependent, decreasing in strength with increasing age. This
consideration was not specifically incorporated into this analysis and may have important implications; the
ages at which events were projected to occur in the cost–effectiveness model may not have been directly
comparable with those in the studies on which the estimates of associations between blood pressure and
12
disease were based. Second, details of the welfare gains/losses through taxation/subsidy of foods with
high/low salt consumption were not provided. In addition, taxation and subsidy of foods based on salt content
would probably be politically contentious and may not be achievable. Depending upon how the dollars
gained and the dollars lost through this process were structured for these analyses this could have a
moderate impact upon the cost–effectiveness of the proposed intervention programme. Furthermore, if
taxation and subsidy cannot be achieved it may be that the effectiveness of the programme in terms of blood
pressure reductions and risk reductions would be limited. Finally, possible economic gains/losses incurred by
the salt, food manufacturing, and food retail industries do not appear to have been incorporated into the
model.
Study II – Effectiveness and costs of interventions to lower systolic
blood pressure and cholesterol: a global and regional analysis on
reduction of cardiovascular disease risk (6)
Aim
To analyse the population health effects and costs of non-personal health measures, treatment of individual
risk factors and treatment based on various levels of absolute risk (6).
Background
This paper is an output from the World Health Organization - Choosing Interventions that are Cost-Effective
(WHO-CHOICE) project (51). This project commenced in 1998 with the objective of providing policy-makers
with the evidence they needed to decide on the interventions and programmes which would maximize health
for available resources. The paper is not specifically about the cost–effectiveness of strategies for population
sodium reduction but includes substantial information about this intervention when implemented alone or in
conjunction with other interventions.

13
Table 2 Interventions evaluated Non-personal interventions N1 Salt reduction through voluntary agreements with industry* 95% coverage, 15% reduction in
dietary salt intake N2 Population-wide reduction in salt intake achieved through
legislation 95% coverage, 30% reduction in dietary salt intake
N3 Health education focusing on body mass index and cholesterol 80% coverage, 2% reduction in total cholesterol
N4 (N2 and N3 combined) Salt legislation and health education As above Personal interventions P1 Hypertension treatment programme targeting 160 mmHg or
above and treating with combination of diuretic and beta-blocker P2 Hypertension treatment programme targeting 140 mmHg or
above and treating with combination of diuretic and beta-blocker
All aware treated, 33% reduction between actual systolic blood pressure and target of 115 mmHg
P3 Hypercholesterolaemia programme targeting 6.2 mmol/l or above and treating with statin
P4 Hypercholesterolaemia programme targeting 5.7 mmol/l or above and treating with statin
All aware treated, 20% reduction in total cholesterol
P5 (P2 and P3) Hypertension programme of 140 mmHg or above and hypercholesterolaemia programme of 6.2 mmol/L or above and treating with statin, diuretic and beta-blocker
As above
P6 Absolute risk treating all with 10-year risk of over 35% and treating with aspirin, statin, diuretic and beta-blocker
P7 Absolute risk treating all with 10-year risk of over 25% and treating with aspirin, statin, diuretic and beta-blocker
P8 Absolute risk treating all with 10-year risk of over 15% and treating with aspirin, statin, diuretic and beta-blocker
P9 Absolute risk treating all with 10-year risk of over 5% and treating with aspirin, statin, diuretic and beta-blocker
All aware treated, 33% reduction between actual systolic blood pressure and target of 115 mmHg, 20% reduction in total cholesterol and further 20% reduction in relative risk with anti-platelet therapy
Combined personal and non-personal interventions C1 Absolute risk treating all with 10-year risk of over 35% and
treating with aspirin, statin, diuretic and beta-blocker plus salt legislation and health education
As above
C2 Absolute risk treating all with 10-year risk of over 25% and treating with aspirin, statin, diuretic and beta-blocker plus salt legislation and health education
As above
C3 Absolute risk treating all with 10-year risk of over 15% and treating with aspirin, statin, diuretic and beta-blocker plus salt legislation and health education
As above
C4 Absolute risk treating all with 10-year risk of over 5% and treating with aspirin, statin, diuretic and beta-blocker plus salt legislation and health education
As above
*Highlighted interventions pertain specifically to sodium reduction and blood pressure
Intervention
In this report 17 proposed interventions were evaluated, targeting salt, blood pressure, cholesterol and/or
risk through non-personal and/or personal health service interventions and their combinations (Table 2). In
brief, the key features of these interventions were the following:
14
• Non-personal interventions (N1–N4) – comprising health change achieved through population-wide
modification of blood pressure, cholesterol and body mass.
• Legislated and voluntary (NI and N2) – the estimates of effect achieved with non-personal interventions
were based on either legislated or voluntary processes to reduce sodium consumption through
appropriate labelling and stepwise decreases in the salt content of processed foods. For sodium
reduction, the legislated interventions were assumed to produce twice the reduction in blood pressure of
the voluntary agreements. Only voluntary arrangements for non-personal interventions targeting
cholesterol and body mass were evaluated.
• Personal health services interventions (P1–P9) – included detection and treatment with drugs of people
with high concentrations of cholesterol for two thresholds, people with high systolic blood pressure levels
for two thresholds, and people with absolute risks of an event in the next 10 years for four different
thresholds.
• Combinations of personal and non-personal interventions (C1–C4) – included four plausible
combinations of the personal and non-personal interventions outlined above.
Regions
Separate estimates of cost–effectiveness were made for each of the interventions for each of fourteen
regions defined by geographic proximity and basic epidemiology (Table 3). This approach represented a
compromise between the ideal of providing country-specific data for use by governments and the
practicalities of preparing separate estimates for more than 150 WHO Member States. Results from just
three regions were presented in detail in the paper with additional information for the other regions provided
in supplementary tables available on The Lancet web site:
• http://image.thelancet.com/extras/02art9368webtable1.pdf
• http://image.thelancet.com/extras/02art9368webtable2.pdf
• http://image.thelancet.com/extras/02art9368webtable3.pdf
• http://image.thelancet.com/extras/02art9368webtable4.pdf
• http://image.thelancet.com/extras/02art9368webtable5.pdf
• http://image.thelancet.com/extras/02art9368webtable6.pdf.
The model
The model used in this study was a multistate modeling tool, PopMod (52). This is described as a ‘standard
multistate tool’ with effects of interventions modeled by stochastically simulating populations specific for age,
sex, and subregion using observed baseline levels and distributions of key cardiovascular risk factors
(systolic blood pressure, cholesterol, body mass index and smoking) for each region (for key model
parameters see Annex 1). PopMod involves four health states – people with the disorder under study, people
with another disorder, people with both conditions and people with neither. Non-personal interventions are
assumed to cover 95% of the entire population and personal interventions to cover the entire population
eligible for that intervention that are aware that treatment is required. Overall population incidence of disease
is calculated after applying the effectiveness of the intervention to the relevant section of the population for

15
10 years. Population health effects are quantified in terms of DALYs by tracking what happens to each age
and sex group of the population over 100 years with and without each intervention. Comprehensive
sensitivity analyses were done to evaluate uncertainties in the key assumptions.
Table 3 Regions for which cost–effectiveness estimates were prepared WHO Region Examples of countries included WHO African Region Afr D (high adult and high child mortality) Northern Africa Afr E (very high adult and high child mortality) Sub-Saharan Africa WHO Region of the Americas Amr A (very low adult and very low child mortality) USA, Canada, Cuba Amr B (low adult and low child mortality) Most of South America Amr D (high adult and high child mortality), Bolivia, Ecuador, Nicaragua, Peru WHO Eastern Mediterranean Region Emr B (low adult and low child mortality) Iran, Tunisia, United Arab Emirates Emr D (high adult and high child mortality) Afghanistan, Egypt, Iraq, Pakistan WHO European Region Eur A (very low adult and very low child mortality) Western Europe Eur B (low adult and low child mortality) Eastern Europe Eur C (high adult and low child mortality) Russian Federation, Ukraine WHO South-East Asia Region Sear B (low adult and low child mortality) Indonesia, Sri Lanka, Thailand Sear D (high adult and high child mortality) Bangladesh, India WHO Western Pacific Region Wpr A (very low adult and very low child mortality) Australia, Japan, New Zealand, Singapore Wpr B (low adult and low child mortality) China, Pacific Islands, Viet Nam
Average cost–effectiveness ratios were calculated for each intervention using total costs in international
dollars and total health effects in terms of DALYs. All costs and health effects were discounted at 3% per
annum in line with recent recommendations (53). The model calculated the cost–effectiveness of the
interventions compared to a baseline scenario with no interventions. The rationale for this approach is that it
allows a truly objective view of the value of the interventions rather than assuming that existing interventions
should necessarily be maintained.
In defining whether an intervention is cost effective the authors used a recommendation from the
Commission on Macroeconomics and Health that interventions with a cost–effectiveness ratio of less than
three times gross domestic product (GDP) per head are cost effective (53). Interventions were placed into
one of three broad categories on the basis of the cost–effectiveness analyses.
• Very cost effective – cost–effectiveness ratio of less than GDP per head for each DALY gained.
• Cost effective – cost–effectiveness ratio of between one and three times GDP per head for each DALY
gained.
• Not cost effective – cost–effectiveness ratio of more than three times GDP per head for each DALY
gained.

16
This level of categorization was considered to be appropriate to help policy-makers make their decisions
about which interventions should be considered as priorities. Expansion paths were also presented to
illustrate how to define progressive combinations of interventions which would provide the greatest
incremental health benefits for minimum incremental costs.
Health parameters
The effects of sodium reduction on blood pressure were based on overviews of observational studies (21,
22) and randomized trials (23) with separate estimates of the effects of 15% and 30% reductions in dietary
sodium used for different age groups (30–44, 45–59, 60–69, 70–79 and > 80 years) and male and female
sex in each WHO region. In general, percentage reductions in blood pressure achieved with sodium
reduction increased with age and were larger in men. The differences between the groups of countries within
each region were relatively small.
The effects of a given blood pressure lowering on the relative risks of stroke and ischaemic heart disease
were estimated from overviews of large scale observational studies and randomized trials (7, 8). These
effects were considered to be constant across country groupings and sexes but to attenuate with increasing
age.
Economic parameters
The costs considered in this analysis included programme-level costs (administration, media, training, etc)
and patient-level costs (primary care, diagnosis, medicines, etc). Cost savings related to the prevention of
cardiovascular disease (neither costs of care nor productivity losses) were not incorporated on the basis that
the primary interest in this study was in ranking interventions to improve population health within a given
budget. Costs of intervention programmes were based on the WHO ingredients approach (52) in which a
comprehensive data collection process had previously been undertaken by Member States with unit prices
for a broad range of inputs defined. The ingredients approach basically defined the numbers of each of these
units required for delivery of the intervention and multiplied them to get the cost. The quantities of each input
(both patient level and programme level) were defined through a combination of searches of the literature
and input from local experts. The ingredients approach was designed to make the results of the analysis as
transparent as possible to policy-makers and to allow direct comparison of cost components across regions.
Estimates of cost–effectiveness were based on the assumption that the interventions were implemented
inefficiently – in general this meant that 80% capacity utilization was assumed (i.e. a staff member working
on the intervention spent 80% of their time occupied on it).
Costs were reported in International Dollars to facilitate comparison across regions. An International Dollar
has the same purchasing power as US$ 1 spent in the USA and is calculated by converting local currency
costs using a purchasing power parity exchange rate. The purchasing power parity exchange rate is the
17
number of units of local currency required to purchase the same amount of goods/services as US$ 1 would
purchase in the USA. To convert International Dollars to local currency units, the International Dollar figure is
multiplied by the purchasing power parity exchange rate. Likewise, to convert local currency units to
international dollars the local currency is divided by the purchasing power parity exchange rate.
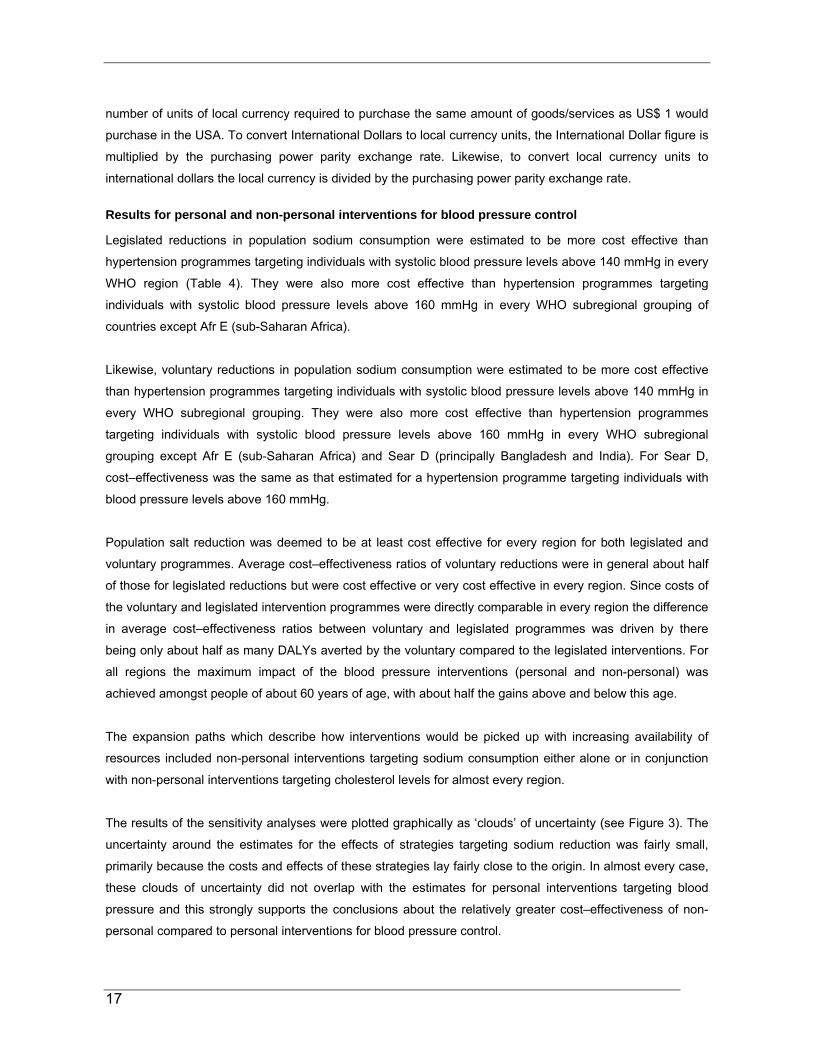
Results for personal and non-personal interventions for blood pressure control
Legislated reductions in population sodium consumption were estimated to be more cost effective than
hypertension programmes targeting individuals with systolic blood pressure levels above 140 mmHg in every
WHO region (Table 4). They were also more cost effective than hypertension programmes targeting
individuals with systolic blood pressure levels above 160 mmHg in every WHO subregional grouping of
countries except Afr E (sub-Saharan Africa).
Likewise, voluntary reductions in population sodium consumption were estimated to be more cost effective
than hypertension programmes targeting individuals with systolic blood pressure levels above 140 mmHg in
every WHO subregional grouping. They were also more cost effective than hypertension programmes
targeting individuals with systolic blood pressure levels above 160 mmHg in every WHO subregional
grouping except Afr E (sub-Saharan Africa) and Sear D (principally Bangladesh and India). For Sear D,
cost–effectiveness was the same as that estimated for a hypertension programme targeting individuals with
blood pressure levels above 160 mmHg.
Population salt reduction was deemed to be at least cost effective for every region for both legislated and
voluntary programmes. Average cost–effectiveness ratios of voluntary reductions were in general about half
of those for legislated reductions but were cost effective or very cost effective in every region. Since costs of
the voluntary and legislated intervention programmes were directly comparable in every region the difference
in average cost–effectiveness ratios between voluntary and legislated programmes was driven by there
being only about half as many DALYs averted by the voluntary compared to the legislated interventions. For
all regions the maximum impact of the blood pressure interventions (personal and non-personal) was
achieved amongst people of about 60 years of age, with about half the gains above and below this age.
The expansion paths which describe how interventions would be picked up with increasing availability of
resources included non-personal interventions targeting sodium consumption either alone or in conjunction
with non-personal interventions targeting cholesterol levels for almost every region.
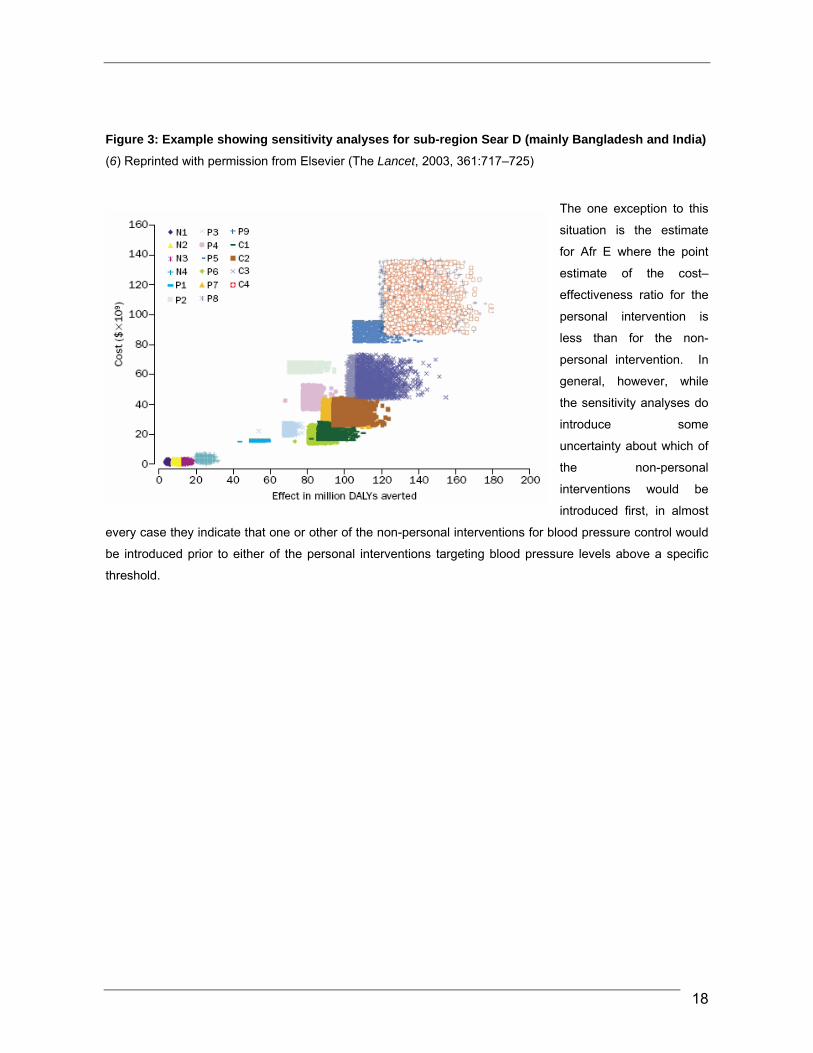
The results of the sensitivity analyses were plotted graphically as ‘clouds’ of uncertainty (see Figure 3). The
uncertainty around the estimates for the effects of strategies targeting sodium reduction was fairly small,
primarily because the costs and effects of these strategies lay fairly close to the origin. In almost every case,
these clouds of uncertainty did not overlap with the estimates for personal interventions targeting blood
pressure and this strongly supports the conclusions about the relatively greater cost–effectiveness of non-
personal compared to personal interventions for blood pressure control.
18
Figure 3: Example showing sensitivity analyses for sub-region Sear D (mainly Bangladesh and India) (6) Reprinted with permission from Elsevier (The Lancet, 2003, 361:717–725)
The one exception to this
situation is the estimate
for Afr E where the point
estimate of the cost–
effectiveness ratio for the
personal intervention is
less than for the non-
personal intervention. In
general, however, while
the sensitivity analyses do
introduce some
uncertainty about which of
the non-personal
interventions would be
introduced first, in almost
every case they indicate that one or other of the non-personal interventions for blood pressure control would
be introduced prior to either of the personal interventions targeting blood pressure levels above a specific
threshold.

19
Table 4 Annual costs, effects, and average cost–effectiveness of programmes to reduce sodium intake and hypertension in different WHO Regions (adapted from 6)
Country groupings1 within the WHO Regions of Africa, the Americas and the Eastern Mediterranean Programme
Afr D Afr E Amr A Amr B Amr D Emr B Emr D
C2 D3 C/ D4 C D C/ D C D C/ D C D C/ D C D C/ D C D C/ D C D C/ D
Voluntary Na reduction
85 1 570 118 1 920 92 4 230 82 3 240 16 0.3 500 66 1 540 76 3 250
Legislated Na reduction
85 3 300 118 2 470 92 8 120 82 6 130 16 1 260 66 2 270 76 6 120
Hypertension reduction (SBP > 160 mmHg)
1 464 18 820 499 16 310 6 136 50 1 220 3122 38 810 417 4 1 140 1 151 16 710 1 249 38 330
Hypertension reduction (SBP > 140 mmHg)
3 375 20 1 680 1 971 19 1 010 19 669 60 3 290 8 066 47 1 860 1 435 4 3 190 3 700 20 1 890 3 790 42 910
1 see Table 3 2 C, costs are expressed in International Dollars x 106
3 D, DALYs are multiplied by 105
4 C/D, costs per DALY are expressed in International Dollars
Na, sodium; SBP, systolic blood pressure

20
Table 4 continued Country groupings1 within the WHO Regions of Europe, South-East Asia and the Western Pacific Programme
Eur A Eur B Eur C Sear B Sear D Wpr A Wpr B
C2 D3 C/ D4 C D C/ D C D C/ D C D C/ D C D C/ D C D C/ D C D C/ D
Voluntary Na reduction
297 7 440 95 8 120 26 14 20 21 2 140 199 5 370 183 3 540 219 12 190
Legislated Na reduction
297 13 230 95 15 60 26 28 10 21 3 70 199 10 190 183 6 290 219 23 100
Hypertension reduction (SBP >
160 mmHg) 14 777 73 2 030 3 438 74 460 3 910 141 280 1 130 15 770 1 570 44 360 4 789 34 1 400 6044 127 480
Hypertension reduction (SBP >
140 mmHg) 37 385 82 4 540 6 624 78 850 7 233 149 490 3 652 20 1 830 6 399 71 900 12 991 38 3 420 17 884 154 1 160
1 see Table 3 2 C, costs are expressed in International Dollars x 106
3 D, DALYs are multiplied by 105
4 C/D, costs per DALY are expressed in International Dollars
Na, sodium; SBP, systolic blood pressure

21
Summary of study authors’ conclusions relevant to personal and non-personal interventions for blood pressure control
In every case both personal and non-personal interventions to lower blood pressure were very cost effective.
This is at odds with the perception that cardiovascular prevention strategies should be the preserve of
wealthy countries. The greater cost–effectiveness of non-personal interventions targeting blood pressure
control indicated a need for greater investigation and implementation of these strategies. The authors noted
that the effectiveness assumptions on which the estimates were based reflected an average of the very
substantial successes achieved in North Karelia in Finland (54) and the much lesser impact of programmes
carried out in the USA (27). If non-personal programmes with efficacy comparable to that achieved in North
Karelia could be achieved in all cases then both the cost–effectiveness and the proportion of the vascular
disease burden that could be averted by non-personal interventions could be greatly enhanced. The authors
also commented that uncertainties about the impact of sodium reduction on blood pressure and vascular risk
were unlikely to reflect a real absence of effect of sodium on these outcomes but rather the limited success
that most studies had in reducing sodium consumption.
The authors observed that there was substantial potential for non-personal interventions to bring about
reductions in the health inequalities that exist between the rich and poor and that this may be particularly
important in developing countries when inequity is greatest and growing most rapidly (53). Treatment
targeted at systolic blood pressure levels above 160 mmHg was also very cost effective in every region and
a combination of both personal and non-personal interventions for the prevention of blood pressure-related
disease would be appropriate for most regions. It was also of note, however, that approaches based on
absolute risk might be even more cost effective than personal interventions targeting blood pressure and that
these warranted further investigation.
Additional points for consideration
While this report identified non-personal interventions targeting dietary sodium consumption as particularly
cost effective, the absolute burden of disease averted by personal interventions was estimated to be much
larger. On average 5–15-fold more DALYs were averted using personal interventions based on drug therapy
than through non-personal interventions based on sodium reductions. The large proportion of the burden
averted by personal interventions was attributed to a clearer comprehension of the epidemiology surrounding
the effects of blood pressure on disease and a better understanding of the impact of interventions.
It appears, however, that the effectiveness of personal interventions may have been overestimated. In
particular, assuming one third reductions of systolic blood pressure towards the target of 115 mmHg may be
a substantial overestimate of what is actually achievable (55). For example, in the case of the personal
programme targeting individuals with a systolic blood pressure of > 160 mmHg this would mean an average
blood pressure reduction of some 20 mmHg amongst individuals enrolled in the programme. It is unclear
whether this could actually be achieved. In addition, a number of the assumptions relating to the proportions
of individuals identified and treated by such programmes also appear to be somewhat optimistic (13). By
contrast, the assumptions underlying the effects of the non-personal interventions targeting sodium
consumption may be conservative. Although evidence to support assumptions of 15% and 30% reductions in

22
salt consumption with voluntary and legislated interventions is largely absent, differences in salt consumption
of this magnitude between populations have been observed (17). It is quite possible, therefore, that this
paper overestimates the disease burden that might be averted by personal interventions targeting blood
pressure and the cost–effectiveness of such interventions, while doing the reverse for non-personal
interventions.
A further consideration with regard to the value of this report relates to the units of measurement selected.
The use of International Dollars and DALYs is underpinned by a strong scientific rationale but may be
unfamiliar to policy-makers. Likewise, the reporting of the results by region rather than by country decreases
the immediate use of the data by policy-makers. So, while the WHO-CHOICE project provides significant
insight into the comparative cost–effectiveness of different interventions in different settings, the presentation
of the outputs will require substantial simplification for them to be useful in moving forward the
implementation of national strategies for population-wide salt reduction.
Study III – Disease Control Priorities in Developing Countries (31) A brief report in the book Disease Control Priorities in Developing Countries (31) provides estimates of the
cost–effectiveness of reducing population sodium consumption by means of legislation plus public education.
However, the level of detail provided about the methods utilized is minimal. The cost–effectiveness estimates
for the regions (between US$ 1325 and US$ 3056 per DALY) indicate that the intervention would be cost
effective or highly cost effective in most regions according to the criteria laid down by the Commission on
Macroeconomics and Health (53). However, while this report serves to confirm the conclusions of those
reports preceding it, the absence of detail means that it adds little additional insight into the issues
surrounding the estimation of cost–effectiveness for population-wide interventions targeting salt reduction.
Study IV – Effect of potassium-enriched salt on cardiovascular mortality
and medical expenses of elderly men (32) This cluster-randomized trial of the effects of potassium-enriched salt in five retirement homes in China
(Province of Taiwan) reported a beneficial effect of the intervention on major cardiovascular events. Included
in the report were some data about the medical expenses of the study participants during follow-up (32). This
did not constitute a formal cost–effectiveness analysis of the intervention strategy but rather a simple
quantification of the inpatient and outpatient medical costs of the trial participants. There was a US$ 426 per
annum lower expenditure on inpatient care for the active treated participants compared to the control treated
participants. The same multivariable adjusted models did not, however, identify a significant impact of the
salt substitute on either outpatient costs or overall medical costs. The study provides no direct evidence with
regard to the cost–effectiveness of programmes seeking to achieve population-wide reduction of salt
consumption but does provide some further indirect support to the suggestion that initiatives targeting dietary
salt consumption are likely to be cost effective.

23
Conclusions
While very different in their design, the Norwegian study and the report from WHO-CHOICE reach a very
similar conclusion – non-personal interventions for reducing dietary salt consumption would avert a
significant disease burden and would be highly cost effective. This conclusion appears to stand up to
comprehensive sensitivity analyses and to apply throughout diverse regions of the world. While far less
informative than these first two reports, the data from the Disease Control Priorities in Developing Countries
project and the trial in China (Province of Taiwan) provide some additional support for this conclusion and
certainly no argument against it. On the basis of the available evidence, it therefore seems likely that the
implementation of strategies for population-wide reduction of sodium consumption would be extremely
worthwhile from the cost–effectiveness perspective in almost every setting.
USING COST–EFFECTIVENESS DATA TO SUPPORT IMPLEMENTATION It is unclear that any of the current data on the cost–effectiveness of dietary sodium reduction have
significantly impacted upon global efforts to reduce population sodium consumption. This is likely to be due
to a number of factors. First, national estimates have been produced for Norway alone and while regional
estimates provide a clear indication of the likely cost–effectiveness of the strategy, they are perceived to be
difficult for policy-makers to apply in individual countries. Second, the understanding of cost–effectiveness
data outside specialized settings remains limited. This problem is compounded by the way in which findings
are presented with units such as DALYs and International Dollars being largely incomprehensible to those in
the position to make policy decisions. Finally, as with other outputs from medical research, the results of
cost–effectiveness analyses require a systematic and concerted programme for implementation if they are to
have an impact on policy. If these issues can be surmounted then there would appear to be great potential
for the data from analyses such as those done by the investigators in Norway and WHO-CHOICE to impact
upon public policy relating to dietary sodium reduction. If implemented, population-wide strategies for sodium
reduction would clearly be highly cost effective and compare very favourably with many other interventions
already in place.
The WHO-CHOICE project The WHO-CHOICE project appears to have great potential to enhance the impact of cost–effectiveness
estimates on public policy relating to dietary sodium consumption (51). While the mission of WHO-CHOICE
is broad and includes the evaluation of multiple interventions and defines broad goals pertaining to the
development of standardized methods for cost–effectiveness analysis, dietary sodium reduction is a target
intervention and the development of country contextualization tools is part of the mission. The country-
specific data that could emanate from the contextualization process would be likely to have a much greater
impact on national policies than the regional estimates currently available. This would be particularly so if the
cost–effectiveness estimates could be presented in local currency estimates and in a range of measures,
including dollars per DALY but perhaps also dollars per life saved and dollars per year of life saved.
24
In terms of contextualization WHO-CHOICE advocates the use of a process whereby available regional
estimates are tailored to the particular demographic, epidemiological and economic situations of a specific
country. The preferred approach is a systematic process involving the review and revision of all model
parameters such that output is maximally applicable to the country in question. However, it is acknowledged
that national data for every parameter will not necessarily be available and estimates will be required in
some situations.
Preliminary contextualization for Australia, China and India In collaboration with WHO-CHOICE, we piloted the preparation of country-specific cost–effectiveness
estimates for population-wide sodium reduction using Australia, China and India as examples. Working from
a list of data inputs provided by the WHO-CHOICE group we reviewed the regional data used to develop the
previous estimates for the WHO South-East Asia and Western Pacific Regions. In each case, national
estimates were thought to be required because characteristics of other countries included in the regional
estimates might make them imprecise indicators of the cost–effectiveness for the individual country of
interest. This is likely be less of an issue for Wpr B and Sear D (see Table 3), where the estimates are
already heavily weighted by data for China and India respectively. In Wpr A estimates for the subregion
would be significantly influenced by Japan which has cost structures and cardiovascular disease patterns
substantially different from those in Australia.
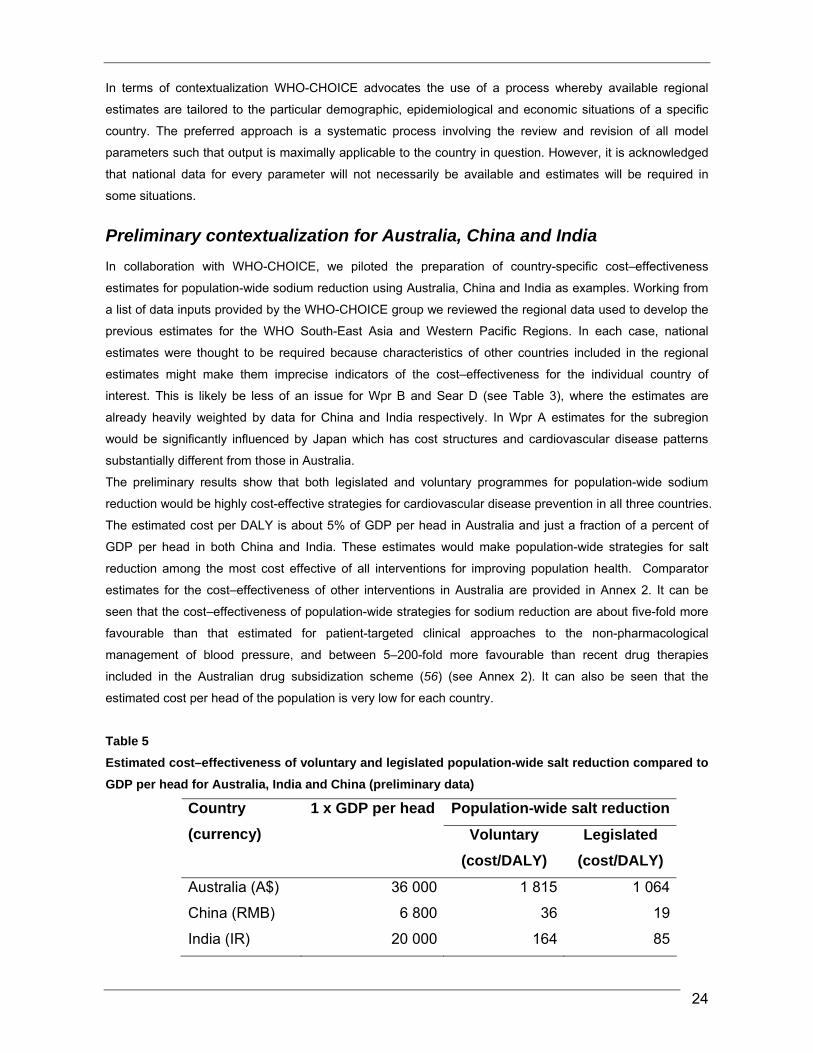
The preliminary results show that both legislated and voluntary programmes for population-wide sodium
reduction would be highly cost-effective strategies for cardiovascular disease prevention in all three countries.
The estimated cost per DALY is about 5% of GDP per head in Australia and just a fraction of a percent of
GDP per head in both China and India. These estimates would make population-wide strategies for salt
reduction among the most cost effective of all interventions for improving population health. Comparator
estimates for the cost–effectiveness of other interventions in Australia are provided in Annex 2. It can be
seen that the cost–effectiveness of population-wide strategies for sodium reduction are about five-fold more
favourable than that estimated for patient-targeted clinical approaches to the non-pharmacological
management of blood pressure, and between 5–200-fold more favourable than recent drug therapies
included in the Australian drug subsidization scheme (56) (see Annex 2). It can also be seen that the
estimated cost per head of the population is very low for each country.
Table 5 Estimated cost–effectiveness of voluntary and legislated population-wide salt reduction compared to GDP per head for Australia, India and China (preliminary data)
Population-wide salt reductionCountry (currency)
1 x GDP per head Voluntary
(cost/DALY) Legislated
(cost/DALY)
Australia (A$) 36 000 1 815 1 064
China (RMB) 6 800 36 19
India (IR) 20 000 164 85
25
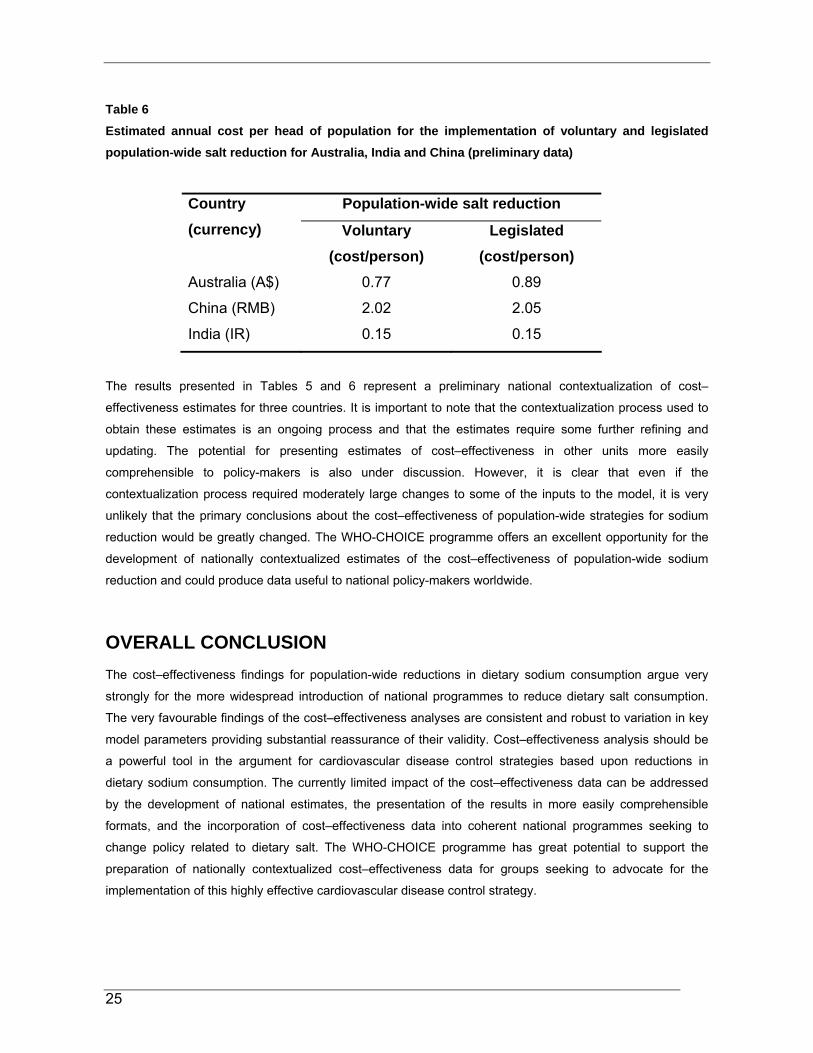
Table 6 Estimated annual cost per head of population for the implementation of voluntary and legislated population-wide salt reduction for Australia, India and China (preliminary data)
Population-wide salt reduction Country (currency) Voluntary
(cost/person) Legislated
(cost/person) Australia (A$) 0.77 0.89
China (RMB) 2.02 2.05
India (IR) 0.15 0.15
The results presented in Tables 5 and 6 represent a preliminary national contextualization of cost–
effectiveness estimates for three countries. It is important to note that the contextualization process used to
obtain these estimates is an ongoing process and that the estimates require some further refining and
updating. The potential for presenting estimates of cost–effectiveness in other units more easily
comprehensible to policy-makers is also under discussion. However, it is clear that even if the
contextualization process required moderately large changes to some of the inputs to the model, it is very
unlikely that the primary conclusions about the cost–effectiveness of population-wide strategies for sodium
reduction would be greatly changed. The WHO-CHOICE programme offers an excellent opportunity for the
development of nationally contextualized estimates of the cost–effectiveness of population-wide sodium
reduction and could produce data useful to national policy-makers worldwide.
OVERALL CONCLUSION The cost–effectiveness findings for population-wide reductions in dietary sodium consumption argue very
strongly for the more widespread introduction of national programmes to reduce dietary salt consumption.
The very favourable findings of the cost–effectiveness analyses are consistent and robust to variation in key
model parameters providing substantial reassurance of their validity. Cost–effectiveness analysis should be
a powerful tool in the argument for cardiovascular disease control strategies based upon reductions in
dietary sodium consumption. The currently limited impact of the cost–effectiveness data can be addressed
by the development of national estimates, the presentation of the results in more easily comprehensible
formats, and the incorporation of cost–effectiveness data into coherent national programmes seeking to
change policy related to dietary salt. The WHO-CHOICE programme has great potential to support the
preparation of nationally contextualized cost–effectiveness data for groups seeking to advocate for the
implementation of this highly effective cardiovascular disease control strategy.

26
ACKNOWLEDGEMENTS The authors would like to acknowledge the assistance of Dan Chisholm and David Evans at WHO-CHOICE,
World Health Organization, Geneva, Switzerland; Anthony Rodgers at the Clinical Trials Research Unit in
Auckland, New Zealand; Stephen Jan at the George Institute for International Health in Australia.

27
REFERENCES 1. Murray C, Lopez A. Regional patterns of disability-free life expectancy and disability adjusted life expectancy:
Global Burden of Disease Study. Lancet, 1997, 349:1347–1352.
2. Murray C, Lopez A. Alternative projections of mortality and disability by cause 1990-2020: Global Burden of
Disease Study. Lancet, 1997, 349:1498–1504.
3. Murray C, Lopez A. Global mortality, disability, and the contribution of risk factors: Global Burden of Disease
Study. Lancet, 1997, 349:1436–1442.
4. Murray C, Lopez A. Mortality by cause for eight regions of the world: Global Burden of Disease Study. Lancet,
1997, 349:1269–1276.
5. The world health report 2002 – Reducing Risks, Promoting Healthy Life. Geneva, World Health Organization,
2002.
6. Murray C, et al. Reducing the risk of cardiovascular disease: effectiveness and costs of interventions to reduce
systolic blood pressure and cholesterol - a global and regional analysis. Lancet, 2003, 361:717–725.
7. Prospective Studies Collaboration. Cholesterol, diastolic blood pressure, and stroke: 13,000 strokes in 450,000
people in 45 prospective cohorts. Lancet, 1995, 346:1647–1653.
8. Asia Pacific Cohort Studies Collaboration. Blood pressure and cardiovascular diseases in the Asia-Pacific
region. J Hypertens, 2003, 21(4):707–716.
9. MacMahon S, et al. Blood pressure, stroke, and coronary heart disease. Part 1, prolonged differences in blood
pressure: prospective observational studies corrected for the regression dilution bias. Lancet, 1990, 335:765–
774.
10. Manuel D, et al. Revisiting Rose: strategies for reducing coronary heart disease. British Medical Journal, 2006,
332:659–662.
11. Chalmers J, et al. 1999 World Health Organization–International Society of Hypertension guidelines for the
management of hypertension. J Hypertens, 1999, 17:151–185.
12. The fifth report of the Joint National Committee on Detection, Evaluation, and Treatment of High Blood Pressure
(JNC V). Arch Intern Med, 1993, 153:154–183.
13. Chobanian AVBG, et al., National Heart, Lung, and Blood Institute Joint National Committee on Prevention,
Detection, Evaluation, and Treatment of High Blood Pressure, National High Blood Pressure Education
Program Coordinating Committee. The Seventh Report of the Joint National Committee on Prevention,
Detection, Evaluation and Treatment of High Blood Pressure: the JNC 7 report. Journal of the American Medical
Assoc, 2003, 289:2560–2572.
14. Gaziano T, et al. Cost-Effectiveness Analysis of Hypertension Guidelines in South Africa. Absolute Risk Versus
Blood Pressure Level. Circulation, 2005, 112:3569–3576.
15. PROGRESS Collaborative Group. Randomised trial of a perindopril-based blood pressure lowering regimen
among 6,105 individuals with previous stroke or transient ischaemic attack. Lancet, 2001, 358:1033–1041.
16. Heart Outcomes Prevention Evaluation (HOPE) Study Investigators. Effects of ramipril on cardiovascular and
microvascular outcomes in people with diabetes mellitus: results of the HOPE study and MICRO-HOPE
substudy. Lancet, 2000, 355:253–258.
17. INTERSALT Cooperative Research Group. INTERSALT: an international study of electrolyte excretion and
blood pressure. Results for 24 hour urinary sodium and potassium excretion. British Medical Journal, 1988,
287:319–328.
18. Jackson R, et al. Management of raised blood pressure in New Zealand: a discussion document. British Medical
Journal, 1993, 307:107–110.
28
19. Beilin L. Non-pharmacological management of hypertension: optimal strategies for reducing cardiovascular risk.
J Hypertens, 1994, 12(10):S71–S81.
20. Chalmers J, et al. 1999 World Health Organization–International Society of Hypertension Guidelines for the
management of hypertension. Guidelines sub-committee of the World Health Organization. Clin Exp Hypertens,
1999, 21(5-6):1009–1060.
21. Law MR, Frost CD, Wald NJ. By how much does dietary salt reduction lower blood pressure? II Analysis of
observational data within populations. British Medical Journal, 1991, 302:815–819.
22. Law MR, Frost CD, Wald NJ. By how much does dietary salt reduction lower blood pressure? I Analysis of
observational data among populations. British Medical Journal, 1991, 302:811–816.
23. Law MR, Frost CD, Wald NJ. By how much does dietary salt reduction lower blood pressure? III - Analysis of
data from trials of salt reduction. British Medical Journal, 1991, 302:819–824.
24. Cutler J, Follmann D, Allender P. Randomized trials of sodium reduction: an overview. Am J Clin Nutr, 1997,
65:643S–651S.
25. Cutler J, et al. An overview of randomised trials of sodium reduction and blood pressure. Hypertension, 1991,
17:I27–I33.
26. Hooper L, et al. Systematic review of long term effects of advice to reduce dietary salt in adults. British Medical
Journal, 2002, 325:628–634.
27. Sellers S, et al. Understanding the variability in the effectiveness of community heart health programmes: a
meta-analysis. Soc Sci Med, 1997, 44:1325–1339.
28. Blood Pressure Lowering Treatment Trialists' Collaboration. Effects of different blood pressure lowering
regimens on major cardiovascular events: Second cycle of prospectively designed overviews. Lancet, 2003,
362:1527–1535.
29. Alderman M, Cohen H, Madhavan S. Dietary sodium intake and mortality: the National Health and Nutrition
Examination Survey (NHANES I). Lancet, 1998, 351:781–785.
30. Selmer R, et al. Cost and health consequences of reducing the population intake of salt. J Epidemiol
Community Health, 2000, 54(9):697–702.
31. Willet W, et al. In: Jamieson D, et al., eds. Disease control priorities in developing countries: The World Bank
Group, 2006.
32. Chang H-Y, et al. Effect of potassium-enriched salt on cardiovascular mortality and medical expenses of elderly
men. American Journal of Clinical Nutrition. 2006, 83:1289–1296.
33. National Council on Nutrition and Physical Activity. Reduction of salt intake in the Norwegian population;
consequences for morbidity, mortality and economy. Report 5/1998. [In Norwegian]. Oslo, National Council on
Nutrition and Physical Activity, 1998 (5/1998).
34. Statistics Norway. Dedsarsaker 1994 [Causes of Death 1994]. Oslo, Statistics Norway, 1997.
35. Njolstad I, Arnesen E. Preinfarction blood pressure and smoking are determinants for a fatal outcome of
myocardial infarction: a prospective analysis from the Finnmark Study. Arch Intern Med, 1998, 158(12):1326–
1332.
36. Ellekjaer H, et al. Epidemiology of stroke in Innherred, Norway, 1994 to 1996. Incidence and 30-day case-
fatality rate. Stroke, 1997, 28(11):2180–2184.
37. Selmer R. Blood pressure and twenty-year mortality in the city of Bergen, Norway. Am J Epidemiol, 1992,
136(4):428–440.
38. Stensland-Bugge E, Bonaa KH, Joakimsen O. Reproducibility of ultrasonographically determined intima-media
thickness is dependent on arterial wall thickness. The Tromso Study. Stroke, 1997, 28(10):1972–1980.
39. Norwegian Research Council Nf. Management of mild hypertension [in Norwegian]. Oslo, Norwegian Research
Council 1997 (Report No. 8).

29
40. Ministry of Health and Social Affairs. The DRG System. DRG Price list including guide to coding 1997 [in
Norwegian]. Oslo, Ministry of Health and Social Affairs, 1997.
41. Statistics Norway. Statistical Year Book 1996 [in Norwegian]. Oslo, Statistics Norway, 1996.
42. Koopmanschap MA, et al. The friction cost method for measuring indirect costs of disease. J Health Econ, 1995,
14(2):171–189.
43. Shikata K, et al. A prospective study of dietary salt intake and gastric cancer incidence in a defined Japanese
population: The Hisayama study. Int J Cancer, 2006, 119(1):196–201.
44. Cappuccio F, et al. Unravelling the links between calcium excretion, salt intake, hypertension, kidney stones
and bone metabolism. J Nephrol, 2000, 13(3):169–177.
45. Gotshall R, Mickleborough T, Cordain L. Dietary salt restriction improves pulmonary function in exercise-
induced asthma. Med Sci Sports Exerc, 2000, 32(11):1815–1819.
46. Mickleborough T, et al. Dietary salt alters pulmonary function during exercise in exercise-induced asthmatics. J
Sports Sci, 2001, 19(11):865–873.
47. Cumming R, Mitchell P, Smith W. Dietary sodium intake and cataract: the Blue Mountains Eye Study. Am J
Epidemiol, 2000, 151(6):624–626.
48. Hu G, et al. Urinary sodium and potassium excretion and the risk of type 2 diabetes: a prospective study in
Finland. Diabetologia, 2005, 48(8):1477–1483.
49. Kristiansen I, Eggen A, Thelle D. Cost-effectiveness of incremental programmes for lowering serum cholesterol
concentration: is individual intervention worthwhile. British Medical Journal, 1991, 302:1119–1122.
50. Tosteson A, et al. Cost-effectiveness of populationwide educational approaches to reduce serum cholesterol
levels. Circulation, 1997, 95:24–30.
51. World Health Organization - Choosing Interventions that are Cost-Effective (WHO-CHOICE) 1998 at
http://www.who.int/choice/description/en/
52. Hutubessy RC, et al. Generalized cost-effectiveness analysis: an aid to decision making in health. Applied
Health Economics and Health Policy, 2002, 12:39–46.
53. Macroeconomics and health: investing in health for economic development. Report of the WHO Commission on
Macroeconomics and Health. Geneva, World Health Organization, 2001.
54. Vartiainen E, et al. Cardiovascular diseases and risk factors in Finland. Prev Med, 1999, 29:S124–129.
55. Poulter N. Treatment of hypertension: a clinical epidemiologist's view. J Cardiovasc Pharmacol, 1991, 18(Suppl
2):S35–S38.
56. George B, Harris A, Mitchell A. Cost Effectiveness Analysis and the Consistency of Decision Making: Evidence
from Pharmaceutical Reimbursement in Australia 1991-96. Canberra, Department of Health and Aged Care,
1999 (1 876662 01 8).

30
ANNEX 1
Key model parameters for WHO-CHOICE cost–effectiveness analyses Note that most parameters are required for multiple age and sex groups
Demography:
• births each year
• population structure
• mortality rates.
Incidence, prevalence, remission, case fatality and mortality for acute myocardial infarction (AMI):
• incidence of AMI
• ratio of first-ever AMI to all AMI
• 24-hour case fatality for AMI
• 28-day case fatality for AMI
• out-of-hospital case fatality for AMI
• incidence of long-term AMI survivors
• prevalence of long-term AMI survivors
• case fatality for long-term AMI survivors
• mortality for AMI
• incidence for angina pectoris
• prevalence for angina pectoris
• percentage of long-term AMI survivors that develop congestive heart failure
• incidence of congestive heart failure
• prevalence of congestive heart failure
• case fatality for congestive heart failure.
Incidence, prevalence, remission, case fatality and mortality for stroke:
• incidence for first-ever stroke
• prevalence for first-ever stroke
• 28-day case fatality for stroke
• percentage of 28-day fatal cases that are out-of-hospital for stroke
• percentage of fatal stroke that are ischaemic stroke
• percentage of non-fatal stroke that are ischaemic stroke
• incidence of long-term stroke survivors
• prevalence of long-term stroke survivors
• case fatality for long-term stroke survivors
• percentage of long-term stroke survivors dying from stroke
• mortality for stroke.

31
Risk factor levels:
• mean systolic blood pressure (mmHg)
• standard deviation (SD) of mean systolic blood pressure
• mean cholesterol level (mmol/l)
• SD of mean cholesterol levels
• mean body mass index (BMI) (kg/m2)
• SD of mean BMI
• smoking prevalence
• salt intake (g NaCl per day).
Disability weights:
• for AMI
• for angina pectoris
• for congestive heart failure
• for acute stroke
• for long-term stroke survivors.
Percentage coverage of interventions:
• for AMI during the acute phase (28 days)
• for AMI during the post-acute phase (after 28 days)
• for stroke during the acute phase (28 days)
• for stroke during the post-acute phase (after 28 days)
• for congestive heart failure.
Epidemiology:
• effects of mmHg increase in systolic blood pressure on risk of stroke and AMI
• effects of mmol/l increase in total cholesterol on risk of stroke and AMI
• effects of kg/m2 increase in BMI on risk of stroke and AMI
• effects of smoking on risk of stroke and AMI.
Costs:
• personnel costs
• media and information, education and communication operating costs
• transportation operating costs
• utilities
• building capital costs
• transportation capital costs
• other costs.

32
ANNEX 2
Australian cost–utility/cost–effectiveness data for health programmes (56)
Health programmes Adjusted cost (Aus$) per life year at 1995–1996 prices
Health promotion programmes
Sydney quit smoking campaign 19
Non-drug blood pressure reduction clinic 5 969
Care/cure programmes
Neonatal intensive care, babies 1000–1500g 1 433–3 582
Kidney transplant 5 455
Neonatal intensive care, babies < 801g 4 298–5 492
Breast cancer screening 7 879–13 132
Cervical cancer screening 36 749
Hospital dialysis *57 053
AIDS treatment with zidovudine 155 201
* cost per QALY
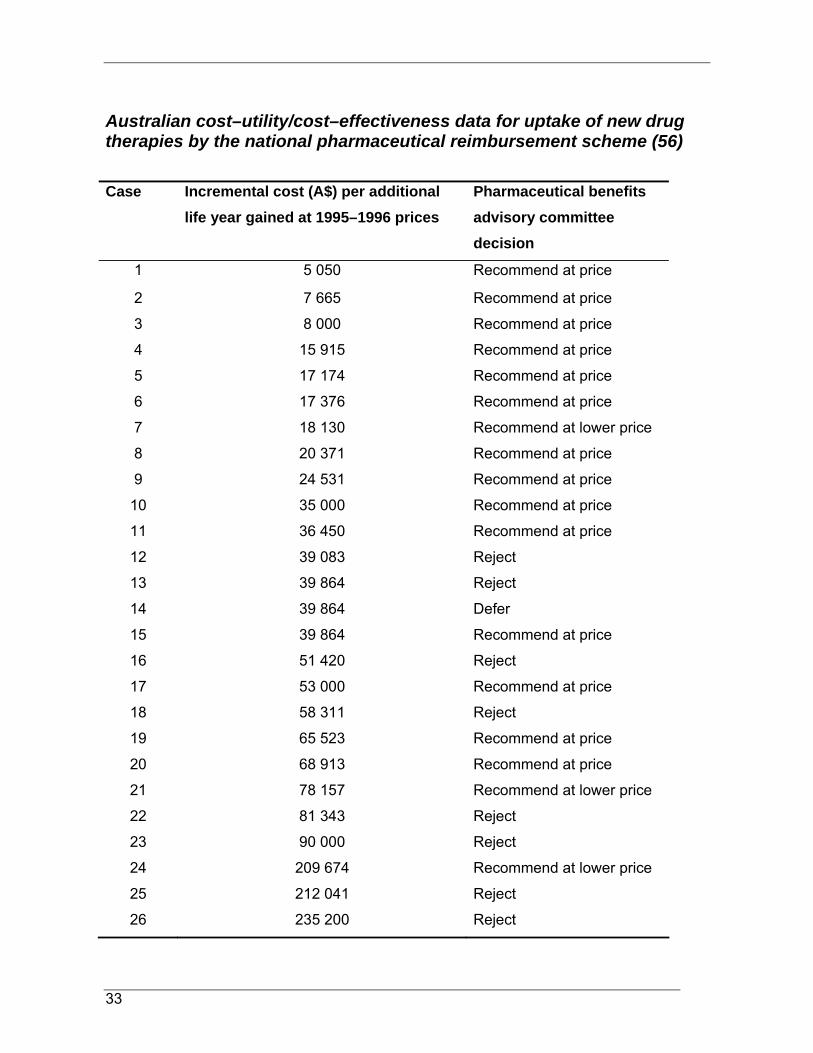
33
Australian cost–utility/cost–effectiveness data for uptake of new drug therapies by the national pharmaceutical reimbursement scheme (56)
Case Incremental cost (A$) per additional life year gained at 1995–1996 prices
Pharmaceutical benefits advisory committee decision
1 5 050 Recommend at price
2 7 665 Recommend at price
3 8 000 Recommend at price
4 15 915 Recommend at price
5 17 174 Recommend at price
6 17 376 Recommend at price
7 18 130 Recommend at lower price
8 20 371 Recommend at price
9 24 531 Recommend at price
10 35 000 Recommend at price
11 36 450 Recommend at price
12 39 083 Reject
13 39 864 Reject
14 39 864 Defer
15 39 864 Recommend at price
16 51 420 Reject
17 53 000 Recommend at price
18 58 311 Reject
19 65 523 Recommend at price
20 68 913 Recommend at price
21 78 157 Recommend at lower price
22 81 343 Reject
23 90 000 Reject
24 209 674 Recommend at lower price
25 212 041 Reject
26 235 200 Reject

34
ISBN 978 92 4 159592 8