The Effect of Winglet Twist and Toe Angle on the Drag of a ...
41
University of Central Florida University of Central Florida STARS STARS Retrospective Theses and Dissertations 1986 The Effect of Winglet Twist and Toe Angle on the Drag of a High The Effect of Winglet Twist and Toe Angle on the Drag of a High Aspect Ratio Wing Aspect Ratio Wing Thomas T. Moore University of Central Florida Part of the Engineering Commons Find similar works at: https://stars.library.ucf.edu/rtd University of Central Florida Libraries http://library.ucf.edu This Masters Thesis (Open Access) is brought to you for free and open access by STARS. It has been accepted for inclusion in Retrospective Theses and Dissertations by an authorized administrator of STARS. For more information, please contact [email protected]. STARS Citation STARS Citation Moore, Thomas T., "The Effect of Winglet Twist and Toe Angle on the Drag of a High Aspect Ratio Wing" (1986). Retrospective Theses and Dissertations. 4983. https://stars.library.ucf.edu/rtd/4983
Transcript of The Effect of Winglet Twist and Toe Angle on the Drag of a ...

University of Central Florida University of Central Florida
STARS STARS
Retrospective Theses and Dissertations
1986
The Effect of Winglet Twist and Toe Angle on the Drag of a High The Effect of Winglet Twist and Toe Angle on the Drag of a High
Aspect Ratio Wing Aspect Ratio Wing
Thomas T. Moore University of Central Florida
Part of the Engineering Commons
Find similar works at: https://stars.library.ucf.edu/rtd
University of Central Florida Libraries http://library.ucf.edu
This Masters Thesis (Open Access) is brought to you for free and open access by STARS. It has been accepted for
inclusion in Retrospective Theses and Dissertations by an authorized administrator of STARS. For more information,
please contact [email protected].
STARS Citation STARS Citation Moore, Thomas T., "The Effect of Winglet Twist and Toe Angle on the Drag of a High Aspect Ratio Wing" (1986). Retrospective Theses and Dissertations. 4983. https://stars.library.ucf.edu/rtd/4983
THE EFFECT OF WINGLET TWIST AND TOE ANGLE ON THE DRAG OF A HIGH ASPECT RATIO WING
BY
THOMAS THORPE MOORE B.S.A.E., University of Alabama, 1976
RESEARCH REPOR~
Submitted in partial fulfillment of the requirements for the Master of Science in Engineering
in the Graduate Studies Program of the College of Engineering University of Central Florida
Orlando, Florida
Fall Term 1986

ABSTRACT
Winglets have been shown to significantly reduce the
lift induced drag. Different parametric studies have
identified important winglet characteristics, but none have
examined effects on drag from varying winglet twist and toe
angle. The purpose of this research report is to examine
the drag reducing effect of winglet twist and toe angle on a
transport type high aspect ratio wing.
By using a cost-effective three dimensional
vortex-lattice program which included two dimensional
profile drag, the effect of winglet twist was found to have
a moderate drag reduction against an .untwisted winglet for
the same toe angle. For the wing-winglet configuration
studied, a minimum total drag was obtained when the winglet
has 2.8 degrees toe out and 2.5 degrees wash-in twist.
A more sophisticated computer program was used to find
areas of boundary layer separation, which were evident from
the output results. If the winglet has a large enough toe
out to prevent interference drag caused by separated flow at
the wing-winglet juncture, winglet twist can be varied to
reduce the total drag compared to an untwisted winglet.
TABLE OF CONTENTS
LIST OF FIGURES
SYMBOLS
CHAPTER
I.
II.
III.
IV.
INTRODUCTION • . • . • .
WINGLET STUDIES FOR DRAG REDUCTION • • . •
APPROACH • • • • • • • • • • • • • • • • •
DISCUSSION OF RESULTS
V. CONCLUSIONS
LIST OF REFERENCES • • •
iii
iv
v
1
3
11
18
31
32

LIST OF FIGURES
1. Elliptic Lift Distribution • 4
2. Winglet 5
3. Vortex-Lattice Simulation of Swept Wing 12
4. Drawing of Winglets and Semi-span Wing-Winglet Model . . • . • . • • . • . • . . . 16
5. Range of Twist and Toe Angles Studied 19
6. Effect of winglet Twist and Toe Angle on Total CD • • . . . . . . • • • . 21
7. Minimum Total CD for Untwisted and Optimally Twisted Winglets at Various Toe Angles • • • 22
8. Effect of Winglet Twist at Optimum Toe Angle on Minimum Total CD . • • • • • . • . • • • 24
9. Effect of Optimum Twisted and Untwisted Winglets on Span Loading (Winglet Data in Wing Plane) • • • • . • . . • • . .. • . . . • • • . . 26
10. Effect of Optimum Twisted and Untwisted Winglets on Boundary Layer Separated Flow Region (Winglet Data in Wing Plane) ....
iv
28

SYMBOLS
Force data has been reduced to coefficient form on the basis of the planform area of the wing, except for the normal force coefficient. All dimensions are in feet, pounds, or seconds.
b
c
c av
CD
CDf
CDi
CDo
CDt
cl
MN
q
Re
s
x .
y
*
wing span
local chord, feet
average chord of wing
drag coefficient, Drag/(q*S)
skin friction drag coefficient
lift induced drag coefficient
profile drag coefficient, c0 f + pressure drag
total drag coefficient, CDi + C00
section lift coefficient, normal to surface, of section normal to surf ace quarter chord line
lift coefficient, Lift/(q*S)
section force coefficient, normal to surface, of section parallel to free-stream flow
Mach number
2 free-stream dynamic pressure, pounds/feet
Reynolds number
2 wing area, feet
distance along chord line, measured from leading edge, feet
distance along wing semi-span, measured from centerline, feet
multiplication
v

CHAPTER I
INTRODUCTION
Since the oil embargo of the early 1970s, the
aerospace industry has emphasized increasing the
fuel-efficiency of existing and future transport aircraft.
One way to accomplish this is to reduce the drag of the
aircraft while maintaining the same weight-carrying
capabilities. Whitcomb (1) found that by attaching small
wings, or winglets, to the wing tips and orienting the
winglets nearly vertical, the lift induced drag of transport
type wings could be reduced up to 20 percent.
S~bsequent theoretical and experimental studies (2-18)
have fine-tuned winglet designs for existing and future
transports with varying degrees of success. Researchers
have found that a wing which has more of the lift
distribution near the tip (tip loaded) has a higher
potential for drag reduction from winglets. Computer
analysis and design programs, wind tunnel experiments and
flight tests were used in these studies to develop the
winglet with the greatest drag reduction by varying winglet
sweep, taper ratio, size, toe angle and cant angle
parameters. Since computer time is so much cheaper than
wind tunnel experiments or flight tests, most of the

2
parametric studies have been done computationally. The
design programs (2,3,5,7) were used to twist the winglet for
minimum drag due to lift, or induced drag, for each
parameter change, and the analysis programs (3,5,16,18) were
used for induced drag computations where winglet twist was
not examined along with the other parameters.
The purpose of this research report is to examine on a
high aspect ratio wing-winglet configuration the drag
reduction effect o~ winglet twist and toe angle. Since
there is a wealth of data about the Boeing KC-135 aircraft
fitted with winglets and because of the proven benefits of
winglets on this tip loaded wing, a wing-winglet
configuration similar to the KC-135 was chosen as the base
line for this study.

CHAPTER II
WINGLET STUDIES FOR DRAG REDUCTION
Whitcomb {l) found that to be fully effective,
winglets must efficiently produce significant side forces,
unlike end plates which reduce lift induced drag, but have
high viscous and interference drag. To efficiently produce
the side force, the winglet itself must produce a high
"lift" to drag ratio {L/D), considering both winglet-induced
drag and profile drag. An elliptical lift distribution,
shown in Figure 1, gives the least induced drag {19).
To obtain a lift distribution close to elliptic, wings are
usually tapered and twisted along the span.
Whitcomb {l) used winglets, shown in Figure 2, with
large winglet root to tip chord length ratio, or taper
ratio, without winglet twist. By adjusting the winglet
incidence angle, or toe angle, with respect to the local
flow induced by the wing tip vortex, Whitcomb was able to
determine the optimum side load for minimum drag. No
aerodynamic theories were available which included the drag
caused by the viscous boundary layer, termed profile drag
{CD0
), as well as induced drag, so these experiments were
accomplished by wind tunnel experiments. With positive toe
angle being defined as the leading edge of the winglet root
3

0.7
0.6
0.5
0.4
Cn*c cav
0.3
0.2
0.1
0
4
0 20 40 60
Span Position (Feet)
Figure 1. Elliptic Lift Distribution.
80

~ · I-- Tip Chord
Wing let
~ Root Chord
Side View
Wing Tip
~
(Positive
Cant~
Wing let
. I
I
Toe Angle (Negative Depicted)
Direction of Flow
Figure 2. Winglet.
Front View
Wing
Centerline
Plan View

6
chord closer to the wing center line than the winglet root
trailing edge, Whitcomb found that the greatest reduction in
drag occurred at a negative 4 degrees toe angle, or 4
degrees toe out.
Whitcomb (1) also maintained that although substantial
winglet twist would be required to obtain the desired
winglet span load in undistorted flow (no wing tip induced
flow), the wing tip vortex would provide local flow at the
winglet which would effectively give the winglet the correct
aerodynamic twist. Thus, no geometric twist would be
required. The present research report examines the validity
of this hypothesis.
Cary (2) used a non-planar lifting surface theory to
parametrically study winglet effects. The trends for drag
reduction agreed reasonably well with _Whitcomb's work,
verifying the validity of the theory. But the actual values
of drag did not match wind tunnel experiments because the
theory did not include profile drag. One area of
disagreement in the parametric study versus wind tunnel
experiment was the optimum toe angle. Because Cary's study
took into account only induced drag and neglected profile
drag, the optimum toe angle was positive 3 degrees, whereas
Whitcomb found the optimum was negative 4 degrees.
As a lifting surf ace increases in angle of attack,
the lift increases almost linearly near lift coefficients of
· transport aircraft at cruise conditions. The induced drag

7
increases proportionally to the square of the lift, but the
profile drag of a wing also increases because of changes in
the boundary layer transition point (from laminar to
turbulent flow). This effect on drag is neglected in many
cases because at cruise lift coefficients, induced drag
changes more than profile drag for a small variation of lift
(21). By ignoring profile drag, a theory which computes
only the lift induced drag will result in a winglet optimum
toe angle more positive than a real flow experiment optimum
toe angle. This is why any study which neglects profile
drag would not completely predict the total drag reduction
capabilities or optimum des~gn parameters for a winglet.
Boeing (3) thoroughly studied winglets with computer
codes which performed different functions in the design
process. The initial parametric studies were accomplished
using a mean camber line vortex-lattice simulation which
changed the winglet twist to obtain minimum induced drag
during a computer run. This resulted in the minimum induced
drag for a set of winglet parameters. After the winglet was
optimized for all parameters and a winglet design was
chosen, a three-dimensional potential flow analysis of the
wing-winglet surfaces was made on the final design to
compute detailed pressure data. This pressure data was used
in a two dimensional viscous flow computer code to obtain
the prrifile drag on the winglet, whereas the wing profile
drag was estimated from wind tunnel test data.
8
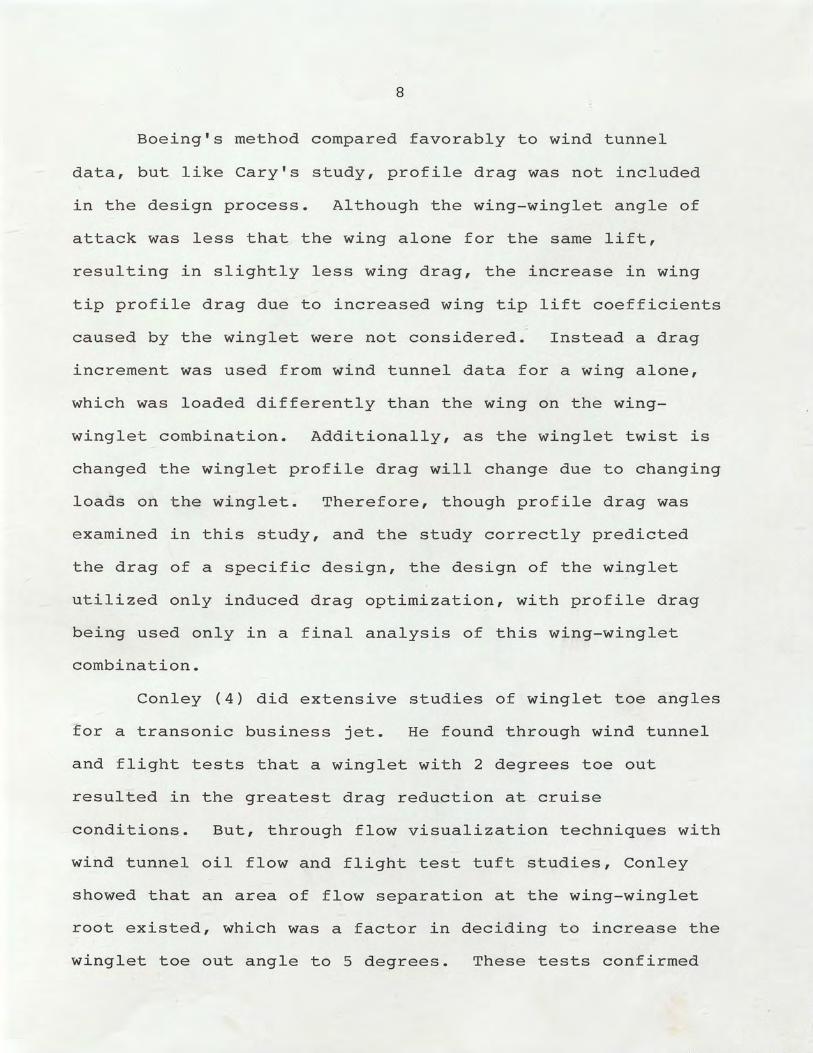
Boeing's method compared favorably to wind tunnel
data, but like Cary's study, profile drag was not included
in the design process. Although the wing-winglet angle of
attack was less that the wing alone for the same lift,
resulting in slightly less wing drag, the increase in wing
tip profile drag due to increased wing tip lift coefficients
caused by the winglet were not considered. Instead a drag
increment was used from wind tunnel data for a wing alone,
which was loaded differently than the wing on the wing
winglet combination. Additionally, as the winglet twist is
changed the winglet profile drag will change due to changing
loads on the winglet. Therefore, though profile drag was
examined in this study, and the study correctly predicted
the drag of a specific design, the design of the winglet
utilized only induced drag optimization, with profile drag
being used only in a final analysis of this wing-winglet
combination.
Conley (4) did extensive studies of winglet toe angles
for a transonic business jet. He found through wind tunnel
and flight tests that a winglet ·with 2 degrees toe out
resulted in the greatest drag reduction at cruise
conditions. But, through flow visualization techniques with
wind tunnel oil flow and flight test tuft studies, Conley
showed that an area of flow separation at the wing-winglet
root existed, which was a factor in deciding to increase the
winglet toe out angle to 5 degrees. These tests confirmed
9
Whitcomb's theory that toe out of a few degrees reduced
total drag more than toe in or zero toe angle. But the
winglet was twisted only 1 degree, without a study of the
combined effects of toe angle and twist.
Later studies of the KC-135 (6,10-15) and the
McDonnell Douglas DC-10 (7-9,14) winglets were of winglets
of varying toe angles, but no twist. This lack of winglet
twist was probably due to Whitcomb's hypothesis that winglet
twist has a negligible effect on drag reduction.
Until recently studies of the incident effects (toe
angle and twist) of winglets have been accomplished by
testing designs in wind tunnels, in flight tests or by
computational methods which only modeled lift induced drag.
But by including profile drag in a winglet study, Asai (22)
was able to computationally make deductions more like real
flow tests results than previous computational efforts. He
compared winglets to wing tip extensions on an unswept
rectangular wing using an induced drag comparison and an
induced plus profile drag comparison. Asai chose to make
the wings and winglets simple to isolate the parametric
studies, so the results cannot be used for decisions about
swept transonic winglet versus wing tip extensions. But
the study did show that when profile drag was added to
induced drag computed by vortex-lattice theory the
optimized winglet parameters could be quite different than
winglets designed with just minimizing induced drag as done

10
in previous studies. The research conclusively showed that
considering profile drag as well as lift induced drag is
necessary when using computational methods to design
winglets.
CHAPTER III
APPROACH
For reasons of economy and simplicity, a
cost-effective three dimensional wing aerodynamics program
by Kuhlman (23,24) was chosen as the main tool for this
study. This program (24), called OWDCVIE for "optimum wing
design code, viscous included, extended," uses a three
dimensional vortex-lattice simulation of a lifting surface
mean camber line. Potential flow theory and the Biot-Savart
law are used to solve the linear Laplace's equation subject
to flow tangency boundary conditions in the wing and winglet
planes. A vortex-lattice simulation, shown for a wing in
Figure 3, divides each lifting surface 'into a number of
panels. Each panel is modeled by a discrete "horseshoe"
vortex, consisting of a finite bound vortex and two semi
infinite trailing vortices. Flow tangency to the lifting
surface is satisfied at control points located on each
panel. The vortex strengths are solved simultaneously by
the flow tangency boundary condition at the control points.
Lift and induced drag are obtained from integrating vortex
strengths along the span. Using a vortex-lattice code
initially developed by Luckring (25), Kuhlman modified the
code to allow discontinuous changes in chord (as might occur
11

Single "Horseshoe" Vortex Panel
Bound
Control Point
Trailing~ Vortices
Trailing Vortices(._
Wing Vortex-Lattice
Plan View
y
Figure 3. Vortex-Lattice Simulation of Swept Wing.
x
13
at a wing-winglet juncture) and allow correct induced drag
calculations for planforms which do not extend to the
configuration centerline (winglets).
Kuhlman obtained the total drag (CDt) for a
configuration by the addition of the induced drag computed
by the vortex-lattice model and the profile drag. OWDCVIE
used an iterative optimization subroutine which changes the
lifting surf ace twist to obtain minimum CDt for design
purposes, but for this analysis, the subroutine was removed
to analyze the effects of specific winglet toe and twist
angles.
Since three dimensional viscous boundary layer effects
are difficult to model (20) without using a code which is
costly to operate, Kuhlman chose to use the method. of Nash
and Tseng (26). Using this method, OWDCVIE computes a wing
boundary layer wake momentum thickness pressure drag normal
to a surface leading edge by subtracting skin friction drag
(CDf) (20) normal to the surface leading edge from
experimental two dimensional airfoil profile drag data.
This experimental data is input by the user at a given Mach
number (MN), various effective Reynolds numbers (Re) (24)
and lift coefficients (C1 ). Experimental data usually has
a wide enough range of c1 to cover all the expected wing
span-station section c1 for a transport wing-winglet
configuration at cruise conditions. But the wide range of
effective Re affecting transport type configurations

14
(1 x 10 6 to 30 x 10 6 for the KC-135 wing-winglet
configuration in Whitcomb's tests) is difficult to duplicate
experimentally. If a reliable two dimensional airfoil
analysis code were available, profile drag data could be
obtained at a wide enough range of Re to use in OWDCVIE.
Once the normal boundary layer momentum thickness
pressure drag is computed, the free-stream component of the
pressure drag is added to the skin friction drag in the
freestream direction, resulting in the profile drag of a
wing span-station section. Integrating this profile drag
over the entire span of the configuration gives the
configuration profile drag. Interference drag is neglected
in this code because three dimensional boundary layer
separation effects cannot be modeled. Since no supersonic
shock waves are modeled by this method, the free-stream MN
for this research was maintained at 0.73. According to wing
sweep theory (26), this would result in a MN of 0.6 normal
to a configuration constant quarter chord sweep of 35
degrees. This swept MN is small enough that no shock
induced boundary layer separation occurred on the airfoil
(27) used in this research.
The experimental two dimensional data used in this
research (27) was obtained at a MN of 0.6 with Re ranging
10 6 6 . from 3 x to 25.6 x 10 . This Re range limited the
wing root to winglet tip ratio to less than 4.25. A ratio
of 3.51 was chosen to assure staying within the allowable Re
15
range. Boeing research (3) found that a winglet span to
wing semi-span ratio of 0.15 resulted in a good trade-off
between drag reduction and aircraft weight increase due to
wing structure strengthening from an increased wing root
bending moment. Whitcomb (1) recommended a large winglet
taper ratio, but the recommended taper ratio was not
obtained due to the Re limitation.
The wing-winglet configuration used is shown in
Figure 4. This transport type wing has a high aspect ratio
(7.66) and medium sweep angle, with no twist along the span.
The winglet sweep at the constant quarter chord line i~ - the
same as the wing, and the w~nglet is varied in toe angle and
twist for each test case.
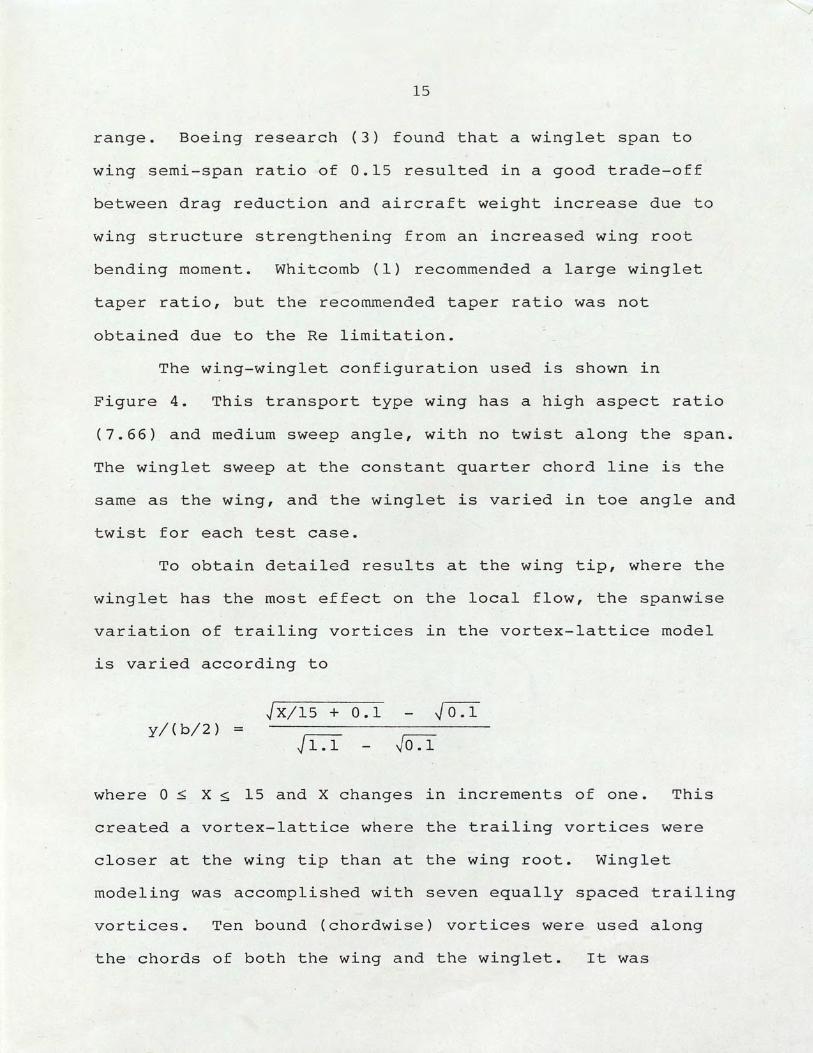
To obtain detailed results at the wing tip, where the
winglet has the most effect on the local flow, the spanwise
variation of trailing vortices in the vortex-lattice model
is varied according to
Jx/15 + 0.1 y/(b/2) =
where 0 s X ~ 15 and X changes in increments of one. This
created a vortex-lattice where the trailing vortices were
closer at the wing tip than at the wing root. Winglet
modeling was accomplished with seven equally spaced trailing
vortices. Ten bound (chordwise) vortices were used along
the chords of both the wing and the winglet. It was

Winglet Ff ont View
15°
Section A-A · I I ~ 5.7 14-
Wing Tip 1 38° Section
~ ,---
--T - --~ - _ ... -:--
1 1-9. 75 ~is---
Wing
y ·wing-Winglet Plan View
Figure 4. Drawing of Winglets ~nd Semi-Span Wing-Winglet Model.
I .
17
determined that increasing the density of bound vortices to
15, as recommended by Lamar (28), increased the computer
code run time without much change in wing-winglet drag
characteristics.
Following the parametric study of winglet toe angle
and twist, Rosen's (29) fully transonic, three dimensional
winglet analysis program was used to examine local flow for
regions of supersonic flow and boundary layer separation not
computed by OWDCVIE. Rosen's program solves a modified
transonic small-disturbance potential flow equation where
the actual surface, not the mean camber line, is modeled in
a Cartesian grid for the wing and a cylindrical grid for the
winglet. Because terms are retained from the full potential
equation for transonic modeling and to allow for cross flows
in the x-y plane, the flow equation is not a linear
Laplace's equation like OWDCVIE, but a nonlinear equation.
Pressures from this potential flow solution are then used in
a two dimensional turbulent boundary layer analysis to
predict boundary layer separation as well as cnt• Since
this code uses 1.5 hours of IBM 4381 computer processing
time versus two minutes for the OWDCVIE code, its use was
limited to analysis of the wing without a winglet and the
wing-winglet configurations which were computed to have the
least total drag from OWDCVIE results.

CHAPTER IV
DISCUSSION OF RESULTS
This discussion is limited to small twist and toe
angles, as shown in Figure 5. Extreme values of toe and
twist angles were not examined since the purpose of this
research was for finding the effects of these parameters
on minimum drag. Extreme values would cause large regions
of local flow separation, which OWDCVIE cannot simulate.
Toe angles were measured from the free-stream flow
direction to the winglet root chord line. Positive angles
corresponded to a positive angle of attack, or, the winglet
root chord leading edge closer to the configuration
centerline than the trailing edge. Twist angles were
measured from the winglet root chord line to the winglet tip
chord line. Positive angles corresponded to wash-in, or,
the leading edge of the winglet tip chord closer to the
configuration centerline than the root leading edge. Linear
lofting is used by OWDCVIE along the winglet span, which is
more representative of wing manufacturing techniques.
All research was done at a free-stream MN= 0.73 and
configuration lift coefficient CL = 0.5, parameters which
are similar to values used in other transport wing-winglet
configuration studies (1-18). For the effective section Re
18

10
12
8
4
Twist (Degrees)
0
-4
-8
-12 -8 -6
19
-4
0- Minimum or Maximum Twist Angle
0
-2 0 2
Toe Angle (Degrees)
Figure 5. Range of Twist and Toe Angles Studied.
20
to be within the limits of experimental two dimensional
~irfoil data (27), the free-stream Reynolds number was set
6 at 1.25 x 10 per foot. This set the winglet tip effective
Re at 3.4 x 10 6 and the wing root effective Re at 24.6 x
6 10 ., as computed by OWDCVIE.
For this research, toe angle was held constant for a
specific range of twist (Figure 5) to obtain values of c0
t
versus twist, as shown in Figure 6. Initially, twist was
changed using increments of two degrees. Once the general
curve shape was established, the increment was reducted to
0.2 degrees for the region within two degrees of the
estimated minimum Cot• From this finer increment, the
minimum c0
t could be determined. The constant toe angle
value is under the corresponding plotted curve. Each of the
curves display similar parabolic characteristics. For each
constant toe angle, as the winglet is twisted at varying
increments, c0
t steeply decreases to a minimum value. For
a specific toe angle, winglet twist can have an effect on
reducing the drag of a configuration.
The locus of the minimum c0
t ·for the range of toe
angles examined is depicted in Figure 7. Values for an
untwisted winglet with varying toe angle is shown for
comparison. For the twisted winglet the minimum drag varies
with toe angle. From the locus plot it can be seen that
there is one toe angle with lesser c0
t than any other.
The degree of c0 t variance with toe angle for an optimally

21
0.0183
0.0182
0.0181
0.0180
0.0179
0.0178
-20 _40 Toe Angle
0.0177
0.0176 -8 -4 0 4 8 12 16
Twist (Degrees)
Figure 6 . Effect of Wing let Twist and Toe Angle on Total CD.

0.0183
0.0182
0.0181
0.0180
Minimum
CDt
0.0179
0.0178
0.0177
0.0176 -8
\
\ \
-6
22
- - -- Untwisted
Optimally Wing lets
\ \ \ \ \ \ \ \ \ \ \ \ \
\
\ \
\ ~
'-...
-4 -2 0
Toe Angle (Degrees)
Winglets
Twisted
I I I
I I
I I
I I
I
2
Figure 7. Minimum .Total CD for Untwisted and Optimally
Twisted Winglets at Various Toe Angles.
23
twisted winglet is less than Figure 6 because each toe angle
case in Figure 7 has already been twisted to the minimum
c0 t. The untwisted winglet curve shows that if a winglet
twist is held constant, CDt can vary with toe angle to a
large extent. From Figure 7, it can be determined that for
an optimally twisted winglet for this wing-winglet
configuration, a toe angle of -2.8 degrees results in the
minimum total drag. The untwisted winglet needs a toe angle
of -1.7 degrees to reach a minimum total drag.
To find the exact value of twist for minimum drag with
the winglet toe angle of -2.8 degrees, the winglet was again
examined using OWDCVIE. Figure 8 shows the results. The
twist angle with the least CDt was 2.5 degrees wash-in,
which is opposite conventional wing design practices (30).
Because of vortex flow around the front part of the
wing tip not covered by the winglet root, the winglet root
will be at a higher local angle of attack than if this
vortex flow did not exist, as would be the case at the root
of a wing tip extension. From the Biot-Savart vortex law
(30), where the velocity induced on a point is proportional
to the inverse of its distance from a vortex filament, the
wing tip vortex flow has less influence on the local angle
of attack of a span section near the winglet tip than the
winglet root. Whitcomb (1) states this when he says that
"the decrease in inflow with increase in winglet height
above the wing approximately provides the desired

0.0183
0.0182
0.0181
0.0180
0.0179
0.0178
0.0177
0.0176 -8 -4
24
-2.8° Toe Angle
0 4 8 12
Twist (Degrees)
Figure 8. Effect of Winglet Twist at Optimum Toe Angle on Minimum Total CD.
16

25
aerodynamic twist." If a winglet has a negative toe angle
to prevent high local angles of attack at the winglet root
sections, the influence of the wing tip vortex flow does
cause an effective "aerodynamic twist" to a winglet. But
this "twist" may not be the optimum for a specific toe angle
to obtain the minimum CDt' as seen in figures 6 and 8. For
this configuration, comparison of the untwisted winglet
minimum c0 t in Figure 7 and the optimum design determined
from Figure 8 shows very little difference in drag values,
since interference drag is neglected.
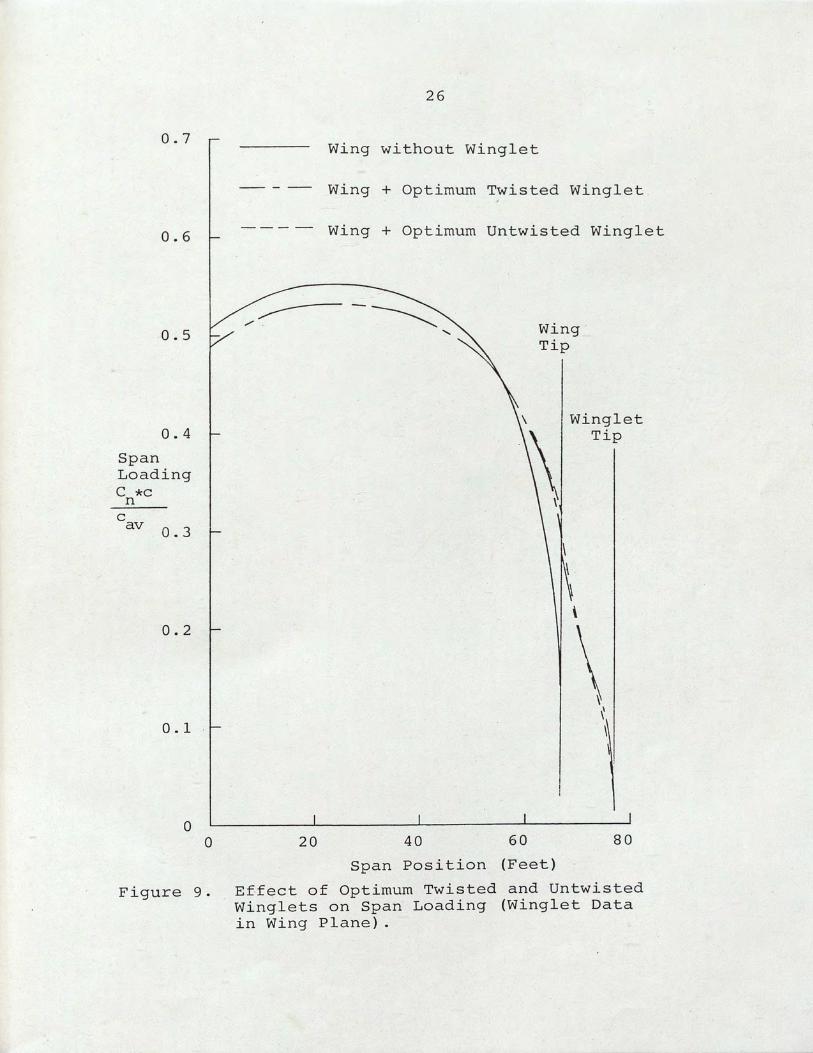
Figure 9 shows the span loading, or lift distribution,
along the span of the configuration. The loading along the
winglet span is depicted on the end of the wing span by
rotating the winglet spanwise axis down to the wing spanwise
axis. By adding winglets, the lift along approximately the
first 80 percent of the the wing span is reduced and is
increased from 80 percent of the wing span to the wing tip.
The untwisted winglet (-1.7 degrees toe angle) has more of
the winglet lift distribution inboard towards the root than
the twisted winglet (-2.8 degrees toe angle, +2.5 degrees
twist), resulting in a slightly higher c0 i and CDt' as
shown in Table 1.
These two optimum winglets were examined in Rosen's
program (29) for boundary layer flow separation regions that
cannot be simulated in OWDCVIE. Figure 10 shows the point
on the local chord where flow separation occurs along the
26
0.7 Wing without Winglet
Wing + Optimum Twisted Winglet
o. 6 -- - - Wing + Optimum Untwisted Winglet
0.4
Span Loading C *C n c av 0.3
0.2
0.1
0 0 20 40 60 80
Span Position (Feet)
Figure 9. Effect of Optimum Twisted and Untwisted Winglets on Span Loading (Winglet Data in Wing Plane) .

27
TABLE 1
COMPARISON OF MINIMUM DRAG DATA
REDUCTION IN" DRAG TOE TWIST (COMPARED TO WING
ANGLE ANGLE CDi cot WITHOUT WINGLET cot>
Wing without Wing let .01070 .01876
-1.7 0 00 .00886 .01778 5.22 %
-2.8° 2.5° .00885 .01776 5. 33: %
-2.8° 00 .00893 .01782 5.01 %
_40 \
40 .00888 .01778 5.22 %
_40 00 .00906 .01793 4. 42, %
-60 80 .00891 .01781 5.06 %
0 -6 1 00 .00940 .01826 2.67 %

1.0
0.9
0.8 Point Boundary Layer Separates
x/c 0.7
0.6
0.5 0 20
28
Wing Tip Wing let
Tip
-\ ( ' t
Wing without Wing let ~,I
Wing with Optimum. Twisted Winglet
Wing with Optimum Untwisted Winglet
40 60
Span Position (Feet)
/! I I
80
Figure 10. Effect of Optimum Twisted and Untwisted Winglet on Boundary Layer Separated Flow Region (Winglet Data in Wing Plane).

29
span of the configuration, with the winglet span being
depicted the same as in Figure 9. This program poorly
predicts drag values when there exist large regions of
separated flow, but it tian still be used to predict where
separation occurs. Without a winglet, the flow separates
on the wing at around 93 percent of the local chord along
the span. Local vortex flow at the wing tips reduces the
separated flow region on the outer portion of the wing.
With the untwisted winglet, the flow separation region is
quite large on the wing tip and winglet root areas, or,
the wing-winglet juncture. This would cause a larger
increase in the drag than predicted by OWDCVIE (21).
Comparing the twisted winglet to the untwisted
winglet in Figure 10, the separated flow region is reduced
in the wing-winglet juncture because of the decreased
section lift at the winglet root for the twisted winglet,
as shown in Figure 9. Winglet twist can be seen to have
very little effect on separated flow.
A sophisticated program, like Rosen's, can be used by
a designer to find a toe angle which· results in acceptably
small regions of separated flow. For this case, a toe angle
of between -4 degrees and -6 degrees would probably reduce
the separated flow region to an acceptable amount. This
would agree with the toe angle comparative results of
Conley (4) and for the KC-135 (13), which found reduced
separated flow regions at these toe angles. If these

30
increased toe out angles decrease the separated flow
regions, then winglet twist would have an even greater
effect on reducing the total drag over an untwisted winglet,
as can be seen in Table 1.
CHAPTER V
CONCLUSIONS
A computational investigation of the effect of winglet
twist and toe angle on an aircraft transport type wing has
been conducted. Minimum drag considerations have utilized
the total drag of a wing-winglet configuration, including
viscous boundary layer drag as well as lift induced drag.
A twisted winglet can accomplish a greater drag
reduction for a wing than an untwisted winglet at the same
toe angle. Whitcomb's suggestion (1) to use an untwisted
winglet does not allow for the amount of "aerodynamic twist"
imparted on the winglet by local vortex flow. This research
shows that to gain the greatest drag reduction from
winglets, twist angle should be included in the design
process.
Toe angle has a large effect on total drag because of
the corresponding local angle of attack of the winglet root.
To prevent excessive interference drag from large regions of
boundary layer separated flow at a wing-winglet juncture, a
sophisticated computer code should be used to examine
wing-winglet juncture flow. A less sophisticated, less
costly code can then be used to optimize the winglet twist.
31
LIST OF REFERENCES
(1) National Aeronautics and Space Administration. A Design Approach and Selected Wind-Tunnel Results at High Subsonic Speeds for Wing-Tip Mounted Winglets, by R~chard T. Whitcomb. NASA TN D-8260 _(1976).
(2) Cary, Mitchell D. "A Parametric Analysis of Winglet Effects." M.S. Thesis, Air Force Institute of Technology, 1976.
(3) Boeing Commercial Airplane Co. Design and Analysis of Winglets for Military Aircraft (AFFDL TR-76-6). Wright-Patterson AFB, Ohio: Air Force Flight Dynamics Lab, 1976.
(4) Conley, N. E. Winglet Toe Out Angle Optimization for the Gates Learjet Longhorn Wing (AIAA-79-1831). New York: American Institute of Aeronautics and Astronautics [1979].
(5) Ishimitsu, Kichio K. Aerodynamic Design and Analysis of Winglets (AIAA-76-940). New York: American Institute of Aeronautics and Astronautics [1976].
(6) National Aeronautics and Space Administration. Effect of Winglets on a First-Generation Jet Transport Wing II, by Lawrence C. Montoya, Stuart G. Flechner, and Peter F. Jacobs. NASA TN D-8474 (1977).
,' (7) . Dahlin J. A. Aerodynamic Evaluation of Winglets for Transport Aircraft (AIAA-81-1215). New York: American Institute of Aeronautics and Astronautics [1981].
' (8) National Aeronautics and Space Administration. Results of Winglet Development Studies for DC-10 Aircraft, by Carl A. Shollenberger, J. W. Humphreys, F. s. Heiberger, and R. M. Pearson. NASA CR-3677 (1983).
(9) National Aeronautics and Space Administration. Design and Wind Tunnel Tests of Winglets on a DC-10
·wing, by R. D. Gilkey. NASA CR-3119 (1979).
32
33
(10) National Aeronautics and Space Administration. KC-135 Wing and Winglet Flight Pressure Distributions, Loads, and Wing Deflection Results with Some Wind Tunnel Comparisons, by Lawrence Montoya, P. Jacobs, S. Flechner, and R. Sims. California: NASA Dryden Flight Research Center, 1982.
(11) National Aeronautics and Space Administration. In-Flight Lift and Drag Measurements on a First Generation Jet Transport Equipped With Winglets, by David P. Lux. California: NASA Dryden Flight Research Center, 1982.
(12) National Aeronautics and Space Administration. Comparison of Flight Measured, Predicted and Wind Tunnel Measured Winglet Characteristics on a KC-135 Aircraft, by Robert o. Dodson, Jr. California: NASA Dryden Flight Research Center, 1982. .. .
(13) National Aeronautics and ppace Administration. KC-135 Winglet Program Review. NASA CP-2211 (1982).
~ (14) National Aeronautics and Space Administration. Experimental Results of Winglets on First, Second, and Third Generation Jet Transports, by Stuart G. Flechner and Peter F. Jacobs. NASA TM-72674 (1978).
(15) National Aeronautics and Space Administration. KC-135 Winglet Program Overview, by Marvin R. Barber and David Selegan. California: NASA Dryden Flight Research Center, 1982.
(16) National Aeronautics and Space Administration. Effects of Winglets on the Induced Drag of Ideal Wing Shapes, by R. T. Jones and T. A. Lasinski. NASA TM-81230 (1980).
(17) Webber, G. w., and Dansby, T. ·"wing Tip Devices for Energy Conservation and Other Purposes -Experimental and Analytical Work in Progress at the Lockheed-Georgia Company." Canadian Aeronautics and Space Journal 29 (June 1983): 105-120.
(18) Chardrasedharan, R. M.; Murphy, W. R.; Taverna, F. P.; and Poppe, C. W. Computational Aerodynamic Design of the Gulfstream IV Wing (AI'AA-85-0427). New York: American Institute of Aeronautics and Astronautics [1985].

(19)
(20)
(21)
(22)
(23)
( 24)
(25)
(26)
(27)
(28)
34
National Advisory Committee of Aeronautics. The Minimum Induced Drag of Aerofoils, by Max M. Munk. NACA Report No. 121 (1921).
Schlichting, Hermann. Boundary-Layer Theory. 7th ed. Translated by J. Kestin. New York: McGraw-Hill Book Co., 1979.
Hoerner, Sighard F. Fluid-Dynamic Drag. Midland Park, New Jersey: By the Author, 148 Busteed Drive, 1958.
Asai, Keisuke. "Theoretical Considerations in the Aerodynamic Effectiveness of Winglets." Journal of Aircraft 22 (July 1985):635-37.
Kulhman, John M. Iterative Optimal Subcritical Aerodynamic Design Code Including Profile Drag (AIAA-83-0012). New York: American Institute of Aeronautics and Astronautics [1983].
National Aeronautics and Space Administration. Theoretical/Numerical Study of Feasibility of Use of Winglets on Low Aspect Ratio Wings at Subsonic and Transonic Mach Numbers to Reduce Drag, by John M. Kuhlman, and Paul Liaw. NASA Progress Report for Grant NAG-1-625 (1986).
National Aeronautics and Space Administration. Some Recent Applications of the Suction Analogy to Asymmetric Flow Situations, by J. M. Luckring. NASA SP-405 (1976).
Nash, J. F., and Tseng, R. R. "The Three-Dimensi6nal Turbulent Boundary Layer on an Infinite Yawed Wing." Aeronautical Quarterly, November 1971, pp.346-62.
National Aeronautics and Space Administration. High Reynolds Number Test of a NACA 651-213, a= 0.5 Airfoil at Transonic Speeds, by Kenneth P. Burdges, James A Blackwell, Jr., and Gerald A. Pounds. NASA CR-2499 (1975).
National Aeronautics and Space Administration. A Vortex Lattice Method for the Mean Camber-Shapes of Trimmed Noncoplanar Planforms with Minimum Vortex Drag, by John E. Lamar. NASA TN D-8090 (1976).

35
(29) Rosen, Bruce S. Transonic Analysis of Canted Winglets (AIAA-84-0302). New York: American Institute of Aeronautics and Astronautics [1984].
(30) Kuethe, _Arnold M., and Chow, Chuen-Yen. Foundations of Aerodynamics: Bases of Aerodynamic Design. 3rd ed. New Yor~: John Wiley & Sons, 1976.