THE EFFECT OF WATER STRESS ON RADIATION INTERCEPTION ... · THE EFFECT OF WATER STRESS ON RADIATION...
12
114 Turk J Field Crops 2017, 22(1), 114-125 DOI: 10.17557/tjfc.311904 THE EFFECT OF WATER STRESS ON RADIATION INTERCEPTION, RADIATION USE EFFICIENCY AND WATER USE EFFICIENCY OF MAIZE IN A TROPICAL CLIMATE Geneille E. GREAVES 1 , Yu-Min WANG 2* 1 National Pingtung University of Science and Technology, Department of Tropical Agriculture and International Cooperation, Pingtung, TAIWAN (R.O.C) 2 National Pingtung University of Science and Technology, Department of Civil Engineering, Pingtung, TAIWAN (R.O.C) *Corresponding author: [email protected] Received: 02.12.2016 ABSTRACT This study was conducted to investigate the effect of deficit irrigation on radiation capture, radiation use efficiency (RUE) and water use efficiency (WUE) in maize production, and to assess how these factors impact biomass production in water stress environments. Five irrigation levels were investigated: a full irrigation treatment with a water depth of 60 mm (I1), and four deficit irrigation treatments with depths of 50 (I2), 40 (I3), 30 (I4) and 20 mm (I5). Crop water stress index values indicated treatments I2 and I3 caused mild water stress while I4 and I5 caused severe stress. Water deficits significantly (p<0.05) reduced leaf area index compared to full irrigation. The reduction in biomass for I2 to I5 ranged between 7 and 43% relative to I1. In I1, the RUE was 3.46 g MJ -1 , while mild and severe water stress significantly reduced it to 3.11 and 2.69 g MJ −1 , respectively. A reduction in both intercepted photosynthetically active radiation and RUE contributed significantly to biomass reduction. Mild and severe water stress improved the WUE within range of 2 and 25% and 10 and 34%, respectively. The results suggest that in mild water stress environments, high RUE aids in minimizing production losses, and in cases of severe water stress, the reduced ability to capture and utilize radiation is compensated by improving the WUE. Keywords: biomass, crop water stress index, deficit irrigation, maize, photosynthetically active radiation. INTRODUCTION Increasing global pressure to maintain food security and environmental integrity, under the constraints of increasing food and water demands, an evolving economy and decreasing water availability for irrigation dictates that crop production improve per unit of water consumed (Spiertz, 2012). As such, irrigation management strategies that mitigate water wasted in crop production while minimizing yield losses have an integral role to play in sustainable agricultural development. Deficit irrigation (DI), defined as the intentional under-irrigation of crops, has been identified as a water management strategy that can improve water use in irrigated agricultural production (Klocke et al., 2004). However, this management practice can expose plants to abiotic stress that often results in plants modifying specific mechanisms and thus leading to a reduction in productivity (Akcay and Dagdelen, 2016). Thus, as crop productivity is directly related to plants ability to capture resources, such as water and light, and the efficiency with which they convert these physical resources into biological materials (Yi et al., 2010), a practical technique for quantifying plant response to its growing environment involves relating its dry matter production to either the amount of radiation captured or water transpired. These processes are often categorized as either ‘solar engine’ or ‘water engine’ (Steduto and Albrizio, 2005; Mwale et al., 2007). The solar growth-engine quantifies crop growth as a function of the radiation captured and used. Crop biomass production depends on total solar radiation, the fraction of this radiation that is intercepted by the crop canopy and the efficiency by which intercepted radiation is converted into biomass (Lindquist et al., 2005; Teixeira et al., 2014). The parameter used to quantify this relation, defined as the amount of dry biomass produced per unit intercepted photosynthetically active radiation (PARi), is the radiation use efficiency (RUE). Traditionally, the RUE is estimated by regressing cumulative biomass on radiation intercepted because of the strong linear relationship between these variables (Sinclair and Muchow, 1999). However, it has been criticized because of its dependence on cumulative intercepted energy which has logical and arithmetic weaknesses (Demetriades-Shaw et al., 1994), and because its consistency mainly ascribes to optimal growing
Transcript of THE EFFECT OF WATER STRESS ON RADIATION INTERCEPTION ... · THE EFFECT OF WATER STRESS ON RADIATION...
114
Turk J
Field Crops
2017, 22(1), 114-125
DOI: 10.17557/tjfc.311904
THE EFFECT OF WATER STRESS ON RADIATION INTERCEPTION,
RADIATION USE EFFICIENCY AND WATER USE EFFICIENCY
OF MAIZE IN A TROPICAL CLIMATE
Geneille E. GREAVES1, Yu-Min WANG2*
1National Pingtung University of Science and Technology, Department of Tropical Agriculture and
International Cooperation, Pingtung, TAIWAN (R.O.C) 2National Pingtung University of Science and Technology, Department of Civil Engineering, Pingtung,
TAIWAN (R.O.C)
*Corresponding author: [email protected]
Received: 02.12.2016
ABSTRACT
This study was conducted to investigate the effect of deficit irrigation on radiation capture, radiation use
efficiency (RUE) and water use efficiency (WUE) in maize production, and to assess how these factors impact
biomass production in water stress environments. Five irrigation levels were investigated: a full irrigation
treatment with a water depth of 60 mm (I1), and four deficit irrigation treatments with depths of 50 (I2), 40 (I3),
30 (I4) and 20 mm (I5). Crop water stress index values indicated treatments I2 and I3 caused mild water stress
while I4 and I5 caused severe stress. Water deficits significantly (p<0.05) reduced leaf area index compared to
full irrigation. The reduction in biomass for I2 to I5 ranged between 7 and 43% relative to I1. In I1, the RUE
was 3.46 g MJ-1, while mild and severe water stress significantly reduced it to 3.11 and 2.69 g MJ−1,
respectively. A reduction in both intercepted photosynthetically active radiation and RUE contributed
significantly to biomass reduction. Mild and severe water stress improved the WUE within range of 2 and
25% and 10 and 34%, respectively. The results suggest that in mild water stress environments, high RUE aids
in minimizing production losses, and in cases of severe water stress, the reduced ability to capture and utilize
radiation is compensated by improving the WUE.
Keywords: biomass, crop water stress index, deficit irrigation, maize, photosynthetically active radiation.
INTRODUCTION
Increasing global pressure to maintain food security
and environmental integrity, under the constraints of
increasing food and water demands, an evolving economy
and decreasing water availability for irrigation dictates
that crop production improve per unit of water consumed
(Spiertz, 2012). As such, irrigation management strategies
that mitigate water wasted in crop production while
minimizing yield losses have an integral role to play in
sustainable agricultural development. Deficit irrigation
(DI), defined as the intentional under-irrigation of crops,
has been identified as a water management strategy that
can improve water use in irrigated agricultural production
(Klocke et al., 2004). However, this management practice
can expose plants to abiotic stress that often results in
plants modifying specific mechanisms and thus leading to
a reduction in productivity (Akcay and Dagdelen, 2016).
Thus, as crop productivity is directly related to plants
ability to capture resources, such as water and light, and
the efficiency with which they convert these physical
resources into biological materials (Yi et al., 2010), a
practical technique for quantifying plant response to its
growing environment involves relating its dry matter
production to either the amount of radiation captured or
water transpired. These processes are often categorized as
either ‘solar engine’ or ‘water engine’ (Steduto and
Albrizio, 2005; Mwale et al., 2007).
The solar growth-engine quantifies crop growth as a
function of the radiation captured and used. Crop biomass
production depends on total solar radiation, the fraction of
this radiation that is intercepted by the crop canopy and
the efficiency by which intercepted radiation is converted
into biomass (Lindquist et al., 2005; Teixeira et al., 2014).
The parameter used to quantify this relation, defined as
the amount of dry biomass produced per unit intercepted
photosynthetically active radiation (PARi), is the radiation
use efficiency (RUE). Traditionally, the RUE is estimated
by regressing cumulative biomass on radiation intercepted
because of the strong linear relationship between these
variables (Sinclair and Muchow, 1999). However, it has
been criticized because of its dependence on cumulative
intercepted energy which has logical and arithmetic
weaknesses (Demetriades-Shaw et al., 1994), and because
its consistency mainly ascribes to optimal growing

115
conditions (Albrizio and Steduto, 2005). Alternatively,
RUE can be quantified by the short-interval crop growth
rate (CGR) method, determined as the biomass increase
between two consecutive harvests and the PARi during
that period (Lindquist et al., 2005; Confalone et al., 2010).
These authors highlighted that this method is the least bias
because CGR values are independent.
One of the most influential factors to agricultural
production systems is the soil moisture environment
during the growing season, and in non-limiting
environments the water-driven growth engine generally
dominates crop growth and productivity. However, as
water becomes a limiting factor, crop growth is influenced
by both the water-driven and solar-driven growth engine
as both the fraction of intercepted radiation and RUE can
be reduced under drought (Mwale et al., 2007). Under
water stress conditions, plants may modify their water
extraction pattern from the soil, minimize water transpired
by closing their stomata and reduce the diffusion of CO2
into the leaves (Mwale et al., 2007; Yi et al., 2010). Water
stress also results in reduced green leaf area index (LAI)
which progressively leads to reduced PARi and RUE
(O’Connell et al., 2004). Water use efficiency (WUE)
defined in terms of the relationship between above ground
biomass and cumulative transpiration is often used to
quantify the influence of soil moisture on crop growth
owing to the conservative link between biomass and
transpiration (Steduto and Albrizio, 2005). This method of
examining water productivity intrinsically reflects the
genetic response of the crop and is a direct reflection of
the efficiency of water use at the plant level (Vadez et al.,
2014).
Maize is the most widely produced crop in the world.
Owing to the diversification of its uses, its production
facilitate in the improvement of a country’s food self-
sufficiency and food security. The production of maize in
Taiwan has decreased considerably over the last decades
owing mainly to an expansion in rice production (Perng,
2013). Thus, reviving the maize industry is vital in the
efforts towards creating a more diverse and resilient
agriculture sector. In Taiwan, the main growing period for
maize usually occurs during the winter season which is
characterized by low precipitation. Consequently,
irrigation is often used as a supplemental water source.
However, decreasing water availability for irrigation amid
a water intensive rice industry, Taiwan’s main crop,
heightens the need to identify sustainable water
management strategies to ensure successful revival and
planned expansion of maize production. Implementing a
feasible DI management strategy requires rigorous
exploration, especially given that relatively low solar
radiation and temperatures are also features of the main
cropping season. Payero et al. (2006) and Farré and Faci
(2009) reported that the feasibility of this strategy is
subject to specific/localized environments and highlighted
that this water management strategy might not be suitable
under all climatic environments. Factors affecting the
feasibility can be attributed to the capture and use of
essential production resources.
The objectives of this study were; (i) to investigate the
effect of water deficits on radiation capture, RUE and
WUE of maize in southern Taiwan tropical environment;
and (ii) to examine whether the high productivity of maize
subject to feasible DI strategies is attributable to the
ability in intercepting solar radiation during the growing
season, to high RUE, or to a combination of both factors.
MATERIALS AND METHODS
Site characteristics, growing environment
and agronomic details
Field experiments were conducted during the
winter cropping season from November to March 2014 to
2015 (2014/15) and 2015 to 2016 (2015/16) at the
irrigation experimental site of National Pingtung
University of Science and Technology, Southern Taiwan
(22.65oN: 34.95oE: 71 m above sea level). The soil at the
experimental site is classified as loamy (27% sand; 24%
clay) with a bulk density of 1.4 g/cm3. The average
volumetric water content for a 1 m soil profile depth at
saturation, field capacity and permanent wilting point are
42.9, 30.5 and 15%, respectively. The November to March
growing period is one of the main cropping seasons for
maize in this location as summer months, which have a
warmer and more conducive temperature for maize
production, coincide with the typhoon season which
increases farmer’s risk in crop production. The climate for
the study area is classified as tropical wet and dry with
extreme spatial and temporal rainfall distribution; more
than 80% of the rainfall occurs in the wet period from
May to October and most of the rain is concentrated in
typhoon events. Associative dry spells and lack of rainfall
are thus features of this cropping season.
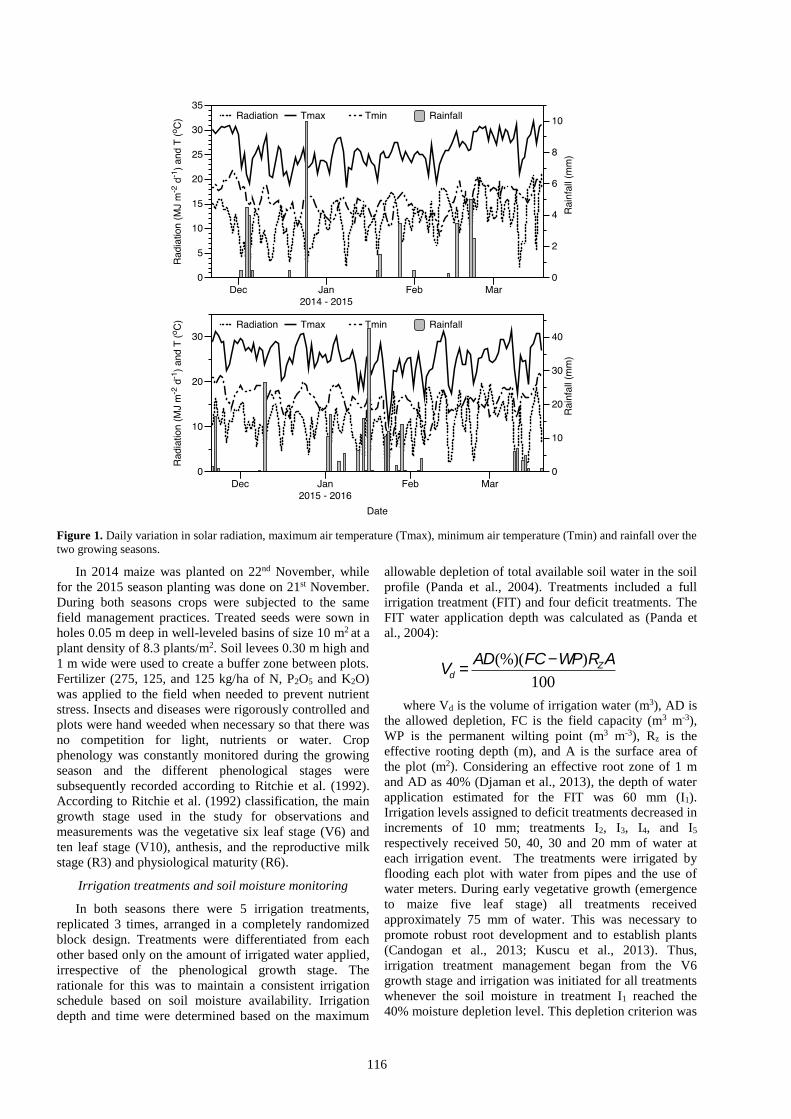
The 2014/15 cropping season was drier than 2015/16
with cumulative rainfall of 40 mm compared to 214 mm.
In particular, January was wetter during the 2015/16
season with a total rainfall of 141.5 mm (Fig. 1). The
rainfall recorded during the 2015/16 season was atypical
to that observed for the study location; total long-term (15
years) rainfall during the cropping period is 65.4 mm.
Seasonal mean incident solar radiation was approximately
14.9 and 13.9 MJ m-2d-1 in 2014/15 and 2015/16,
respectively. The average air temperature during both
seasons was about 20 oC. Over the two seasons, the mean
daily maximum temperature ranged from 11 to 32 oC,
while the mean daily minimum temperature ranged from 5
to 22 oC. Seasonal variation in weather conditions for both
cropping seasons is depicted in Fig. 1.
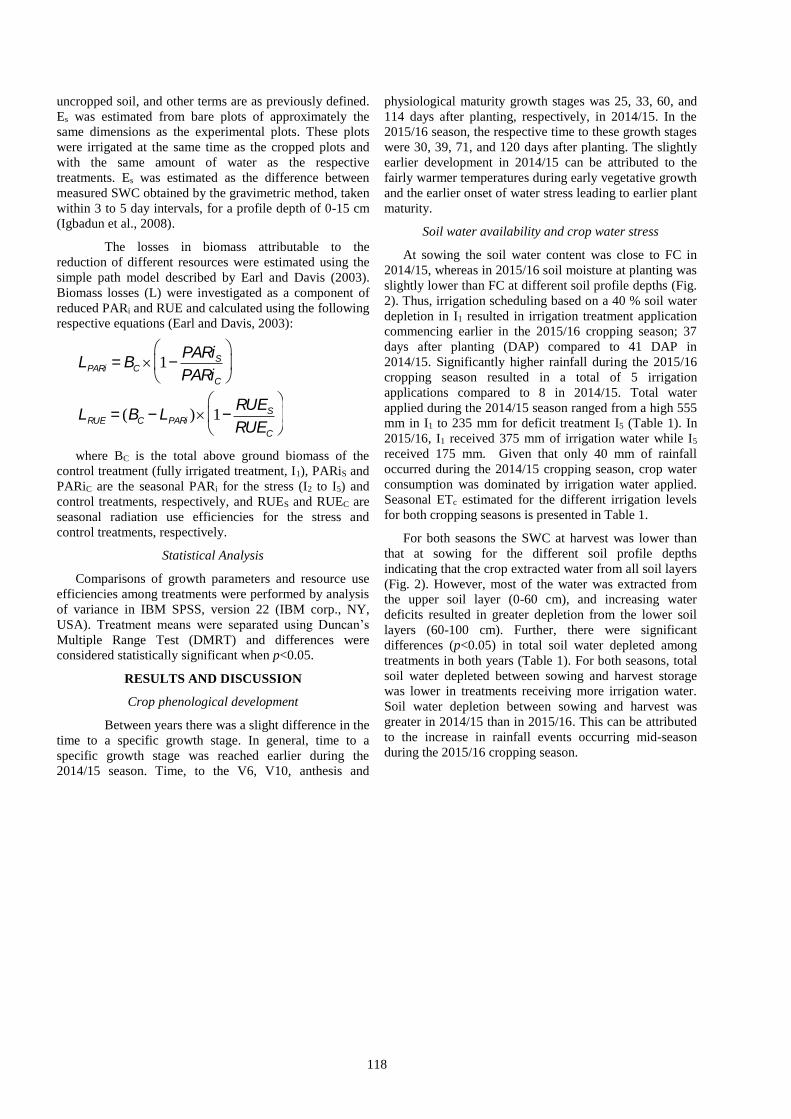
116
Figure 1. Daily variation in solar radiation, maximum air temperature (Tmax), minimum air temperature (Tmin) and rainfall over the
two growing seasons.
In 2014 maize was planted on 22nd November, while
for the 2015 season planting was done on 21st November.
During both seasons crops were subjected to the same
field management practices. Treated seeds were sown in
holes 0.05 m deep in well-leveled basins of size 10 m2 at a
plant density of 8.3 plants/m2. Soil levees 0.30 m high and
1 m wide were used to create a buffer zone between plots.
Fertilizer (275, 125, and 125 kg/ha of N, P2O5 and K2O)
was applied to the field when needed to prevent nutrient
stress. Insects and diseases were rigorously controlled and
plots were hand weeded when necessary so that there was
no competition for light, nutrients or water. Crop
phenology was constantly monitored during the growing
season and the different phenological stages were
subsequently recorded according to Ritchie et al. (1992).
According to Ritchie et al. (1992) classification, the main
growth stage used in the study for observations and
measurements was the vegetative six leaf stage (V6) and
ten leaf stage (V10), anthesis, and the reproductive milk
stage (R3) and physiological maturity (R6).
Irrigation treatments and soil moisture monitoring
In both seasons there were 5 irrigation treatments,
replicated 3 times, arranged in a completely randomized
block design. Treatments were differentiated from each
other based only on the amount of irrigated water applied,
irrespective of the phenological growth stage. The
rationale for this was to maintain a consistent irrigation
schedule based on soil moisture availability. Irrigation
depth and time were determined based on the maximum
allowable depletion of total available soil water in the soil
profile (Panda et al., 2004). Treatments included a full
irrigation treatment (FIT) and four deficit treatments. The
FIT water application depth was calculated as (Panda et
al., 2004):
Vd =AD(%)(FC-WP)RZA
100
where Vd is the volume of irrigation water (m3), AD is
the allowed depletion, FC is the field capacity (m3 m-3),
WP is the permanent wilting point (m3 m-3), Rz is the
effective rooting depth (m), and A is the surface area of
the plot (m2). Considering an effective root zone of 1 m
and AD as 40% (Djaman et al., 2013), the depth of water
application estimated for the FIT was 60 mm (I1).
Irrigation levels assigned to deficit treatments decreased in
increments of 10 mm; treatments I2, I3, I4, and I5
respectively received 50, 40, 30 and 20 mm of water at
each irrigation event. The treatments were irrigated by
flooding each plot with water from pipes and the use of
water meters. During early vegetative growth (emergence
to maize five leaf stage) all treatments received
approximately 75 mm of water. This was necessary to
promote robust root development and to establish plants
(Candogan et al., 2013; Kuscu et al., 2013). Thus,
irrigation treatment management began from the V6
growth stage and irrigation was initiated for all treatments
whenever the soil moisture in treatment I1 reached the
40% moisture depletion level. This depletion criterion was

117
determined by constantly monitoring the soil water
content (SWC). The percentage depletion of available soil
water in the effective root zone was estimated as (Igbadun
et al., 2008):
depletion(%) =100´1
n
FCi -qi
FCi -WP1
n
å
where n is the number of sub-divisions of the effective
rooting depth, FCi is the soil moisture at field capacity for
ith layer, θi is the soil moisture in ith layer, and WP is the
soil moisture at permanent wilting point. θ was monitored
daily using soil moisture sensors, EnviroScan system
(Sentek technologies, Australia), connected to an
automatic datalogger. Sensors were installed in between
two plants on the same row through PVC access tubes in
two replicate per treatment. The SWC were measured at
0.10 m intervals to a depth of 1 m. Soil water depletion
(SWD) was determined as the difference between
volumetric moisture content at field capacity for that
depth and volumetric moisture content on the day of
irrigation (before water was applied). The total SWD for
the rooting depth of 1 m was taken as the summation of
the depletion in all of the sampled layers (Yi et al., 2010).
Crop growth and development
In both seasons, four plants in at-least two replicates
were randomly selected and clipped at the soil surface to
assess biomass accumulation throughout the season. To
maintain a level of consistency, this was done at the
above-mentioned growth stages in each year. Total above
ground biomass was determined after drying the samples
at 70 o C until constant weight was attained. At harvest,
samples were taken from all plots and subjected to the
same handling to determine the final accumulation of
biomass. Eight randomly selected plants per plot were
tagged to monitor leaf area index (LAI) throughout the
growing season. The LAI was calculated as the product of
the manually measured leaf area (maximal length x width)
of each leaf, by the shape factor (k = 0.75), by the plant
density (Yi et al., 2010).
Quantification of crop water stress and crop
evapotranspiration
When a crop goes through water stress the functional
response of stomata closure results in the relative
transpiration rate decreasing. Thus, as soil water becomes
limiting the actual crop evapotranspiration (ETc) rate falls
below the reference (potential) evapotranspiration rate
(ETo) (Jackson, 1982). Consequently, the ratio of actual to
reference ET is well established as an index of crop water
status, and the crop water stress index (CWSI = 1-ETc/ETo)
has been identified as a valuable tool for monitoring and
quantifying water stress (Alderfasi and Nielsen, 2001;
Irmak et al., 2002). CWSI varies from 0 to 1, with 0
representing no water stress as the plant transpires at the
maximum rate, and 1 signifying maximum stress as the
plant has no transpiration loss (Idso, 1982).
Daily ETo was calculated from weather data
using FAO-56 standardized Penman-Moneith equation
(Allen et al., 1998). The ETc of each treatment was
calculated using the soil water balance method (Kuscu et
al., 2013):
ETc = P+ I - D- R±DW
where P indicates rainfall (mm), I is the irrigation
(mm), D is downward drainage out of the root zone (mm),
R is the surface runoff (mm), and ΔW is the change in the
water content of the soil profile (mm). D was consider to
be equal to zero as gravimetric sampling beyond the 1 m
effective root zone indicated that changes in the SWC was
very small. Gravimetric sampling was done for a
maximum depth of 1.6 m (from 1 m at 0.2 m intervals)
periodically. R was assumed zero because irrigation water
application was controlled and the experimental plots
were surrounded by 1 m wide levees around its perimeter
with basins meticulously prepared to be level. ΔW was
estimated from measured soil moisture data obtained via
the EnviroScan system on a daily time step. Growing
season ETc was calculated as the summation of daily ETc.
Intercepted solar radiation and resource use efficiencies
In this study it was assumed that 50% of the total
incident solar radiation was PAR and the amount of PAR
intercepted by the plant canopy (PARi) was computed
using the following exponential function (Yi et al., 2010):
PARi = 0.5R(1-e-kLAI )å
where R is the total solar radiation (MJ m-2 d-1) and k
is the light extinction coefficient which equals 0.65 for
maize (Yi et al., 2010).
Maize RUE was estimated using the crop growth rate
method (CGR); the increase in crop dry matter between
two consecutive sampling dates was regressed on the
quantity of PARi between those dates for each treatment.
The slope of this regression line is the RUE. CGR was
estimated by the plant dry weight method (Rahman and
Hossain, 2011):
CGR=W2 -W1
t2 - t1
where W1 and W2 indicates plant dry weight at time t1
and t2, respectively. If statistic testing resulted in
insignificant differences among treatments, all the data
was pooled to obtain a single RUE estimate for the study
area.
The WUE for each treatment was calculated as
the slope of the regression line of total biomass on
accumulated plant transpiration (Wt). Wt was calculated
as the difference between ETc and actual evaporation from
the cropped area of each treatment (Ecs) (Mwale et al.,
2007). Ecs was estimated as (Igbadun et al., 2008):
ECS = ES ´e-kLAI
where Ecs is the actual evaporation from the soil of the
cropped plots (mm), Es is the evaporation (mm) from
118
uncropped soil, and other terms are as previously defined.
Es was estimated from bare plots of approximately the
same dimensions as the experimental plots. These plots
were irrigated at the same time as the cropped plots and
with the same amount of water as the respective
treatments. Es was estimated as the difference between
measured SWC obtained by the gravimetric method, taken
within 3 to 5 day intervals, for a profile depth of 0-15 cm
(Igbadun et al., 2008).
The losses in biomass attributable to the
reduction of different resources were estimated using the
simple path model described by Earl and Davis (2003).
Biomass losses (L) were investigated as a component of
reduced PARi and RUE and calculated using the following
respective equations (Earl and Davis, 2003):
LPARi = BC ´ 1-PARiSPARiC
æ
èç
ö
ø÷
LRUE = (BC - LPARi )´ 1-RUES
RUEC
æ
èç
ö
ø÷
where BC is the total above ground biomass of the
control treatment (fully irrigated treatment, I1), PARiS and
PARiC are the seasonal PARi for the stress (I2 to I5) and
control treatments, respectively, and RUES and RUEC are
seasonal radiation use efficiencies for the stress and
control treatments, respectively.
Statistical Analysis
Comparisons of growth parameters and resource use
efficiencies among treatments were performed by analysis
of variance in IBM SPSS, version 22 (IBM corp., NY,
USA). Treatment means were separated using Duncan’s
Multiple Range Test (DMRT) and differences were
considered statistically significant when p<0.05.
RESULTS AND DISCUSSION
Crop phenological development
Between years there was a slight difference in the
time to a specific growth stage. In general, time to a
specific growth stage was reached earlier during the
2014/15 season. Time, to the V6, V10, anthesis and
physiological maturity growth stages was 25, 33, 60, and
114 days after planting, respectively, in 2014/15. In the
2015/16 season, the respective time to these growth stages
were 30, 39, 71, and 120 days after planting. The slightly
earlier development in 2014/15 can be attributed to the
fairly warmer temperatures during early vegetative growth
and the earlier onset of water stress leading to earlier plant
maturity.
Soil water availability and crop water stress
At sowing the soil water content was close to FC in
2014/15, whereas in 2015/16 soil moisture at planting was
slightly lower than FC at different soil profile depths (Fig.
2). Thus, irrigation scheduling based on a 40 % soil water
depletion in I1 resulted in irrigation treatment application
commencing earlier in the 2015/16 cropping season; 37
days after planting (DAP) compared to 41 DAP in
2014/15. Significantly higher rainfall during the 2015/16
cropping season resulted in a total of 5 irrigation
applications compared to 8 in 2014/15. Total water
applied during the 2014/15 season ranged from a high 555
mm in I1 to 235 mm for deficit treatment I5 (Table 1). In
2015/16, I1 received 375 mm of irrigation water while I5
received 175 mm. Given that only 40 mm of rainfall
occurred during the 2014/15 cropping season, crop water
consumption was dominated by irrigation water applied.
Seasonal ETc estimated for the different irrigation levels
for both cropping seasons is presented in Table 1.
For both seasons the SWC at harvest was lower than
that at sowing for the different soil profile depths
indicating that the crop extracted water from all soil layers
(Fig. 2). However, most of the water was extracted from
the upper soil layer (0-60 cm), and increasing water
deficits resulted in greater depletion from the lower soil
layers (60-100 cm). Further, there were significant
differences (p<0.05) in total soil water depleted among
treatments in both years (Table 1). For both seasons, total
soil water depleted between sowing and harvest storage
was lower in treatments receiving more irrigation water.
Soil water depletion between sowing and harvest was
greater in 2014/15 than in 2015/16. This can be attributed
to the increase in rainfall events occurring mid-season
during the 2015/16 cropping season.

119
Figure 2. Volumetric soil water content at sowing (dashed line) and harvest (solid lines) at different soil depths for the different
irrigation treatments. FC represents soil moisture at field capacity for the different profile depths.
Table 1. Cropping season total water applied, actual crop evapotranspiration (ETc) and total soil water depletion (SWD) for the 1 m
root zone between sowing and harvest.
Treatment
Seasonal irrigation water
(mm) ETc (mm) Total SWD (mm)
2014/15 2015/16 2014/15 2015/16 2014/15 2015/16
I1 555 375 605 570 64.39 ± 1.32 a 43.67 ± 0.54 a
I2 475 325 526 516 75.14 ± 2.59 b 57.26 ± 1.22 b
I3 395 275 455 464 89.56 ± 2.75 c 71.91 ± 3.73 c
I4 315 225 392 423 100.83 ± 1.53 d 81.45 ± 0.83 d
I5 235 175 331 352 107.53 ± 2.07 d 96.15 ± 0.14 e Means ± standard error of mean. Values followed by the same letter within a column are not significantly different (p<0.05, DMRT)
According to Nielsen and Gardner (1987), the crop
water stress index (CWSI) is closely related to extractable
water in the root zone, making it an effective parameter
for identifying the severity of crop water stress. For this
study, the following threshold is adopted to indicate the
severity of water stress imposed by the irrigation
treatments: CWSI values 0.2 little to no water stress,
0.2 < CWSI values mild to moderate water stress
and CWSI > 0.4 severe water stress. The threshold values
adopted have been observed through literature review as
being appropriate for the severity designated (Irmak et al.,
2000; Candogan et al., 2013). For instance, evaluating the
effects of irrigation scheduling based on various CWSI
values on maize yield, Nielsen and Gardner (1987)
reported insignificant reduction in yield when irrigating
using 0.1 and 0.2 CWSI values, but a significant (α=0.05)
reduction of 16 and 34% when irrigation was based on
CWSI values of 0.4 and 0.6, respectively. Similarly, Irmak
et al. (2000) showed that a seasonal mean CWSI value
<0.2 results in maximum maize yield production, while
CWSI values exceeding 0.5 severely depressed yield and
values of 0.28 and 0.36 moderately decreased yield by 12
and 24%, respectively.
The different water depths caused varying levels of
water stress among the treatments. Figure 3 shows the
seasonal trend of CWSI for the different irrigation
treatments. CWSI values were lower earlier in the season
for all treatments and generally increased during the
cropping season due to plant uptake, decreasing whenever
irrigation water was applied and at significant rainfall
events. During the 2015/16 growing season, rainfall
totaling 59 mm 55 to 57 DAP alleviated water stress in the
soil profile reducing the need for irrigation, and frequent
rainfall events between 57 and 70 DAP maintained a wet
soil profile resulting in a slow increase in CWSI (Fig. 3).
Varying water replenishment amount among the
treatments resulted in marked differences in the
progression of CWSI values. For treatments I4 and I5, crop
water stress progressively increased, specifically during
the reproductive growth stage, as irrigation failed to
substantially reduce CWSI values since the water applied
was not adequate to maintain a wet soil profile. Nielsen
and Gardner (1987) and Irmak et al. (2002) reported
similar observations in CWSI trend in cases of water
deficit stress. Further, crops in I4 and I5 were exposed to
water stress earlier than deficit treatments I2 and I3 during
both seasons. During both cropping seasons, optimal
growing conditions were maintained in I1, the fully
irrigated treatment, as indicated by the seasonal mean
CWSI being 0.18 (2014/15) and 0.15 (2015/16) (Table 2).
Treatments I2 and I3 with respective seasonal mean CWSI

120
values of 0.23 and 0.29 across both years sustained mild
to moderate water stress. Treatments I4 and I5 with mean
CWSI values within range of 0.42 and 0.57 for both
seasons incurred severe water stress. Further, during the
reproductive growth stage, the stage that maize is most
susceptible to water stress (Klocke et al., 2004), CWSI
values indicated that crops in treatments I2 and I3 were
subjected to mild levels of water stress while I4 and I5
experienced higher stress levels, particularly during the
2014/15 season (Table 2). Higher rainfall amounts in the
2015/16 temporarily reducing the length of the drought
cycle accounts for the lower CWSI observed during this
growing season. Actual mean CWSI value at the time of
irrigation, representing 40% moisture depletion in I1, was
0.24 in 2014/15 and 0.22 in 2015/16. Accordingly, a
CWSI value of 0.23 could be taken as a threshold value to
start irrigation for growing maize under optimal soil
moisture conditions in similar environments. Candogan et
al. (2013) observed that using CWSI values for irrigation
scheduling is an effective and robust method, as it owns
the advantage of representing both the soil and aerial
environment. Results of the study also indicates that a
threshold value of 0.45 for seasonal mean CWSI or 0.47
for CWSI before irrigation can be used to signify severe
moisture stress and thus expectance of significant yield
penalty and biomass reduction.
Figure 3. Seasonal variation in crop water stress index for the different irrigation treatments. Arrows at the top indicates irrigation
events.
Table 2. Seasonal mean crop water stress index (CWSI), mean CWSI before irrigation and mean CWSI during the critical
reproductive growth stage (RS) in 2014/15 and 2015/16.
Treat-ment Seasonal mean CWSI Mean CWSI during RS Mean CWSI before irrigation
2014/15 2014/15 2014/15 2015/16 2014/15 2015/16
I1 0.18 0.19 0.19 0.22 0.24 0.22
I2 0.25 0.27 0.27 0.27 0.32 0.27
I3 0.34 0.39 0.39 0.34 0.39 0.34
I4 0.48 0.59 0.59 0.44 0.49 0.44
I5 0.57 0.71 0.71 0.56 0.62 0.56
Biomass accumulation and LAI
The final above ground biomass observed at harvest
varied among the different irrigation treatments (Table 3).
In 2014/15, treatment I1 produced the highest of 1774.05 g
m-2 while I5 accumulated the lowest biomass of 1012.64 g
m-2. In 2015/16 the highest and lowest total biomass was
1831.24 and 1175.52 g m-2 in I1 and I5, respectively.
During both seasons there were significant differences in
the total biomass accumulated among some treatments. In
particular, for both seasons there was significant reduction
in the biomass between I1 and deficit treatments I4 and I5
within range of 27 and 43% for both years. The reduction
in biomass was less than 9 and 20% in treatment I2 and I3,
respectively. These findings are similar to those reported
by Yazar et al. (1999) who observed that minimal biomass
yield reductions occur at a threshold CWSI value of 0.33
or less for maize. Significant reductions in biomass owing
to crop water stress have also been reported in other
studies (Omidi et al., 2012; Djaman et al., 2013). The high
productivity associated with DI in maize production,
provided that water application amount is sufficient to
maintain soil moisture below the stress threshold and
irrigation timing does not impose stress doing the critical
growth period, can be attributed to the stimulated
physiological response of the crop after soil drying
episodes leading to compensation or overcompensation in
plant growth and grain yield (Yi et al., 2010).
121
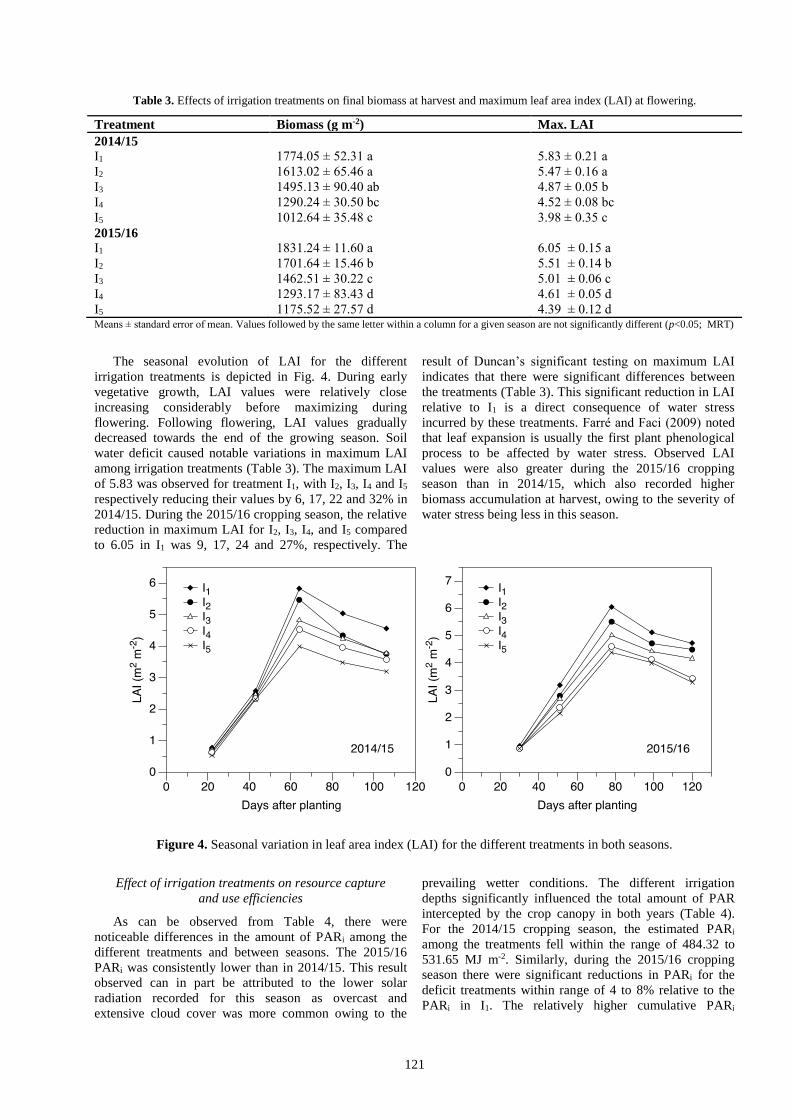
Table 3. Effects of irrigation treatments on final biomass at harvest and maximum leaf area index (LAI) at flowering.
Treatment Biomass (g m-2) Max. LAI
2014/15
I1 1774.05 ± 52.31 a 5.83 ± 0.21 a
I2 1613.02 ± 65.46 a 5.47 ± 0.16 a
I3 1495.13 ± 90.40 ab 4.87 ± 0.05 b
I4 1290.24 ± 30.50 bc 4.52 ± 0.08 bc
I5 1012.64 ± 35.48 c 3.98 ± 0.35 c
2015/16
I1 1831.24 ± 11.60 a 6.05 ± 0.15 a
I2 1701.64 ± 15.46 b 5.51 ± 0.14 b
I3 1462.51 ± 30.22 c 5.01 ± 0.06 c
I4 1293.17 ± 83.43 d 4.61 ± 0.05 d
I5 1175.52 ± 27.57 d 4.39 ± 0.12 d Means ± standard error of mean. Values followed by the same letter within a column for a given season are not significantly different (p<0.05; MRT)
The seasonal evolution of LAI for the different
irrigation treatments is depicted in Fig. 4. During early
vegetative growth, LAI values were relatively close
increasing considerably before maximizing during
flowering. Following flowering, LAI values gradually
decreased towards the end of the growing season. Soil
water deficit caused notable variations in maximum LAI
among irrigation treatments (Table 3). The maximum LAI
of 5.83 was observed for treatment I1, with I2, I3, I4 and I5
respectively reducing their values by 6, 17, 22 and 32% in
2014/15. During the 2015/16 cropping season, the relative
reduction in maximum LAI for I2, I3, I4, and I5 compared
to 6.05 in I1 was 9, 17, 24 and 27%, respectively. The
result of Duncan’s significant testing on maximum LAI
indicates that there were significant differences between
the treatments (Table 3). This significant reduction in LAI
relative to I1 is a direct consequence of water stress
incurred by these treatments. Farré and Faci (2009) noted
that leaf expansion is usually the first plant phenological
process to be affected by water stress. Observed LAI
values were also greater during the 2015/16 cropping
season than in 2014/15, which also recorded higher
biomass accumulation at harvest, owing to the severity of
water stress being less in this season.
Figure 4. Seasonal variation in leaf area index (LAI) for the different treatments in both seasons.
Effect of irrigation treatments on resource capture
and use efficiencies
As can be observed from Table 4, there were
noticeable differences in the amount of PARi among the
different treatments and between seasons. The 2015/16
PARi was consistently lower than in 2014/15. This result
observed can in part be attributed to the lower solar
radiation recorded for this season as overcast and
extensive cloud cover was more common owing to the
prevailing wetter conditions. The different irrigation
depths significantly influenced the total amount of PAR
intercepted by the crop canopy in both years (Table 4).
For the 2014/15 cropping season, the estimated PARi
among the treatments fell within the range of 484.32 to
531.65 MJ m-2. Similarly, during the 2015/16 cropping
season there were significant reductions in PARi for the
deficit treatments within range of 4 to 8% relative to the
PARi in I1. The relatively higher cumulative PARi

122
recorded for treatment I1 indicated that crops in this
treatment utilized more energy than crops subjected to
water deficits (Yi et al., 2010). The cumulative intercepted
solar radiation observed for the full irrigation treatment in
this study is lower than that reported in similar researches
for maize, but the general trend of decreasing intercepted
solar radiation with decreasing soil water availability is
preserved (Yi et al., 2010; Teixeira et al., 2014). Further,
the relative reduction in the amount of solar radiation
intercepted owing to water stress have been reported in
other studies for crops like bambara groundnut (Mwale et
al., 2007), finger millet (Maqsood and Azam-Ali, 2007)
and sweet sorghum (Dercas and Liakatas, 2007).
Table 4. Total photosynthetically active radiation intercepted (PARi), seasonal radiation use efficiency (RUE) and seasonal mean and
maximum crop growth rate (CGR) for the different irrigation treatments.
Treatment PARi (MJ m−2) RUE CGR (g m-2 d-1)
Slope (g MJ-1) R2 Pa Mean Max.
2014/15
I1 531.65 ± 2.74 a 3.41 ± 0.01 a 0.89 0.02 16.94 33.03
I2 518.47 ± 0.93 b 3.21 ± 0.08 b 0.85 0.03 15.39 29.76
I3 512.97 ± 1.32 b 3.01 ± 0.09 b 0.80 0.04 14.31 25.82
I4 497.58 ± 0.55 c 2.62 ± 0.10 c 0.60 0.13 12.70 28.28
I5 484.36 ± 2.20 d 2.58 ± 0.13 c 0.57 0.14 11.97 25.97
2015/16
I1 443.71 ± 2.67 a 3.51 ± 0.02 a 0.81 0.04 20.84 34.12
I2 427.50 ± 0.96 b 3.22 ± 0.16 b 0.88 0.02 17.60 29.01
I3 421.37 ± 2.54 c 3.08 ± 0.05 b 0.92 0.01 16.00 25.89
I4 413.04 ± 0.90 d 2.79 ± 0.21 bc 0.91 0.01 14.05 28.08
I5 407.11 ± 1.78 e 2.69 ± 0.16 c 0.79 0.04 12.34 29.08 Means ± standard error of mean. Values followed by the same letter within a column in a year are not significantly different (p<0.05; DMRT). a P value of regression (α=0.05)
In the fully irrigated treatment, I1, the 2014/15 average
seasonal crop growth rate (CGR) was 16.94 g m-2 d-1, with
a range of 6 to 33 g m-2 d-1 between harvest intervals. In
2015/16, the seasonal CGR for I1 was 20.84 g m-2 d-1 with
a range of 9 to 34 g m-2 d-1 between harvest intervals.
These ranges are within range of those reported in other
studies under optimal growing conditions for maize
(Lindquist et al., 2005). During both seasons, water stress
reduced seasonal mean CGR for deficit treatments I2 to I4
with lower maximum values (Table 4). The CGR between
successive harvest intervals was used to estimate maize
RUE. That is, slope of the regression of CGR on rate of
PARi was used to estimate the RUE for the different
irrigation treatments. The CGR method proved to be
effective as small error variances were obtained for both
seasons, and in general strong (R2>0.80) and significant
(p<0.05) linear relations were observed for most
treatments (Table 4). According to Confalone et al. (2010),
calculation of the RUE via the CGR method is less bias
than the traditional cumulative biomass method owing to
the independence between data sets which does not result
in false confidence in the value of RUE. Some studies
have also shown that there is no significant difference in
RUE estimated through these two methods (Lindquist et
al., 2005; Confalone et al., 2010).
Estimates of RUE varied marginally between years,
and significantly between treatments for both season
(Table 4). Results in the table show that the RUE
decreased with decreasing water availability and thus
increasing water stress. For instance, decreasing water
application by 58% (I1 relative to I5) resulted in a
significant 24% reduction in RUE during the 2014/15
experimental period, while in 2015/16 a decrease of 53%
in irrigation water resulted in a significant reduction of
23% in RUE. In general however, during both cropping
seasons the RUE was significantly different among the
stress class distinctions. That is, significant testing
indicated differences among crops grown under optimal
water environments, moderate stress conditions and severe
water stress conditions. Thus, all data was pooled in 3
categories to obtain a single estimate of the RUE under
different water environments. Under optimal growing
conditions, the seasonal RUE was estimated as 3.46 ±
0.05 g MJ-1. This value is similar to published values for
maize (Kiniry et al., 1989; Yi et al., 2010). Regression
analysis of pooled data showed that mild (I2 and I3) and
severe (I4 and I5) water stress reduced the mean RUE to
3.11 ± 0.12 and 2.69 ± 0.26 g MJ-1, respectively. This
reduction in RUE on account of soil moisture deficits is
consistent with observations in other crops (Collino et al.,
2001; Mwale et al., 2007). The RUE concept is utilized
extensively in crop growth simulation models to predict
crop growth and yield under different environments and
management conditions (Brisson et al., 2003). Thus, as the
results of this study indicate, varying water environments
would affect plants RUE and the accuracy of models in
simulating growth would be improved by considering this.
Transpiration, soil evaporation and WUE
The large difference in irrigation water application was
sufficient to significantly affect ETc, Wt, and the amount
of water loss through evaporation (Ecs) (Table 5). For both
seasons, the amount of water loss through evaporation
decreased with increasing soil moisture deficit. The range
of reduction in Ecs between the fully irrigated crop and

123
those subjected to DI was 2 and 26%. Ecs accounted for 28
to 39% and 26 to 32% of ETc (Table 1) in 2014/15 and
2015/16, respectively. Similar to this study, Igbadun et al.
(2008) reported a general decrease in surface evaporation
for deficit irrigated maize compared to a fully irrigated
treatment, with the average Ecs percent of ETc in range of
28 to 35%. In contrast, Mwale et al. (2007) reported a
higher Ecs percent claim on ETc for irrigated treatments
compared to dryland treatments for bambara groundnut.
Soil evaporation is influenced by the wetness of the soil
surface and the degree of ground cover by the crop canopy
(Mwale et al., 2007; Igbadun et al., 2008). Thus, the
higher Ecs in treatment I1 was perhaps dominated by the
wetter soil surface over a longer time period although the
crop canopy was more enhanced. As the soil dries up the
effect of canopy cover on Ecs diminishes since the
moisture gradient between the atmosphere and the
evaporating surface reduces (Mwale et al., 2007).
Table 5. Growing season total evaporation (Ecs), transpiration (Wt), and water use efficiency (WUE) for the different irrigation
treatments.
Treatment Ecs (mm) Wt (mm) WUE
Slope (g m-2 mm-1) R2 Pa
2014/15
I1 172.72 ± 1.70 a 432.77 ± 0.74 a 3.88 ± 0.09 a 0.89 0.00
I2 169.53 ± 0.37 a 356.23 ± 0.37 b 4.10 ± 0.02 a 0.87 0.00
I3 168.26 ± 0.39 a 286.35 ± 1.31 c 4.85 ± 0.04 b 0.85 0.00
I4 151.02 ± 4.36 b 241.16 ± 9.21 d 5.10 ± 0.10 c 0.77 0.01
I5 128.15 ± 6.30 c 192.19 ± 5.15 e 5.21 ± 0.12 c 0.74 0.02
2015/16
I1 149.28 ± 0.64 a 420.87 ± 1.12 a 4.08 ± 0.00 a 0.91 0.00
I2 146.49 ± 0.32 a 369.16 ± 0.32 b 4.13 ± 0.12 a 0.90 0.00
I3 144.38 ± 0.34 a 318.95 ± 0.34 b 4.62 ± 0.01 b 0.85 0.00
I4 131.50 ± 3.68 b 292.10 ± 3.68 bc 4.48 ± 0.05 b 0.78 0.01
I5 111.56 ± 5.38 c 241.27 ± 4.03 c 4.59 ± 0.07 b 0.72 0.03 Means ± standard error of mean. Values followed by the same letter within a column in a year are not significantly different (p<0.05; DMRT) a P value of regression (α=0.05)
The seasonal transpiration estimated for the different
treatments is presented in Table 5. From the table it can be
observed that Wt decreased with a reduction in seasonal
water applied for both seasons. The highest amount of
water transpired was observed in I1 while the least was
recorded in deficit treatment I5. Wt between the fully
irrigated crop and deficit treatments decreased with
increasing soil water deficits within range 18 to 56% in
2014/15 and 12 to 43% in 2015/16. Owing to the marked
differences in water applied to the different treatments and
hence seasonal ETc, Wt was significantly different among
all treatments. This reduction in transpiration with
decreasing soil moisture availability suggest that crops
reduce their water losses by closing their stomata in water
stress environments, supporting the findings of other
studies (Mwale et al., 2007; Ashraf et al., 2016). Ashraf et
al. (2016) reported that water stress induces stomatal
closure that leads to a reduced working efficiency of
photosynthetic machinery and crop transpiration rates,
which ultimately leads to a reduction in maize
productivity. The differences in Wt therefore impacted the
WUE which varied significantly among treatments (Table
5). Results in the table shows that generally the WUE
increased with decreasing water application. In 2014/15
the WUE was significantly higher in I4 and I5 compared to
the other treatments. A reduction of 58% in irrigation
application improved plant WUE by 25% (I5 compared to
I1). During the 2015/16 growing season, the improvement
in the WUE as a result of water deficits was smaller; the
highest increase being 12% in I3 followed by 11 and 9% in
I5 and I4, respectively. The relative difference in the
improvement between seasons is largely due to the much
drier conditions during the 2014/15 growing season.
Teixeira et al. (2014) also reported greater transpiration
WUE’s for maize subjected to water stress.
Effect of radiation capture and use efficiency
on biomass reduction
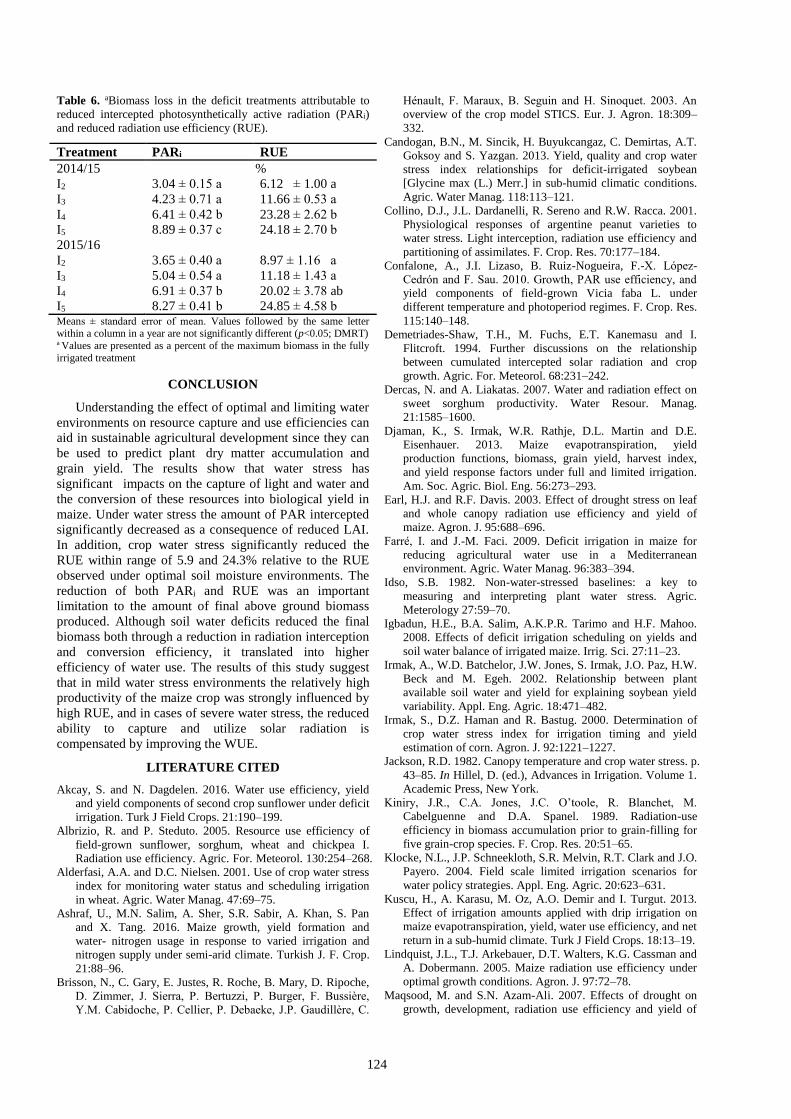
Table 6 shows the estimated biomass reduction
component relative to I1 for the different irrigation
treatments attributable to reductions in PARi and RUE in
each year. Reduced PARi produced the smallest yield loss
component for each treatment in both seasons, and the
magnitude was more pronounced in the severely stressed
treatments of I4 and I5 in each year. Stone et al. (2001) and
Earl and Davis (2003) also reported that in severely
stressed water environments reduced radiation
interception plays an important part in yield loss. The
reduction in biomass owing to reduced RUE was
markedly higher than the reduction caused by a decrease
in PARi. Similar to the findings of Earl and Davis (2003),
the results suggest that reduced RUE was quantitatively
more important than reduced PARi in terms of the effects
on biomass loss (Table 6), and it significantly affects
biomass production. This has important implications as it
suggest that the relatively low radiation during the winter
cropping season affects maize growth and productivity
during this cropping period. Therefore, perhaps DI as a
water management strategy may have greater benefits if
maize is grown in more conducive aerial environments.
Experiments exploring different planting dates would be
valuable.
124
Table 6. aBiomass loss in the deficit treatments attributable to
reduced intercepted photosynthetically active radiation (PARi)
and reduced radiation use efficiency (RUE).
Treatment PARi RUE
2014/15 %
I2 3.04 ± 0.15 a 6.12 ± 1.00 a
I3 4.23 ± 0.71 a 11.66 ± 0.53 a
I4 6.41 ± 0.42 b 23.28 ± 2.62 b
I5 8.89 ± 0.37 c 24.18 ± 2.70 b
2015/16
I2 3.65 ± 0.40 a 8.97 ± 1.16 a
I3 5.04 ± 0.54 a 11.18 ± 1.43 a
I4 6.91 ± 0.37 b 20.02 ± 3.78 ab
I5 8.27 ± 0.41 b 24.85 ± 4.58 b Means ± standard error of mean. Values followed by the same letter within a column in a year are not significantly different (p<0.05; DMRT) a Values are presented as a percent of the maximum biomass in the fully
irrigated treatment
CONCLUSION
Understanding the effect of optimal and limiting water
environments on resource capture and use efficiencies can
aid in sustainable agricultural development since they can
be used to predict plantdry matter accumulation and
grain yield. The results show that water stress has
significantimpacts on the capture of light and water and
the conversion of these resources into biological yield in
maize. Under water stress the amount of PAR intercepted
significantly decreased as a consequence of reduced LAI.
In addition, crop water stress significantly reduced the
RUE within range of 5.9 and 24.3% relative to the RUE
observed under optimal soil moisture environments. The
reduction of both PARi and RUE was an important
limitation to the amount of final above ground biomass
produced. Although soil water deficits reduced the final
biomass both through a reduction in radiation interception
and conversion efficiency, it translated into higher
efficiency of water use. The results of this study suggest
that in mild water stress environments the relatively high
productivity of the maize crop was strongly influenced by
high RUE, and in cases of severe water stress, the reduced
ability to capture and utilize solar radiation is
compensated by improving the WUE.
LITERATURE CITED
Akcay, S. and N. Dagdelen. 2016. Water use efficiency, yield
and yield components of second crop sunflower under deficit
irrigation. Turk J Field Crops. 21:190–199.
Albrizio, R. and P. Steduto. 2005. Resource use efficiency of
field-grown sunflower, sorghum, wheat and chickpea I.
Radiation use efficiency. Agric. For. Meteorol. 130:254–268.
Alderfasi, A.A. and D.C. Nielsen. 2001. Use of crop water stress
index for monitoring water status and scheduling irrigation
in wheat. Agric. Water Manag. 47:69–75.
Ashraf, U., M.N. Salim, A. Sher, S.R. Sabir, A. Khan, S. Pan
and X. Tang. 2016. Maize growth, yield formation and
water- nitrogen usage in response to varied irrigation and
nitrogen supply under semi-arid climate. Turkish J. F. Crop.
21:88–96.
Brisson, N., C. Gary, E. Justes, R. Roche, B. Mary, D. Ripoche,
D. Zimmer, J. Sierra, P. Bertuzzi, P. Burger, F. Bussière,
Y.M. Cabidoche, P. Cellier, P. Debaeke, J.P. Gaudillère, C.
Hénault, F. Maraux, B. Seguin and H. Sinoquet. 2003. An
overview of the crop model STICS. Eur. J. Agron. 18:309–
332.
Candogan, B.N., M. Sincik, H. Buyukcangaz, C. Demirtas, A.T.
Goksoy and S. Yazgan. 2013. Yield, quality and crop water
stress index relationships for deficit-irrigated soybean
[Glycine max (L.) Merr.] in sub-humid climatic conditions.
Agric. Water Manag. 118:113–121.
Collino, D.J., J.L. Dardanelli, R. Sereno and R.W. Racca. 2001.
Physiological responses of argentine peanut varieties to
water stress. Light interception, radiation use efficiency and
partitioning of assimilates. F. Crop. Res. 70:177–184.
Confalone, A., J.I. Lizaso, B. Ruiz-Nogueira, F.-X. López-
Cedrón and F. Sau. 2010. Growth, PAR use efficiency, and
yield components of field-grown Vicia faba L. under
different temperature and photoperiod regimes. F. Crop. Res.
115:140–148.
Demetriades-Shaw, T.H., M. Fuchs, E.T. Kanemasu and I.
Flitcroft. 1994. Further discussions on the relationship
between cumulated intercepted solar radiation and crop
growth. Agric. For. Meteorol. 68:231–242.
Dercas, N. and A. Liakatas. 2007. Water and radiation effect on
sweet sorghum productivity. Water Resour. Manag.
21:1585–1600.
Djaman, K., S. Irmak, W.R. Rathje, D.L. Martin and D.E.
Eisenhauer. 2013. Maize evapotranspiration, yield
production functions, biomass, grain yield, harvest index,
and yield response factors under full and limited irrigation.
Am. Soc. Agric. Biol. Eng. 56:273–293.
Earl, H.J. and R.F. Davis. 2003. Effect of drought stress on leaf
and whole canopy radiation use efficiency and yield of
maize. Agron. J. 95:688–696.
Farré, I. and J.-M. Faci. 2009. Deficit irrigation in maize for
reducing agricultural water use in a Mediterranean
environment. Agric. Water Manag. 96:383–394.
Idso, S.B. 1982. Non-water-stressed baselines: a key to
measuring and interpreting plant water stress. Agric.
Meterology 27:59–70.
Igbadun, H.E., B.A. Salim, A.K.P.R. Tarimo and H.F. Mahoo.
2008. Effects of deficit irrigation scheduling on yields and
soil water balance of irrigated maize. Irrig. Sci. 27:11–23.
Irmak, A., W.D. Batchelor, J.W. Jones, S. Irmak, J.O. Paz, H.W.
Beck and M. Egeh. 2002. Relationship between plant
available soil water and yield for explaining soybean yield
variability. Appl. Eng. Agric. 18:471–482.
Irmak, S., D.Z. Haman and R. Bastug. 2000. Determination of
crop water stress index for irrigation timing and yield
estimation of corn. Agron. J. 92:1221–1227.
Jackson, R.D. 1982. Canopy temperature and crop water stress. p.
43–85. In Hillel, D. (ed.), Advances in Irrigation. Volume 1.
Academic Press, New York.
Kiniry, J.R., C.A. Jones, J.C. O’toole, R. Blanchet, M.
Cabelguenne and D.A. Spanel. 1989. Radiation-use
efficiency in biomass accumulation prior to grain-filling for
five grain-crop species. F. Crop. Res. 20:51–65.
Klocke, N.L., J.P. Schneekloth, S.R. Melvin, R.T. Clark and J.O.
Payero. 2004. Field scale limited irrigation scenarios for
water policy strategies. Appl. Eng. Agric. 20:623–631.
Kuscu, H., A. Karasu, M. Oz, A.O. Demir and I. Turgut. 2013.
Effect of irrigation amounts applied with drip irrigation on
maize evapotranspiration, yield, water use efficiency, and net
return in a sub-humid climate. Turk J Field Crops. 18:13–19.
Lindquist, J.L., T.J. Arkebauer, D.T. Walters, K.G. Cassman and
A. Dobermann. 2005. Maize radiation use efficiency under
optimal growth conditions. Agron. J. 97:72–78.
Maqsood, M. and S.N. Azam-Ali. 2007. Effects of drought on
growth, development, radiation use efficiency and yield of

125
finger millet (Eleucine coracana). Pakistan J. Bot. 39:123–
134.
Mwale, S.S., S.N. Azam-Ali and F.J. Massawe. 2007. Growth
and development of bambara groundnut (Vigna subterranea)
in response to soil moisture 2. Resource capture and
conversion. Eur. J. Agron. 26:354–362.
Nielsen, D.C. and B.R. Gardner. 1987. Scheduling irrigations for
corn with the crop water stress index (CWSI). Appl. Agric.
Res. 2:295–300.
O’Connell, M.G., G.J. O’Leary, D.M. Whitfield and D.J. Connor.
2004. Interception of photosynthetically active radiation and
radiation-use efficiency of wheat, field pea and mustard in a
semi-arid environment. F. Crop. Res. 85:111–124.
Omidi, A.H., Khazaei, H., Monneveux, P. and F. Stoddard. 2012.
Effect of cultivar and water regime on yield and yield
components in safflower (Carthamus tinctorius L.). Turkish J.
F. Crop. 17:10–15.
Panda, R.K., S.K. Behera and P.S. Kashyap. 2004. Effective
management of irrigation water for maize under stressed
conditions. Agric. Water Manag. 66:181–203.
Payero, J.O., N.L. Klocke, J.P. Schneekloth and D.R. Davison.
2006. Comparison of irrigation strategies for surface-
irrigated corn in West Central Nebraska. Irrig. Sci. 24:257–
265.
Perng, C.M. 2013. Taiwan Grain and Feed Annual Wheat, Corn
and Milled Rice Situation and Outlook. Taipei, Taiwan.
Rahman, M.M. and M.M. Hossain. 2011. Plant density effects
on growth, yield and yield components of two soybean
varieties under equidistant planting arrangement. Asian J.
Plant Sci. 10:278–286.
Ritchie, S.W., J.J. Hanway and G.O. Benson. 1992. How a corn
plant develops. Ames, Iowa.
Sinclair, T.R., and R.C. Muchow. 1999. Radiation use efficiency.
Adv. Agron. 65: 215–265.
Spiertz, H. 2012. Avenues to meet food security. The role of
agronomy on solving complexity in food production and
resource use. Eur. J. Agron. 43:1–8.
Steduto, P. and R. Albrizio. 2005. Resource use efficiency of
field-grown sunflower,sorghum, wheat and chickpea II.
Water use efficiency and comparison with radiation use
efficiency. Agric. For. Meteorol. 130:269–281.
Stone, P.J., D.R. Wilson, J.B. Reid and R.N. Gillespie. 2001.
Water deficit effects on sweet corn. I. Water use, radiation
use efficiency, growth, and yield. Aust. J. Agric. Res.
52:103–113.
Teixeira, E.I., M. George, T. Herreman, H. Brown, A. Fletcher,
E. Chakwizira, J. De Ruiter, S. Maley and A. Noble. 2014.
The impact of water and nitrogen limitation on maize
biomass and resource-use efficiencies for radiation, water
and nitrogen. F. Crop. Res. 168:109–118.
Vadez, V., J. Kholova, S. Medina, A. Kakkera and H. Anderberg.
2014. Transpiration efficiency: new insights into an old story.
J. Exp. Bot. 65:6141–6153.
Yazar, A., A.T. Howell, A.D. Dusek and S.K. Copeland. 1999.
Evaluation of crop water stress index for LEPA irrigated
corn. Irrig. Sci. 18:171–180.
Yi, L., Y. Shenjiao, L. Shiqing, C. Xinping and C. Fang. 2010.
Growth and development of maize (Zea mays L.) in response
to different field water management practices: Resource
capture and use efficiency. Agric. For. Meteorol. 150:606–
613.