
The Effect of the Internet on Wages - poliquin.xyz · The Effect of the Internet on Wages...
38
The Effect of the Internet on Wages Christopher W. Poliquin Harvard Business School May 5, 2018 Download Latest Version Abstract Who benefits from technology adoption in the workplace? To ex- plore, I combine worker-level wage data with information on broad- band adoption by Brazilian firms to estimate the effects of broadband on wages. Overall, wages increase 2.3 percent following broadband adoption. Consistent with the theory of biased technological change, wages increase the most for workers engaged in non-routine cognitive tasks and returns are negative for routine cognitive tasks. There is no effect of broadband adoption on wages for either routine or non- routine manual tasks. Additionally, I estimate the effect of broadband on selected quantiles of the within-firm wage distribution and find ev- idence that within-firm wage inequality increases following broadband adoption. Both new hires and the firm’s existing employees benefit from broadband adoption, which indicates that broadband’s effects are not driven only by better recruitment of new employees. JEL Codes: J24, J31, O33 Email: [email protected] I am grateful to Shane Greenstein, Michael Luca, Raffaella Sadun, and Deepak Malhotra for their advice and guidance. I also thank the HBS Latin America Research Center, Part- ners of the Americas, Harvard Business School, and the Harvard Economics Department for supporting this project. 1
-
Upload
truongkiet -
Category
Documents
-
view
217 -
download
0
Transcript of The Effect of the Internet on Wages - poliquin.xyz · The Effect of the Internet on Wages...

The Effect of the Internet on WagesChristopher W. Poliquin
Harvard Business School
May 5, 2018
Download Latest Version
Abstract
Who benefits from technology adoption in the workplace? To ex-plore, I combine worker-level wage data with information on broad-band adoption by Brazilian firms to estimate the effects of broadbandon wages. Overall, wages increase 2.3 percent following broadbandadoption. Consistent with the theory of biased technological change,wages increase the most for workers engaged in non-routine cognitivetasks and returns are negative for routine cognitive tasks. There isno effect of broadband adoption on wages for either routine or non-routine manual tasks. Additionally, I estimate the effect of broadbandon selected quantiles of the within-firm wage distribution and find ev-idence that within-firm wage inequality increases following broadbandadoption. Both new hires and the firm’s existing employees benefitfrom broadband adoption, which indicates that broadband’s effectsare not driven only by better recruitment of new employees.JEL Codes: J24, J31, O33
Email: [email protected] am grateful to Shane Greenstein, Michael Luca, Raffaella Sadun, and Deepak Malhotrafor their advice and guidance. I also thank the HBS Latin America Research Center, Part-ners of the Americas, Harvard Business School, and the Harvard Economics Departmentfor supporting this project.
1

1 Introduction
Who benefits from technology adoption in the workplace? Technology can
substitute for some workers while complementing others. Specifically, the
“task approach” to labor markets highlights the potential for digital tech-
nologies to substitute for workers in performing routine tasks, while comple-
menting workers in non-routine tasks (Autor et al., 2003). To date, empir-
ical work on this hypothesis has largely relied on industry-, region-, or to a
lesser extent, firm-level data. In contrast, this paper uses worker-level wage
data in conjunction with firm-level information on technology use over time.
Specifically, I study how broadband Internet technology affects the wages of
individual workers within firms.
I find that wages increase 2.3 percent following firm broadband adop-
tion, but the effect of broadband is heterogeneous. Regressions of wages on
the task profile of jobs suggest that broadband complements employees per-
forming non-routine cognitive tasks, while substituting for workers in routine
cognitive tasks. Intuitively, both routine and non-routine manual tasks are
unaffected by broadband.
The differences in the returns to broadband across tasks have implications
for within-firm wage inequality. I examine changes to the entire wage distri-
bution within firms following broadband adoption using a grouped quantile
regression estimator (Chetverikov et al., 2016). Wage increases following
broadband are concentrated in the right tail of the wage distribution; in
2
other words, within-firm wage inequality increases after broadband adop-
tion. This result contributes to a literature that emphasizes the role of firms
in determining pay inequality (e.g. Cobb, 2016; Gartenberg and Wulf, 2017b;
Nickerson and Zenger, 2008), and provides the first direct evidence connect-
ing adoption and use of advanced information technology to a widening pay
gap within an organization.
As evidence of broadband enhancing the productivity of existing workers,
rather than only improving the recruitment of new workers, I show that
wages increase for both new hires and existing employees following broadband
adoption. Furthermore, firm directors—who are most likely to also be firm
owners—appear to capture large rents from the introduction of broadband,
a pattern consistent with increased firm productivity post-adoption.
The analysis combines an employer-employee matched dataset from Brazil
with firm-level data on technology use over time. By linking information
on which firms use broadband with data on their individual workers, I can
estimate the effect of broadband within firms over time. Additionally, I can
examine changes in the wages of individual workers while controlling for
worker characteristics and unobserved firm heterogeneity.
This paper is the first to combine within-firm variation on technology use
with large-sample microdata on the wages and characteristics of individual
workers. While other research has examined the impact of technology —
including the Internet—on wages, prior studies have not observed changes
in the technology used at individual firms over time. Recent research on
3

the effects of the Internet in Brazil (Almeida et al., 2017; Dutz et al., 2017),
Africa (Hjort and Poulsen, 2017), Norway (Akerman et al., 2015), and the
United States (Forman et al., 2012; Gillett et al., 2006; Kolko, 2012) relies on
geographic variation in Internet availability and/or cross-sectional variation
in firm adoption. In contrast, I observe the same firm and workers before
and after the adoption of broadband. The results of this paper are consistent
with prior work, which shows broadband substitutes for workers engaged in
routine tasks while complementing workers engaged in non-routine tasks.
Broadband technology is especially worthy of study because of the In-
ternet’s pervasiveness and policymakers’ interest in public investments in
broadband infrastructure. Nearly 50 percent of people worldwide now access
the Internet. The transformation of the Internet from a technology used by
fewer than 1 percent of people in the mid-1990s to the ubiquitous network
of today has potentially large effects on firm operations and jobs.
Although a number of studies suggest that broadband, and Internet access
generally, is a skill-biased technological change, few if any provide concrete
examples of how or why this might be the case. The next section provides
anecdotal evidence from interviews with Brazilian managers suggesting that
broadband use in firms can assist workers with non-routine cognitive tasks
while substituting for workers in performing routine cognitive tasks.
4

2 Anecdotal Evidence
This section provides examples, through interviews with managers in Brazil-
ian firms, of how broadband can affect firm operations. Although several
papers suggest broadband complements workers in performing non-routine
tasks, while substituting for routine tasks, few are specific about how high-
speed Internet access might do this.
Managers I interviewed described using broadband to facilitate informa-
tion exchange both within and between firms and customers. A manufacturer
of industrial equipment explained how broadband provided constant connec-
tivity with their suppliers that allowed them to automate routine aspects of
inventory management:
“We scan the barcode on the kanban card and new part orders
are sent directly to the supplier. This has saved time for the
logistics people to spend more time on other tasks, like inventory
optimization. It also means we’ve had some layoffs. We need
fewer people to do ordering, and a different set of skills.”
The same firm also used broadband to facilitate communication between
workers directly involved in production and engineers and managers higher in
the organizational hierarchy. Broadband, therefore, complemented the skills
of engineers in the non-routine task of reviewing product design issues and
communicating solutions:
5
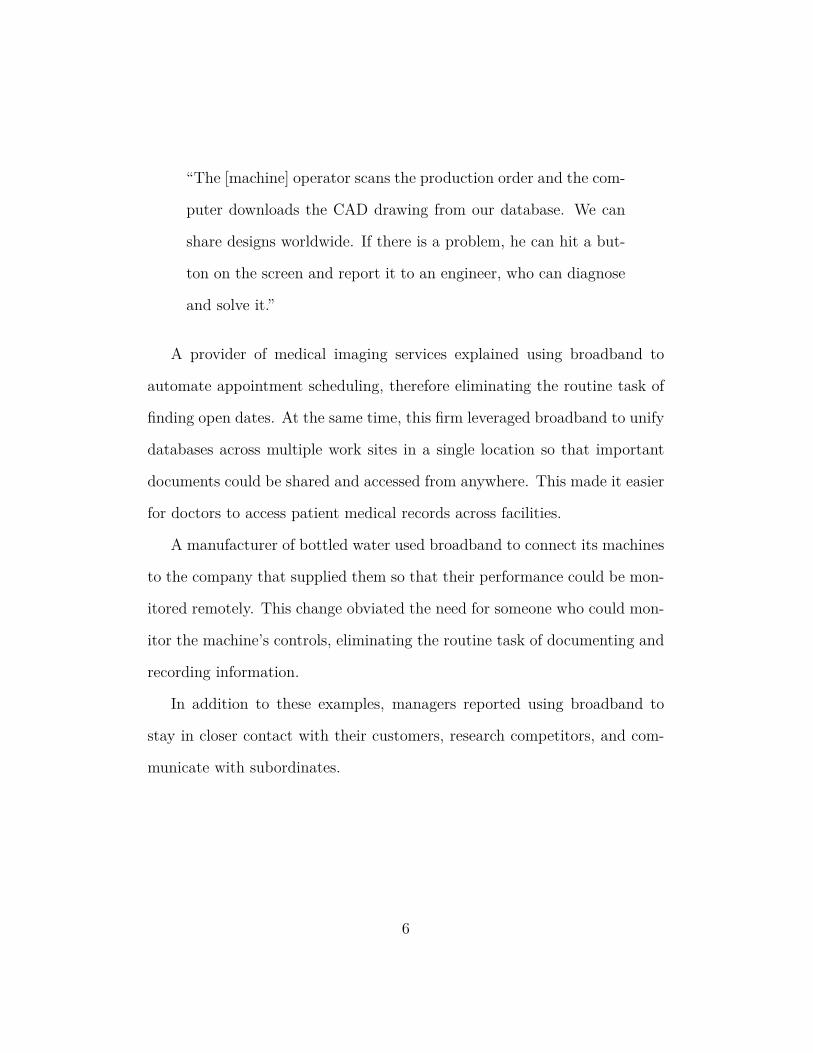
“The [machine] operator scans the production order and the com-
puter downloads the CAD drawing from our database. We can
share designs worldwide. If there is a problem, he can hit a but-
ton on the screen and report it to an engineer, who can diagnose
and solve it.”
A provider of medical imaging services explained using broadband to
automate appointment scheduling, therefore eliminating the routine task of
finding open dates. At the same time, this firm leveraged broadband to unify
databases across multiple work sites in a single location so that important
documents could be shared and accessed from anywhere. This made it easier
for doctors to access patient medical records across facilities.
A manufacturer of bottled water used broadband to connect its machines
to the company that supplied them so that their performance could be mon-
itored remotely. This change obviated the need for someone who could mon-
itor the machine’s controls, eliminating the routine task of documenting and
recording information.
In addition to these examples, managers reported using broadband to
stay in closer contact with their customers, research competitors, and com-
municate with subordinates.
6

3 Data
The data used in this study are richer than data used in prior studies of
broadband adoption because they include information on individual workers
and their employers over time. This allows me to examine how wages change
for different types of workers following firm adoption of broadband.
Data on individual workers come from the Relação Anual de Informações
Sociais (RAIS) for the years 2000 to 2009. RAIS is an establishment-employee
matched survey of all employers in Brazil’s formal economy conducted an-
nually by the Ministério do Trabalho e Emprego (MTE). Participation is
mandatory. Unique identifiers for workers and establishments in RAIS allow
records to be linked across years. Employee records include data on wages,
occupation, education, experience, age, gender, and contract hours (but not
hours actually worked).
I combine the employer-employee matched data from RAIS with firm-
level data on broadband adoption from the Latin American version of the
Ci Technology Database (CiTDB) from Aberdeen Group.1 The European
and U.S. versions of CiTDB have been used in prior studies to measure
technology adoption (Bloom et al., 2014). CiTDB contains information on
communication technologies used by the firm (e.g. xDSL, T1, etc.), which
I use to measure broadband adoption. I limit my study to manufacturing
firms—which is the largest group of businesses in the data—with technology
1CiTDB and Aberdeen Group were formerly owned by Harte Hanks; Halyard Capitalacquired Aberdeen and CiTDB in April 2015.
7

adoption information in Harte Hanks and wages in RAIS so that analyses
of the task content of jobs and occupational hierarchy can be more easily
interpreted.
Figure 1 shows that broadband use increased substantially from 2000 to
2009; fewer than 20 percent of the sample firms used broadband in 2000, but
more than 70 percent had a broadband connection by 2009. Note that these
numbers are not necessarily representative of all Brazilian manufacturing
firms. The firms surveyed by Harte Hanks—my source of technology data—
are larger than the typical firm in Brazil.
To examine how the effects of broadband vary for different types of work-
ers, I use measures from the U.S. Department of Labor’s O∗NET database to
characterize the importance of various tasks for each occupation.2 O∗NET
contains hundreds of scales that rate the importance of various activities,
skills, abilities, and work contexts for each job. For consistency with prior
research and to limit researcher degrees of freedom in picking from hundreds
of O∗NET scales (Autor, 2013), I use the same variables as Acemoglu and
Autor (2011) and computer code from David Autor’s website3 to produce
four measures of the extent to which each occupation involves various tasks:
1. Non-routine cognitive
2I use O∗NET version 9.0, which was released in December 2005 and is the most recentversion to use the SOC 2000 occupation codes. I use this version because I rely on acrosswalk between SOC 2000 and ISCO 88 to match the Brazilian occupation codes withO∗NET.
3Available at https://perma.cc/B7SK-VKUV.
8

2. Non-routine manual
3. Routine cognitive
4. Routine manual
Each of these variables is standardized across occupations so that a unit
increase equals a one standard deviation increase in the extent to which
an occupation depends on the given tasks relative to other occupations. Ap-
pendix A lists the specific O∗NET scales used for each task measure. Table 1
shows the distribution of the task measures across Brazilian workers. The
means and medians for the cognitive (manual) scales are negative (positive),
reflecting the greater prevalence of workers engaged in manual-task-intensive
occupations in Brazil’s manufacturing sector.
[Table 1 about here.]
O∗NET scales were developed to measure features of U.S. occupations.
I adapt these measures to Brazil by merging both the U.S. and Brazilian
occupation codes to the International Standard Classification of Occupations
(ISCO 88). This results in instances where a single Brazilian occupation code
matches multiple U.S. codes; in these cases I assign the Brazilian occupation
to a simple average of the U.S. task measures.
Additionally, I use occupation codes from RAIS to divide each establish-
ment’s workforce into hierarchical layers. My approach mirrors the method
used by Caliendo et al. (2015) in their study of French manufacturers. Specif-
ically, I assign each worker to one of the following four layers:
9

1. Directors (e.g. Chief Executive Officer, Chief Financial Officer)
2. Managers (e.g. Sales Manager, Branch Manager)
3. Supervisor (e.g. Foreman, Logistics Supervisor)
4. Workers (e.g. Welder, Production Line Feeder, Fish Cooker)
Like Caliendo et al. (2015), I find the grouping of occupations into layers
reflects meaningful differences between employees. Table 2 shows the mean
and selected percentiles of the wage distribution by layer. Directors and
managers have higher wages than supervisors, who have higher wages than
workers (at all percentiles).
[Figure 1 about here.]
[Table 2 about here.]
4 Methodology
I use a staggered difference-in-differences research design that identifies the
effect of broadband adoption on wages by comparing firms that did and did
not adopt broadband over the ten-year period between 2000 and 2009.
The main models of interest examine the effect of broadband adoption
on workers, allowing for the effect of broadband to differ by occupation:
lnwijt = β0Djt + β′1Djt ∗Kit + θ′Kit + δ′Xijt + γLjt + αj + λκ(j)t + ϵijt (1)
10

where wijht is the real wage of worker i at firm j in year t. Djt is an
indicator variable for broadband use by firm j and Kit is a vector of contin-
uous measures representing the task content of worker i’s occupation in year
t. The task measures capture the extent to which the worker’s job involves
routine vs. non-routine and cognitive vs. manual tasks. The vector Xijt is
a set of time-varying worker covariates that includes education, current job
experience, sex, age, age-squared, and log contract hours.4 Some specifica-
tions also include log employment, Ljt, to control for the possibility that
larger firms pay higher wages and are more likely to adopt broadband (Oi
and Idson, 1999). Employment, however, could itself be affected by broad-
band adoption; I therefore use employment as the dependent variable in other
analyses and omit it from most models. The model includes both firm (αj)
and industry-year (λκ(j)t, where κ(j) is the industry of firm j) fixed effects
that control for unobserved firm heterogeneity and annual shocks that affect
all workers within an industry equally.
Combining employer-employee matched data with information on tech-
nology use over time allows me to examine how the entire wage distribution
within firms changes following broadband adoption. To do so, I implement
the grouped quantile regression approach from Chetverikov et al. (2016).
4The data do not include actual hours worked, but do include hours in the labor contract.Full-time work in Brazil is 44 hours per week.
11

Specifically, I estimate:
Qlnwijt|Djt,ηjt(τ) = αj(τ) + λκ(j)t(τ) + γ′(τ)zij + β(τ)Djt + ϵ(τ, ηjt) (2)
where Q(τ) selects the τth quantile of log wages for firm j in year t, Djt
is an indicator for firm broadband adoption, zij is a vector of individual-level
covariates, and αj and λκ(j)t are firm and industry-year fixed effects.
The grouped quantile approach allows me to estimate how broadband
adoption affects inequality within firms. Greater effects of broadband in the
upper quantiles of the wage distribution than in lower quantiles imply that
inequality within firms increases following broadband adoption.
In addition to studying the effect of broadband on wages, I also examine
how employment changes at the firm level following broadband adoption:
Ljt = βDjt + αj + λκ(j)t + ϵjt (3)
Table 3 presents summary statistics of variables used in the analyses. Just
over half of observations are for people working in firms that use broadband.
[Table 3 about here.]
12

5 Results
5.1 Wage Effects
Overall, wages increase 2.3 percent following firm adoption of broadband.
Table 4 shows the effect of broadband adoption without distinguishing be-
tween occupations or types of employees. The results in columns 2–3 include
firm and year fixed effects, while columns 4–5 include firm and industry-year
fixed effects. The estimates are stable across specifications and show a posi-
tive average effect of broadband adoption on wages. Comparing the results
of columns 2 and 4 with those of columns 3 and 5 shows that the estimate of
the broadband effect is insensitive to controlling for firm size. The increase
in wages following broadband adoption, therefore, is not explained by big-
ger, growing firms paying both higher wages and simultaneously choosing to
adopt broadband.
[Table 4 about here.]
There are several caveats to a causal interpretation of these results. First,
firms might increase wages for other reasons that happen to coincide with
broadband adoption. Without controlling for these factors, wage increases
will be erroneously attributed to broadband. Second, even if broadband
causes wages to increase, the firms most likely to benefit from the technol-
ogy will be more likely to adopt, in which case estimates from the sample of
adopters will be greater than the effect of introducing other firms to broad-
13

band. Third, trends in wages prior to broadband adoption might be different
from trends in wages at firms that do not adopt. In this case, firms that do
not adopt broadband are a poor control group for the adopters.
I cannot correct for omitted variables without an instrument. The prob-
lem of firms selecting into broadband use, however, is partially mitigated by
the ten-year sample period. Figure 1 shows that most firms in the sample
eventually adopt broadband. Additionally, the long sample period allows me
to examine wage trends prior to broadband adoption. Figure 2 shows coeffi-
cient estimates from a modified version of the model in column 4 of Table 4
that includes separate dummy variables for years before and after adoption.
These single year estimates are imprecise, but show that the largest wage
increases happen in the years following broadband adoption. There is, how-
ever, some evidence that wages at adopting firms begin increasing relative to
non-adopting firms in the year before broadband adoption.
[Figure 2 about here.]
The effect of broadband is heterogeneous; workers in occupations that
require more non-routine cognitive tasks see larger wage gains than workers
in occupations that are intensive in routine cognitive tasks. Table 5 shows re-
gressions in which broadband adoption is interacted with occupation-specific
measures of task intensity. The coefficients on non-routine cognitive and
routine cognitive tasks have opposite signs, suggesting that broadband com-
plements workers performing non-routine cognitive tasks and substitutes for
14

workers in routine cognitive tasks. A one unit increase (roughly one stan-
dard deviation) in the intensity of non-routine cognitive tasks implies an
additional 3.5–4.5 percent wage increase following broadband adoption. In
contrast, a one unit increase in the intensity of routine cognitive tasks implies
a 4–5 percent decrease in wages, which cancels out the baseline increase of 4
percent from broadband adoption.
[Table 5 about here.]
Table 5 also indicates that the effect of broadband adoption does not vary
in the intensity of manual tasks. This is consistent with the intuition that
broadband ought to have small, if any, effect on tasks that require interaction
with equipment and using one’s hands.
[Table 6 about here.]
The use of four, continuous task measures interacted with broadband
complicates interpretation of the results in Table 5. Table 6 therefore presents
the distribution of wage effects (across workers) implied by the task regres-
sions. For each worker, I use the coefficients from the regressions in Table 5
and the task intensities of the worker’s occupation to calculate the hypothet-
ical impact of broadband for that worker. I then calculate the distribution
of these wage effects across all workers. The results in Table 6 show that
the effect of broadband on real wages is positive for the majority of workers
and that wage gains in the right tail of the distribution are much larger in
magnitude than wage losses in the left tail.
15
Overall, the broadband/task interaction effects of Table 5 are consistent
with the routinization hypothesis (Autor et al., 2003) that computer technol-
ogy complements and increases demand for non-routine tasks while substi-
tuting for routine tasks. In the case of broadband, this pattern is pronounced
for cognitive tasks, but not present for manual tasks.
My estimates for the wage effects of broadband are larger, although
roughly similar in magnitude, to those of Dutz et al. (2017), who examine
the regional wage effects of Brazil’s Internet (but not specifically broadband)
rollout. They report a two-year cumulative wage increase of 4.1–4.8 percent
for middle- and high-skill occupations in manufacturing in response to an
increase in Internet access, but no wage effect for low-skill occupations.5 A
possible explanation for the larger effect estimates in this paper is that, un-
like Dutz et al. (2017), I observe the adoption decisions of individual firms
instead of relying on measures of regional broadband availability.
5.2 New Versus Existing Employees
The effect of broadband on new employees is the same as the effect on existing
employees. This suggests that wage increases from broadband adoption are
not driven only by firms recruiting better workers post-adoption. Table 7
shows the effect of broadband adoption on wages allowing for the effect to
5Internet access in Dutz et al. (2017) is measured using the share of schools with Internetin each municipality. The reported effects are based on increasing Internet access from 0to 100 percent (i.e. going from no access to every school having access).
16

differ by whether an employee is in his first, first two, or first three years of
working at the firm. The results show that newly hired employees do not
earn an additional wage premium from broadband adoption over that earned
by existing employees.
[Table 7 about here.]
5.3 Wage Effects and Organizational Hierarchy
Wage increases following broadband adoption are greatest for workers higher
in the organizational hierarchy: directors and managers see larger increases
than lower-level workers. Columns 1 and 4 of Table 8 show that directors and
managers earn 8–9 percent more following broadband adoption compared to
a main effect of just over 2 percent for all employees.
[Table 8 about here.]
The effect of broadband is especially large for directors at the top of
the organizational hierarchy. Columns 2–3 and 5–6 split the managers and
directors group into two separate coefficients, and columns 3 and 6 add an-
other coefficient for supervisors, who are grouped with workers in the other
columns. The estimates suggest that directors earn 18–19 percent more fol-
lowing firm adoption of broadband. This is about 9 percentage points more
than the increase for managers. Most firms in the sample are private com-
panies. The directors in this sample are therefore more likely to have an
17

ownership stake in the firm than if the firms were public. The wage increases
for directors are consistent with firm owners capturing large gains as a re-
sult of broadband increasing firm productivity. Unfortunately, I do not have
data on revenue or non-labor inputs to explore this hypothesis. Akerman
et al. (2015), however, report that firms in Norway earn large rents from
broadband adoption, and Jung and López-Bazo (2017) find a positive effect
of broadband on regional productivity in Brazil.
The greater effect of broadband for directors and managers implies that
within firm wage inequality increases following adoption. To more thor-
oughly examine this pattern, I use the grouped quantile regression estimator
from Chetverikov et al. (2016) to assess how broadband adoption affects the
distribution of wages within firms.
Figure 3 plots the effect of broadband on selected quantiles of the wage
distribution. Figure 3a shows results from a model without worker-level
controls, while Figure 3b is based on a model that controls for experience,
age, and two education dummies (high school and college completion). The
sample in the latter model is also restricted to firms with at least 10 employees
to allow for the inclusion of the worker-level controls.
Although the estimates for the individual quantiles are imprecise, the
pattern of point estimates in Figure 3 suggests that broadband has larger
effects on the right tail of the wage distribution than on wages in the left
tail. In other words, high wage workers benefit more than low wage workers
from broadband adoption and inequality within firms increases.
18

[Figure 3 about here.]
Broadband’s effect in widening the within-firm wage distribution is note-
worthy for the literatures on vertical pay comparisons within firms (e.g.
Gartenberg and Wulf, 2017a,b; Kacperczyk and Balachandran, 2018), the an-
tecedents of compensation policies (e.g. Chin and Semadeni, 2017; Fredrick-
son et al., 2010), and the role of firms in determining pay inequality (e.g.
Cobb, 2016). This paper provides the first direct evidence connecting adop-
tion and use of advanced information technology to a widening pay gap within
an organization. Furthermore, this paper provides estimates of broadband’s
effect across the entire wage distribution; existing research on pay dispersion
is largely focused on top-management teams and key employees.
Prior work suggests that pay inequality can have psychological costs
(Larkin et al., 2012), and can negatively impact performance (Fredrickson
et al., 2010; Siegel and Hambrick, 2005). Unfortunately, I do not have data
to assess either the first order effect of broadband on performance or any
second order effects operating through employee motivation. I also lack data
on performance-linked compensation that would allow me to examine how
different components of pay change in response to technology adoption.
5.4 Employment Effects
Broadband has positive effects on firm-level employment. Column 1 of
Table 9 indicates that employment increases roughly 5.4 percent follow-
19

ing broadband adoption. Columns 2 and 3 show separate regressions for
managerial and non-managerial employees respectively. These estimates are
not statistically different from zero at conventional significance levels, and
the point estimates do not suggest different employment effects for workers
and managers following broadband adoption. Columns 4–6, which include
industry-year fixed effects instead of just year fixed effects, show slightly
larger estimates. Column 4 indicates that employment increases about 7
percent following broadband adoption, and columns 5–6 again suggest that
the effect is similar for manages and non-managers.
[Table 9 about here.]
6 Conclusion
I combine data on firm adoption of broadband technology over time with
data on individual workers to estimate the effects of broadband on wages
and employment. Overall, wages increase 2.3 percent following broadband
adoption, but the effects are heterogeneous. Consistent with the theory of
skill-biased technological change, wages increase the most for workers en-
gaged in non-routine cognitive tasks. Returns for routine cognitive tasks are
negative, and intuitively, the effect of broadband does not vary in the in-
tensity of either routine or non-routine manual tasks. Quantile regressions
measuring the effect of broadband on the full wage distribution suggest that
broadband increases within-firm wage inequality.
20

Additionally, I am able to compare the returns of broadband adoption
for new and existing employees. I find that both new and existing employees
benefit from broadband adoption, which suggests the effect of broadband on
wages is not solely the result of recruiting better employees post-adoption.
Overall employment increases 5–7 percent following broadband adoption.
The results are useful for policymakers evaluating the potential impacts
of public investment in broadband infrastructure. Such investments are often
predicated on the hypothesis that high-speed Internet spurs economic and
wage growth despite limited research on this topic. I show that workers do
not equally share the gains from broadband adoption; workers engaged in
higher paid occupations that require non-routine cognitive tasks experience
larger gains from adoption than workers in occupations intensive in routine
cognitive tasks.
21

Appendices
A Construction of O∗NET Task Measures
This appendix lists the O∗NET scales used to construct the occupation task
measures used in Table 5. The O∗NET scales used in this paper are based on
those in Acemoglu and Autor (2011) and computer code from David Autor’s
website.6
Acemoglu and Autor (2011) use two sub-measures of non-routine cogni-
tive tasks: “analytical” and “interpersonal.” For simplicity, I combine these
two measures into a single non-routine cognitive measure.
The computer code provided by David Autor for constructing task mea-
sures includes two non-routine manual scales: “physical” and “interpersonal”.
The interpersonal scale is not used in Acemoglu and Autor (2011). I com-
bine the two non-routine manual scales in the computer code into a single
non-routine manual measure.
Non-routine cognitive
4.A.2.a.4 Analyzing data/information
4.A.2.b.2 Thinking creatively
4.A.4.a.1 Interpreting information for others
4.A.4.a.4 Establishing and maintaining personal relationships
4.A.4.b.4 Guiding, directing and motivating subordinates
6Available at https://perma.cc/B7SK-VKUV.
22

4.A.4.b.5 Coaching/developing others
Non-routine manual
4.A.3.a.4 Operating vehicles, mechanized devices, or equipment
4.C.2.d.1.g Spend time using hands to handle, control or feel objects,tools or controls
1.A.2.a.2 Manual dexterity
1.A.1.f.1 Spatial orientation
2.B.1.a Social Perceptiveness
Routine cognitive
4.C.3.b.7 Importance of repeating the same tasks
4.C.3.b.4 Importance of being exact or accurate
4.C.3.b.8 Structured v. Unstructured work (reverse)
Routine manual
4.C.3.d.3 Pace determined by speed of equipment
4.A.3.a.3 Controlling machines and processes
4.C.2.d.1.i Spend time making repetitive motions
23
ReferencesAcemoglu, Daron and David Autor, “Skills, Tasks and Technologies:
Implications for Employment and Earnings,” in “Handbook of Labor Eco-nomics,” Vol. 4, Elsevier, 2011, pp. 1043–1171.
Akerman, Anders, Ingvil Gaarder, and Magne Mogstad, “The SkillComplementarity of Broadband Internet,” The Quarterly Journal of Eco-nomics, 2015, 130 (4), 1781–1824.
Almeida, Rita K., Carlos H.L. Corseuil, and Jennifer P. Poole,“The Impact of Digital Technologies on Routine Tasks: Do Labor PoliciesMatter?,” Policy Research Working Paper WPS8187, The World Bank2017.
Autor, David, “The ‘Task Approach’ to Labor Markets: An Overview,”Journal for Labour Market Research, 2013, 46 (3), 185–199.
, Frank Levy, and Richard J. Murnane, “The Skill Content of RecentTechnological Change: An Empirical Exploration,” The Quarterly Journalof Economics, 2003, 118 (4), 1279–1333.
Bloom, Nicholas, Luis Garicano, Raffaella Sadun, and John VanReenen, “The Distinct Effects of Information Technology and Communi-cation Technology on Firm Organization,” Management Science, 2014, 60(12), 2859–2885.
Caliendo, Lorenzo, Ferdinando Monte, and Esteban Rossi-Hansberg, “The Anatomy of French Production Hierarchies,” Journalof Political Economy, 2015, 124 (4), 809–852.
Chetverikov, Denis, Bradley Larsen, and Christopher Palmer, “IVQuantile Regression for Group-Level Treatments, with an Application tothe Distributional Effects of Trade,” Econometrica, 2016, 84 (2), 809–833.
Chin, M. K. and Matthew Semadeni, “CEO Political Ideologies and PayEgalitarianism Within Top Management Teams,” Strategic ManagementJournal, 2017, 38 (8), 1608–1625.
Cobb, J. Adam, “How Firms Shape Income Inequality: Stakeholder Power,Executive Decision Making, and the Structuring of Employment Relation-ships,” Academy of Management Review, 2016, 41 (2), 324–348.
24

Dutz, Mark A., Lucas Ferreira Mation, Stephen D. O’Connell, andRobert D. Willig, “Economywide and Sectoral Impacts on Workers ofBrazil’s Internet Rollout,” Policy Research Working Paper WPS8042, TheWorld Bank 2017.
Forman, Chris, Avi Goldfarb, and Shane Greenstein, “The Internetand Local Wages: A Puzzle,” American Economic Review, 2012, 102 (1),556––75.
Fredrickson, James W., Alison Davis-Blake, and WM. GerardSanders, “Sharing the Wealth: Social Comparisons and Pay Dispersionin the CEO’s Top Team,” Strategic Management Journal, 2010, 31 (10),1031–1053.
Gartenberg, Claudine and Julie Wulf, “Islands of Equality: Compe-tition and Pay Inequality Within and Across Firm Boundaries,” 2017.Unpublished.
and , “Pay Harmony? Social Comparison and Performance Compen-sation in Multibusiness Firms,” Organization Science, 2017, 28 (1), 39–55.
Gillett, Sharon E., William H. Lehr, Carlos A. Osorio, and Mar-vin A. Sirbu, “Measuring Broadband’s Economic Impact,” NationalTechnical Assistance, Training, Research, and Evaluation Project 99-07-13829, U.S. Department of Commerce February 2006.
Hjort, Jonas and Jonas Poulsen, “The Arrival of Fast Internet and Em-ployment in Africa,” Working Paper 23582, National Bureau of EconomicResearch 2017.
Jung, Juan and Enrique López-Bazo, “On the Regional Impact ofBroadband on Productivity: The Case of Brazil,” Working Paper 2017/08,Research Institute of Applied Economics 2017.
Kacperczyk, Aleksandra and Chanchal Balachandran, “Vertical andHorizontal Wage Dispersion and Mobility Outcomes: Evidence from theSwedish Microdata,” Organization Science, 2018, 29 (1), 17–38.
Kolko, Jed, “Broadband and Local Growth,” Journal of Urban Economics,2012, 71 (1), 100–113.
25

Larkin, Ian, Lamar Pierce, and Francesca Gino, “The PsychologicalCosts of Pay-for-Performance: Implications for the Strategic Compensa-tion of Employees,” Strategic Management Journal, 2012, 33 (10), 1194–1214.
Nickerson, Jack A. and Todd R. Zenger, “Envy, Comparison Costs,and the Economic Theory of the Firm,” Strategic Management Journal,2008, 29 (13), 1429–1449.
Oi, Walter Y. and Todd L. Idson, “Firm Size and Wages,” in “Handbookof Labor Economics,” Vol. 3, Elsevier, 1999, pp. 2165–2214.
Siegel, Phyllis A. and Donald C. Hambrick, “Pay Disparities WithinTop Management Groups: Evidence of Harmful Effects on Performance ofHigh-Technology Firms,” Organization Science, 2005, 16 (3), 259–274.
26
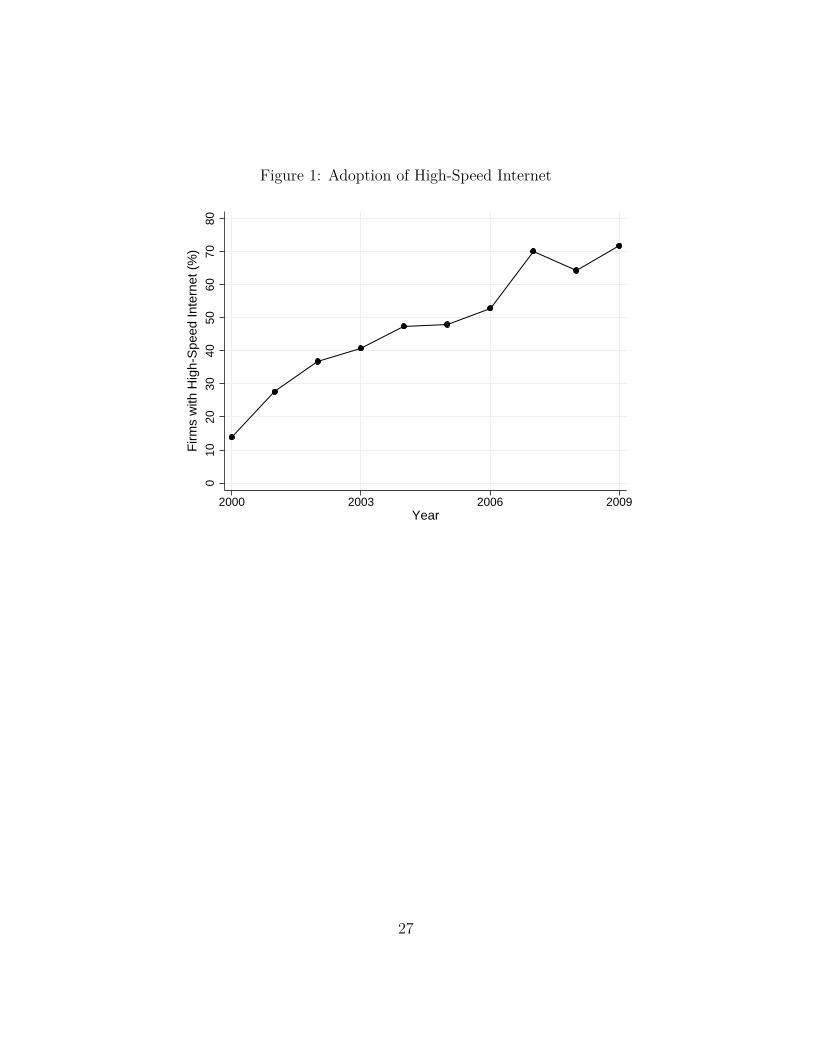
Figure 1: Adoption of High-Speed Internet
010
2030
4050
6070
80
Firm
s w
ith H
igh-
Spe
ed In
tern
et (
%)
2000 2003 2006 2009Year
27
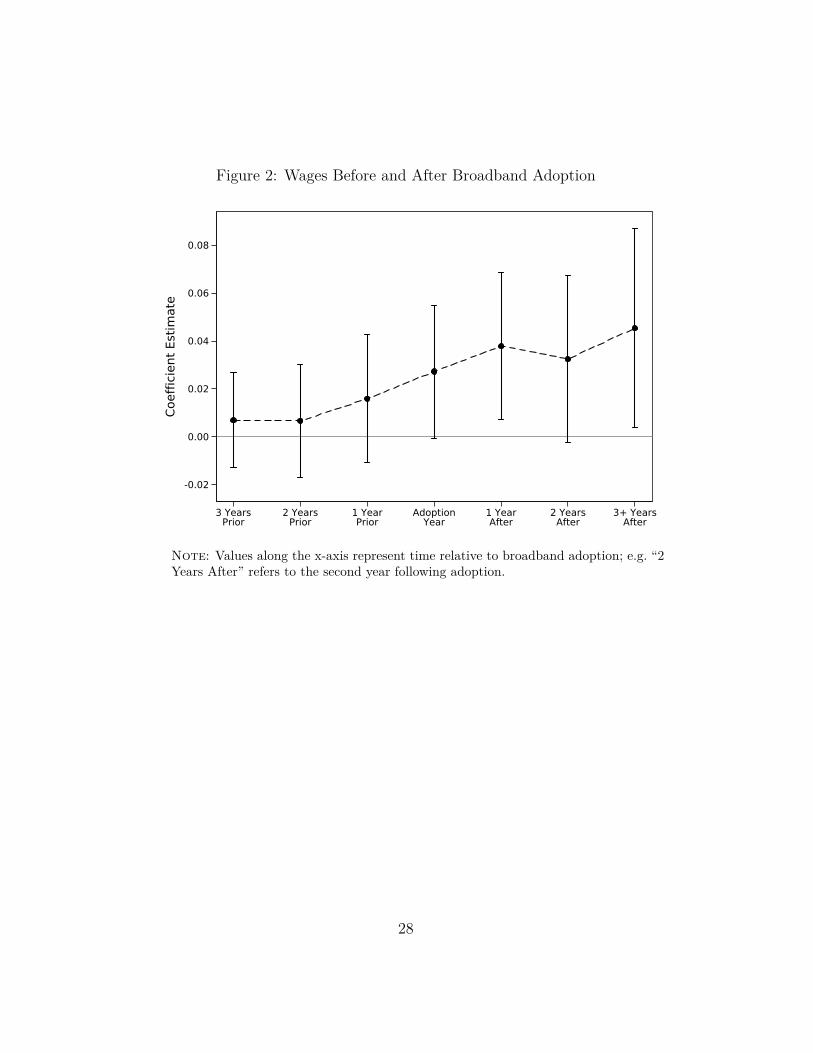
Figure 2: Wages Before and After Broadband Adoption
-0.02
0.00
0.02
0.04
0.06
0.08
Coef
ficie
nt E
stim
ate
3 YearsPrior
2 YearsPrior
1 YearPrior
AdoptionYear
1 YearAfter
2 YearsAfter
3+ YearsAfter
Note: Values along the x-axis represent time relative to broadband adoption; e.g. “2Years After” refers to the second year following adoption.
28

Figure 3: Quantile Effects of Broadband Adoption
-0.010
0.000
0.020
0.040
0.060
0.080Br
oadb
and
Coef
ficie
nt
0 20 40 60 80 100Percentile
(a) Without worker micro-covariates
-0.020
0.000
0.020
0.040
0.060
0.080
0.100
0.120
0.140
Broa
dban
d Co
effic
ient
0 20 40 60 80 100
(b) With worker micro-covariates
29

Table 1: Task Summary Statistics
Task measure mean sd p5 p10 p50 p90 p95
Non-routine cognitive -0.72 0.79 -1.61 -1.60 -0.85 0.30 0.70Non-routine manual 0.32 0.74 -0.94 -0.90 0.39 1.30 1.40Routine cognitive -0.19 0.77 -1.36 -1.02 -0.43 1.13 1.17Routine manual 0.79 0.99 -0.68 -0.46 0.59 2.16 2.16
Note: Table shows the distribution of occupation task measures acrossindividual workers.
30

Table 2: Wage Distribution by Hierarchy Level
Director Manager Supervisor Worker
mean 18,085 8,679 3,763 1,476p5 1,593 1,053 735 391p10 3,030 1,692 984 468p25 7,573 3,458 1,674 636p50 16,617 7,144 2,953 961p75 26,403 11,767 4,979 1,648p90 35,531 17,166 7,365 2,937p95 40,745 21,779 9,145 4,222
Note: Wages are mean monthly wage in 2008 reais.
31
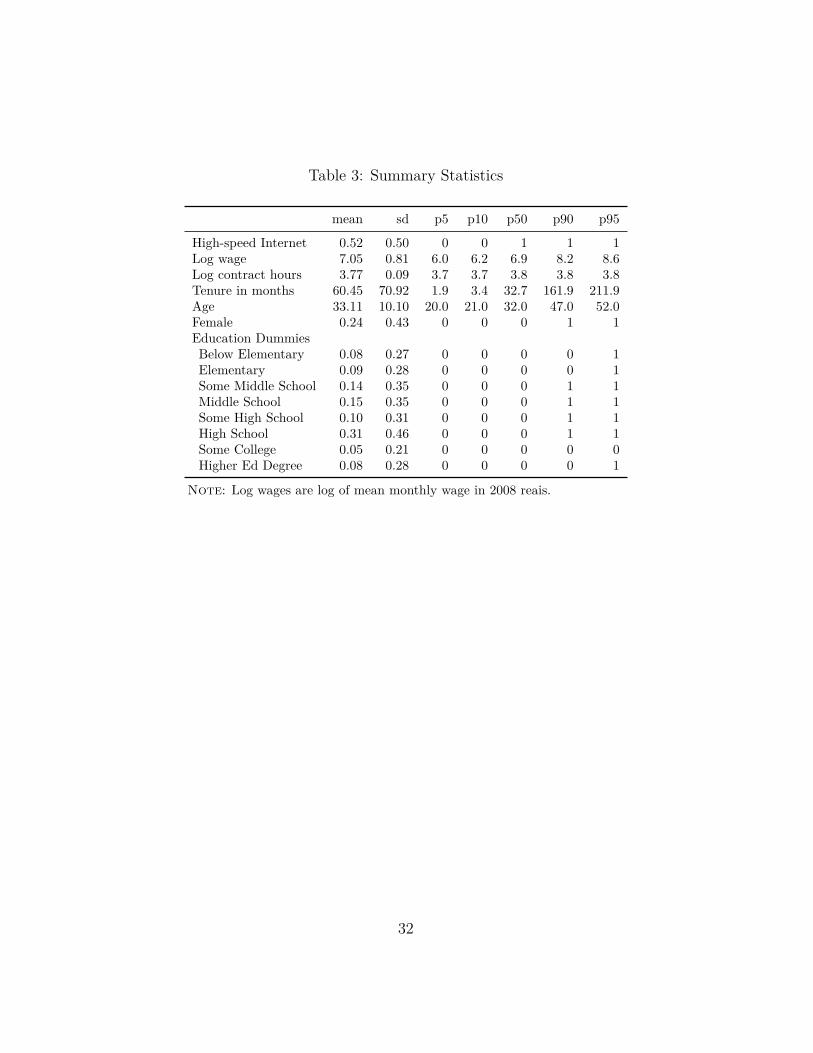
Table 3: Summary Statistics
mean sd p5 p10 p50 p90 p95
High-speed Internet 0.52 0.50 0 0 1 1 1Log wage 7.05 0.81 6.0 6.2 6.9 8.2 8.6Log contract hours 3.77 0.09 3.7 3.7 3.8 3.8 3.8Tenure in months 60.45 70.92 1.9 3.4 32.7 161.9 211.9Age 33.11 10.10 20.0 21.0 32.0 47.0 52.0Female 0.24 0.43 0 0 0 1 1Education DummiesBelow Elementary 0.08 0.27 0 0 0 0 1Elementary 0.09 0.28 0 0 0 0 1Some Middle School 0.14 0.35 0 0 0 1 1Middle School 0.15 0.35 0 0 0 1 1Some High School 0.10 0.31 0 0 0 1 1High School 0.31 0.46 0 0 0 1 1Some College 0.05 0.21 0 0 0 0 0Higher Ed Degree 0.08 0.28 0 0 0 0 1
Note: Log wages are log of mean monthly wage in 2008 reais.
32
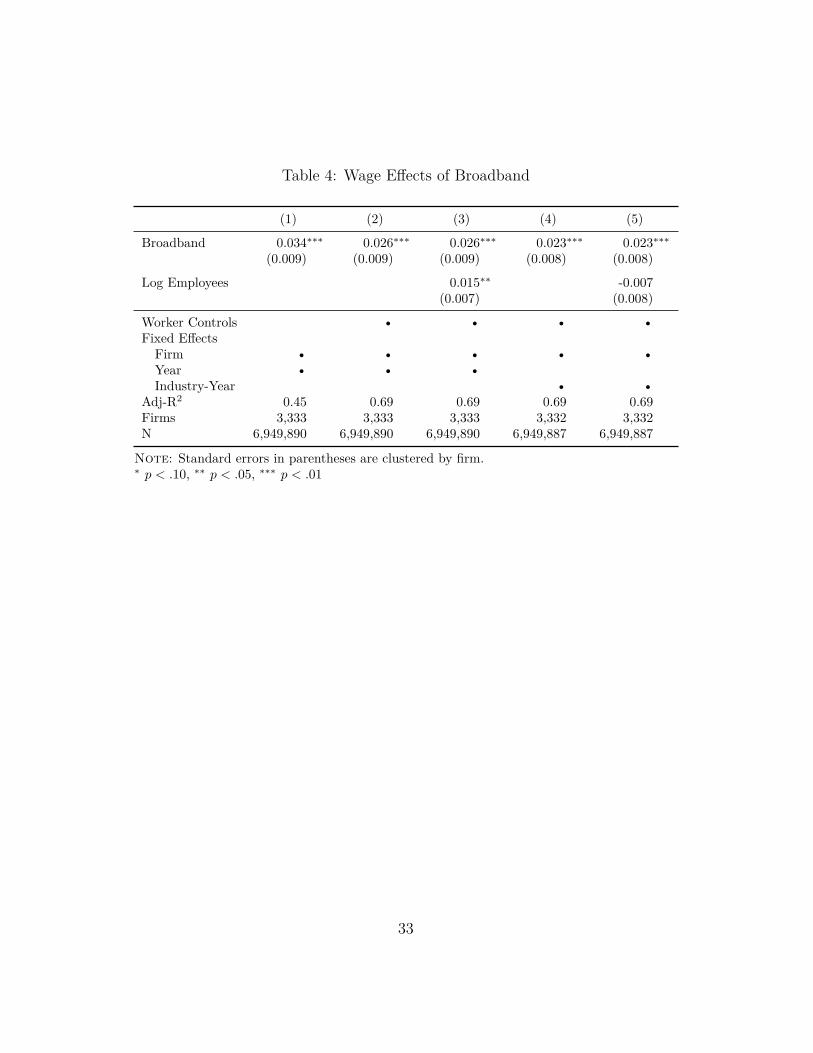
Table 4: Wage Effects of Broadband
(1) (2) (3) (4) (5)
Broadband 0.034∗∗∗ 0.026∗∗∗ 0.026∗∗∗ 0.023∗∗∗ 0.023∗∗∗(0.009) (0.009) (0.009) (0.008) (0.008)
Log Employees 0.015∗∗ -0.007(0.007) (0.008)
Worker Controls • • • •Fixed Effects
Firm • • • • •Year • • •Industry-Year • •
Adj-R2 0.45 0.69 0.69 0.69 0.69Firms 3,333 3,333 3,333 3,332 3,332N 6,949,890 6,949,890 6,949,890 6,949,887 6,949,887
Note: Standard errors in parentheses are clustered by firm.∗ p < .10, ∗∗ p < .05, ∗∗∗ p < .01
33
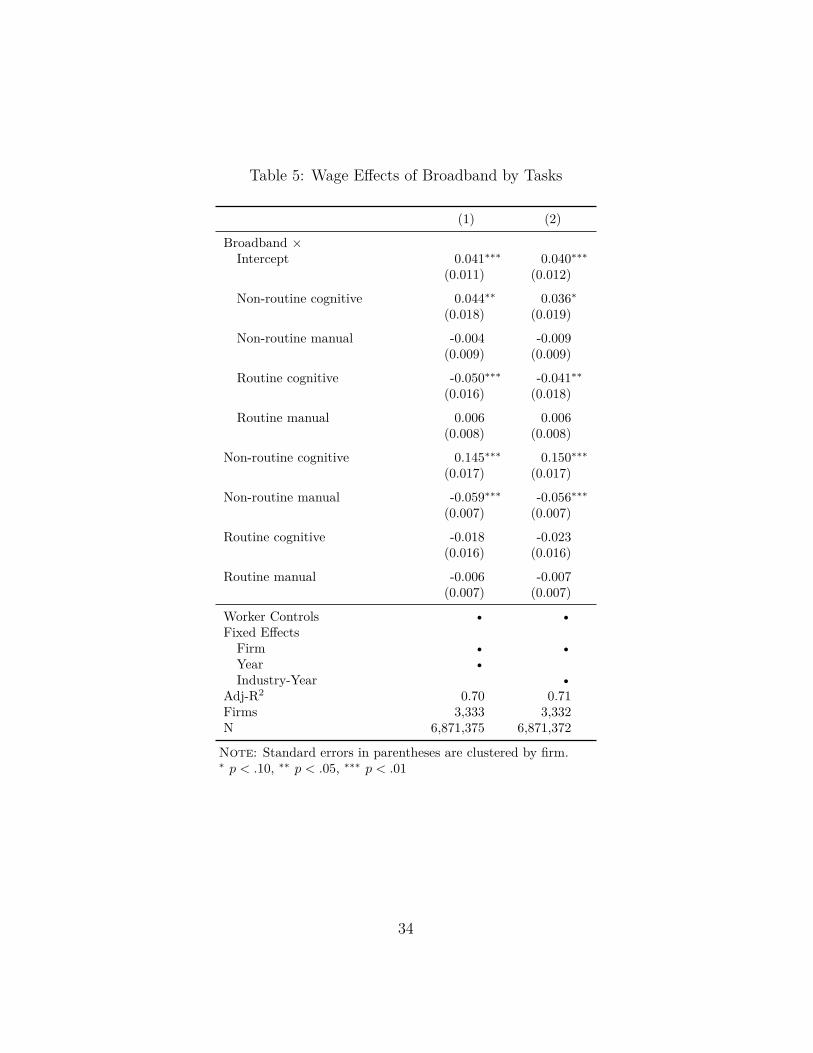
Table 5: Wage Effects of Broadband by Tasks
(1) (2)
Broadband ×Intercept 0.041∗∗∗ 0.040∗∗∗
(0.011) (0.012)
Non-routine cognitive 0.044∗∗ 0.036∗(0.018) (0.019)
Non-routine manual -0.004 -0.009(0.009) (0.009)
Routine cognitive -0.050∗∗∗ -0.041∗∗(0.016) (0.018)
Routine manual 0.006 0.006(0.008) (0.008)
Non-routine cognitive 0.145∗∗∗ 0.150∗∗∗(0.017) (0.017)
Non-routine manual -0.059∗∗∗ -0.056∗∗∗(0.007) (0.007)
Routine cognitive -0.018 -0.023(0.016) (0.016)
Routine manual -0.006 -0.007(0.007) (0.007)
Worker Controls • •Fixed Effects
Firm • •Year •Industry-Year •
Adj-R2 0.70 0.71Firms 3,333 3,332N 6,871,375 6,871,372
Note: Standard errors in parentheses are clustered by firm.∗ p < .10, ∗∗ p < .05, ∗∗∗ p < .01
34

Table 6: Summary of Wage Effects of Broadband by Tasks
Model mean sd p5 p10 p25 p50 p75 p90 p95
(1) 0.023 0.036 -0.020 -0.015 0.005 0.015 0.035 0.079 0.115(2) 0.024 0.029 -0.013 -0.000 0.010 0.019 0.033 0.072 0.096
Note: Table shows the distribution of wage effects across individual workers forthe models in Table 5.
35

Table 7: Wage Effects, New vs. Existing Employees
(1) (2) (3) (4) (5) (6)
Broadband ×Intercept 0.023∗∗∗ 0.023∗∗∗ 0.024∗∗∗ 0.021∗∗∗ 0.020∗∗ 0.022∗∗
(0.008) (0.008) (0.008) (0.008) (0.008) (0.009)
Hiring year 0.009 0.008(0.007) (0.007)
First 2 years 0.003 0.001(0.008) (0.007)
First 3 years 0.001 -0.002(0.008) (0.008)
Hiring year -0.136∗∗∗ -0.136∗∗∗(0.005) (0.005)
First 2 years -0.155∗∗∗ -0.154∗∗∗(0.005) (0.005)
First 3 years -0.152∗∗∗ -0.151∗∗∗(0.006) (0.005)
Worker Controls • • • • • •Fixed Effects
Firm • • • • • •Year • • •Industry-Year • • •
Adj-R2 0.69 0.69 0.69 0.69 0.70 0.70Firms 3,333 3,333 3,333 3,332 3,332 3,332N 6,949,890 6,949,890 6,949,890 6,949,887 6,949,887 6,949,887
Note: Standard errors in parentheses are clustered by firm.∗ p < .10, ∗∗ p < .05, ∗∗∗ p < .01
36
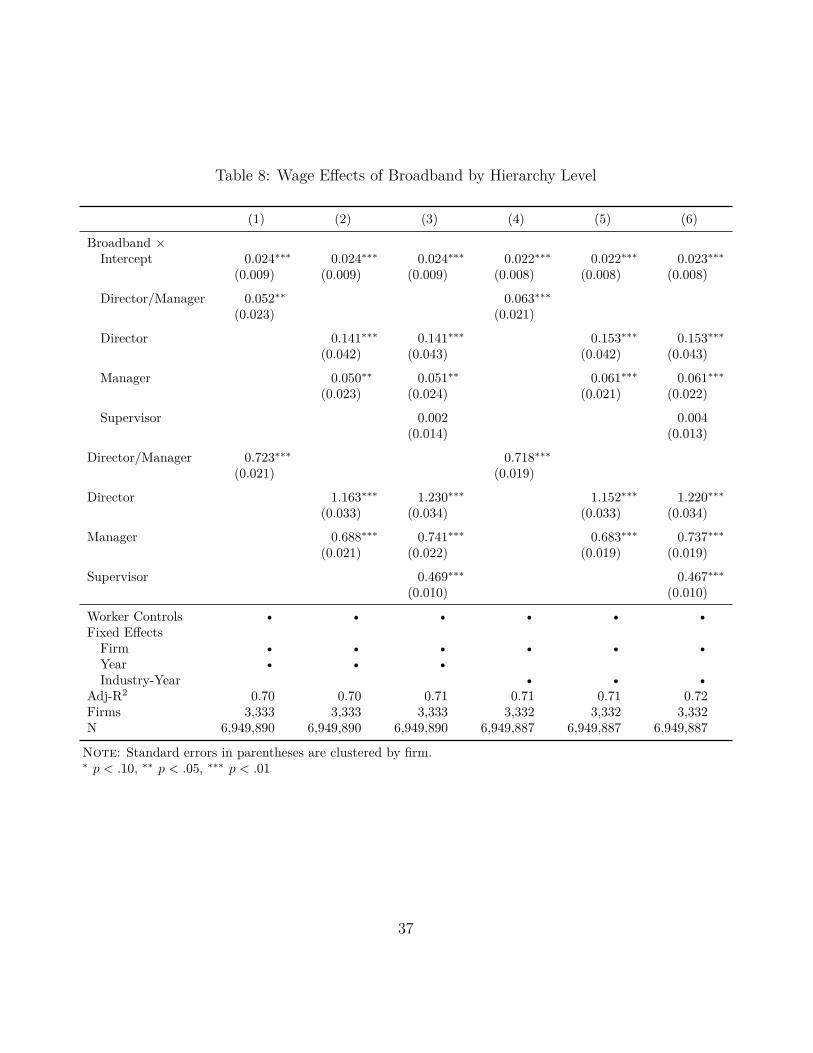
Table 8: Wage Effects of Broadband by Hierarchy Level
(1) (2) (3) (4) (5) (6)
Broadband ×Intercept 0.024∗∗∗ 0.024∗∗∗ 0.024∗∗∗ 0.022∗∗∗ 0.022∗∗∗ 0.023∗∗∗
(0.009) (0.009) (0.009) (0.008) (0.008) (0.008)
Director/Manager 0.052∗∗ 0.063∗∗∗(0.023) (0.021)
Director 0.141∗∗∗ 0.141∗∗∗ 0.153∗∗∗ 0.153∗∗∗(0.042) (0.043) (0.042) (0.043)
Manager 0.050∗∗ 0.051∗∗ 0.061∗∗∗ 0.061∗∗∗(0.023) (0.024) (0.021) (0.022)
Supervisor 0.002 0.004(0.014) (0.013)
Director/Manager 0.723∗∗∗ 0.718∗∗∗(0.021) (0.019)
Director 1.163∗∗∗ 1.230∗∗∗ 1.152∗∗∗ 1.220∗∗∗(0.033) (0.034) (0.033) (0.034)
Manager 0.688∗∗∗ 0.741∗∗∗ 0.683∗∗∗ 0.737∗∗∗(0.021) (0.022) (0.019) (0.019)
Supervisor 0.469∗∗∗ 0.467∗∗∗(0.010) (0.010)
Worker Controls • • • • • •Fixed Effects
Firm • • • • • •Year • • •Industry-Year • • •
Adj-R2 0.70 0.70 0.71 0.71 0.71 0.72Firms 3,333 3,333 3,333 3,332 3,332 3,332N 6,949,890 6,949,890 6,949,890 6,949,887 6,949,887 6,949,887
Note: Standard errors in parentheses are clustered by firm.∗ p < .10, ∗∗ p < .05, ∗∗∗ p < .01
37

Table 9: Employment Effects of Broadband
Total Managers Workers Total Managers Workers(1) (2) (3) (4) (5) (6)
Broadband 0.053∗∗ 0.044∗ 0.040 0.071∗∗∗ 0.054∗∗ 0.058∗∗(0.026) (0.026) (0.027) (0.027) (0.026) (0.026)
Worker Controls • • • • • •Fixed Effects
Firm • • • • • •Year • • •Industry-Year • • •
Adj-R2 0.84 0.79 0.85 0.84 0.81 0.76Firms 3,026 2,722 3,023 2,990 2,990 2,990N 17,722 15,348 17,696 17,310 17,310 17,310
Note: Standard errors in parentheses are clustered by firm.∗ p < .10, ∗∗ p < .05, ∗∗∗ p < .01
38