THE EFFECT OF TEMPERATURE ON THE MECHANICAL PROPERTIES …
17
The Japanese Journal of Physiology 14, pp.422-438, 1964 THE EFFECT OF TEMPERATURE ON THE MECHANICAL PROPERTIES AND ACTION POTENTIAL OF ISOLATED FROG VENTRICLE Hidenobu MASHIMA AND Moto MATSUMURA* Department of Physiology, School of Medicine, juntendo University, Hongo, Tokyo Since the studies of LUNDIN (1944), the fundamental mechanical properties of cardiac muscle have been fruitfully studied by many investigators (ABBOTT & MOMMAERTS 1959; MOMMAERTS et al., 1960; SONNENBLICK 1962a), aside from its functions as a pump. And recently BLINKS & KOCH-WESER (1963) and KOCH-WESER & BLINKS (1963) reviewed the studies on the physical factors of contraction in cardiac muscle, including their own results. All these studies were carried out in the manner which has been done in skeletal muscle (HILL, 1938; RITCHIE, 1954; BUCHTHAL & KAISER, 1951; JEWELL & WILKIE, 1960). However, because the cardiac muscle can not be tetanized, the degree of ac- tivation could not be determined as done in skeletal muscle. We think it is possible to estimate the intensity of full active state from the contracture response in potassium solution. Besides the active state, the shortening velocity, the rate of rise of tension and the work done during contraction have not been sufficiently analyzed in the frog cardiac muscle, although a great number of studies on the peak tension and the influence of beating frequency to it have been carried out (KOCH-WESER & BLINKS, 1963). The present study was done with the purposes to determine the active state curve and the factors for the muscle to perform work, and to examine the effect of cooling on the mechanical properties in relation to the action potential and in comparison with those of skeletal muscle. METHODS Strips of about 1 mm in thickness and 8-12 mm in length were dissected in circu- lar direction from the frog ventricle. The preparation obtained from more than 1 mm apart from the coronal sulcus did not beat spontaneously, so the frequency of con- Received for publication June 23, 1964 *真 島英信 ,松 村 幹郎 422
Transcript of THE EFFECT OF TEMPERATURE ON THE MECHANICAL PROPERTIES …

The Japanese Journal of Physiology
14, pp.422-438, 1964
THE EFFECT OF TEMPERATURE ON THE
MECHANICAL PROPERTIES AND ACTION
POTENTIAL OF ISOLATED
FROG VENTRICLE
Hidenobu MASHIMA AND Moto MATSUMURA*
Department of Physiology, School of Medicine,juntendo University, Hongo, Tokyo
Since the studies of LUNDIN (1944), the fundamental mechanical properties
of cardiac muscle have been fruitfully studied by many investigators (ABBOTT& MOMMAERTS 1959; MOMMAERTS et al., 1960; SONNENBLICK 1962a), aside
from its functions as a pump. And recently BLINKS & KOCH-WESER (1963)
and KOCH-WESER & BLINKS (1963) reviewed the studies on the physical factors
of contraction in cardiac muscle, including their own results. All these studies
were carried out in the manner which has been done in skeletal muscle (HILL,
1938; RITCHIE, 1954; BUCHTHAL & KAISER, 1951; JEWELL & WILKIE, 1960).
However, because the cardiac muscle can not be tetanized, the degree of ac-
tivation could not be determined as done in skeletal muscle. We think it is
possible to estimate the intensity of full active state from the contractureresponse in potassium solution.
Besides the active state, the shortening velocity, the rate of rise of tension
and the work done during contraction have not been sufficiently analyzed in
the frog cardiac muscle, although a great number of studies on the peak
tension and the influence of beating frequency to it have been carried out
(KOCH-WESER & BLINKS, 1963).The present study was done with the purposes to determine the active
state curve and the factors for the muscle to perform work, and to examine
the effect of cooling on the mechanical properties in relation to the action
potential and in comparison with those of skeletal muscle.
METHODS
Strips of about 1 mm in thickness and 8-12 mm in length were dissected in circu-
lar direction from the frog ventricle. The preparation obtained from more than 1 mm
apart from the coronal sulcus did not beat spontaneously, so the frequency of con-
Received for publication June 23, 1964
*真 島 英 信,松 村 幹 郎
422

TEMPERATURE ON FROG VENTRICLE 423
traction was regulated by electrical stimulation. The cut ends would heal over one
hour after dissection (NIEDERGERKE, 1956).
The diagram of the whole arrangement of mechanical system is shown in FIG. 1.
The preparation was mounted horizontally in Ringer's solution, the bath (B) was 4•~
3 cm and filled with 10 ml of solution. One end of the preparation was connected to
FIG. 1. The diagram of mechanical system.
B, bath of Ringer's solution ; E, platinum foil electrode for transverse field
stimulation; G1, G2, semiconductor strain-gauge; H, thermoelectric temperature
regulator; I, inertia lever; K, electromagnetic key for quick release; L, lump
for photoelectric tube; M, muscle; O, counter balance; P1, pre-load; F2, after-
load; R, thread; S, stop,
the semiconductor strain-gauge (G1), and the other to a cross-shaped lever made of light wood, the longest arm of which was 10 cm and the others were 5 cm each. For the isometric contraction, the lever was fixed by the electromagnetic key (K) and the tension was recorded by strain-gauge (G1). For the isotonic contraction the key was removed, the load (P1-E-P2) was hung and the shortening was recorded by the photo-electric system (L). The initial length of the muscle was controlled by the pre-load (P1) and did not change for any subsequent after-load (P2), using the stop (S). The inertia level (I) was connected to the isotonic lever with an inextensible thread (R). Changing the inertia, the shortening velocity was controlled independently of the load or the initial length of the muscle. The moment of inertia of the lever (I) was changed by moving or exchanging the sliding balances (O). After the initial accel-eration phase of the contraction was over, the thread was slackened and the inertia lever had no influence on the contraction (MASHIMA & TANAKA, 1954). To follow the decay of the active state, quick release method (RITcHIE, 1954; ABBOTT & MOM-MAERTS, 1958) was employed, using the key (K) and strain-gauge (G2).
The muscle was stimulated with a square pulse of 10 msec in duration, some-times 50 msec was necessary at lower temperature, through platinum massive elect-rodes (E) by the high-current stimulator (30 Watt), which was originally devised by MOSTOVSKY & SANDOW, (1951).
Ringer's solution contained 110 mM, NaCI; 2.0 mM, KC1; 1.8 mM, CaCl2; 10 mM, NaHCO3; 10 mM glucose, and pH was around 7.2. The temperature of solution was

424 H. MASHIMA AND M. MATSUMMURA
regulated by the thermoelectric system (MASHIMA, 1963), in which the warming and
cooling were effected through the bottom of the bath. Stirring the solution with
bubbling air, the hunting ,of temperature was less than 0.2•Ž and the maximal rate
of temperature change was 1•Ž/min in cooling or 3•Ž/min in warming.
Monophasic action potential and twitch tension were recorded simultaneously by
the partition method (MASHIMA •• MATSUMURA, 1962).
RESULTS
1. Magnitude and rate of tension development. The muscle was stretched
to 120% of the rest length, which is the longest length without developing
any passive tension. The initial tension at 120% length was slightly decreased
when the muscle was cooled. This fact means that the coefficient of expan-
sion of resting cardiac muscle is negative. Generally, when the muscle was
driven at the rate of one shock per 10 seconds (i. e. 0.1c/sec), the cooler was
the bathing solution, the larger became the tension between 25•Ž and 8•Ž.
Within one minute of soaking in a certain temperature the tension reached
to the steady value at that temperature. This was a great advantage for
time economy in temperature experiment. When the solution was warmed
back to the previous temperature, the increased tension did not decrease to
the original value. But this hysteresis disappeared in the second or later
series of experiment involving a cycle of cooling andwarming. In FIG. 2, a
FIG. 2. The decrease in twitch tension on cooling and the increase on warm-
ing in the frog ventricle. Upper curve, temperature; lower curve, twitch tension;
The muscle was stimulated at the frequency of 0.1 c/sec.
case of tie second series of experiment is shown. The temperature coefficients
(Q10), of various mechanical parameters are summarized in TABLE 1. At the
driving rate of 0.1c/sec, the maximal tension, the maximal rate of rise of
tension or the contraction time increased by 1.8, 0.8 or 2.3 times the control
respectively for the temperature fall of 10•Ž. In other words, Q10 of them
were 0.55, 1.26 and 0.43 respectively. It is clear, however, that a more vigor-
ous response at the same temperature will show a greater ; maximal rate of
rise of tension, and it is necessary, in order to allow for alterations in the
mere size of the response, to divide the maximal rate of rise of tension by
the maximal tension. This ratio is the maximal rate of proportional rise of
tension, a quantity of dimensions minus one in time and similar to the velocity
constant of a chemical reaction (HARTREE & HILL, 1921), and the temperature
TEMPERATURE ON FROG VENTRICLE 425
TABLE 1. Temperature coefficients (Q10) of mechanical parameters in frog ventricle at the driving rate of 0.1 c/sec.
coefficient of this ratio was 1.26/0.55=2.30 for 10•Ž. The temperature coeffi-
cient of the maximal rate of proportional rise of tension should be equal to
the reciprocal temperature coefficient of the contraction time. At any rate,
it is remarkable that the tension and the duration of contraction in cardiac
muscle increase so much on cooling, while the rate of tension development is
nearly unchanged. Consequently, the contour of twitch curve increases almost
similarly by the factor of 2.3 for the cooling of 10•Ž.
Of course, the temperature coefficient depended , on the driving frequency
of contraction. For example, at 20•Ž the tension increased 2 or 3 times by
the change in frequency from 1c/60sec to 1c/2sec, but at 5•Ž it showed no
increase for the same change. In the case of spontaneously beating preparation,
the contraction increased also at low temperature, even though the frequency
of beating was reduced.
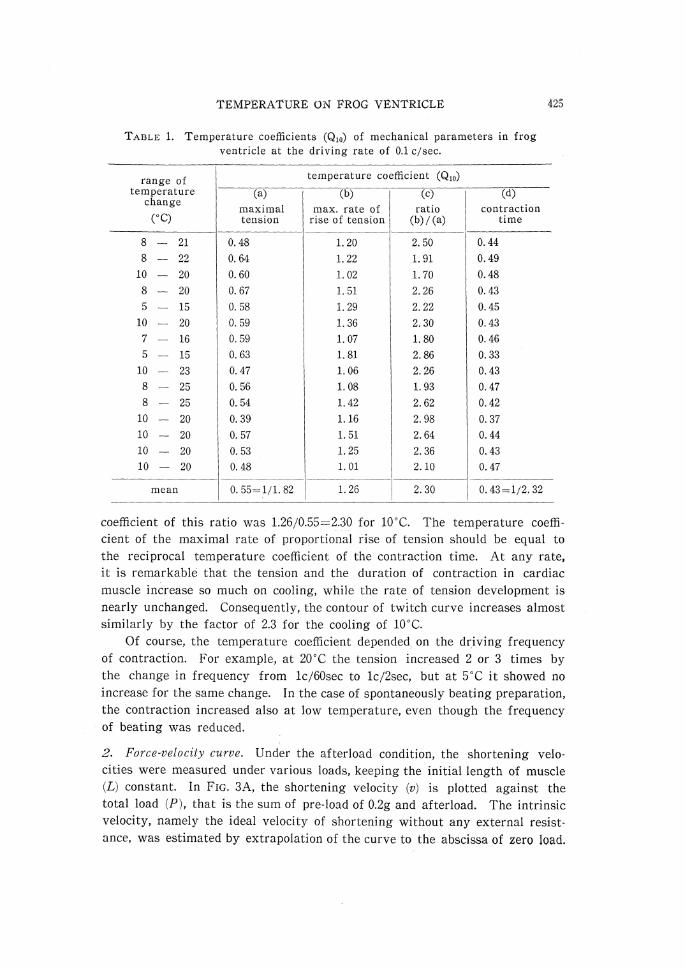
2. Force-velocity curve. Under the afterload condition, the shortening velo-
cities were measured under various loads, keeping the initial length of muscle
(L) constant. In FIG. 3A, the shortening velocity (v) is plotted against the total load (P), that is the sum of pre-load of 0.2g and afterload. The intrinsic
velocity, namely the ideal velocity of shortening without any external resist-
ance, was estimated by extrapolation of the curve to the abscissa of zero load.
426 H. MASHIMA AND M. MATSUMURA
FIG. 3. A, The force-verocity relation in the frog ventricle at 23•Ž
(open circle) and at 8•Ž (filled circle). B, (P0-P)/v was plotted against P
at 8•Ž. Pre-load, 0.2 g; initial length, 11 mm; The muscle was stimulated
at the frequency of 0.1 c/sec.
The force-velocity curve was not hyperbolic but approximately linear at
23•Ž (FIG. 3A). But when the temperature was lower than 10•Ž, the relation.
between (1/v) (P0-P) and P was quite linear (FIG. 3B), where P0 is the maxi-
mal tension in isometric contraction. Consequently, the P-v curve is hyper-
bolic, conforming to HILL'S characteristic equation (1938),
From the intercept on the abscissa and the slope of the line in FIG. 3B, the
dynamic constants were easily calculated; heat constant (a) is 1.7g, (a/P0) is
0.71, rate constant (b) is 1.67mm/sec and (L/b) is 6.55sec.
3. Intensity and duration of the active state. The active state curve was
obtained after RITCHIE'S method (1954). In FIG. 1, the inertia lever (I), loads

TEMPERATURE ON FROG VENTRICLE 427
(P1, P2) and stop (S) were removed, and the muscle was stretched to 120% length by the electromagnetic key (K). The key was suddenly released at
various instants from the stimulus during the isometric contraction by the
electronic delay circuit. Then the muscle suddenly began to shorten without
load until the lever collided with the tension recorder (G2). Afterwards the
muscle again contracted isometrically at the length slightly shorter than the initial length. The amount of shortening permitted was about 10% of the
initial length. Two serieses of seven records at different temperature are
shown in FIG. 4. At first, the initial tension does not appear in the record, but as soon as the electromagnetic key is released, previously stretched series
elastic component shortens quickly until to the length for the later isometric
contraction (110% of the rest length). Sudden rise of tension in FIG. 4 means
the passive tension at the later length, and then the redevelopment of active
tension is superimposed on it. If the muscle is released from 110% to 100%
FIG. 4. Records of quick release experiment in the frog ventricle at
25•Ž (A) and at 8•Ž (B). Time of stimulation and of release are marked.
The muscle was stimulated at the frequency of 0.1 c/sec. Time scale,
0.1 sec.
428 H. MASHIMA AND M. MATSUMURA
length as adopted by RITCHIE (1954) or ABBOTT & MOMMAERTS (1958), on such
sudden rise of tension level takes place. However, because the amount of
active tension depended largely on the muscle length, especially near the rest
length, it was considered to be better to determine the active state curve at
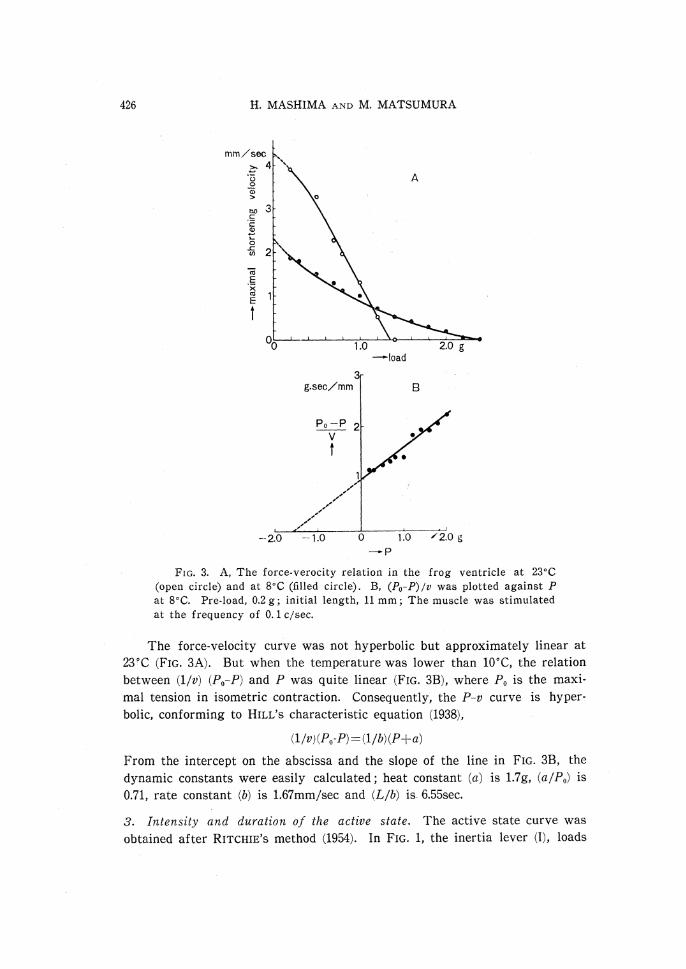
110% of the rest length. In this case, therefore, only the tension over the
passive tension level represents the redeveloped tension. Thus, the whole course of the active state was obtained as shown in FIG. 5. Full extent of the active state in FIG. 5 was estimated by the maximal tension of potassium
FIG. 5. The active state curve in the frog ventricle at 25•Ž (open
circle) and at 8•Ž (filled circle). The muscle was stimulated at the fre-
quency of 0.1 c/sec.
contracture, instead of tetanic contraction in skeletal muscle. The composition
of potassium solution was KCl, 62 mM; sucrose, 111 mM; CaCl2, 10 mM and NaHCO3, 10 mM, which can produce the maximal and sustained contracture
(LUTTGAU & NIEDERGERKE, 1958). At low temperature, the contracture tension as well as the ratio of twitch tension to contracture tension was increased,
and as for the active state curve, (i) the duration was prolonged, (ii) the rate
of decay was slowed and (iii) the intensity was increased. Q10 of the duration
of the active state is roughly 1/2.6 and that of the intensity was 1/1.5.
During the sustained potassium contracture, the muscle could develop fur-
ther tension by strong alternating current (50c/sec.) stimulation for 1 sec, the
amount of which was about 10% of the contracture tension at room temper-
ature. Similar contraction has been found by CSAPO & KURIYAMA (1962) in
the rat uterine muscle. Therefore, the full intensity of active state may be about 10% stronger than estimated from the maximal contracture tension.
4. Work done by muscle. Work (W) done during isotonic contraction, lifting
the load (P), is written,

TEMPERATURE ON FROG VENTRICLE 429
FIG. 6. The relation between the work and the load in the frog ventricle at
10•Ž (open circle) and at 20•Ž (filled circle). The initial length did not change
in A (afterload method) and changed in B. In a and c, pre-load was 0.1 g, in b
and d, pre-load was 0.3 g. The muscle was stimulated at the frequency of 0.1 c/sec .
Where, x is the amount of shortening. FIG. 6A represents the relationship
between the work and the load when the inital length is kept constant by the
afterload method, and FIG. 6B shows the same relationship when the initial
length was permitted to change by the load. From these figures it is obvious
that there are three factors for the muscle to perform the work, namely the
initial length of the muscle, the load and the temperature. The optimal load,
under which the muscle could perform the maximal work, was increased at
longer initial length and at lower temperature.
If the inertia lever (FIG. 1, I) is connected to the isotonic lever, the muscle has to shorten against the inertial resistance. In this case, the work is re-
presented as follows (MASHIMA & TANAKA, 1954),
Where, M is the equivalent mass of the inertia lever and ƒÒm is the maximal
velocity of shortening. The tension and shortening during the contraction
against inertia were recorded simultaneously. When the equivalent mass of
the lever increased, far greater tension than the load was developed in the
accelerated phase of contraction, and both the amount of shortening and the
maximal velocity decreased, while the time to peak tension was prolonged,
as shown in FIG. 7 from A to E at 24•Ž or from F to J at 10•Ž.
The relation between the maximal velocity and the equivalent mass was
expressed by a following experimental equation,

430 H. MASHIMA AND M. MATSUMUFA
FIG. 7. Simultaneous records of the tension (upper curve) and the shorten-
ing (lower curve) during the contraction with inertia lever in the frog ventricle
at 24•Ž (A-E) and at 10•Ž (F-J). Equivalent mass of the inertia lever was 0 g
in A and F, 40g in B and G, 260g in C and H, 360g in D and I, 1060g in E and
J. Load was 0.2 g. The muscle was stimulated at the frequency of 0.1 c/sec.
Time scale, 0.1 sec.
Where, A and k are constants, According to MASHIMA & TANAKA, (1954), k is
approximately 3 in frog sartorius muscle, but in frog ventricle, 3-6 was
obtained. In the case of passive shortening of a simple viscoelastic model,
k=2 would be expected. Therefore, there should be some energy liberating
mechanism to overcome the external resistance in skeletal muscle, and this
mechanism should be more effective in cardiac muscle.Measuring ƒÔ and ƒÒm, the work was calculated. Or the shortening was
recorded by the vertical axis and the tension by the horizontal axis of the
cathode ray oscilloscope, then the work was directly measured from the area
inside of the LISSAJOU'S figure during a twitch. The relation between the
work and the equivalent mass is shown in FIG. 8. Curve I is the work or the
increase in potential energy (PƒÔ), curve II is the kinetic energy given to the
inertia lever (MƒÒm2/2) and curve III is the sum of them (W). The total work
done by muscle, especially the kinetic energy, increased with the increase in
equivalent mass. It may be said that the muscle can mobilize the more me-
chanical energy by slowing of the shortening velocity, even if the resistance
to shortening increased.
At low temperature the amount of shortening, the maximal velocity and
the time to peak tension were affected little by the change in equivalent mass (FIG. 8, IV, V, VI), probably because the intrinsic velocity is sufficiently
slow.

TEMPERATURE ON FROG VENTRICLE 431
FIG. 8. The relation between the mechanical work and the equivalent mass
in the frog ventricle at 24•Ž (I, II, III) and at 10•Ž (IV, V, VI) . I or IV is the
work done for lifting the load, and II or V is the kinetic energy given to the
inertia lever. III=I+II, VI=IV+V. The muscle was stimulated at the frequency
of 0.1 c/sec.
5. Duration of action potential and contraction time . The monophasic action
potential was recorded by the partition method simultaneously with the tension
curve at various temperatures (FIG . 9). At lower temperatures, the contrac-
tion time as well as the duration of action potential was prolonged . On the
other hand, the spike height was slightly decreased . Therefore, as far as the
coupling relation between the spike height and the peak tension is concerned,
the efficiency of coupling decreased at higher temperature , as pointed out by
MASHIMA et al. (1962) in frog sartorius muscle . At the temperature lower
than 5•Ž, the cardiac muscle lost the all-or none property, the spike height
and tension increased with the strength of stimulus .
In FIG. 9A, the time of maximum in tension corresponds to the end of the
falling phase of action potential, but in FIG. 9D , it does to the beginning of
FIG. 9. Simultaneous records of the tension (lower curve) and the action po-
tential (upper curve) by the partition method in the frog ventricle. A, 20•Ž; B,
10•Ž; C, 5•Ž; D, another preparation at 15•Ž . The muscle was stimulated at the
frequency of 0.1 c/sec. Time scale, 0.1 sec .
432
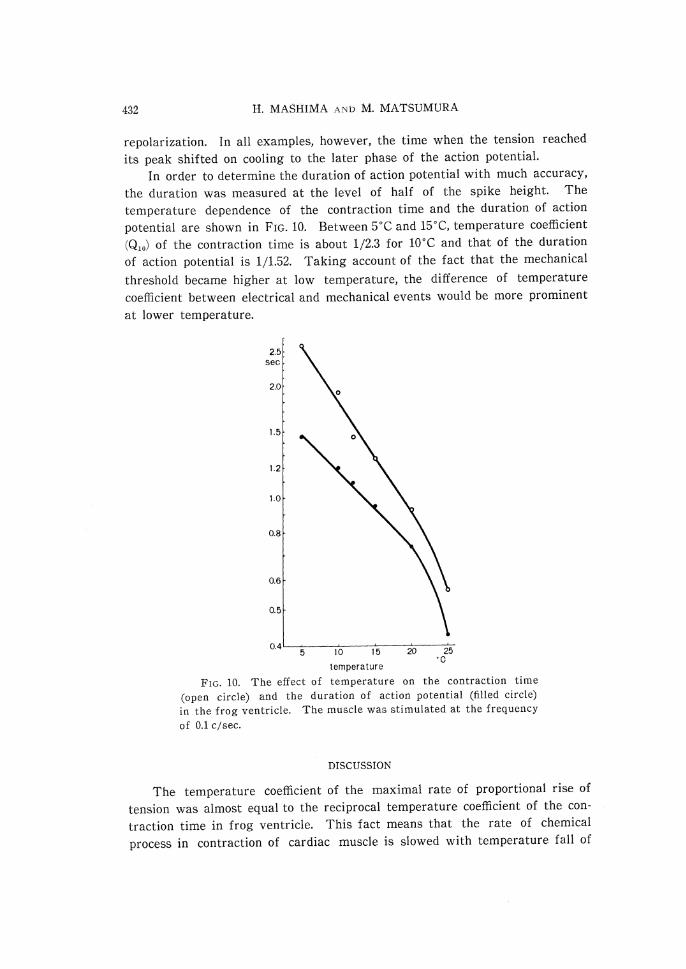
repolarization. In all examples, however, the time when the tension reached
its peak shifted on cooling to the later phase of the action potential.
In order to determine the duration of action potential with much accuracy,
the duration was measured at the level of half of the spike height. The
temperature dependence of the contraction time and the duration of action
potential are shown in FIG. 10. Between 5•Ž and 15•Ž, temperature coefficient
(Q10) of the contraction time is about 1/2.3 for 10•Ž and that of the duration
of action potential is 1/1.52. Taking account of the fact that the mechanical
threshold became higher at low temperature, the difference of temperature
coefficient between electrical and mechanical events would be more prominent
at lower temperature.
FIG. 10. The effect of temperature on the contraction time
(open circle) and the duration of action potential (filled circle) in the frog ventricle. The muscle was stimulated at the frequency of 0.1 c/sec.
DISCUSSION
The temperature coefficient of the maximal rate of proportional rise of
tension was almost equal to the reciprocal temperature coefficient of the con-
traction time in frog ventricle. This fact means that the rate of chemical
process in contraction of cardiac muscle is slowed with temperature fall of
H. MASHIMA AND M. MATSUMURA

TEMPERATURE ON FROG VENTRICLE 433
10°C by the coefficient of 2.3 but at the same time the duration of it is pro-
longed by the same coefficient. On the other hand, the following relation is
also introduced ;
(Q10 of tension) = (Q10 of rate of rise of tension) x (Q10 of contraction time)
Many investigations about the effect of change in temperature on the rate
and magnitude of tension in skeletal muscle were reviewed by WALKER (1960).
We also measured the Q10 of twitch tension in frog sartorius muscle and ob-
tained 0.85 between 15°C and 25°C (MASHiMA et al., 1962). HILL (1951) observed
a decrease in twitch tension of sartorius muscle to about a half on cooling
from 21.9°C to 0°C. Anyway, in comparison of cardiac muscle with skeletal
muscle, it is obvious that the reciprocal temperature coefficient of tension in
cardiac muscle (1/0.55=1.82) is far greater than that in skeletal muscle (for example, 1/0.85=1.17). Furthermore, in our measurement, Q10 of the maximal
rate of rise of tension was 2.0, and that of contraction time was 1/2.22 between
10°C and 20°C in frog sartorius muscle. The temperature coefficient of the
maximal rate of proportional rise of tension in skeletal muscle is 2.35 (or 2.0/
0.85), this figure well coincides with that of cardiac muscle. Also this is quite
comparable with the figure in frog sartorius muscle reported by HARTREE &
HILL (1921), that was 2.40 for 10°C. In skeletal muscle, when the temperature
decreases, the rate of tension development decreases and the contraction time increases, and as a whole the magnitude of twitch tension does not show
much change. In cardiac muscle, however, the rate of tension development
does not decrease so much as in skeletal muscle on the same temperature fall,
that is the reason why the contraction tension of cardiac muscle increases far more than that of skeletal muscle at lower temperatures. As the cause of
such a less decrease in the rate of tension development on cooling in cardiac
muscle, it is reasonable to assume the potentiation of the degree of the active
state at low temperature.
It should be reminded that the contraction of cardiac muscle depends
largely on the driving frequency. On the inotropic action, ABBOTT & MOM-
MAERTS (1958), BRADY, ABBOTT & MOMMAERTS (1960), SONNENBLICK (1962a)
and KOCH-WESER & BLINKS (1963) have investigated in detail. SONNENBLIC K
pointed out that the rate and magnitude of tension development were altered in quite different ways by the change in frequency of contraction. In our
experiments at 5°C, the maximal tension and the rate of tension development did not depend on the beating frequency. The maximal frequency where
each contraction was completely separated was 0.2c/sec at 5°C, so it was difficult to examine the effect of higher driving frequency on the temperature
coefficients of mechanical parameters.
Force-velocity relations in cat papillary muscle (SONNENBLICK, (1962a, b)
434 H. MASHIMA AND M. MATSUMURA
and in some smooth muscles (ABBOTT & Low 1958, CSAPO & GOODALL, 1954, )
were hyperbolic, conforming to HILL'S equation (1938). In frog ventricle the P-v relation was hyperbolic at 8°C but rather linear at 23°C. Probably the viscosity of sarcoplasm is so high even at higher temperature that the maxi-mal velocity of shortening under light load is limited by certain degree. The dynamic constant (a/P0) was 0.71 in frog ventricle and nearly equal to the figure in cat papillary muscle (SONNENBLICK, 1962a), but the rate constant
(L/b) was 6.55 in frog ventricle and 1.5-2.5 in cat papillary muscle. Granting the difference in temperature, and estimating Q10 of b was 2.05 (HILL, 1938) , the rate of energy release in frog heart may be fairly equal to that in mam-malian heart muscle. The value of Lib is 1.82 in frog sartorius muscle (HILL, 1938), 3.00 in frog semitendinous muscle (BUCHTHAL & KAISER 1951), and 13.7
at 37.5°C, 19.0 at 27.5°C in rabbit uterine muscle (CsAPO & GOODALL, 1954). There must be some difference in the rate of energy release between cardiac muscle and skeletal or smooth muscle, but it is necessary to consider that b is changed by the change in contractility (SONNENBLICK, (1962a).
WINEGRAD & SHANES (1962) reported that there was a close relation be-tween the strength of contraction and calcium influx. Recently, NIEDERGER K E
(1963a, b) measured the movement of 45Ca in frog ventricle and discussed the relation between twitch tension and concentration of activator calcium which was released at the inner surface of membrane during action potential. He assumed three reactions ; (i) the entry of activator Ca, (ii) the deactivation of Ca and (iii) the outflow of Ca and the rate constants of them were a, j3 and
r respectively. It was suggested that the twitch tension depends upon the level of activator Ca, which is the difference between the entry and the de-activation of activator Ca. Assuming that the rate constant a does not de-crease so much, but j3 shows much decrease on cooling, it is plausible that not only the duration of Ca-influx will be prolonged in regard to the prolonged action potential but also the amount of activator Ca will be increased by the slow deactivation, even though the absolute value of a is reduced at low temperature. It is interesting to compare this fact with the time course of active state curve (FIG. 5). If the tension depends upon the level of activator
Ca or Ca-influx, the active state curve should exactly reflex the Ca-influx curve. As to the degree of activation in cardiac muscle, NIEDERGERKE (1956 ) suggested the increase of it when raised the external calcium concentration.
ABBOTT & MOMMAERTS (1958) and TRENDELENBURG & LULLMANN (1958) re-corded the decay curve of the active state and measured the duration of it in cat papillary muscle and in frog ventricle, but did not show the whole course
of it or the intensity of active state.BLINKS & KOCH-WESER (1963) reviewed investigations on the influence of temperature on the active state and stated that many workers showed the prolongation of the active state at low temper-ature but unfortunately the change in time course of contraction or in the
TEMPERATURE ON FROG VENTRICLE 435
degree of activation had not been sufficiently elucidated. The active state curve apparently shows the increase in duration and in degree, too, at low
temperature (FIG. 5). But we could not determine whether the steady plateau
phase of the active state surely exists or not. As WEBER et al. (1963) sug-gested about the relation between the active state and Ca-actomyosin complex, the accumulated activator calcium may intensify the active state at low temper-
ature. TRENDRENBURG & LULLMANN (1958) concluded that the stretching
caused an increase in tension in the contractile system of the cardiac muscle, because the duration of the active state was unchanged. But it is likely that
the degree of activation is increased by the stretching.
The temperature coefficient (Q10) of the duration of action potential was 1/1.52, but that of active state or contraction time was 1/2.3. From this fact
it is suggested that the prolongation of action potential may result in a pro-
longation of Ca-influx or the active state but some coupling process, probably
of chemical nature with Q10 of about 2, should exist between them, this process
is the excitation-contraction coupling in real meaning. TRAUTWEN & DUDEL
(1954) described that the duration of contraction in cat papillary muscle de-
pended on the duration of action potential, and BLEICHERT & REICHEL (1962) suggested that the active state inhibited by sudden release could redevelop
as far as the depolarization continued. However, many investigators (NIE-
DERGERKE, 1956 ; KOTOWSKI et al., 1959 ; ANTONI et al., 1960 ; ENGSTFELD et al., 1961 ; WEIDMANN, 1959 ; SCHMIDT & CHANG, 1961) have pointed out that
the duration of action potential did not control the duration of contraction.
It is rather natural that the change in temperature affects the electrical
events on membrane in a different way from the chemical or mechanical
processes in the excitation-contraction coupling. According to SONNENBLICK (1962a, 1963), the work performed depended
upon the pre- and afterload in the afterload contraction. From the present
results, the velocity of shortening besides the temperature must be taken into
consideration. Under pure isotonic condition the shortening velocity depends
only on the load, which is controlled by P-v relation, but where the inertia
force exists, the muscle can mobilize more energy and perform more work in
cardiac muscle, much more effectively than MASHIMA & TANAKA (1954) and
MASHIMA & MATSUMURA (1960) pointed out in skeletal muscle. The amount
of shortening would be determined not only by the time factor from the sti-
mulus, but also by the geometrical factor in relation to the increase in length
of overlapping of myofilaments. Without this energy mobilizing mechanism
the cardiac muscle can not expel the sufficient blood against the high arterial
pressure.
436 H. MASHIMA AND M. MATSUMURA
SUMMARY
1. The effect of temperature on the mechanical properties and the action
potential of isolated frog ventricle were studied.
2. On cooling to between 25•Ž and 8•Ž, the maximal tension and the con-
traction time increased while the maximal rate of rise of tension decreased,
and the values of Q10 were 1/1.82, 1/2.32 and 1.26 respectively. The maximal
rate of proportional rise of tension, i. e. the ratio of the maximal rate of rise
of tension devided by the maximal tension, decreased on cooling, and Q10 of
it was equal to the reciprocal Q10 of the contraction time.
3. The force-velocity curve was hyperbolic at 8•Ž, but rather linear at 23•Ž.
4. Not only the duration but also the intensity of the active state increased
on cooling, and Q10 of them were about 1/2.6 and 1/1.5 respectively.
5. The work performed depended on the initial length of the muscle, the load
and the temperature. Under the condition that the muscle was encounted
by inertia force, however, more work than expected from above three factors
was performed, accompanying the slowing of contraction.
6. Q10 of the duration of action potential was 1/1.52, this is quite different
from Q10 of the contraction time or the duration of the active state.
7. The relation between the active state and calcium movement, and the
energy mobilizing mechanism in cardiac muscle were discussed.
REFERENCES
1) ABBOTT, B. C. AND MOMMAERTS, W.F. H. M. (1958) A study of inotropic mecha-nisms in the papillary muscle preparation. J. gen. Physiol. 42: 533-551.
2) ABBOTT, B. C. AND LOWY, J. (1958) Contraction of molluscan smooth muscle. J. Physiol. 141: 385-397.
3) ANTONI, H., ENGSTFELD, G. AND FLECKENSTEIN, A. (1960) Inotrope Effekte von ATP and Adrenalin am hypodynamen Froschmyokard nach electromechanischer Entkoppelung durch Ca++-Entzug. P.flug. Arch. ges. Physiol. 272: 91-106.
4) BLEICHERT, A. AND REICHEL, H. (1962) Die Hemmung der Erschlaffung beim Herzmuskel des Kalt-und Warmbluters. Pflug. Arch. ges. Physiol. 276: 242-249.
5) BLINKS, J. R. AND KOCH-WESER, J. (1963) Physical factors in the analysis of the actions of drugs on myocarial contractility. Pharmacol. Rev. 15: 531-599.
6) BRADY, A. J. ABBOTT, B. C. AND MOMMAERTS, W. F. H. M. (1960) Intropic effects of trains of impulses applied during the contraction of cardiac muscle. J. gen. Physiol. 44: 414-432.
7) BUCHTAL, F. AND KAISER, E. (1951) The rheology of the cross striated muscle fibre. Dan. Biol. Med. 21: 1-318.
8) CSAPO, A. AND GOODALL, M. (1954) Excitability, length tension relation and kinetics of uterine muscle contraction in relation to hormonal status. J. Physiol. 126: 384-395.
9) CSAPO, I. A. AND KURIYAMA, H. A. (1963) Effects of ions and drugs on cell membrane activity and tension in the postpartum rat myometrium. J. Physiol. 165: 575-592.

TEMPERATURE ON FROG VENTRICLE 437
10) ENGSTFELD, G., ANTONI, H. AND FLECKENSTEIN, A. (1961) Die Restitution der Erregungsfortleitung und Kontraktionskraft des K+-gelahmten Frosch-und Sau-getiermyokards durch Adrenalin. Pflug. Arch. ges. Physiol. 273: 145-163.
11) HARTREE, W. AND HILL, A. V. (1921) The nature of the isometric twitch. J. Physiol. 55: 389-411.
12) HILL, A.V. (1938) The heat of shortening and the dynamic constants of muscle. Proc. Roy. Soc. B126: 136-195.
13) HILL, A. V. (1951) The influence of temperature on the tension developed in an isometric twitch. Proc. Roy. Soc. B138: 349-354.
14) JEWELL, B. R. AND WILKIE, D. R. (1958) An analysis of the mechanical com-
ponents in frog's striated muscle. J. Physiol. 143: 515-543.15) KOTOWSKI, H., ANTONI, H. AND FLECKENSTEIN, A. (1959) Elektrophysiologische
Studien zur Aufhebung der Kaliumlahmung des Froschmyokards durch ATP. Pfliig. Arch. ges. Physiol. 270: 85-102.
16) KOCH-WESER, J. AND BLINKS, J. R. (1963) The influence of the interval between beats on myocardial contractility. Pharmacol. Rev. 15: 601-652.
17) LUNDIN, G. (1944) Mechanical properties of cardiac muscle . Acta. physiol. scand. 7: 1-96.
18) LUTTGAU, H. C. AND NIEDERGERKE, R. (1958) The antagonism between Ca and Na ions on the frog's heart. J. Physiol. 143: 486-505.
19) MASHIMA, H. AND TANAKA, N. (1954) Studies on the tension and shortening as well as the work done during muscle twitch and tetanus. Jap. J. Physiol. 4: 290-305.
20) MASHIMA, H. AND MATSUMURA, M. (1960) On the relation between force and shortening during muscle twitch. Jap. J. Physiol. 10: 602-609.
21) MASHIMA, H., MATSUMURA, M. AND NAKAYAMA, Y. (1962) On the coupling re-lation between action potential and mechanical response during repetitive stimu-lation in frog sartorius muscle. lap. J. Physiol. 12: 324-336.
22) MASHIMA, H. AND MATSUMURA, M. (1962) Roles of external ions in the excitation-contraction coupling of frog skeletal muscle. Jap. J. Physiol. 12: 639-653.
23) MASHIMA, H. (1963) A small thermostatic bath controlled by thermoelectric system. Juntendo Med. J. 8: 94-98. (in Japanese)
24) MOMMAERTS, W. F. H. M., ABBOTT, B. C. AND WHALEN, W. J. (1960) Selected topics on the physiology of the heart. Structure and function of muscle (ed. BOURNE, G. H.) II: 517-556. Acad Press. New York.
25) MOSTOVSKY, D. AND SANDOW, A. (1951) High output, dual pulse, electronic sti-mulator for physiologic purposes. Eledtronics. 24: 114-117.
26) NIEDERGERKE, R. (1956) The "staircase" phenomenon and the action of calcium on the heart. J. Physiol. 134: 569-583.
27) NIEDERGERKE, R. (1963a) Movements of Ca in frog heart ventricles at rest and during contractures. J. Physiol. 167: 515-550.
28) NIEDERGERKE, R. (1963b) Movements of Ca in beating ventricles of the frog heart. J. Physiol. 167: 551-580.
29) RITCHIE, J. M. (1954) The effect of nitrate on the active state of muscle. J. Physiol. 126: 155-168.
30) SCHMIDT, R. F. AND CHANG, J. J. (1961) Aktionspotential und Mechanogramm von Purkinje-Faden in tiefer Temperature. Pflug. Arch. ges. Physiol. 272: 393-399.
31) SONNENBLICK, E. H. (1962a) Implications of muscle mechanics in the heart . Fed. Proc. 21: 975-990.
32) SONNENBLICK, E. H. (1962b) Force-velocity relations in mammalian heart muscle . Amer. J. Physiol. 202: 931-939.

438 H. MASHIMA AND M. MATSUMURA
33) SONNENBLICK, E. H. AND DOWING, S. E. (1963) Afterload as a primary determi-nant of ventricular performance. Amer. J. Physiol.
34) TRAUTWEIN, W. AND DUDEL, J. (1954) Aktionspotential and Mechanogramm des Katzenpapillarmuskels als Funktions der Temperature. Pflug. Arch. ges. Physiol. 266: 104-115.
35) TRENDELENBURG, U. AND LULLMANN, H. (1958) Uber die Messung des `active state' am Herzmuskel des Frosches. Biochim. biophys. Acta. 29: 13-20.
36) WALKER, S. M. (1960) The relation of stretch and of temperature to contraction of skeletal muscle. Part II. Amer. J. Physic. Med. 39: 234-258.
37) WEBER, A., HERZ, R. AND RESISS, I. (1963) On the mechanism of the relaxing effect of fragmented sarcoplasmic reticulum. J. gen. Physiol. 46, 679-702.
38) WEIDMANN, S. (1959) Effect of increasing the calcium concentration during a single heart-beat. Experientia. 15: 128-130.
39) WINEGRAD, S. AND SHANES, A. M. (1962) Calcium flux and contractility in guinea
pig atria. J. gen. Physiol. 45: 371-394.