Effect of different stocking density on growth, survival ...
This paper should be cited as: Herrera, L. C. 2015. The effect of stocking density on growth rate, survival and yield of GIFT tilapia (Oreochromis niloticus) in Cuba: case study fish farm La Juventud. United Nations University Fisheries Training Programme, Iceland [final project].http://www.unuftp.is/static/fellows/document/lesvia14prf.pdf
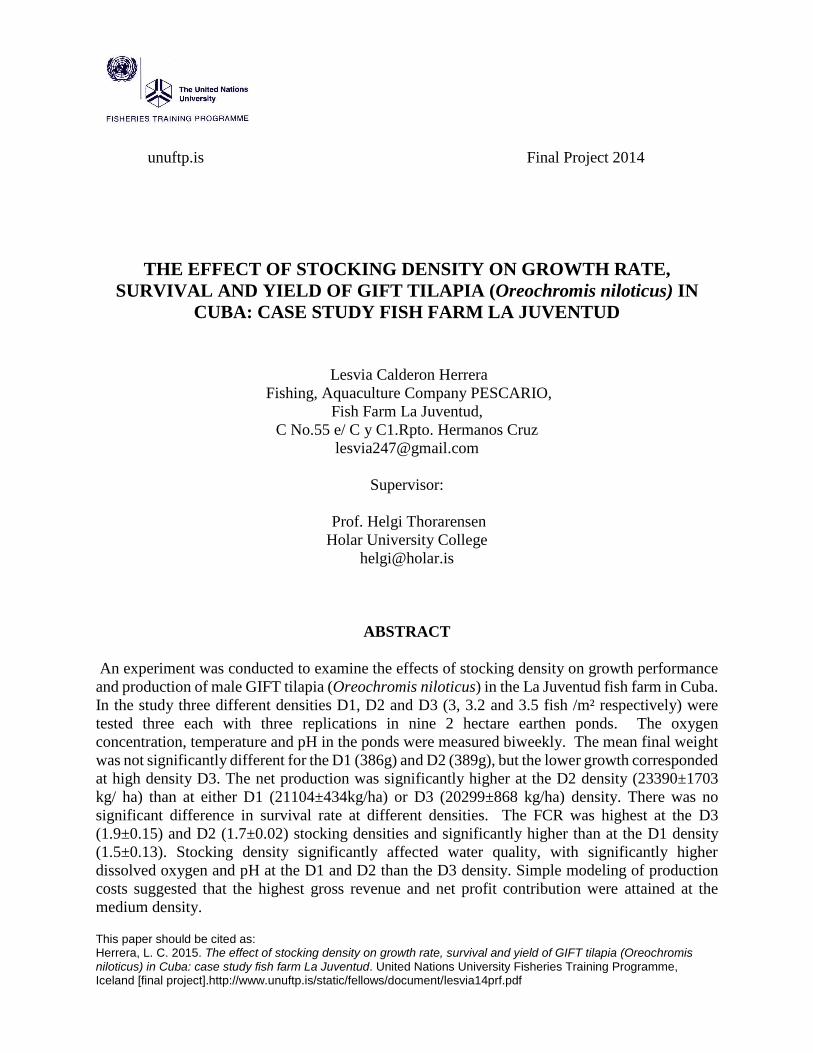
unuftp.is Final Project 2014
THE EFFECT OF STOCKING DENSITY ON GROWTH RATE,
SURVIVAL AND YIELD OF GIFT TILAPIA (Oreochromis niloticus) IN
CUBA: CASE STUDY FISH FARM LA JUVENTUD
Lesvia Calderon Herrera
Fishing, Aquaculture Company PESCARIO,
Fish Farm La Juventud,
C No.55 e/ C y C1.Rpto. Hermanos Cruz
Supervisor:
Prof. Helgi Thorarensen
Holar University College
ABSTRACT
An experiment was conducted to examine the effects of stocking density on growth performance
and production of male GIFT tilapia (Oreochromis niloticus) in the La Juventud fish farm in Cuba.
In the study three different densities D1, D2 and D3 (3, 3.2 and 3.5 fish /m² respectively) were
tested three each with three replications in nine 2 hectare earthen ponds. The oxygen
concentration, temperature and pH in the ponds were measured biweekly. The mean final weight
was not significantly different for the D1 (386g) and D2 (389g), but the lower growth corresponded
at high density D3. The net production was significantly higher at the D2 density (23390±1703
kg/ ha) than at either D1 (21104±434kg/ha) or D3 (20299±868 kg/ha) density. There was no
significant difference in survival rate at different densities. The FCR was highest at the D3
(1.9±0.15) and D2 (1.7±0.02) stocking densities and significantly higher than at the D1 density
(1.5±0.13). Stocking density significantly affected water quality, with significantly higher
dissolved oxygen and pH at the D1 and D2 than the D3 density. Simple modeling of production
costs suggested that the highest gross revenue and net profit contribution were attained at the
medium density.
Herrera
UNU Fisheries Training Programme
2
TABLE OF CONTENTS
1. INTRODUCTION ................................................................................................................. 5
1.1 Global tilapia production ................................................................................................ 5 1.2 Aquaculture in Cuba. ...................................................................................................... 6
1.2.1 Tilapia production in Cuba. ........................................................................................ 7 1.2.2 Aquaculture in Pinar Del Rio and challenges in production....................................... 8
2 OBJECTIVES ........................................................................................................................ 9 3 LITERATURE REVIEW ................................................................................................... 10
3.1 Stocking Density ........................................................................................................... 10 3.2 Water Quality ................................................................................................................ 13
3.2.1 Dissolved Oxygen Concentration ............................................................................. 13 3.2.2 pH .............................................................................................................................. 13 3.2.3 Ammonia................................................................................................................... 13
3.3 Health of tilapia............................................................................................................. 13 3.4 Behavior ........................................................................................................................ 14 3.5 Survival ......................................................................................................................... 14
4 MATERIAL AND METHODS. ......................................................................................... 14 4.1 Experiment design ........................................................................................................ 14 4.2 Feed ............................................................................................................................... 15 4.3 Samples ......................................................................................................................... 16 4.4 Measurement water quality ........................................................................................... 16 4.5 Harvest and growth performance .................................................................................. 16 4.6 Simple economy analysis .............................................................................................. 16 4.7 Data analysis ................................................................................................................. 17
5 RESULTS ............................................................................................................................. 17 5.1 Growth and survival ...................................................................................................... 17 5.2 Food Conversion Ratio ................................................................................................. 18 5.3 Yield .............................................................................................................................. 19 5.4 Water quality ................................................................................................................. 19
6 DISCUSSION ....................................................................................................................... 22 7 CONCLUSION AND RECOMEMDATIONS ................................................................. 23 ACKNOWLEDGEMENTS ....................................................................................................... 24 LIST OF REFERENCES ........................................................................................................... 25 APPENDIX .................................................................................................................................. 29
Herrera
UNU Fisheries Training Programme
3
LIST OF FIGURES
Figure 1: Global Tilapia production 2006-2012. Source: FAO Yearbook, 2012. .......................... 5 Figure 2: Tilapia Production in Cuba. Source GEIA Statistic (2008-2015) ................................... 7 Figure 3: Actions for enhancing Tilapia culture in Fish Farm La Juventud. .................................. 9 Figure 4: Relation between Stoking density and yield. ................................................................ 10 Figure 5: Influence of stocking density on the cultivation ........................................................... 11
Figure 6 : Means fish weight and standard deviation during the GIFT tilapia culture experiment.
Different letter indicate significant differences between densities at the same time. ................... 17 Figure 7: FCR per density ............................................................................................................. 18 Figure 8: Yield per treatment for GIFT tilapia culture. Different letter indicate significant
differences, Holm-Sidak method with p<0.05. ............................................................................. 19
Figure 9: Mean pH at different densities during the experiment. ................................................. 21
Herrera
UNU Fisheries Training Programme
4
LIST OF TABLES
Table 1: Aquaculture production in Cuba 2010 ............................................................................. 6 Table 2: Summarized results of studies on the effect of stocking density of male tilapia in some
system ........................................................................................................................................... 12 Table 4: Stocking density per treatment ....................................................................................... 15 Table 5: Composition of foodstuff for tilapia in Cuba ................................................................. 15
Table 6: Daily feeding rate as % of biomass ................................................................................ 16 Table 7: Mean size and growth performance at different densities. Mean identified by different
superscripts are significantly different. ......................................................................................... 18 Table 8 : Mean and Standard deviation per treatment .................................................................. 18 Table 9: Mean and standards deviation for water quality parameter ............................................ 20
Table 10: Economy Analysis. (CUP=Cuban peso is the currency in Cuba) ................................ 21
Herrera
UNU Fisheries Training Programme
5
1. INTRODUCTION
Hunger and malnutrition are the great scourges of humanity. At present, 30% of people in the
poorest countries suffer from hunger and this problem is aggravated by population growth and
uneven distribution of recourses between countries. The growth of aquaculture in developing
countries, can increase food production, make better use of natural resources and contribute to
poverty alleviation. (ODELPESCA, 2009). Cuba, a developing country, tries to provide healthy
food to the population and increase the per capita fish consumption. Aquaculture is growing in
Cuba and it is seen as an important contribution to ensure food security.
Tilapia is one of the most important species in a global aquaculture and is the third largest in
volume only after carp and catfish. (FAO, 2014). World production of tilapia is growing rapidly.
Tilapia are well suited for aquaculture. They can tolerate high density, their growth is better than
other species in intensive farming systems, the flesh is of excellent quality and has good market
acceptance (Toledo-Perez & Garcia Capote, 1998).
1.1 Global tilapia production
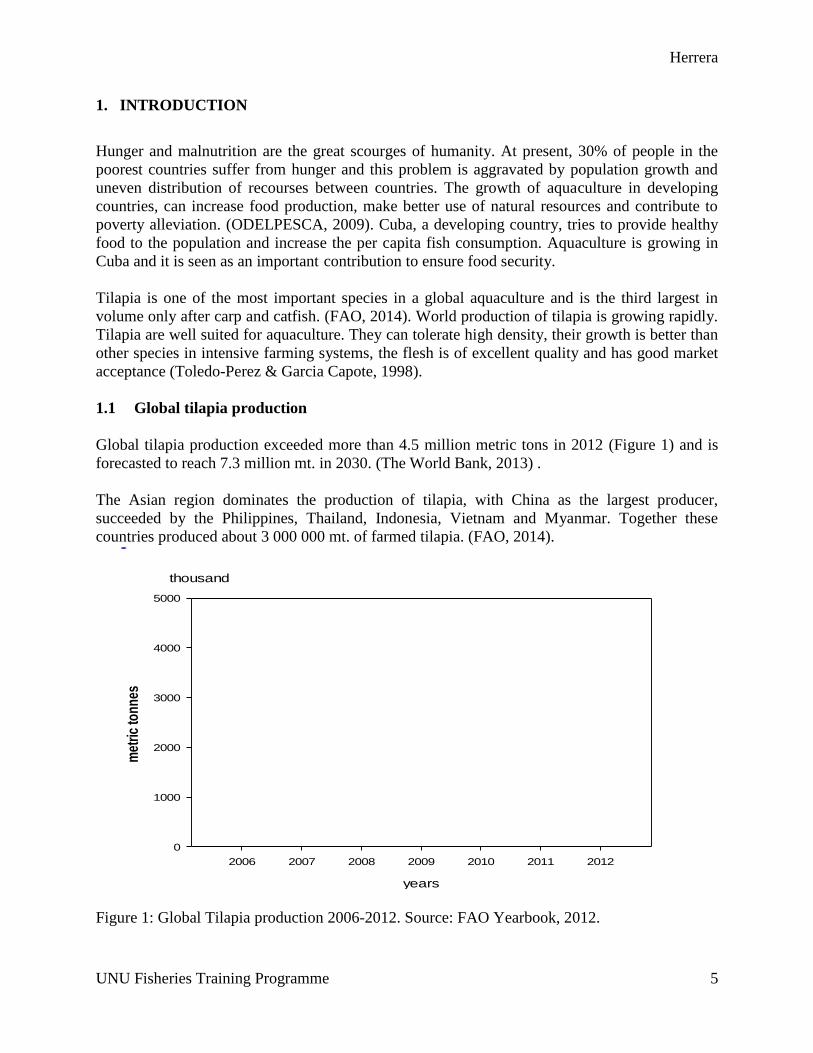
Global tilapia production exceeded more than 4.5 million metric tons in 2012 (Figure 1) and is
forecasted to reach 7.3 million mt. in 2030. (The World Bank, 2013) .
The Asian region dominates the production of tilapia, with China as the largest producer,
succeeded by the Philippines, Thailand, Indonesia, Vietnam and Myanmar. Together these
countries produced about 3 000 000 mt. of farmed tilapia. (FAO, 2014).
years
2006 2007 2008 2009 2010 2011 2012
met
ric
ton
nes
0
1000
2000
3000
4000
5000
thousand
Figure 1: Global Tilapia production 2006-2012. Source: FAO Yearbook, 2012.
Herrera
UNU Fisheries Training Programme
6
Conditions for growing tilapia are good in Latin America. Brazil has abundant resources of water
and land. The Brazilian government has passed legislation that encourages the cultivation in cages
located in reservoirs. The production in 2010 was close to 200,000 mt of Nile tilapia (Brasil, 2014).
Mexico, another large producer of tilapia, produced about 76,000 in 2011 mt. Colombia, Ecuador,
Costa Rica and Cuba also contribute to tilapia production in the area.
1.2 Aquaculture in Cuba.
Aquaculture in Cuba is performed by state companies. The government controls the production
through the ministry of the food industry and fishing. The fisheries division GEIA has 15
provincial companies. These companies are responsible for the implementation of the aquaculture
development plan in every territory. Permanent access to the seed is guaranteed by the provincial
companies that operate the fingerling stations, with a production capacity of 50 million juveniles
per year.
The government plan for aquaculture emphasizes the sustainable exploitation of resources.
Moreover, the objectives of aquaculture plan in Cuba are:
• Provide the domestic market the adequate supply of fish.
• To adopt procedures and standards in aquaculture that ensure the quality and safety of
products.
• To promote research and development for the cultivation of exotic species in Cuba, with
the aim of increasing production. However, increased production efficiency should not
have excessive environmental impact.
Freshwater aquaculture in Cuba uses more than 1400 hectares of ponds for extensive system,
where Cyprinids and tilapia are cultured using the natural food available such as phytoplankton
and zooplankton. Intensive farming is practiced in about 130, 000 hectares of ponds and cages
located in reservoir. In ponds and cages, the fish are fed with commercial feeds to facilitate
increased production.
In 2010, Cuban aquaculture produced (Table 1) around 31,000 mt of aquatic organisms, of which
85% originated from freshwater, 10 % from brackish water and 5 % from marine culture
(OLDEPESCA, 2012).
Table 1: Aquaculture production in Cuba 2010.
Environment Production(mt) Main species
Freshwater 26 350 Silver carp
Brackish water 3 100 Shrimp
Marine 1 550 Mangrove oyster
Total 31000

Herrera
UNU Fisheries Training Programme
7
1.2.1 Tilapia production in Cuba.
In Cuba, the average temperature is between 26 and 27C°, with maximum between 36°C and 38°C.
This is a favorable climate and with a large volume of freshwater provides suitable conditions for
tilapia culture. The species Oreochromis niloticus, Oreochromis aureus and Oreochromis
mossambicus were introduce in Cuba from 1980-1999. All these species have aquaculture
potential, but the Nile Tilapia O. niloticus is the most common in tilapia farming in the country.
In 2004, the World Fish Center obtained GIFT (Genetically –improved tilapia farming) Nile tilapia
strain, a strain selected for improved growth and production characteristics. In 2007, a breeding
program was started in Cuba with 12 groups of Tilapia nilotica GIFT from Brazil, Thailand and
Vietnam. The breeding program was located in the Cuban Aquaculture Research Center (EDTA).
The primary breeding objectives were large size, high yield and more efficiency food utilization
in intensive systems (Damas, 2012). Presently fish of the GIFT strain are reared in ponds and net
cages around the country.
The EDTA provides broodstock for fingerling stations that then produce juveniles for different
fish farms. The larvae are produced in cement ponds. The juveniles are then cultured for 45 days
in earthen ponds until they reach 10 grams, after that they are transferred to on-growing ponds or
cage locate in dams for intensive culture. The introduction of the GIFT strain has greatly increased
tilapia production in Cuba. From 2009-2014, tilapia production increased from 800 mt up to 2300
mt (Figure 2) in Cuba. In 2014, half of the tilapia were produced in extensive systems while the
rest was produced in net cages and ponds (GEIA, 2015).
Figure 2: Tilapia Production in Cuba. Source GEIA Statistic (2008-2015).
Herrera
UNU Fisheries Training Programme
8
1.2.2 Aquaculture in Pinar Del Rio and challenges in production.
Early maturation causes stunts in the growth of female tilapia since the females do not feed while
they are incubating the eggs. Hence, in mixed populations there is great disparity in the sizes of
harvested fish. The presence of female tilapia in ponds causes uncontrolled reproduction, excessive
amount of fingerlings and retarded growth of the entire fish population with poor feed conversion
rate (Kubitza, 2013). However, this problem can be avoided in all male populations. It is possible
to creating all male populations by exposing the fish to 17α metyltestosterone MT at first feeding.
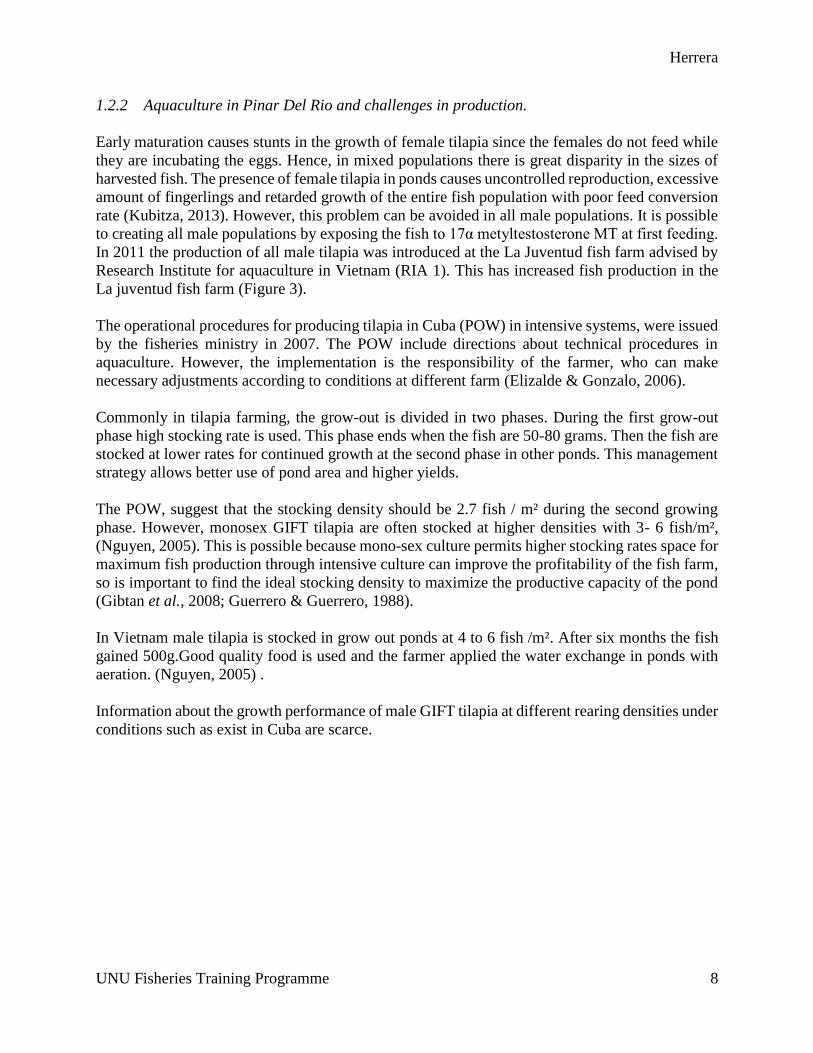
In 2011 the production of all male tilapia was introduced at the La Juventud fish farm advised by
Research Institute for aquaculture in Vietnam (RIA 1). This has increased fish production in the
La juventud fish farm (Figure 3).
The operational procedures for producing tilapia in Cuba (POW) in intensive systems, were issued
by the fisheries ministry in 2007. The POW include directions about technical procedures in
aquaculture. However, the implementation is the responsibility of the farmer, who can make
necessary adjustments according to conditions at different farm (Elizalde & Gonzalo, 2006).
Commonly in tilapia farming, the grow-out is divided in two phases. During the first grow-out
phase high stocking rate is used. This phase ends when the fish are 50-80 grams. Then the fish are
stocked at lower rates for continued growth at the second phase in other ponds. This management
strategy allows better use of pond area and higher yields.
The POW, suggest that the stocking density should be 2.7 fish / m² during the second growing
phase. However, monosex GIFT tilapia are often stocked at higher densities with 3- 6 fish/m²,
(Nguyen, 2005). This is possible because mono-sex culture permits higher stocking rates space for
maximum fish production through intensive culture can improve the profitability of the fish farm,
so is important to find the ideal stocking density to maximize the productive capacity of the pond
(Gibtan et al., 2008; Guerrero & Guerrero, 1988).
In Vietnam male tilapia is stocked in grow out ponds at 4 to 6 fish /m². After six months the fish
gained 500g.Good quality food is used and the farmer applied the water exchange in ponds with
aeration. (Nguyen, 2005) .
Information about the growth performance of male GIFT tilapia at different rearing densities under
conditions such as exist in Cuba are scarce.
Herrera
UNU Fisheries Training Programme
9
Figure 3: Actions for enhancing Tilapia culture in Fish Farm La Juventud.
2 OBJECTIVES
Information about the growth performance of male GIFT tilapia at different rearing densities under
in Cuba are scarce.
Therefore, the main objective of this study was to examine the effects of stocking density on tilapia
production parameters. Furthermore, the study attempted to identify which factors determine the
relationship between stocking density and production. Specific objectives were to:
• Determine the optimal stocking density of tilapia in ponds for La juventud fish farm.
• Assess the effect of stocking density on oxygen levels and pH in the rearing.
• Make recommendations to the GEIA about changes in the POW regarding stocking density
in tilapia aquaculture.
Herrera
UNU Fisheries Training Programme
10
3 LITERATURE REVIEW
3.1 Stocking Density
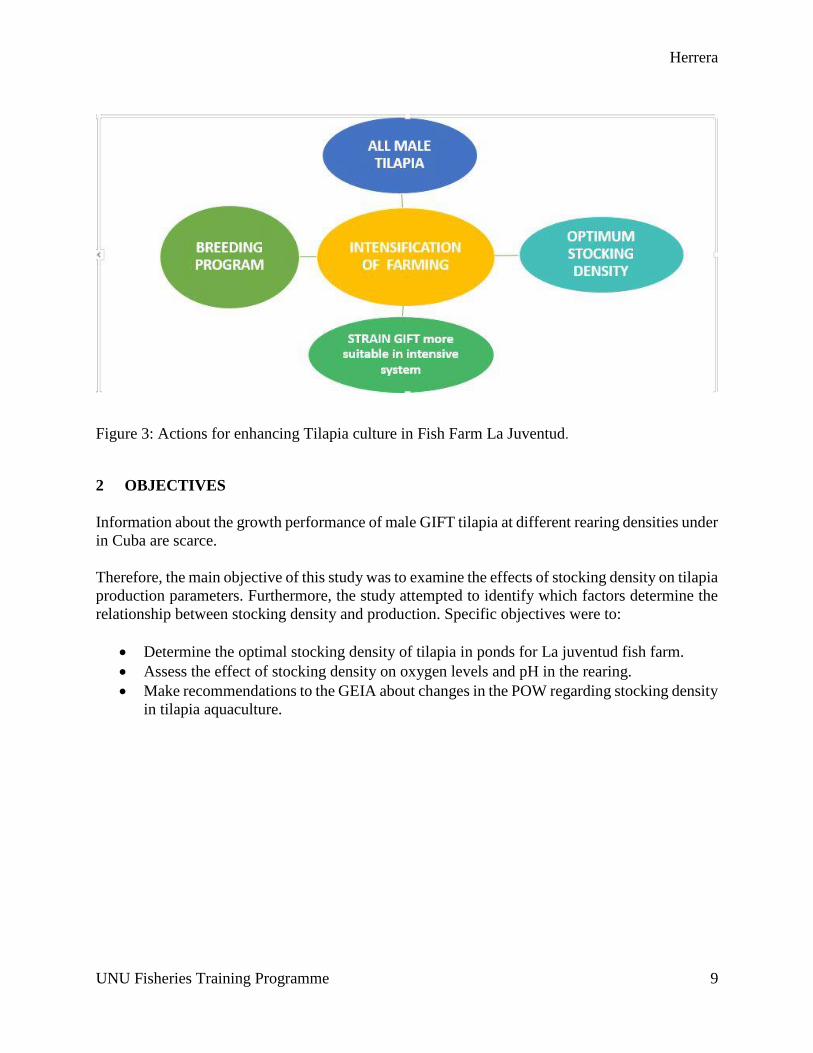
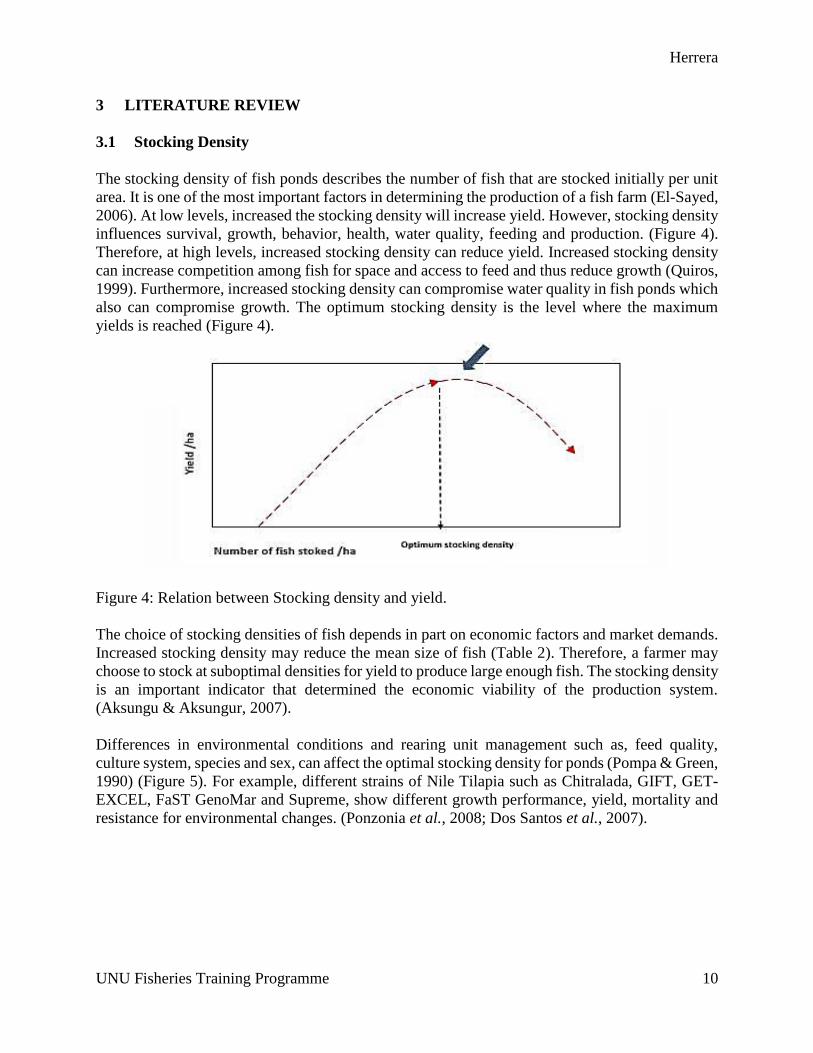
The stocking density of fish ponds describes the number of fish that are stocked initially per unit
area. It is one of the most important factors in determining the production of a fish farm (El-Sayed,
2006). At low levels, increased the stocking density will increase yield. However, stocking density
influences survival, growth, behavior, health, water quality, feeding and production. (Figure 4).
Therefore, at high levels, increased stocking density can reduce yield. Increased stocking density
can increase competition among fish for space and access to feed and thus reduce growth (Quiros,
1999). Furthermore, increased stocking density can compromise water quality in fish ponds which
also can compromise growth. The optimum stocking density is the level where the maximum
yields is reached (Figure 4).
Figure 4: Relation between Stocking density and yield.
The choice of stocking densities of fish depends in part on economic factors and market demands.
Increased stocking density may reduce the mean size of fish (Table 2). Therefore, a farmer may
choose to stock at suboptimal densities for yield to produce large enough fish. The stocking density
is an important indicator that determined the economic viability of the production system.
(Aksungu & Aksungur, 2007).
Differences in environmental conditions and rearing unit management such as, feed quality,
culture system, species and sex, can affect the optimal stocking density for ponds (Pompa & Green,
1990) (Figure 5). For example, different strains of Nile Tilapia such as Chitralada, GIFT, GET-
EXCEL, FaST GenoMar and Supreme, show different growth performance, yield, mortality and
resistance for environmental changes. (Ponzonia et al., 2008; Dos Santos et al., 2007).
Herrera
UNU Fisheries Training Programme
11
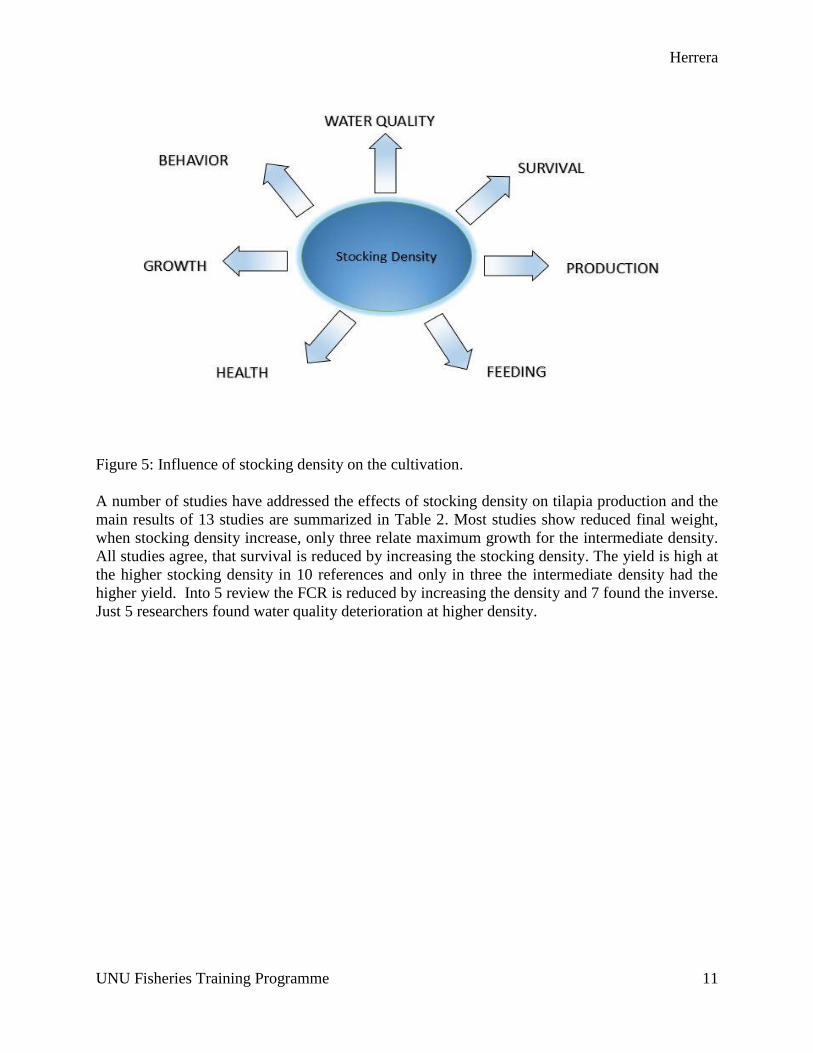
Figure 5: Influence of stocking density on the cultivation.
A number of studies have addressed the effects of stocking density on tilapia production and the
main results of 13 studies are summarized in Table 2. Most studies show reduced final weight,
when stocking density increase, only three relate maximum growth for the intermediate density.
All studies agree, that survival is reduced by increasing the stocking density. The yield is high at
the higher stocking density in 10 references and only in three the intermediate density had the
higher yield. Into 5 review the FCR is reduced by increasing the density and 7 found the inverse.
Just 5 researchers found water quality deterioration at higher density.

Herrera
UNU Fisheries Training Programme
12
Table 2: Summarized results of studies on the effect of stocking density of male tilapia in some
system. References Densities(fish/m²) Mean Final
weight
Survival FCR Yield Water Quality
Kapinga et al., 2014 3, 13 ↓ ↓ ↓ ↑ ↓ DO and pH↓
Chakraborty &
Banerjee, 2010
0.5 ,1, 1.5 ,2, 2.5 ,3 ↑↓ ↓
↑↓ ↔
Ribeiro & Garcia ,
2009
2, 4, 6, 8 ↓ ↓ ↑ ↑
Ronald et al., 2014 1000, 1330, 2000,
2670, 4000 and 5330
fry/m³
↓ ↓ ↑ ↓
Gullian-Klanian &
Arámburu-Adame,
2013
400, 500, 600 fish/m³ ↓ ↓ ↓ ↓ ↓DO ↓NH3
Chakraborty &
Banerjee, 2012
1, 5, 10, 15, 25, 50, 75,
100fish/m³
↑↓ ↓ ↓ ↓ ↔
Daudpota &
Kalhoro, 2014
200, 250. 300
fish/hapa
↓ ↓ ↑ ↓ ↔
Diana et al., 1994 3,6,9 fish/ m³ ↑↓ ↓ ↓ ↑↓ ↓ DO
Garcia, 2009 2. 4. 6. 8 fish/ m³ ↓ ↓ ↑ ↑ ↓ DO
De Castro Oliveira,
2010
90, 120, 150 fish/m³ ↓ ↓ ↓ ↑ ↔
Osofero & Otubusin
, 2009
50, 100, 150, 200
fish/m³
↓ ↓ ↑ ↑
Ammar, 2009 1.2, 1.6 , 2.1 fish/m² ↓ ↓ ↑ ↑↓ ↔
Garcia et al., 2013 133, 333, 416, 500
fish/m³,
↓ ↓ ↑ ↑ ↓DO,↑NH3 and
↑NO2
(↓) Negative relation the value decrease as density increase. (↑↓) result at intermedia density. (↑)
Positive relation the value increase as density increase. (↔) no influence of stocking density in
water quality. The arrows indicate changes in water quality.
Herrera
UNU Fisheries Training Programme
13
3.2 Water Quality
Water quality is an important factor in aquaculture and can affect the production. With increased
fish density water quality is often compromised.
3.2.1 Dissolved Oxygen Concentration
Low concentrations of dissolved oxygen (DO) in water can compromise growth, cause stress,
increase disease susceptibility, reduce appetite and increase mortality in fish. (Bhujel, 2013). From
fish such as feces and uneaten feed promote a bacteria and phytoplankton growth. During the day
the algae produce high oxygen concentration through photosynthesis, but high amounts of oxygen
are consumed in the night for algae, fish and microorganism in the ponds, causing anoxic and poor
water quality (Chang & Ouyang, 1988).
It is possible to increase the DO levels by aerating the ponds. Studies on Nile tilapia suggest that
it grows better when aerators are used to maintain adequate DO levels compared with fish reared
in un-aerated ponds (Macintosh and Little, 1995). When stocking density increases, it is of primary
importance to have a secure water supply for to maintain good water quality. Low dissolved
oxygen concentration in ponds can improved by a combination of aeration and increased water
exchange. (Green et al., 1993)
Moreover, water exchange is important for removing from ponds suspended solids, toxic
metabolic wastes from fish (Chorm & Webster, 2006). Studies have indicated that fish growth is
highest when water is continuously exchanged in ponds. (Aquaculture SA, 2003)
3.2.2 pH
The pH in fish ponds fluctuates depending on the CO2 levels in water. Fish and other organism
excrete CO2 as product of metabolism. During the day, algae and plants remove CO2 from water
through photosynthesis and then the pH rises. At night when the photosynthesis stops the CO2
levels increase again and pH is reduced. This cycle is repeated every 24 hours. Fluctuations in
CO2 concentration and pH tends to increase with increasing biomass of fish (Tucker & D’Abramo,
2008).
3.2.3 Ammonia
Too high ammonia levels can cause stress and damages to gills and other tissues. Fish exposed to
low levels of ammonia over time are more susceptible to bacterial infections, have poor growth,
and will not tolerate routine handling. At high density the concentration of ammonia is increased
(Floyd & Watson, 2012).
3.3 Health of tilapia
High density may cause stress in fish which in turn may suppress immune function in fish and
make them more vulnerable to disease. Fin damage is another result of too high density. For

Herrera
UNU Fisheries Training Programme
14
example, streptococci in tilapia first appeared in Cuba in cage farming where fish density is high.
(Silveira, 2010).
3.4 Behavior
High stocking density will increase social interactions among fish, and dominance hierarchies may
be formed (Barcellos & Nikolaieswky, 1999). Dominant individuals may restrict the access of
subordinate individuals to resources such as food and territory. At optimum stocking density,
aggressiveness is reduced and instead energy can be channel to growth. (Schwedler & Johson,
2000).
3.5 Survival
The cannibalism is more common in larvae and juveniles of tilapia. This phenomenon is
associated with large size variation, high population densities and limited food availability.
Heterogeneous sizes, lead often social dominance, resulting in cannibalism. So stock tilapia with
uniform sizes into the pond, may avoid this problem. (Smith & Reay, 1991). Also poor handling,
stress and severe competition for food and space resulted in lower survival rates (Aurbun
University, 2003).
4 MATERIAL AND METHODS.
4.1 Experiment design
The experiment was performed in La Juventud fish farm, in the municipality of Los Palacios, Pinar
del Rio province in Cuba (Figure 6). Nine 2 hectare ponds with 1.2 average depth were used in
the study. Before the experiment began, the ponds were dried and quicklime (1mt/ha) was applied
to eliminate parasites, bacteria and other unwanted organisms. Inorganic fertilizers (120 kg/ ha of
ammonium nitrate and 22 kg/ha triple superphosphate), were applied to the ponds while the fish
were small (10-50g) to promote plankton growth
Figure 6: Fish Farm La Juventud.
Herrera
UNU Fisheries Training Programme
15
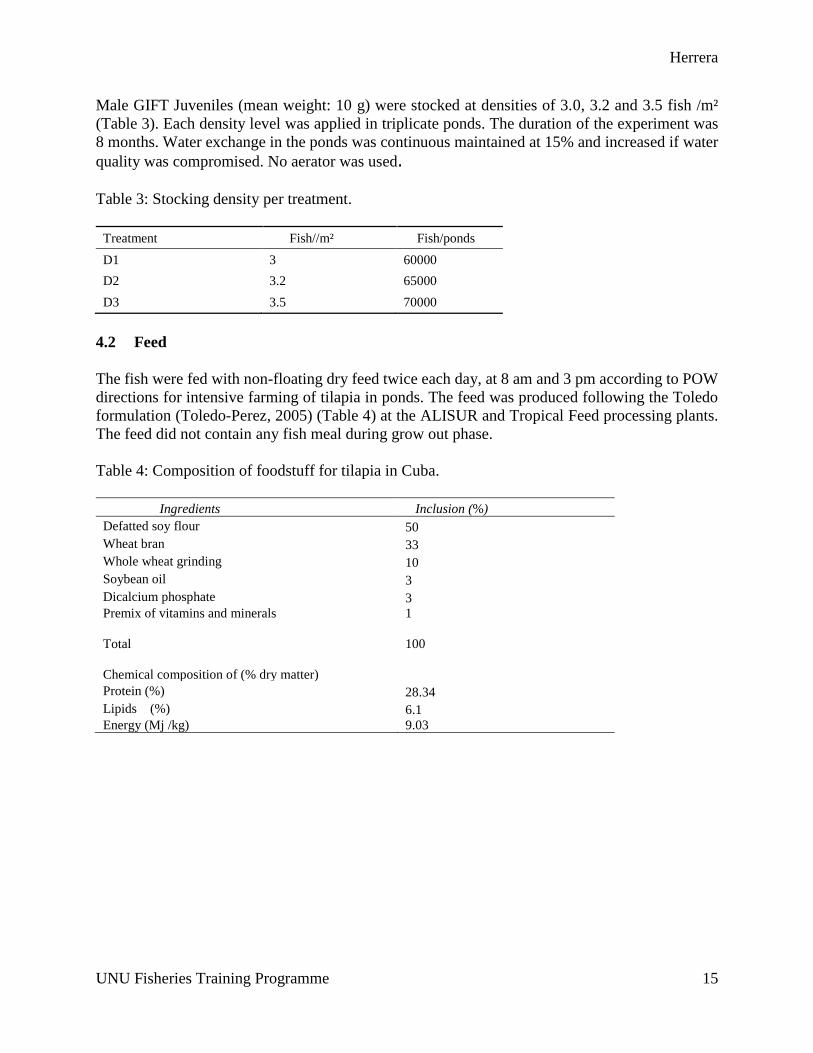
Male GIFT Juveniles (mean weight: 10 g) were stocked at densities of 3.0, 3.2 and 3.5 fish /m²
(Table 3). Each density level was applied in triplicate ponds. The duration of the experiment was
8 months. Water exchange in the ponds was continuous maintained at 15% and increased if water
quality was compromised. No aerator was used. Table 3: Stocking density per treatment.
Treatment Fish//m² Fish/ponds
D1 3 60000
D2 3.2 65000
D3 3.5 70000
4.2 Feed
The fish were fed with non-floating dry feed twice each day, at 8 am and 3 pm according to POW
directions for intensive farming of tilapia in ponds. The feed was produced following the Toledo
formulation (Toledo-Perez, 2005) (Table 4) at the ALISUR and Tropical Feed processing plants.
The feed did not contain any fish meal during grow out phase.
Table 4: Composition of foodstuff for tilapia in Cuba.
Ingredients Inclusion (%)
Defatted soy flour 50
Wheat bran 33
Whole wheat grinding 10
Soybean oil 3
Dicalcium phosphate 3
Premix of vitamins and minerals
Total
1
100
Chemical composition of (% dry matter) Protein (%) 28.34
Lipids (%) 6.1
Energy (Mj /kg) 9.03
Herrera
UNU Fisheries Training Programme
16
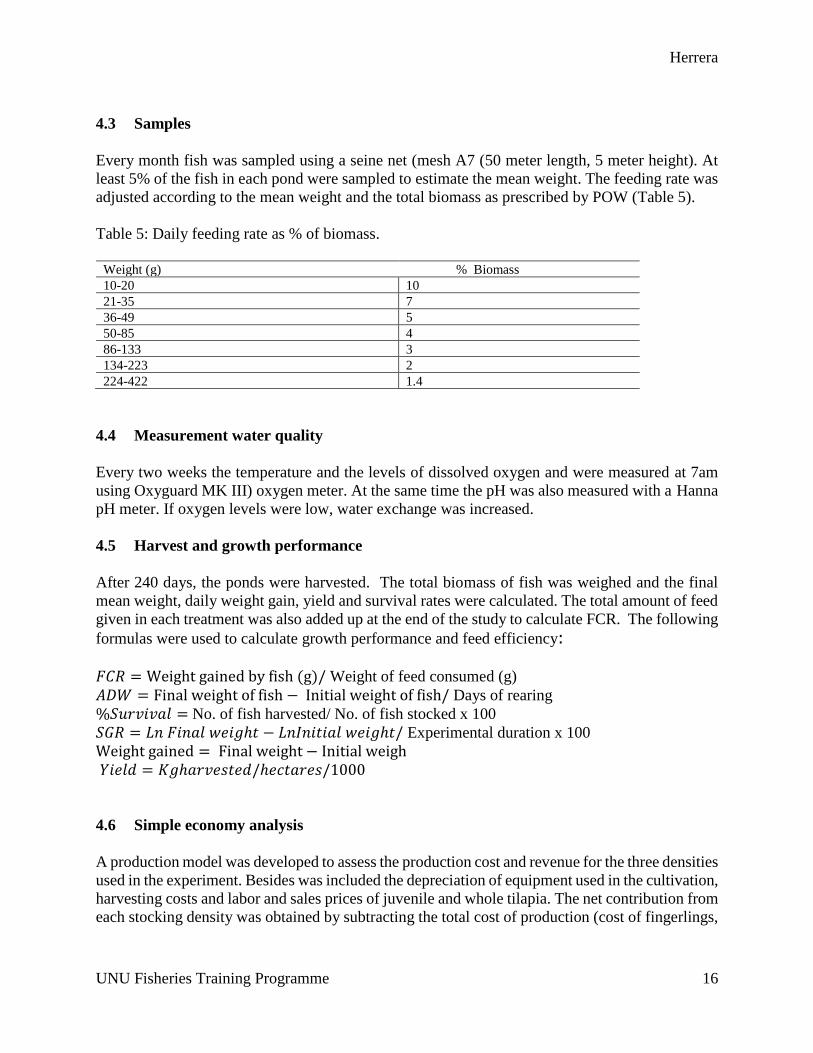
4.3 Samples
Every month fish was sampled using a seine net (mesh A7 (50 meter length, 5 meter height). At
least 5% of the fish in each pond were sampled to estimate the mean weight. The feeding rate was
adjusted according to the mean weight and the total biomass as prescribed by POW (Table 5).
Table 5: Daily feeding rate as % of biomass.
Weight (g) % Biomass
10-20 10
21-35 7
36-49 5
50-85 4
86-133 3
134-223 2
224-422 1.4
4.4 Measurement water quality
Every two weeks the temperature and the levels of dissolved oxygen and were measured at 7am
using Oxyguard MK III) oxygen meter. At the same time the pH was also measured with a Hanna
pH meter. If oxygen levels were low, water exchange was increased.
4.5 Harvest and growth performance
After 240 days, the ponds were harvested. The total biomass of fish was weighed and the final
mean weight, daily weight gain, yield and survival rates were calculated. The total amount of feed
given in each treatment was also added up at the end of the study to calculate FCR. The following
formulas were used to calculate growth performance and feed efficiency: 𝐹𝐶𝑅 = Weight gained by fish (g)/ Weight of feed consumed (g)
𝐴𝐷𝑊 = Final weight of fish − Initial weight of fish/ Days of rearing
%𝑆𝑢𝑟𝑣𝑖𝑣𝑎𝑙 = No. of fish harvested/ No. of fish stocked x 100
𝑆𝐺𝑅 = 𝐿𝑛 𝐹𝑖𝑛𝑎𝑙 𝑤𝑒𝑖𝑔ℎ𝑡 − 𝐿𝑛𝐼𝑛𝑖𝑡𝑖𝑎𝑙 𝑤𝑒𝑖𝑔ℎ𝑡/ Experimental duration x 100 Weight gained = Final weight − Initial weigh 𝑌𝑖𝑒𝑙𝑑 = 𝐾𝑔ℎ𝑎𝑟𝑣𝑒𝑠𝑡𝑒𝑑/ℎ𝑒𝑐𝑡𝑎𝑟𝑒𝑠/1000
4.6 Simple economy analysis
A production model was developed to assess the production cost and revenue for the three densities
used in the experiment. Besides was included the depreciation of equipment used in the cultivation,
harvesting costs and labor and sales prices of juvenile and whole tilapia. The net contribution from
each stocking density was obtained by subtracting the total cost of production (cost of fingerlings,
Herrera
UNU Fisheries Training Programme
17
food and other cost) by total sales. Thus, it was possible to determine the net contribution per 1 kg
of fish, dividing the net contribution between the final biomass obtained in each stocking density.
4.7 Data analysis
The data were analyzed with a one-way analysis of variance (ANOVA) using Sigmaplot 2013.The
normality of the data was confirmed with Shapiro –Wilk test and pairwise comparison among
means was performed with the Holm-Sidak method with accepting significant difference at p<0.05
The Friedman repeated measured analysis of variance was used to compare oxygen, pH and
temperature levels.
5 RESULTS
5.1 Growth and survival
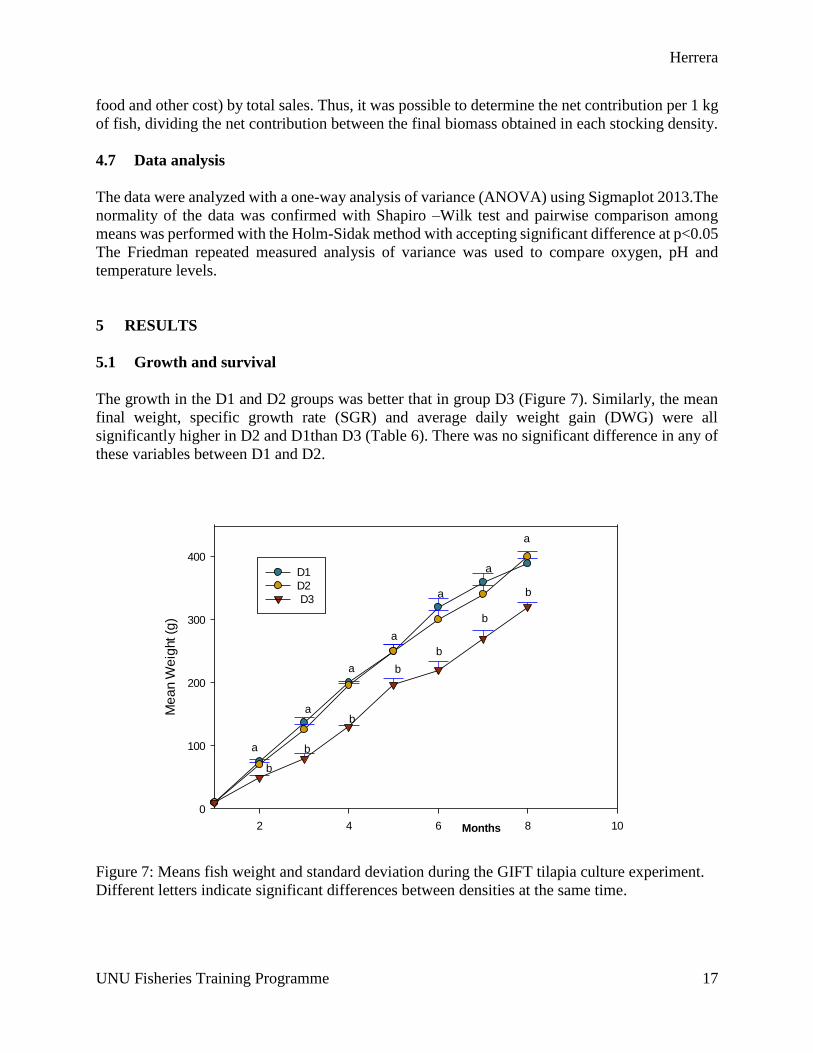
The growth in the D1 and D2 groups was better that in group D3 (Figure 7). Similarly, the mean
final weight, specific growth rate (SGR) and average daily weight gain (DWG) were all
significantly higher in D2 and D1than D3 (Table 6). There was no significant difference in any of
these variables between D1 and D2.
2 4 6 8 10
Me
an W
eig
ht (g
)
0
100
200
300
400
D1
D2
D3
a
a
a
a
a
a
a
b
b
b
b
b
b
b
Months
Figure 7: Means fish weight and standard deviation during the GIFT tilapia culture experiment.
Different letters indicate significant differences between densities at the same time.

Herrera
UNU Fisheries Training Programme
18
Table 6: Mean size and growth performance at different densities. Mean identified by different
superscripts are significantly different. Density fish/m² 3(D1) 3.2(D2) 3.5(D3)
Mean initial weight 10a 10a 10a
Mean final weight 383±13a 389±27a 320b
SGR 1.58±0.01a 1.59±0.03a 1.50b
DWG 383.63±12.503a 389.29±27.429a 319.958b
The survival rates at all densities were greater than 90 percent, but there was no significant
difference between treatments (Table 7).
Table 7: Mean and Standard deviation per treatment Density fish/m² 3(D1) 3.2(D2) 3.5(D3)
Survival (%) 91.7±1.2a 91.7±0.88a 90.6±0.4a
5.2 Food Conversion Ratio
The feed conversion was best in the D1 group and significantly better than at the higher densities
(Figure 8).
Figure 8: FCR per density.
Densities
FC
R
0.0
0.5
1.0
1.5
2.0
2.5
D1
D2
D3
Herrera
UNU Fisheries Training Programme
19
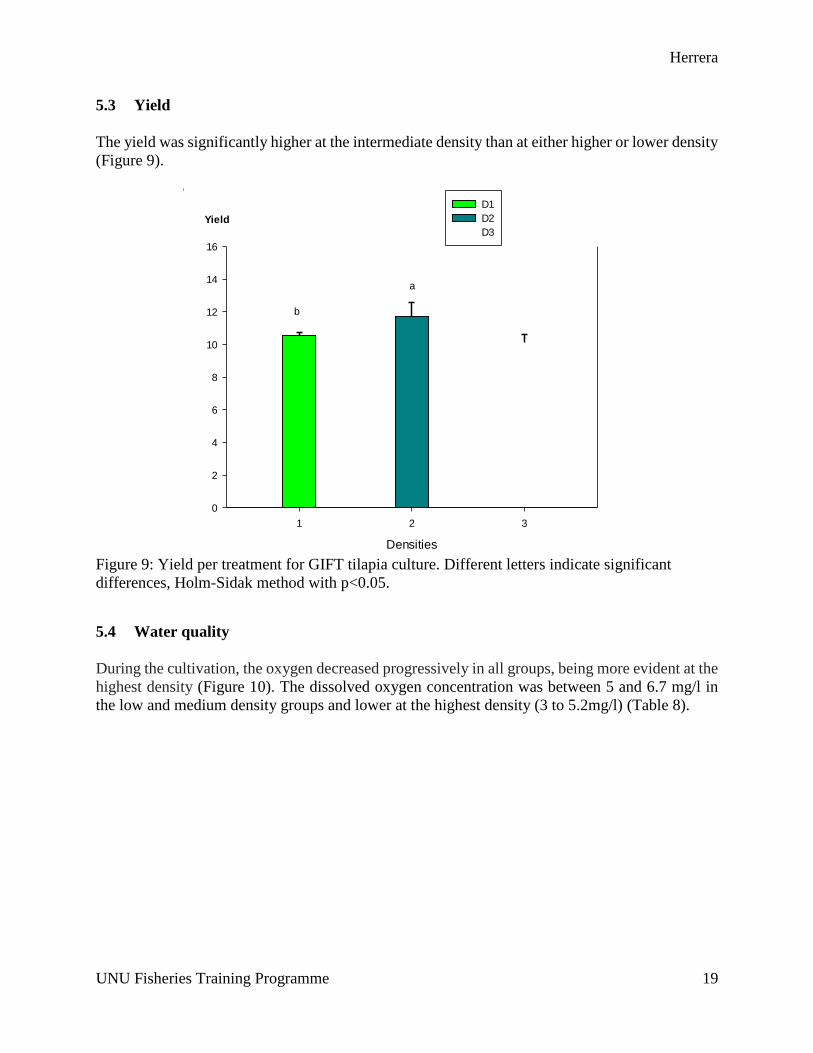
5.3 Yield
The yield was significantly higher at the intermediate density than at either higher or lower density
(Figure 9).
Densities
1 2 3
0
2
4
6
8
10
12
14
16
D1
D2
D3
b
a
Yield
Figure 9: Yield per treatment for GIFT tilapia culture. Different letters indicate significant
differences, Holm-Sidak method with p<0.05.
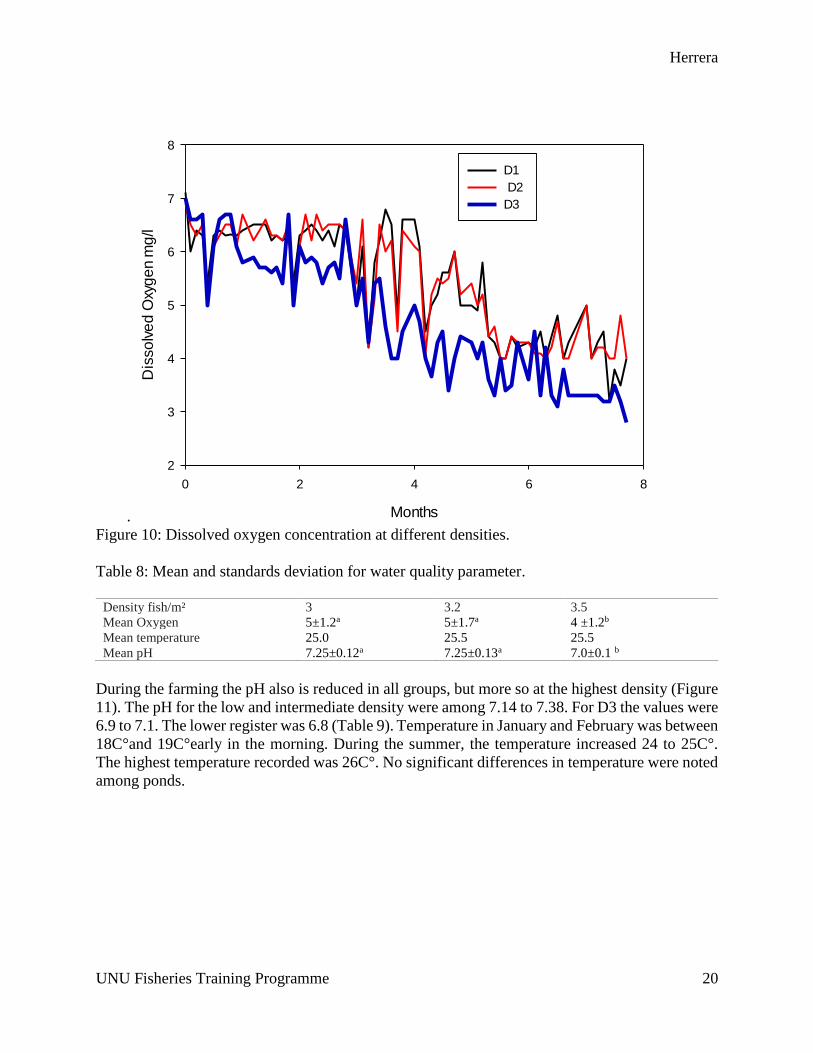
5.4 Water quality
During the cultivation, the oxygen decreased progressively in all groups, being more evident at the
highest density (Figure 10). The dissolved oxygen concentration was between 5 and 6.7 mg/l in
the low and medium density groups and lower at the highest density (3 to 5.2mg/l) (Table 8).
Herrera
UNU Fisheries Training Programme
20
. Months
0 2 4 6 8
Dis
so
lve
d O
xyg
en m
g/l
2
3
4
5
6
7
8
D1
D2
D3
Figure 10: Dissolved oxygen concentration at different densities.
Table 8: Mean and standards deviation for water quality parameter.
Density fish/m² 3 3.2 3.5
Mean Oxygen 5±1.2a 5±1.7a 4 ±1.2b
Mean temperature 25.0 25.5 25.5
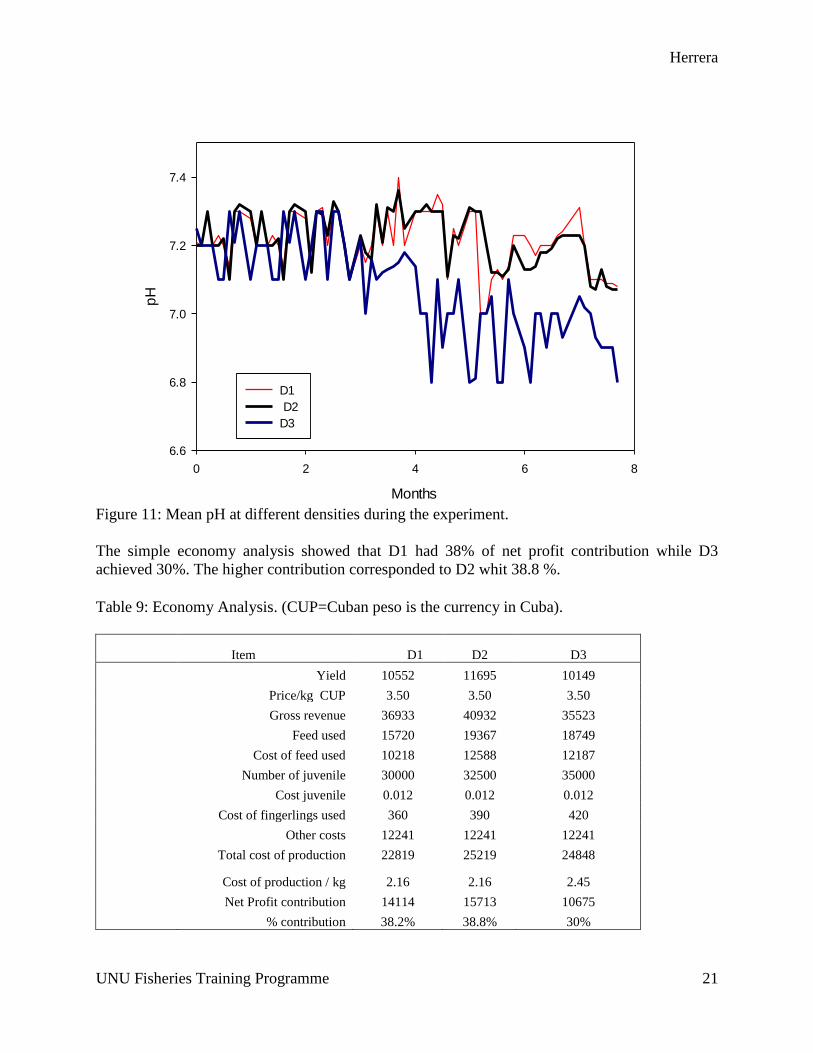
Mean pH 7.25±0.12a 7.25±0.13a 7.0±0.1 b
During the farming the pH also is reduced in all groups, but more so at the highest density (Figure
11). The pH for the low and intermediate density were among 7.14 to 7.38. For D3 the values were
6.9 to 7.1. The lower register was 6.8 (Table 9). Temperature in January and February was between
18C°and 19C°early in the morning. During the summer, the temperature increased 24 to 25C°.
The highest temperature recorded was 26C°. No significant differences in temperature were noted
among ponds.
Herrera
UNU Fisheries Training Programme
21
Months
0 2 4 6 8
pH
6.6
6.8
7.0
7.2
7.4
D1
D2
D3
Figure 11: Mean pH at different densities during the experiment.
The simple economy analysis showed that D1 had 38% of net profit contribution while D3
achieved 30%. The higher contribution corresponded to D2 whit 38.8 %.
Table 9: Economy Analysis. (CUP=Cuban peso is the currency in Cuba).
Item D1 D2 D3
Yield 10552 11695 10149
Price/kg CUP 3.50 3.50 3.50
Gross revenue 36933 40932 35523
Feed used 15720 19367 18749
Cost of feed used 10218 12588 12187
Number of juvenile 30000 32500 35000
Cost juvenile 0.012 0.012 0.012
Cost of fingerlings used 360 390 420
Other costs 12241 12241 12241
Total cost of production 22819 25219 24848
Cost of production / kg 2.16 2.16 2.45
Net Profit contribution 14114 15713 10675
% contribution 38.2% 38.8% 30%
Herrera
UNU Fisheries Training Programme
22
6 DISCUSSION
The growth performance at the low and intermediate density was significantly better than that of
fish reared at the highest density. The mean weights of the two former groups was significantly
higher than the latter. Based on the summary of studies, this is in disagreement with the majority
findings, whom found that greater mean final weight corresponded to the low density and is
according with 3 reports, however they conducted the study with different densities.
The stocking density did not affect the survival rates. This may be because the fish were all fairly
uniform in size from stocking (10g). Moreover, good care was taken to follow the best practices
for the culture and that may also have helped maintaining small sizes variation. This suggests that
stocking density might have limited influence on survival. Despite there is no significant different,
the survival rate is slightly smaller in the high density D3, concurred with 13 studies.
Since stocking density did not affect survival, differences in yield were primarily determined by
stocking density and final size. As a result, the highest yield was obtained at the intermediate
density D2 (32 500 fish/ha.). The stocking density affected the yield in D1 and the final size
determined the lower production in D3.
From the beginning, the group reared at the highest density grew more slowly than the other two
groups. In all groups the water quality was progressively deteriorating, because the biomass was
growing and demanding more oxygen, also increasing food offered and the excretion of
metabolites, but in the high density was more evident. This may have been caused by reduced
growth at the highest density. When early in the morning the oxygen dissolved was nearly 3mg/l,
presumably the oxygen depleted at night below 2mg/l causing stress. By increasing water
exchange and/or applying aeration the water quality may be improved. In fact, this may allow even
higher stocking densities that could increase the yield even further. Also behavioral interaction
may have related with the reduction in growth for high density, because at the beginning all groups
had good water quality, however the high density showed less growth.
Increased stocking density may have caused stress in the fish which in turn may have reduced the
growth at the highest density tested. It is likely that reduced water quality may have contributed to
the stress. Also increased stocking density result in competition for space, food and oxygen,
increase activity level and fish use more energy deriving in high metabolic rates and then growth
decrease. (Ellis et al., 2002). Under culture conditions, the fish for obtain food increase the
swimming speed, these activities require energetic cost, which increase due to agonistic
interactions. (Thorarensen & Farrell, 2010)
The FCR in this study increased at higher densities. The best feed conversion was found at the
lower stocking density. A number of factors may have contributed to the better feed conversion at
the lowest density. Natural plankton contributes to the feed intake of tilapia in ponds. The lower
the stocking density, the contribution of plankton is greater (Kubitza, 2000). This may have
contributed to the reduced FCR in the lower density D1. A second factor contributing to better
feed conversion at the lowest density may be related to the behavior of the fish. When stocking
density is high, feed loss increases because the high biomass induces water turbulence at feeding

Herrera
UNU Fisheries Training Programme
23
time. Tilapia is a visual feeder, so that turbulence affects their access to food and FCR can increase
(Chorm & Webster, 2006).
Referred to above summary, this experiment coincides with 5 authors found that FCR rises to with
increasing density and is different from 7, they obtained that FCR decreases with increasing
stocking density. Despite to FCR are above 2, how as recommended for tilapia farming, it is
possible reduce these values. The quality of the feed may also have contributed to the poorer FCR
at higher density. The feed was not extruded and, therefore, uneaten feed will sink to the bottom.
With extrusion, the feed floats better and longer time is given for the fish to catch it. With reduced
feed losses to the bottom, the FCR could improve at the higher densities. In fact, the results of a
study by El-Sayed, 2013) suggest that extruded feed gives better FCR (1.0-1.4) than pelleted feed
(1.3-1.8).
Many authors abstracted that the effect of increase stocking density may cause various stress
responses, such as increase mortality, increase metabolism, reduce growth rate, increase size
variation, reduce feed intake, increase FCR, and caused poor health in fish. (Ellis et al., 2002)
(Turnbull et al., 2005) (Thorarensen & Farrell, 2010).
The treatment D2 was the optimum stocking density because it achieved the highest amount of
fish produced per unit area efficiently. Efficient production means maximum yield that can be
produced with adequate feed conversion in less time and with acceptable final weight for
consumer, considering that the demand for final weight in Cuba are between 300-350 grams.
If the gross revenue for sales are greater than the total production cost, it means that profit are
generated for these densities, D2 allows bigger net profit contribution, enabling the rapid return on
investment for infrastructure and equipment used in the fish farm.
7 CONCLUSION AND RECOMEMDATIONS
According to the current best practice directions (POW), the stocking density of GIT tilapia in
ponds should be 2.7 fish/m² in the first growth-out phase. However, the results of the present study
suggest that this could be increased to 3.25 fish/m². The latter density gives about 10% higher
yield. In the fish farm La Juventud will not be possible to reach high yield through the increase in
density, if not is applied mechanical aeration combined with water exchange, so as to increase
water quality. Moreover, if the quality of feed is improved or has ensured the stable supply of
extruded foodstuff, may lead to decreased production costs and attain more efficiency cultivation.
Herrera
UNU Fisheries Training Programme
24
ACKNOWLEDGEMENTS
I would like to first thank to my mother Elia Herrera Delgado, who has constantly banked on my
inner strength and with her usual knowledge, she assured me that the way can be arduous but
always is possible to achieve our dreams if we focus and strive. Thanks to my supervisor Professor
Helgi Thorarensen for his invaluable guidance and support. I also want to thank to the UNU staff
(Dr Tumi Tómasson, Mary Frances Davidson, Sigríður Ingvarsdóttir), thanks Thor H. Asgeirsson
for giving me the opportunity to take part in this training program.
I would like to acknowledge the companionship provided by UNU -FTP fellows with whom I
felt like in my own house, particularly with the fellows from Holar Le Hoang Bao Chau and
Iuliia Lysakoska.

Herrera
UNU Fisheries Training Programme
25
LIST OF REFERENCES
Aksungu, M., & Aksungur, N. (2007). Effects of Stocking Density on Growth Performance,
Survival and Food Conversion Ratio of Turbot (Psetta maxima) in the Net Cages on the
southeastern coast of the Black Sea. Turkish Journal of Fisheries and Aquatic Sciences 7(2):
147-152.
Ammar, A. (2009). Effect of initial weight and stocking density on growth performance of mono
sex nile tilapia reared in semi intensive system. Egypt Journal Aquatic , Biology & Fish, 13(2):
69- 80 .
Aquaculture SA. ( 2003). Water Quality in Aquaculture Ponds. [December 2014]
<www.pir.sa.gov.au/factsheets>
Aurbun University (2003). Stocking Ponds. [December 2014]
<http://www.ag,aurbun.edu/.../Chapter4 Stoking ponds.>
Barcellos, L., & Nikolaieswky, S. (1999). the effect of stocking density and social interaction on
acute stress response in Nile tilapia Oreochromis niloticus fingerling. Aquaculture Research 30:
887-892.
Bhujel, R. (2013). On-farm feed management practices for Nile tilapia (Oreochromis). FAO
Fisheries and Aquaculture Technical Paper No. 583. Rome: FAO.
Chakraborty , S., & Banerjee, S. (2012). Comparative growth performance of mixed-sex and
monosex Nile tilapia at variousstocking densities during cage culture. Recent Research in
Science and Technology 4(11): 46-50.
Chang, W., & Ouyang, H. (1988). Dynamics of Dissolved Oxygen and Vertical Circulation in
Fish Ponds. Aquaculture 74(3): 263-275.
Chorm, E., & Webster, C. (2006). Tilapia,Biology. Culture and Nutrition. New York: The
Haworth Press.
Chakraborty, S., & Banerjee, S. (2010). Effect of Stocking Density on Monosex Nile Tilapia
Growth during Pond Culture in India. World Academy of Science, Engineering and Technology
44: 1521--1534
Daudpota, A., & Kalhoro, I. (2014, December). Effect of stocking densities on growth,
production and survival rate of red tilapia in hapa at fish hatchery Chilya Thatta, Sindh, Pakistan.
Journal of Fisheries 2(3): 180-186 .
De Castro Oliveira, R. (2010). Desempenho Zootecnico de duas LInhagens de tilapia do Nilo sod
diferentes densidades de estocagem en raceways. Goias: Universidade Fedeal de Goias.
Herrera
UNU Fisheries Training Programme
26
Dos Santos, V., Fonseca de Freitas, R., Fonseca , F., & Archangelo , T. (2007). Evaluation of
morhometric growth curves of tilapia of Nilo (Oreochromis niloticus) strains. Ciencia e
Agrotecnologia 31(5): 1486-1492.
Damas , T. (2012). Respuesta a la selección por peso del núcleo élite de Tilapia nilótica GIFT en
Cuba. Havana, Cuba: EDTA.
Diana, J., Lin, C., & Jaiyen, K. (1994). Suplemental feeding of tilapia in fertilized ponds.
Journal of the World Aquaculture Society 25: 497-506.
El -Sayed, A.-F. (2002). Effects of stocking density and feeding levels on growth and feeding
efficiency of Nile tilapia (Oreochromis niloticus L.) fry. Aquaculture Research 33: 621-626.
Elizalde, S., & Gonzalo, D. (2006). Procemientos Operacionales de trabajo para el cultivo
intensivo de tilapias en estanques. Havana ,Cuba: Ministerio de la Indusstria Pesquera.
Ellis, T., North, B., & Scott, A. (2002, July). The Relationship between stocking density and
welfare in farmed raibow trout. (T. F. isles, Ed.) Journal of Fish Biology 61: 493-531.
El-Sayed, A.F.M. (2013). On-farm feeding and feed management in aquaculture(Oreochromis
niloticus) in Egypt. FAO Fisheries and Aquaculture Technical Paper No. 583.
Rome: FAO.
El-Sayed, A.F.M. (2006). Tilapia culture. Cambridge: CABI Publishing.
FAO. (2012). Fishery and Aquaculture Statistics. Rome: FAO.
FAO (2014). Globefish [December 2014]. < http://www.fao.org/in-action/globefish/en/>
Floyd, R., & Watson, C. (2012). Ammonia in Aquatic Systems. Fisheries and Aquatic Sciences
Department. [December 2014] <http://edis.ifas.ufl.edu.>
Garcia , F., Romera , D., & Gozi, K. (2013, March). Stocking density of Nile tilapia in cages
placed in a hydroelectric reservoir. Aquaculture 410: 51–56
Garcia, S. (2009). aliviacion de la calidad de agua en tilapia GIFt a diferente densidades en el
estado de Santa Catarina. Itajai .Brasil: Univesidade de Itaji.
Gibtan, A., Getahun, A., & Mengistou, S. (2008). Effect of stocking density on the growth
performance and yield of Nile tilapia [Oreochromis niloticus (L., 1758)] in a cage culture system
in Lake Kuriftu, Ethiopia. Aquaculture Reseach 39(13): 1450-1460.
Green , B., Teichert-Coddington, , D., & Ha, T. (1993). Development of semi-intensive
aquaculture technologies in Honduras: Summary of freshwater aquacultural research conducted
from 1983 to 1992. International Center for Aquaculture and Aquatic Environments. Research
and Development Series. Auburn University.

Herrera
UNU Fisheries Training Programme
27
Guerrero, R., & Guerrero, L. (1988). Feasibility of commercial production of sex-reversed Nile.
The Second International Symposium on Tilapia in Aquaculture (pp. 183-186). Manila,
Philippines: Department of Fisheries, Bangkok, Thailand, and International Center for Living
Aquatic Resources Management.
GEIA. (2008-2014). Annual Report. Cuba: Ministry to Food Industry.
Gullian-Klanian, M., & Arámburu-Adame, C. (2013). Performance of Nile tilapia Oreochromis
niloticus fingerlings in a hyper-intensive recirculating aquaculture system with low water
exchange. Latin American Journal of Aquatic Research 41(1): 150-162.
Kapinga, I., Milaponi, E., & Kasozi, N. (2014). Effect of Stocking Density on the Growth
Performance of Sex Reversed Male Nile Tilapia (Oreochromis niloticus Under Pond Conditions
in Tanzania). World Journal of Fish and Marine Sciences 6(2): 156-161.
Kubitza, F. (2000). Qualidade da água,sistemas de cultivo,planejamento da produção
manejo nutricional e alimentaria e sanidade. Panorama da Aqüicultura 33-34.
Kubitza, F. (2013). Produccion de tilapias en estanques excavados en tierra.
Panorama da Aqüicultura 23(137): 11.
Macintosh, D., & Little, D. (1995). Nile tilapia (Oreochromis niloticus). In N. Bromage, & R.
Robert, Brood stock management and egg and larva quality. Oxford, UK: Blackwell Science.
Nguyen, H. (2005). Establishment a tilapia culture are for export purpose. Hanoi: Research
institute for Aquaculture No 1.
OLDEPESCA. (2012). Diadnostico de la Acuicultura Marina en America Latina y el Caribe.
XXII CONFERENCIA DE MINISTROS, (pp. 14-18). LA HABANA, CUBA.
Osofero , S., & Otubusin , S. (2009). Effect of stocking density on tilapia (Oreochromis
niloticus Linnaeus 1757) growth and survival inbamboo – net cages trial. African Journal of
Biotechnology 8 (7): 1322-1325.
Pompa, T., & Green, B. (1990). Sex reversal tilapia in earther ponds. Research and Development
Series, 35.
Ponzonia, R., Nguyen, N., & Khawa, H. (2008). Genetic Improvement of Nile
Tilapia (Oreochromis Niloticus) – Present and Future. 8th International
Symposium on Tilapia in Aquaculture. Malaysia.
Quiros, R. (1999). The relationship between fish yield and stocking density in reservoir from
Tropical and Temperates Regions. (J. Tundisi, & M. Straskaba, Eds.) Brasil, Brasil: International
Institute of Ecology, Brazilian Academy of Sciences.
Ribeiro, L., & Garcia , S. (2009). Desenvolvimiento da Tilapia GIFT em diferentes densidades
Herrera
UNU Fisheries Training Programme
28
de cultivo no litoral norte do estado de Santa Ctarina. Brasil.
Ronald , N., Gladys , B., & Gasper, E. (2014). The Effects of Stocking Density on the Growth
and Survival of Nile Tilapia (Oreochromis niloticus) Fry at Son Fish Farm, Uganda. Aquaculture
Research and Development 5(2).
Schwedler, T., & Johson, S. (2000). Responsible care and health maintenance of fish in
commercial aquaculture. Animal Welfare Information Center Bulletin, 10: 3-4.
Silveira, R. (2010). La sequía en la acuicultura cubana. REDVET. Revista electrónica de
Veterinaria, 11(03B), 1695-7504. [December 2014]
<http://www.veterinaria.org/revistas/redvet/n030310B.html>
Smith , C., & Reay, P. (1991). Cannibalism in teleost fish. Reviews in Fish Biology and
Fisheries 1(1): 41-64.
The World Bank. (2013, December). FISH TO 2030 Prospects for Fisheries and Aquaculture.
Agriculture and enviromental services discussion paper 03, pp. 42-43. [December 2014]
<www.worldbank.org/ard>
Thorarensen, H., & Farrell, A. (2010). Comparative analysis of the biological Requierements for
salmonid production at a range of densities in closed containment system. In E. Michael,
Chadwick, G. P. Jay , & S. Boomy, Evaluation of closed-contaiment Technologies for salwater
salmon Aquaculture (pp. 39-50). Ottawa: National Reseach Council of Canada.
Toledo-Perez, S. (2005). Cultivo de tilapia :Experiencia en Cuba. Taller Seminario de
Acuicultura Continental .Especies de Aguas Templadas Calidas. Formosa, Argentina.
Toledo-Perez, S., & Garcia Capote , M. (1998). avances en la nutricion acuicola en america
latina y el caribe. .Memorias del IV simposium internacional de nutricion aquicola (pp. 15-18).
La paz, Mexico: FAO.
Tucker, C., & D’Abramo, L. (2008, July). Managing High pH in Freshwater Ponds. SRAC
Publication.
Turnbull, J. B., Adams , A. C., & Bron, J. (2005). Stocking density and welfare of cage farmed
Atlantic salmon: application of a multivariate analysis. Aquaculture 243: 121-132.

Herrera
UNU Fisheries Training Programme
29
APPENDIX
Ponds Fish/m²
Fish/ha
Fish/ponds
Final
weight
Total
production Yield/ha FCR
%
Survival
A1 3 30 000 60 000 398 21600 10.800 1.62 90
A2 3 378 20790 10.395 1.60 92
A3 3 375 20923 10.461 1.38 93
B1 3.2 32 500 65 000 421 25300 12.65 1.73 92
B2 3.2 374 22842 11.421 1.67 92
B3 3.2 373 22027 11.0135 1.71 91
C1 3.5 35 000 70000 320 19296 9.648 1.77 86
C2 3.5 320 20800 10.400 1.90 93
C3 3.5 320 20800 10.400 2.07 93