THE EFFECT OF SQ4R TOWARD UNDERGRADUATE STUDENTS …
83
THE EFFECT OF SQ4R TOWARD UNDERGRADUATE STUDENTS’ CRITICAL READING COMPREHENSION THESIS BY MAULANA IKSAN NIM 1301120850 STATE ISLAMIC INSTITUTE OF PALANGKA RAYA FACULTY OF TEACHER TRAINING AND EDUCATION DEPARTMENT OF LANGUAGE EDUCATION STUDY PROGRAM OF ENGLISH EDUCATION 2017 M / 1439 H
Transcript of THE EFFECT OF SQ4R TOWARD UNDERGRADUATE STUDENTS …

THE EFFECT OF SQ4R TOWARD UNDERGRADUATE STUDENTS’
CRITICAL READING COMPREHENSION
COVER
THESIS
BY
MAULANA IKSAN
NIM 1301120850
STATE ISLAMIC INSTITUTE OF PALANGKA RAYA
FACULTY OF TEACHER TRAINING AND EDUCATION
DEPARTMENT OF LANGUAGE EDUCATION
STUDY PROGRAM OF ENGLISH EDUCATION
2017 M / 1439 H
ii
THE EFFECT OF SQ4R TOWARD UNDERGRADUATE STUDENTS’
CRITICAL READING COMPREHENSION
COVER ( Second Page)
THESIS
Presented to
State Islamic Institute of Palangka Raya
In partial fulfillment of the requirements
For the degree of Sarjana in English Language Education
BY
MAULANA IKSAN
NIM 1301120850
STATE ISLAMIC INSTITUTE OF PALANGKA RAYA
FACULTY OF TEACHER TRAINING AND EDUCATION
DEPARTMENT OF LANGUAGE EDUCATION
STUDY PROGRAM OF ENGLISH EDUCATION
2017 M / 1439 H
iii
ADVISOR APPROVAL
Title of the Thesis : The Effect of SQ4R toward Undergraduate Students‟
Critical Reading Comprehension
Name : Maulana Iksan
Faculty : Teacher Training and Education
SRN : 130 112 0850
Department : Language Education
Study Program : English Education
This thesis is certify that the thesis has been approved by the thesis advisors for
thesis examination/munaqasah by the board of examiners of the Faculty of
Teacher Training and Education of the State Islamic Institute of Palangka Raya.
Palangka Raya, December 2017
Approved by:
Advisor I,
Santi Erliana, M.Pd
ORN. 19801205 200604 2 003
Advisor II,
Zaitun Qamariah, M.Pd
ORN. 19840519201503 2 003
Acknowledged by:
The Vice of Dean I of Academic Affairs
Dra. Hj. Rodhatul Jennah, M. Pd
ORN. 19671003 199303 2 001
The Chair of Language Education
Santi Erliana, M.Pd
ORN. 19801205 200604 2 003
iv
THESIS APPROVAL
Thesis Title : The Effect of SQ4R toward Undergraduate Students‟
Critical Reading Comprehension
Name : Maulana Iksan
SRN : 1301120850
Faculty : Teacher Training and Education
Department : Language Education
Study Program : English Education
Has been examined by the Board of Examiners of the Faculty of Teacher Training
and Education of the State Islamic Institute of Palangka Raya in the Thesis
Examination/munaqasah on:
Day : Friday
Date : December, 2017 M/ Rabi‟ul-Akhir, 1439 H
BOARD EXAMINERS
1. M. Zaini Miftah, M.Pd
Chair/Examiner
(………………………………….)
2. Luqman Baehaqi, SS., M.Pd
Member
(………………………………….)
3. Santi Erliana, M.Pd
Member
(………………………………….)
4. Zaitun Qamariah, M.Pd
Secretary/Member
(………………………………….)
Approved by:
Dean, Faculty of Teacher Training and
Education
Drs. Fahmi, M.Pd
ORN. 19610520 199903 1 003

v
MOTTO AND DEDICATION
“Sciences is light, everyone who has science will be noble everywhere”
This thesis is dedicated to:
First, My beloved parents, my father Anang
Asmuni and my mother Idayah.
Second, My brothers and sisters, Muhammad
Tamsil, Sasmita, Aidil, Winda Milasari, and
Wina Risa. I thank them for their prayer and
support.

vi
DECLARATION OF AUTHENTICATION
BISMILLAHIRROHMAANIRROHIM
Herewith, I:
Name : Maulana Iksan
SRN : 1301120850
Faculty : Teacher Training and Education
Department : Language Education
Study Program : English Education
Declare that:
1. This thesis has never been submitted to any other tertiary education
institution for any other academic degree.
2. This thesis is the sole work of author and has not been written in
collaboration with any other person, nor does it include, without due
acknowledgement, the work of any other person.
3. If at later time is found that this thesis is a product of plagiarism, I am
willing to accept any legal consequences that may be imposed to me.
Palangka Raya, November 17th
2017
Yours Faithfully,
MAULANA IKSAN
SRN. 130 112 0850

vii
ABSTRACT
Iksan, Maulana. 2017. The Effect of SQ4R toward Undergraduate Students’
Critical Reading Comprehension. Thesis, Department of Language
Eduaction, Faculty of Teacher Training and Education, State Islamic
Institute of Palangka Raya. Advisor: (I) Santi Erliana, M. Pd., (II) Zaitun
Qamariah, M. Pd.
Keywords: Strategy, Critical Reading, Comprehension
This study was conducted in 2017 and it was aimed to measure the effect of
SQ4R reading strategy toward undergraduate students‟ critical reading
comprehension at State Islamic Institute of Palangka Raya. There were 28
students, consists of students from fifth semester (15 students from class A and 13
students from class C), chosen as subject of the study by cluster sampling. The
study included in quantitative research and the type was quasi experimental
design. The data collecting technique used was test.
Based on the findings, the students‟ achievement got improved significantly
when the material given by using SQ4R strategy. Ha was proved where T count
was bigger than Ttable with 5% (-2,706 > 2,056) at degrees of freedom 26. Ho was
rejected since Pvalue < 0,05 (0,017 < 0,05). It meant there was difference between
average score of experimental group and average score of control group. Value of
tobserv was negative that means experimental group‟s score was lower than control
group. The difference of average (mean difference were -6,65 (21,35-28), and the
difference was -12,02 until -1,29. The fact really proved that SQ4R increased
students‟ critical reading comprehension since it gave positive effect toward the
students‟ achievement in reading lesson, even the score as the experimental group
was lower than control group. Based on the study, the reading strategy was
recommended to be applied by students in reading as the process to be the critical
reader.

viii
ABSTRAK (Indonesian)
Iksan, Maulana. 2017. Efek penggunaan Strategi Membaca SQ4R terhadap
Pemahaman Membaca Kritis Mahasiswa S1. Skripsi, Jurusan Pendidikan
Bahasa, Fakultas Tarbiyah dan Ilmu Keguruan, Institut Agama Islam Negeri
Palangka Raya. Pembimbing: (I) Santi Erliana, M. Pd., (II) Zaitun
Qamariah, M. Pd.
Kata Kunci: Strategi, Membaca Kritis, Pemahaman
Penelitian ini dilaksakan pada tahun 2017 dan bertujuan untuk mengukur
pengaruh strategi membaca SQ4R terhadap pemahaman membaca kritis
mahasiswa S1 pada Institut Agama Islam Negeri Palangka Raya. Penelitian ini
melibatkan 28 mahasiswa, terdiri atas mahasiswa semester lima (15 mahasiswa
dari kelas A dan 13 mahasiswa dari kelas C), yang dipilih sebagai subjek
penelitian dengan menggunakan teknik cluster sampling. Penelitian ini termasuk
dalam penelitian kuantitatif dengan menggunakan quasi experimental design.
Pengumpulan data menggunakan teknik test.
Berdasarkan data yang diperoleh, ditemukan bahwa pencapaian mahasiswa
menunjukan peningkatan yang signifikan ketikan materi yang diberkan
menggunakan strategi SQ4R. Ha membuktikan di mana T hitung lebih besar dari
t-tabel dengan 5% (-2,706 > 2,056) pada derajat kebebasan 26. Ho ditolak karena
Pvalue < 0,05 (0,017 < 0,05). Artinya, ada perbedaan antara nilai rata-rata dari kelas
eksperimen dan nilai rata-rata kelas control. Perbedaan nilai rata-rata (mean
difference) adalah -6,65 (21,35 – 28), dan perbedaannya antara -12,02 sampai -
1,29. Hasil penelitian ini membuktikan bahwa SQ4R telah meningkatkan
pemahaman membaca kritis mahasiswa karena memberikan pengaruh positif
terhadap pencapaian mahasiswa dalam pelajaran membaca, meskipun nilai dari
kelas ekperimen lebih rendah dari kelas control. Berdasarkan penelitian tersebut,
strategi membaca SQ4R dianjurkan untuk digunakan oleh mahasiswa dalam
proses untuk menjadi pembaca yang kritis.

ix
ACKNOWLEDGMENTS
First of all, thanks to Allah SWT, who has been giving us mercy and blessing
so this study can be completed well. Then the greatest grateful is given to:
1. Dr. Ibnu A.S. Pelu, S.H., M.H, as the Rector of IAIN Palangka Raya for his
direction and permission for conducting this thesis;
2. Drs. Fahmi, M. Pd, as the Dean Faculty of Education and Teacher Training
on his permission, so that this study can be accomplished as the requirements
for composing this thesis;
3. M. Zaini Miftah, M. Pd, as the Coordinator of the English Education Study
Program on his permission, so that this study can be accomplished as the
requirements for composing the thesis;
4. Santi Erliana, M. Pd, as the first advisor on her guidance in the process of this
study.
5. Zaitun Qamariah, M. Pd, as the second advisor on her advise and suggestion
during composing this study;
6. The lecturers of IAIN Palangka Raya;
7. The fifth semester students of English Education IAIN Palangka Raya on
their help in the process during the study.
8. All lecturers of English Study Program on their education and knowledge.
9. My big family;
10. All of my friends of TBI 2013.
Thank you for the guidance, support, suggestion, and advices during the study.
We realize that this study far of perfect, therefore some constructive suggestion
and critic are hoped for next perfected study.
Palangka Raya, December 2017
Maulana Iksan
SRN. 1301120850

x
TABLE OF CONTENT
Table of Contents
COVER .................................................................................................................... i
COVER (Second Page) ........................................................................................... ii
ADVISOR APPROVAL ........................................................................................ iii
THESIS APPROVAL ............................................................................................ iv
MOTTO AND DEDICATION ............................................................................... v
DECLARATION OF AUTHENTICATION ......................................................... vi
ABSTRACT .......................................................................................................... vii
ABSTRAK (Indonesian) ...................................................................................... viii
ACKNOWLEDGMENTS ..................................................................................... ix
TABLE OF CONTENT .......................................................................................... x
LIST OF TABLES ................................................................................................ xii
LIST OF FIGURS ................................................................................................ xiii
LIST OF APPENDICES ...................................................................................... xiv
LIST OF ABBREVIATIONS ............................................................................... xv
CHAPTER I INTRODUCTION ............................................................................. 1
A. Background of the Study .............................................................................. 1
B. Research Problem......................................................................................... 4
C. Objectives of the Study ................................................................................ 4
D. Hypothesis of the Study ............................................................................... 5
E. Assumption .................................................................................................. 5
F. Scope and Limitation ................................................................................... 5
G. Significance of the Study ............................................................................. 5
H. Definition of Key Terms .............................................................................. 6
CHAPTER II REVIEW OF RELATED LITERATURE ....................................... 7

xi
A. Related Studies ............................................................................................. 7
B. Reading Comprehension ............................................................................ 10
C. Definition of Reading Strategy .................................................................. 10
D. SQ4R .......................................................................................................... 13
E. Critical Reading ......................................................................................... 19
CHAPTER III RESEARCH METHOD ............................................................... 26
A. Research Design ......................................................................................... 26
B. Population and Sample ............................................................................... 27
C. Research Instrument ................................................................................... 28
D. Instruments Try Out ................................................................................... 29
E. Data Collection Procedure ......................................................................... 34
F. Data Analysis Procedure ............................................................................ 34
CHAPTER IV RESEARCH FINDINGS AND DISCUSSION ........................... 39
A. Data presentation ........................................................................................ 39
B. Research findings ....................................................................................... 52
C. Discussion .................................................................................................. 60
CHAPTER V CONCLUSION AND SUGESTION ............................................. 63
A. Conclusion ................................................................................................. 63
B. Suggestion .................................................................................................. 63
REFERENCES ...................................................................................................... 65
APPENDIX ........................................................................................................... 68

xii
LIST OF TABLES
Table Page
2.1 Reading Strategy (SQ4R) Teaching Procedure …………………… 13
3.1 Scheme of Quasi Experimental Design Nonrandomized Control
Group, Pretest-Posttest Design……………………………………..
22
3.2 Groups of Sample………………………………………………….. 23
3.3 Content Specification of Items Research Instruments 26
4.1 The Comparison of Pre-test and Post-test Score of Control Group... 30
4.2 Frequency Distribution of the Pre-test Score of Control Group…… 32
4.3 Frequency Distribution of the Post-test Score of Control Group … 34
4.4 The Comparison of Pre-test and Post-test Score of Experimental
Group……………………………………………………………….
35
4.5 Frequency Distribution of the Pre-test Score of Experimental
Group……………………………………………………………….
37
4.6 Frequency Distribution of the Post-test Score of Experimental
Group……………………………………………………………….
39
4.7 The Comparison Score of Pre-test and pos-test……………………. 40
4.8 Test of Normality (Shapiro-Wilk Test) of Pre-test………………… 42
4.9 Test of Homogeneity of Variance of Pre-test……………………… 42
4.10 Test of Normality (Shapiro-Wilk Test) of Post-test……………….. 43
4.11 Test of Homogeneity of Variance of Post-test…………………….. 43
4.12 Standard Deviation and Standard Error of X1 and X2 of Critical
Reading Comprehension Score…………………………………….
44
4.13 The Result of T-test………………………………………………... 45
4.14 Standard Deviation and Standard Error of X1 and X2 Group
Statistic……………………………………………………………...
46
4.15 The Calculation T-test Using SPSS 17.0 Independent Sample Test. 46
4.16 Comparison between the Previous of Study and the Result of the
Study………………………………………………………………..
62

xiii
LIST OF FIGURES
Figures Page
4.1 The Frequency Distribution of Pre-test of Experimental Group.. 33
4.2 The Frequency Distribution of Post-test of the Control Group… 34
4.3 The Frequency of Pre-test of the Experimental Group…………. 38
4.4 The Frequency Distribution of Post-test of the Experimental
Group……………………………………………………………
39
4.5 The Comparison Both of the Group‟s Post-test Scores………… 42

xiv
LIST OF APPENDICES
Appendix 1
Appendix 2
Appendix 3
Appendix 4
Appendix 5
Appendix 6
Appendix 7
Appendix 8
:
:
:
:
:
:
:
:
Course outline, lesson plan, students‟ name.
Try out test items and answer sheet.
Research instrument and answer sheet.
The calculating of mean, median, modus, standard deviation, and
standard error
The values of t-table Pearson product moment and distribution.
Documentation (pictures)
Permission letter
Curriculum vitae

xv
LIST OF ABBREVIATIONS
SQ4R : Survey, Question, Read, Recite, Reflect, Review
df : Degree of freedom
SD : Standard Deviation
SE : Standard Error
Ha : Alternative Hypothesis
Ho : Null Hypothesis
SPSS : Statistical Package for the Social Sciences
IAIN : Institut Agama Islam Negeri

1
CHAPTER I
INTRODUCTION
This chapter discusses background of the study, research problem, objective
of the study, hypothesis of the study, assumption, scope and limitation,
significance of the study, and definition of key term. This part considers providing
sufficient background information.
A. Background of the Study
Education is directed for solving nation‟s problem until now, so we do not
only need quantity but also quality of education product. Priantari (2013:756)
stated quantitatively, we can say that education in Indonesia have been improve
(reading and writing skill reach 67,24%), but qualitatively education in Indonesia
is still low. Whereas, education quality is determined from quality of graduations
of education institute. In State Islamic Institute of Palangka Raya (IAIN Palangka
Raya) provides a critical reading subject in lecturing to handle the problem and to
improves students quality in critical readers.
Perez (2010) stated reading is a crucial element of learner study in higher
education. As the comparison an alumnus of IAIN of Palangka Raya, Lisna in her
thesis said that reading is one of language skill that important to be mastered by
students to enrich insight. Reading is a means of language acquisition, of
communication, and of sharing information and ideas. Reading is a significant
activity specifically for students of IAIN Palangka Raya, for each part of their life
in academic atmosphere involves it.
1

2
Islamic religon commands the believers to read. Reading is the first
command was delivered to Propet Muhammad. Based on Quran, Allah said in
surah Al-Alaq verse 1-5 as the following:
“Read in the name of your god who created you. He created human from clod of
blood. Read, and your god is very soft touch, that taught (human) by word). He
teaches human anything that they do not know”. (al-Qur‟an digital)
Verses above are the real evidence that Islam commands the followers to
read and write as the way to enrich insight, science, and knowledge. The verses
are the first message from Allah to Prophet Muhammad saw. Islam said that
reading and writing is important fourteen centuries ago.
Pirozzi (2003: 325) stated that critical reading can be defined as very high-
level of written material requiring interpretation and evaluation skill that enable
the reader to separate important from unimportant information, distinguish
between facts and opinions, and determine a writer‟s purpose and tone. It also
entails using inference to go beyond what is stated explicitly, filling in
informational gaps, and coming to logical conclusions.
To practicing critical reading skill a reader apply using inference,
distinguishing between facts and opinions, and uncovering purpose and
determining tone. Based on an experience during study in IAIN Palangka Raya
most students do not read and think critically. Students have not been critical
readers. They are seldom to give and answer question, analyze argumentations

3
and give opinions, proof the facts, observe, make deductions, give definitions,
fuse lean and ability to make a decision, and so on. Rifqiyana (2015) stated there
are 12 indicator of critical thinking included in 5 steps, namely basic clarification,
the bases for decision, inference, advanced clarification and supposition and
integration. In the reality, most of student wait explanations and conclusion from
lectures when comprehend a text that need critical thinking such as argumentative
text. Not only critical thinking, but also Students‟ reading skills are not optimal
yet. Students still cannot read well. Most of them do not comprehend all the
content of the text and cause the goal cannot be reach well.
Based on experience and observation, SQ4R reading strategy never been
taught in reading class. The writer knew after questioning with fifth and seventh
English department students of IAIN Palangka Raya. The questioner was
conducted on 30th
November 2016. There are no students know the reading
strategy. They only know SQ3R reading strategy. Most students just knew this
reading strategy. It is appropriate to be tried on student because of having some
advantages. One of the crucial parts is by reflecting on the reading, students begin
to think critically what they have learned and have yet to learn about the topic.
This type of critical thinking is necessary if students are to become mature
readers. Reflect on what has been read also helps students retain understanding for
longer periods of time. The more students reflect on text the longer they will
remember it and the more likely they will be able to use the knowledge they have
trained (Glass & Zygouris, 2005). Pujiono (2012) stated that critical thinking is
thinking process to analysis what the implication of written information, example

4
to inference or to find the implication, to evaluate, and to give valuation towards
problem is faced. Critical thinkers are always uncertain the truth of the
information that they get. To get the authentic one, critical thinkers will research,
analysis, find the logical, and restate the arguments and give valuation. Based on
the background of the study, the study will observe “The Effect of SQ4R toward
Undergraduate Students Critical Reading Comprehension.
Based on the description above, this study will conduct the research, for
several reasons: first, SQ4R is new among students which have not been tested in
State Islamic Institute of Palagka Raya. Then, this study will test this reading
strategy, especially SQ4R in reading comprehension towards students‟ critical
thinking at IAIN Palangka Raya. The second, in SQ4R reading method found
advantage (support) towards critical thinking. This indication can be found in one
of the steps, namely at reflecting section. An article mentioned, that critical
thinking is necessary if students are to become mature readers. Reflecting on what
has been read also helps students retain understanding for longer periods of time
(Glass and Zygouris-Coe, 2005: 3).
B. Research Problem
This study formulates the problems of the study based on the background
of the study as stated in the following:
1. Is there any significant effect of SQ4R toward undergraduate students‟
critical reading comprehension?
C. Objectives of the Study
1. To measure the significant effect of SQ4R toward undergraduate students‟
critical reading comprehension.

5
D. Hypothesis of the Study
1. Ha: There is significant effect of SQ4R toward undergraduate students‟
critical reading comprehension.
2. H0: There is no significant effect of SQ4R toward undergraduate students‟
critical reading comprehension.
E. Assumption
SQ4R reading strategy is assumed to have effect on undergraduate
students‟ critical reading comprehension.
F. Scope and Limitation
The study belongs to experimental research design. Because the study uses
quosi experiment, so this study will not explain something probably influence the
reasult because of decision of the class. The focus of this study is students‟ critical
reading comprehension. The study will not elaborate students‟ attitude and
psicology on the treatment process but this study will try to make them become
critical readers to comprehen the author purpose. This study tries to increase
students‟ critical reading comprehesion in understanding authors purpose in a text.
The instrument is set to measure it. The instrument will not try to describe the
students‟ psicology. The experiment and control class are fifth semester students
at department of language education study program of English education of IAIN
Palangka Raya.
G. Significance of the Study
The result of this study to measures the effect of SQ4R toward
undergraduate students‟ critical reading comprehension. This study is expected to
be one of references for anyone who wants to improve student‟s critical reading

6
comprehension. The writer wants to participate in rising students‟ spirit to read
more and make it as a way to motivate students. Students are hoped going to be
critical readers. It shall be contribution for next research, Institution, and our
home (nation).
H. Definition of Key Terms
1. SQ4R
One of strategies can be able to improve metacognitive skill is SQ4R
(Survey, Question, Read, Reflect, Recite, and Review).
2. Reading Comprehension
Reading comprehension is a process that involves actively constructing
meaning among the parts of the text, and between the text and personal
experience.
3. Critical Reading
Critical reading is an essential part of the information gathering process that
is required to create an academically sound assignment. Critical reading goes
two steps further.
4. Strategy/technique/methods
These terms are used interchangeably by various authors to indicate a district
method of delivering content.

7
CHAPTER II
REVIEW OF RELATED LITERATURE
This chapter will present related studies, reading comprehension,
definition of reading strategy, SQ4R and critical reading.
A. Related Studies
There are some related studies to this research.
The first, Ferez (2010) told the results that critical thinking involves
reasoning, thus students trained to be critical thinkers, reason about what they are
learning to analyze information with logic. They understand that there is a
difference between constructing knowledge by using logic or by memorizing.
The second, Putra (2013) Pengaruh Model Pembelajaran SQ4R Terhadap
Keterampilan Membaca dalam Pembelajaran Bahasa Indonesia Siswa Kelas V SD
Gugus I Denpasar Selatan. This study aimed to know the different effects of
SQ4R (survey, question, read, reflect, recite, review) teaching modelon reading
skill in Indonesian subject V grade elementary students of Gugus I South
Denpasar Academic Year 2012/2013. The results show significant differences of
student‟s achievement.
The third, Kinanthi (2013) conducted a thesis that entitle Keektifan
Penggunaan Metode SQ4R dalam Pembelajaran Kerampilan Membaca Bahasa
Jerman di SMA Negeri 1 Sayegan Sleman. The study was aimed to know
significant difference of students‟ achievement in Germanic reading skill in SMA
Negeri 1 of Sayegan Sleman between students who was taught with SQ4R method
and conventional method, and also this study was aimed to know the effectiveness
8

8
of SQ4R in Germanic reading skill teaching on eleventh graders at SMA Negeri 1
of Sayegan Sleman. The results show significant differences of student‟s
achievement between using SQ4R method and conventional method, and using
SQ4R method was effective in Germanic reading skill teaching on eleventh
students of SMA Negeri 1 of Sayagan Sleman.
The fourth, Pardede (2013) in his unpublished thesis that entitle Efektivitas
Metode SQ4R (Survey, Question, Read, Reflect, Recite, Review) dalam
Pembelajaran Memahami Teks Feature Kelas VII SMP Negeri 1 Sidikalang
Tahun Pelajaran 2012/2013. This study aims to determine the effectiveness of the
method SQ4R (Survey, Question, Read, Reflect, recite, Review) in learning to
understand the text feature class VII SMP Negeri Sidikalang many as 253 people.
The result shows that the method SQ4R (Survey, Question, Read, Refect, Recite,
Review) is more effective to apply in learning to understand the text feature class
VII SMP Negeri 1 Sidikalang learning year 2012/2013.
The fifth, Negara (2014) Model Pembelajaran Koopereatif Tipe SQ4R
Berbasis Keterampilan Proses Berpengaruh Terhadap Hasil Belajar IPA Siswa
Kelas V SD Gugus Letkol Wisnu. This study aimed to find out of significant
deferences of the learning result of natural science between the student who was
learned through cooperetive teaching and learning model of type SQ4R based on
process skill with the student who was learned with conventional teaching and
learning at the studemt grade V SD Gugus letkol Wisnu North Denpasar. The
results show significant differences of student‟s achievement.

9
The sixth, Rustiana (2014) The Effect of Applying Contextual Learning
with SQ4R on Improving Students‟ Mathematical understanding and Critical
Thinking in SMP Negeri 8 Kota Tasikmalaya. The results show significant
differences of student‟s achievement.
The seventh, Novita (2015) Improving Students‟ Reading Comprehension
on Recount Text by Using SQ4R and Media Booklet. The study was conducted to
help students to improve understanding detail information of generic structure of
text with easier. The results show significant differences of student‟s achievement.
The eighth, Runiatun at al. (2016), a thesis entitled Penggunaan Strategy
SQ4R (Survey, Question, Read, Reflect, Recite, Review) untuk Meningkatkan
Keterampilan Membaca Pemahaman. The purpose of this research is to improve
reading comprehension skill by applying SQ4R strategy among 5th grade students
Elementary School of SDN Soropadan. Found that the use of SQ4R strategy was
able to increase students‟ reading comprehension on V students of SDN
Soropadan No. 108 Surakarta academic year 2015/2016.
The nineth, Gurbuz (2017) Effect of the SQ4R Technique on the Reading
Comprehension of Elementary School 4th
Grade Elementary School Students. The
study is aimed to examine the effect of SQ4R technique of the reading
comprehension ability of elementary school 4th grade students. This result shows
that reading comprehension strategy has a positive and significant impact on
reading comprehension skill.
Based on the previous studies above, the study has different subject and
object of the study. In this study the subject is the fifth semester students in

10
English department of IAIN Palangka Raya and the object will be taught critical
reading by using SQ4R technique and without SQ4R technique (self monitoring
using question).
In this study will be focused to measure the effectiveness of using SQ4R
technique in reading comprehension towards critical reading of the students in
English Department of IAIN Palangka Raya. In this case, it is about how the
activities of the technique and how the effectiveness of the technique using SQ4R
technique by the teacher to increase critical reading. This study also focused on
experimental study.
B. Reading Comprehension
There are varieties of definitions of reading comprehension stated by
experts. Brown (2001: 306) stated that reading comprehension is primarily a
matter of developing appropriate, efficient comprehension strategies. According
to Nunan (1998: 67), reading comprehension is a process of relating the new to
the known based on the similar notion. Fauziati (2002: 139) the reading processes
are cycles of sampling, predicting, testing, and confirming. By guessing, the
readers predict, test, and confirm the content of the text. This implies that the
learner‟s background knowledge is important to help understand the text.
C. Definition of Reading Strategy
In oxford advanced learners dictionary is defined that reading is to look at
and understand the meaning of written or printed words or symbol, to discover or
something in particulars way, away in which something is interpreted or
understood (Kustiawati, 2011: 13).

11
a. Kind of Reading Strategy
There are several kinds of reading technique that used in academic world.
Wulandari (2012: 32) stated there are some reading techniques that have been
used by some experts before. They are:
1. Skimming strategy,
2. Scanning strategy,
3. Intensive reading,
4. KWL chart,
5. SQ3R strategy, and
6. SQ4R strategy.
Here are general discussions about the techniques above.
1) Skimming
Wulandari (2012: 33) stated skimming is a reading technique that allows us
to get the main ideas and gather the general information of a text. The procedure
of skimming is: first, we can look at the table of the content, the summary, the
title, the sub-title, the headlines, or the sentences that contain the key words. After
getting the point of the text, skimming may be followed by intensive reading to
comprehend more about the text we are reading. In skimming, the students are
required to find the general idea of text. When skimming, one‟s eyes go quickly
into sentences of the paragraph containing main ideas. Gebhard in Sabarun‟s
article (2012) stated that the activity for skimming is, for example, to determine
the best title of a passage. In this sense, students have to read the passage quickly
to get its general information.
12
2) Scanning
Wulandari (2012: 33) stated scanning is a reading technique that is used to
find the specific information from a text without reading the whole text. When
using scanning technique, we go through the text, and read it fast to search for the
passages that contain the specific information we need. In scanning, the students
are expected to locate facts of specific information. Scanning exercises may ask
students to find a particular date, name, number, or definition of a key concept or
to list a certain number, of supporting details. The purpose of scanning is to
extract specific information without reading the whole text. Skimming and
scanning are reading techniques used for effective reading.
3) KWL chart
Wulandari (2012:34) explained KWL chart stands for „what I know‟, what I
want to know‟, and „what I have learned‟. This is a three-step procedure for
helping students access the appropriate background knowledge when they are
reading informational text. The use of this chart develops students‟ metacognitive
skills, keeps them focused and interested during reading, and gives them a sense
of accomplishments. The procedures of KWL chart are: first, the students are first
asked to access what they know about a given topic (their prior knowledge). As
the students are brainstorming the ideas, the teacher can record these on the
chalkboard or chart paper. Next, they are asked to come up with the learning
goals, or what they want to learn about the given topic. Last, students write down
what they have learned, and check to see whether all of their “want to know”
questions have been answered. They can also have further reading. During this

13
procedure the students are engaged in brainstorming, generative and organizing
their ideas, specifying questions, checking what they have learned and guided
further reading.
4) SQ3R
According to Sabarun (2012) SQ3R strategy is a five step system developed
by Francis P Robinson. Each of the steps stands for Survey, Question, Read,
Recite, and Review. SQ3R strategy is developed on the basis of schemata theory.
The basic assumption of schemata theory is that what a reader knows affects what
he/she understands (Rumerhart, 1985). In this sense, a reader‟s own previously
acquired knowledge or reader‟s background knowledge can influence his/her
understanding of a text. The student‟s background knowledge and the previously
knowledge structure is call schemata.
The next is SQ4R technique. It stands for survey, question, read, reflect,
recite, and review.
The domain of the study is about SQ4R technique. In this study, it is
focused to the use of SQ4R technique in reading comprehension towards students‟
critical thinking which is showed by the scores they gain. The next will be
explained about SQ4R technique.
D. SQ4R
This part will discuss about the definition of SQ4R technique, the steps of
SQ4R, the strengths and weaknesses of SQ4R technique, and the procedure of
SQ4R technique in a reading class.
14
1. Definition of SQ4R Technique
According to Rustiana (2014) one of strategies can be able to improve
metacognitive skill is SQ4R (Survey, Question, Read, Reflect, Recite, and
Review).
a. Introduction of SQ4R
Trianto (2009: 151) stated learning method SQ4R (Survey, Question,
Read, Reflect, Recite, Review) sparked off by Thomas and Robinson
on 1972. This method consists of six steps, namely: Survey, Question,
Read, Reflect, Recite, and Review. Each of the steps supports each
other.
b. Parts of SQ4R
1). Survey
Readers think about the title. They shoul guess what will be included
in the chapter. Then readers read the introduction. In this part, the main
ideas are presented. After that readers read the summary. Here is the
relationship among the main ideas. Next, readers read the main heads.
Here are the main ideas. Finally, readers have to determine where in
the sequences of ideas each the headings are located.
2).Question
Readers turn headings and subheadings into questions. Next readers
ask who, what, where, when, why, and how about the headings.
Readers may use the authors‟ questions at the beginning or end of the
chapter, and use a workbook or study guide for questions. Readers
15
have to havin a question in mind, results in improved concentration
since readers are reading with a specific purpose in mind, reading for
meaning and ways to decide which details are important and which are
not.
3). Read
Next step, reader only read the material covered under one heading or
subheading at a time, and look for the answer to the readers‟ questions,
read ideas, not just words, take only minimal notes while reading, and
read aggressively with the intent of getting answer of nothing
supporting details and of remembering.
4).Reflect
Then take notes on each section as the Read and Recite steps are
complete. The more organized and detailed the notes, the better for
mastery of the material. Once again, readers use their own language.
5).Recite
Readers read the title of the information to be learned and turn it into a
question, try to answer the question silently or aloud to themselves
without reading, and readers read the information in notes to make
certain that they recited it correctly.
6) Review
When the lesson has been read, readers look over their notes to get a
bird‟s eye view of the various ideas and their relationships, check
memory by covering up the notes and trying to recall the main points,

16
and when readers have a textbook on which readers are tested at mid-
term and the end of the semester only, it is a good idea to review at the
end of each week, gradually accumulating several chapters to review
hence there is no need to “cram” for the exams (Nelson & Rachel,
2006:3).
c. SQ4R and Critical Thinking
One part of SQ4R, namely reflect there is a correlation. Information
from the entire chapter or article is linked together in the reflection
phase. This step helps students clarify their thinking and focus
understanding. By reflecting on the reading, students begin to think
critically about what they have learned and have yet to learn about the
topic. This type of critical thinking is necessary if students are to
become mature readers (Glass& Zygouris-Coe: 2005).
d. Strengths and Weakness of SQ4R
According to Kinanthi (2013:19) she stated the added value of this
method is reading by this technique believed more satisfied, because
this method can force someone more comprehend what they read,
directed to the abstract or the implicit and explicit main content in
books or text. Accept that, the steps in this method looks describing the
science procedure, and hoped the information which have been learned
saved well on a long term memory system.

17
1. The Procedures in Using SQ4R in Class Room
Table below are steps in SQ4R Strategy learning:
Table 2.1 Reading Strategy (SQ4R) Teaching Procedures
No Researcher’s Activity Activity
1. INTRODUCTION
a. Explaining
purpose of the
study.
b. Motivating the
students.
a. In learning process researcher inform the
students purpose of the study.
b. Researcher motivates students by telling
the important of this material.
2. MAIN ACTIVITY
a. Presenting the
material
b. Learning SQ4R
reading Strategy
a. Describing the material will be learned.
b. Giving a model of SQ4R reading
strategy and explaining the steps, using
an example from the material:
1. Survey
Researcher recommend students to check
the text, title, the body, terms, key words
using color marking pen.
2. Question
The second step, researcher gives clue or
simple example, clear, relevant with part
os the text have lighted by color marking
pen. Number of question is depended on
students‟ ability in understanding the
text.
3. Read
The third, teacher commends the
students to read main content of the text,
then actively search the answer based on
the questions they have arranged.

18
4. Reflect
The fourth step, during reading students
cannot only remember but teacher helps
them to connect known information that
correlated in daily activity, teacher tries
to use important words in the text. It is
aimed to solve the problem in the text.
5. Recite
At the fifth step, teacher command
students retell their answer and question
that have been arranged, teacher trains
students by the question to closed their
book or note they have made, if the
question cannot be answered students
may continue to the next question and so
on until the end of their questions.
6. Review
The final step, students are commanded
to read their short note (abstract) they
have made, reread all the text. If
necessary student reread their question
and answer shortly.
c. Students under research guided, doing
SQ4R skill, by doing on work sheet.
d. Researcher let students give a question
and answer each other about the text.
3. CLOSING
Summarizing the lesson
Researcher and student summarize the lesson
together where researcher guides the student
make it based on the material have been learned.

19
E. Critical Reading
1. Definition of Critical Reading
Pirozzi (2003: 325) stated that critical reading can be defined as very high-
level of written material requiring interpretation and evaluation skill that enable
the reader to separate important from unimportant information, distinguish
between facts and opinions, and determine a writer‟s purpose and tone. It also
entails using inference to go beyond what is stated explicitly, filling in
informational gaps, and coming to logical conclusions. Critical reading is an
essential part of the information gathering process that is required to create an
academically sound assignment. At its most basic level, critical reading involves
not taking for granted anything people read. Whenever people read a journal
article, or other piece of text, as readers need to be convinced by the author‟s
argument (Skill Development Team, 2014).
2. Teaching Critical Reading
In critical reading process reader should think and comment about writer‟s
message‟s and why writer about this subject. In this context, reader evaluate the
text while reading, view the text about own knowledge. It is called by critical
thinking habit. Critical reading is importent for both critical thinking and provide
most pleasure from reading. Reader who do not read critically generally accept the
ideas in the text incontestable and memorize, reader who read critical watch out
the text what it tell about, which idea support them and how the ideas describe
(Gunes, 2014).
Textbooks on critical reading commonly ask students co accomplish
certain goals: 1) to recognise an author‟s purpose, 2) to understand tone and
20
persuasive elements, 3) recognise bias. Notice that non of these goals actually
refers to something on the page. Each requers inferences from evidence within the
text:
a. Recognising purpose involves inferring a basis for choices of content and
language
b. Recognising tone and pesuasive elements involves classifying the nature
of language choices
c. Recognising bias involves classifying the nature of pattern of choice of
content and language.
Critical reading is not simply close and careful reading. To read critically,
one must actively recognise and analyse evidence upon the page. Critical readers
thus recognise not ony what a text says, but also how that text portrays the subject
matter. They recognise the various ways in which each and every text is the
unique creation of a unique author (Lewis, 2009: 10). In teaching ctitical reading
students need strategies which can forch and lead them to be critical readers.
Whatever students‟ reason for reading the paper, students own critical
assesment of it is very importent. According Lewis (2009: 10) one useful trick is
read the experimental results, the tables, and figures together with their legends, at
least as closely as the main text. Another is to avoid reading the disscussion
section until readers have come with exclusively on the author‟s view. When
readers read the abstract, they should ask themselves the question: “what
contriversy or orthodoxy does this research take as its starting point?” while the
21
abstract should give readers a brief summary of a paper‟s main findings, the
introduction give some context to the research.
3. Critical Reading and Critical Thinking
According to Lewis (2009: 6), he distinguishes between ctitical reading
and critical thinking in the following way:
a. Critical reading is technique for discovering information and ideas within
a text.
b. Critical thinking is a technique for evaluating information and ideas, for
deciding what to accept and believe.
Critical reading refers to careful, active, reflective, analitic reading.
Critical thinking involves reflecting on the validity of what readers have read in
light of readers‟ prior knowledge and understanding of the world. By these
definitions, critical reading would appear to come before critical thinking: only
once readers have fully understood a text (critical reading) can readers truly
evaluate its assertions (critical thinking).
4. Critical Reading Activities
In actual preactise, critical reading and critical thinking work together
(Jones: 2009: 7). Activities to do with student to encourage and develop critical
reading ability (Salisbury University).
a. Previewing: Learning about a text before really reading it.
Previewing enables readers to get a sense of the text is about and how it is
organized before reading it closely. This simple strategy includes seeing
what readers can learn from the headnotes ot other introductory material,

22
skimming to get an overview of the content and organization, and
identifying the rhetorical situation.
b. Contextualizing: Placing a text, readers read in its historical,
biographical, and culture context.
When readers read a text readers read it through the lens of readers‟ own
experience. Readers‟ understanding of the the words on the page and their
significance is performed by what readers have come to know and value
from living in a special period and place. But the texts readers read were
all writen in the past, sometimes in a radically different period and place.
To read critically, readers have to contexttualize, to recognize the
differences between readers‟ contemporary values and attitudes and those
represented in the text.
c. Questioning to understand and remember: Asking questions about the
content.
Hopefully students in some classes will as the teachers questions about the
content of their readings, or at least the teachers will quiz them on what
they are supposed to be reading. These questions should be designed to
help students understand a reading and respond to it more fully, andoften
this technique works when the questions are relevant and appropriately
phrased. When students need understand and use new information though
it is most beneficial if the teachers encourage them to write the questions
that they are asking themselves as they read the text for the first time. With
this strategy, they can write questions any time, but in difficult academic

23
readings, they will understand the material better and remember it longer if
they write a question for every paragraph or brief section. Each question
should focus on a main idea, not on illustrations or details, and each should
be expressed in their own words, not just copied from parts of the
paragraph.
d. Reflecting on challenges to readers‟ beliefs and values: Examining
readers’ personal responses.
The reading that readers do for the class might challange readers‟ attitudes,
their unconsciously held beliefs, or their position on current issues. As
people read a text for the first time, mark an X in the margin at each point
where readers feel a personal challange to their attitudes, beliefs, or status.
Readers make a brief note in the margin about what they feel or about
what in the text created the challenge. Readers should look again at the
places they marked in the text where they felt personally challenged then
they will see some patterns.
e. Outlining and summarizing: Identifying the main ideas and restating them
in readers’ words.
Outlining and summarizing are especially helpful strategies for
understanding the content and structure of a reading selection. Whereas
outlining reveals the basic structure of the text, summarizing synopsizes a
selection‟s main argument in brief. Outlining may be part of annotating
process, or it may be done separately. The key to both outlining and
summarizing is being able to distinguish between the main ideas and the
24
supporting ideas and examples. The main idea from the backbone, the
strand that holds the various parts and pieces of the text together. Outlining
the main ideas help readers to discover the structure. When readers make
an outline, readers may not use the text‟s exact words. Summarizing
begins with outlining, but instead of merely listing the main ideas, a
summary recomposes them to form a new text. Whereas outlining depens
on a close analysis of each paragraph, summarizing also requires creative
synthesis. Putting ideas togther again in readers‟ own words and in a
condensed form shows how reading critically can lead to deeper
understanding of any text.
f. Evaluating an argument: Testing the logic of a text as well as its credibility
and emotional impact.
All writers make assertions that they want readers to accept as true. As a
critical reader, people should not accept anything an face value but to
recognize every assertion as an argument that must be carefully evaluated.
An argument has two essential parts: a claim and support. The claim
asserts a conclution an idea, an opinion, a judgment, or a point of view that
the writer want readers to accept. The support includes reasons (shared
beliefs, assumtions, and values) and evidence (fact, examples, statistics,
and authorities) that give readers the basis for accepting the conclusion.
When readers asses an argument, they are concerned with the process of
reasoning as well as its truthfulness (these are not the same thing). At the
most basic level, in order for an argument to be acceptable, the support

25
must be appropriate to the claim and the statements must be consistent
with one another.
g. Comparing and contrasting related readings: Exploring likenesses and
differences between texts to understand them better.
Many of authors are concerned with the same issues or questions, but
approch how to discuss them in different ways. Fitting a text into an on
going dialectic helps increase understanding of why an author approched a
particular issue or question in the way he or she did.
5. Critical Reading Test
According to Green (2006) stated critical reading tries to measure
students‟ ability to reason using facts that are part of students‟ general
knowledge. The assessment tests are essentially multiple-choice tests.
Students‟ score depends upon how many correct answers students get
within a definite period of time. Speed is importent, but also is accurasy.
Students have to pace themselves so that students do not sacrifice speed to
gain accuracy (or sacrifice accuracy to gain speed). Critical reading test is
harmony of both. Based on the explainatin in teaching critical reading,
some indicator can be used as indicator of critical readers are 1) students
are able to recognise an author‟s purpose, 2) students are able to
understand ton and persuasive elements, 3) students are able recognise
bias.
26
CHAPTER III
RESEARCH METHOD
In this chapter, writer will present research design, population and sample,
research instrument, data collection procedure, and data analysis procedure.
A. Research Design
The design of this study is experimental design. According to Arikunto
(2002:272) experimental study is a study which aimed to know there is or not the
effect of variable studied. The study used the experimental design because this
study measured the effect of using SQ4R reading technique in teaching critical
reading. This experiment involved the comparison of the effects of particular
treatment with that of a different treatment or without treatment. Quasi
experimental design are similar to randomized experimental design in they
involve manipulation of an independent variable, but different in that subjects are
not randomly assigned to treatments group (Donald, 2010:316). This study used
the quasi experiment, because this compared two ways and measured the
effectiveness of teaching reading using that way. The characteristics of Quasi-
Experimental Design are: 1). having more than one variable, 2). having control
group, 3). independent variable is manipulated, 4). and the other variables are
controlled (Sukardi, 2007:181).
The study used quasi experiment that means this study uses nonrandomized
control group; pretest-posttest design is one of the most widely used quasi
experimental design in educational research (Alison, 2005: 146). The typical
group situation, the classes cannot be reorganized to accommodate the study. In
27

27
such this case, the groups already organized into classes. There were two groups
in this model. They were experiment group and control group. Pre-test was given
for both groups to measure the score of students before treatment given.
Experiment group was given treatment by SQ4R reading strategy and control
group taught without SQ4R reading strategy (Self Monitoring Using Question
Strategy). Post-test was given for both groups to measure the students score after
treatment is given.
Table 3.1 Scheme of Quasi Experimental Design
Nonrandomized Control Group, Pretest-Posttest Design
Group Pre-test Independent Variable Post-test
E Y1 X Y2
C Y1 - Y2
Where:
C = control
E = experiment
Y1 = test
Y2 = test
X = independent variable
B. Population and Sample
1. Population
Arikunto (2000:108) stated population is defined as all members of any well
defined class of people, events or subjects. If someone wants to research all of the
elements in research area the research is call population research on survey study.
It means population is all individuals from the data are collected. The population
28
of the research was the fifth semester of ESL students of English education
department in State Islamic Institute of Palangka Raya academic year 2017-2018.
There are about 34 students divide into 3 classes.
2. Sample
Sample is the small group that is observed (Ery, 2010: 316). Because of the
large number of population, the study took samples as the representative
population. Nunan (1992:232) stated sample is a subset of individuals or case
from within a population. Students in the fifth semester of ESL students of
English education department in State Islamic Institute of Palangka Raya
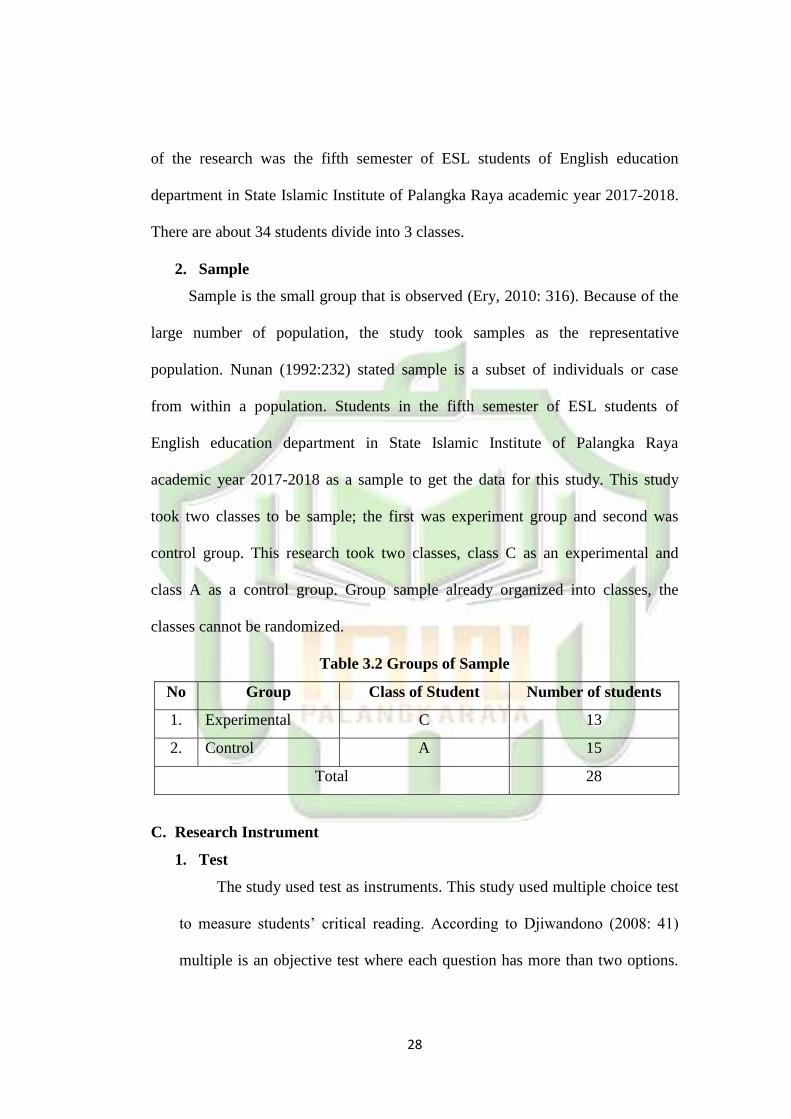
academic year 2017-2018 as a sample to get the data for this study. This study
took two classes to be sample; the first was experiment group and second was
control group. This research took two classes, class C as an experimental and
class A as a control group. Group sample already organized into classes, the
classes cannot be randomized.
Table 3.2 Groups of Sample
No Group Class of Student Number of students
1. Experimental C 13
2. Control A 15
Total 28
C. Research Instrument
1. Test
The study used test as instruments. This study used multiple choice test
to measure students‟ critical reading. According to Djiwandono (2008: 41)
multiple is an objective test where each question has more than two options.

29
From all the options only one as the correct answer. Experiment and control
group were given pretest and posttest. The pretest was given before giving
treatment. The function of pretest to know students‟ critical reading ability
score before giving treatment. Posttest was given after giving treatment. The
function of posttest to measure the improvment after giving treatment.
D. Instruments Try Out
The instrument was tried before applying to sample
Table 3.3 Content Specification of Items Tryout Instruments
Skill to Measure Level of
Comprehension
Percentage
(%)
Number of the test items
Critical Reading
Comprehension
Literal 48,75
1, 2, 3, 4, 6, 13, 14, 16, 17,
18, 19, 20, 21, 24, 27, 32,40,
46, 48, 50, 52, 53, 55, 56, 57,
58, 59, 61, 62, 63, 64, 66, 67,
68, 69, 71, 73, 74, 80.
Critical 51,25
5, 7, 8, 9, 10, 11, 12, 15, 22,
23, 25, 26, 28, 29, 30, 31, 33,
34, 35, 36, 37, 38, 39, 41, 42,
43, 44, 45, 47, 49, 51, 54, 60,
65, 70, 72, 75, 76, 77, 78, 79.
a. Research Instruments Reliability
Heaton (1974:155) Reliability is necessary of any good test: for it to be valid
at all, a test must be reliable as measuring instrument. Sugiyono (2013:118)
reliability is often defined as the consistency and stability of the data finding.
From positive perspective, reliability typical is consider to be synonym with
the consistency of the data produced by observation made by different

30
researchers, by the same researcher at different times, or by splitting a data set
in two part. According to Johnson (2009:54), to measure the reliability of the
whole test can be estimated by using Spearman-Brown formula.
Spearman-Brown formula:
Where:
= Reliability of instrument
= Coefficient Correlation
After calculating the instrument reliability, than compared with rtable.
The qualification of reliability (Qodir, 2009:88)
= Very High Reliability
= High Reliability
= Fair Reliability
= Poor Reliability
= Very Poor Reliability
b. Index Difficulty
Index of difficulty was used to know whether the tests are too easy or too
difficult. So, to know it, this study used following formula:
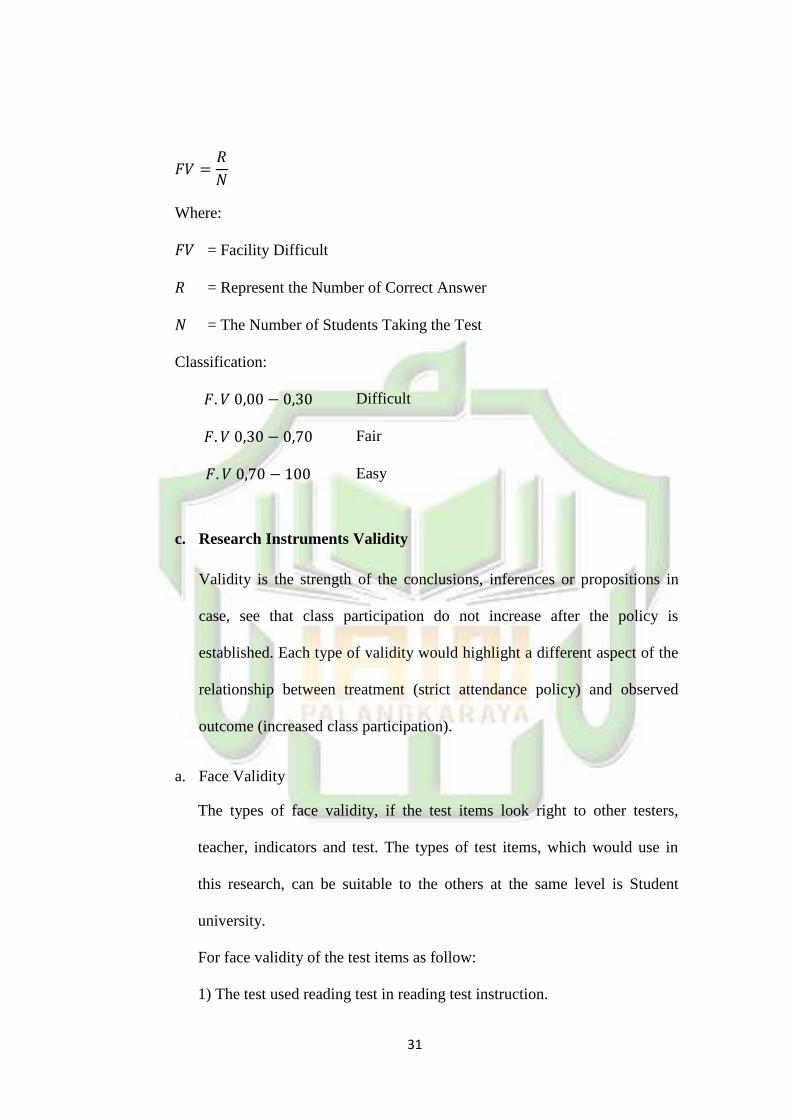
31
Where:
= Facility Difficult
= Represent the Number of Correct Answer
= The Number of Students Taking the Test
Classification:
Difficult
Fair
Easy
c. Research Instruments Validity
Validity is the strength of the conclusions, inferences or propositions in
case, see that class participation do not increase after the policy is
established. Each type of validity would highlight a different aspect of the
relationship between treatment (strict attendance policy) and observed
outcome (increased class participation).
a. Face Validity
The types of face validity, if the test items look right to other testers,
teacher, indicators and test. The types of test items, which would use in
this research, can be suitable to the others at the same level is Student
university.
For face validity of the test items as follow:
1) The test used reading test in reading test instruction.

32
2) The form of the test items answers the multiple choices.
4) The Language of items used English.
5) The critical reading test was suitable with syllabus of critical reading for
fifth students of English Education Department of State Islamic Institute of
Palangka Raya.
b. Content Validity
The test item in this study to measure the students‟ critical reading score.
The instrument was adobted from Barron‟s Critical Reading Workbook for
the SAT. The instrument was used for university level and used by lecturer
in IAIN Palangka Raya. The instrument which used test, the tasting of
content validity was done by asking the opinion of the judgment experts
about the instrument is able to try out or not.
Table 3.4 Content Specification of Items Research Instruments
Skill to
Measure
Level of
Comprehension
Percentage
(%)
Number of the Test Items
Critical Reading
Comprehension
Inferential 57,5
1, 2, 3, 5, 8, 9, 10, 11, 12,
13, 17, 22, 24, 26, 27, 29,
30, 31, 32, 33, 34, 35, 36
Critical 42,5
4, 6, 7, 14, 15, 16, 18, 19,
20, 21, 23, 25, 28, 37, 38,
39, 40
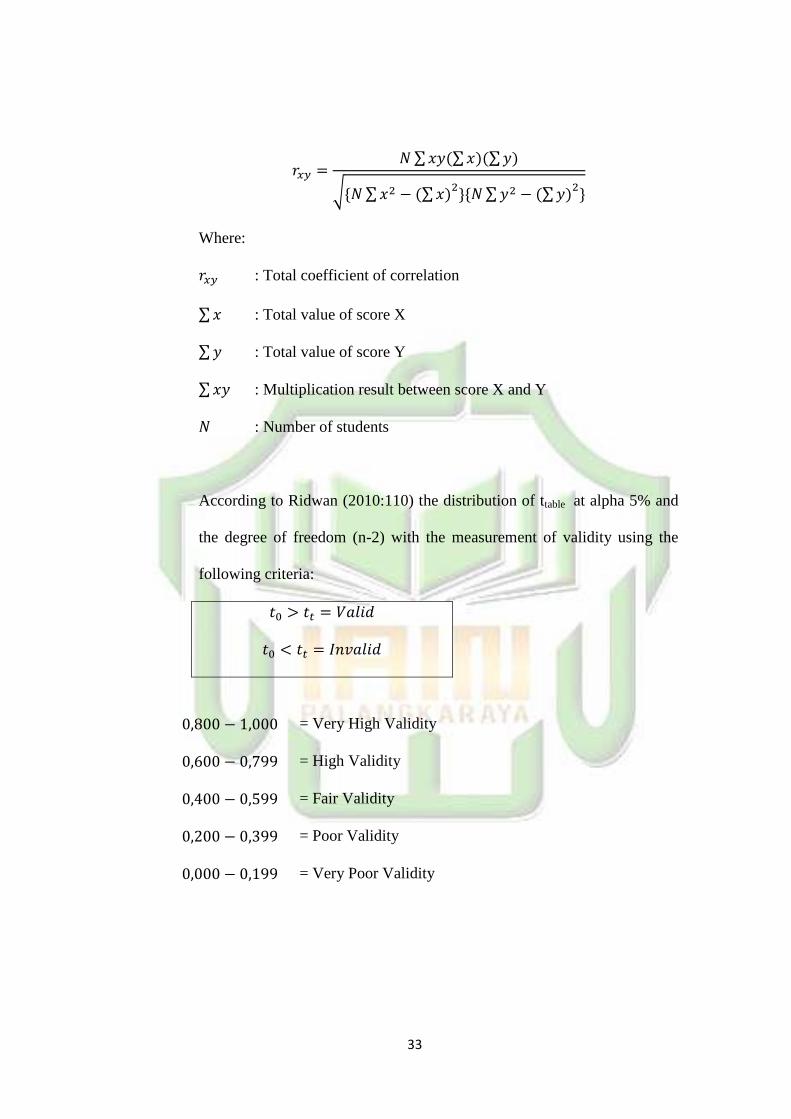
c. Construct Validity
To measure instrument validity, this study used formula of Product
Moment by Pearson (Sudijono, 2005:216):
33
∑ ∑ ∑
√ ∑ ∑ ∑ ∑
Where:
: Total coefficient of correlation
∑ : Total value of score X
∑ : Total value of score Y
∑ : Multiplication result between score X and Y
: Number of students
According to Ridwan (2010:110) the distribution of ttable at alpha 5% and
the degree of freedom (n-2) with the measurement of validity using the
following criteria:
= Very High Validity
= High Validity
= Fair Validity
= Poor Validity
= Very Poor Validity

34
E. Data Collection Procedure
In collecting the data of this study, this study took the data from pre-
test and post-test. Pre-test is given to the subjects before doing teaching and
learning process (treatment). Meanwhile, post-test was given after applying
teaching and learning process (treatment).
In this study was going to apply steps as follow:
1. A pre-test was given to both classes (experimental and control) class.
2. The writer checked the result of pre-test of experimental and control class.
3. After the pre-test given, the writer teached the students in experimental
class by using SQ4R reading strategy and control class without using
SQ4R reading strategy (Self Monitoring Using Question Strategy).
4. Then, the students did last critical reading test in the post-test.
5. The posttest was evaluated and analyzed the obtained data from mean of
post-test score both of the class.
6. The results were interpreted in statistical data.
7. Finally, the students‟ scores were compaired in the pre-test and post-test. It
was done to know whether the students‟ scores in experimental class were
higher or not than students‟ scores in control class.
F. Data Analysis Procedure
The Method of data analysis uses the statistical procedures. The
formula that was used is a t-test. The purpose was to find the significant
differences of critical reading ability between experimental group and control
group.

35
The data of this study was students‟ critical reading ability score.
Therefore, the data were in quantitative data. The data were analyzed by
means of inferential statistics. This statistical analysis was suitable to answer
the research problem.
1. The research gave test to the students of fifth semester of English
Education Department of State Islamic Institute Palangka raya.
2. The research collected the data of the students‟ test result.
3. The research gave score the students‟ test results by using formula.
4. The research tabulated the data into the distribution of frequency of score
table, then looking for the mean, median and modus of students‟ score,
standard deviation, and standard error of experiment group and control
group.
5. The research discussed and concluded the result of data analysis.
6. Normality Test
This test was used to know normality of the data. In this study, the
normality was to tested by using SPSS 17.0 program using Spharo Wilk
with level of significance 5%. If the calculation result of asymptotic
significance is higher than α (5%), it means the distribution data is normal.
The other way, if the result of asymptotic significance is lower than α
(5%), it means the distribution data is not normal.
7. Homogeneity Test

36
For knowing whether experimental and control group have relatively same
variant in common or not is the function of homogeneity test. The study
used SPSS 17.0 program, Levene‟s testing with level of significance α
(5%). If in calculating found the result is higher than 5% degree of
significance, it means Ha is accepted. So, both of groups are homogeneous.
8. Testing Hypothesis
For testing the hypothesis, the study used T-test statistical with level of
significance 5%. Because the sample is less than 30 students, so for testing
the hypothesis the study used t-test. T-test was used to measure whether
SQ4R strategy was effective to increase students‟ critical reading scores.
The formula that used is based on the determination of Fvalue.
Formula:
Where:
F: Homogeneity
df1 : value of Ftable based on number of variable
df2 : degree of freedom
k : number of variable
n : number of sample

37
Formula:
If Fvalue > Ftable = equal variance:
√
(
)
If Fvalue < Ftable = unequal variance:
√
Where:
: The difference of two means
: Variance
: Number of students
If is accepted is rejected
If is accepted is rejected
9. Interpreted the result of t-test
According to Sudijono (1987:278) the degree of freedom (df) was
calculated by using following formula:
Where:
: Degree of freedom
: Number of subject group 1
: Number of subject group 2
2 : Number of variables

38
10. Making conclusion based on data analysis obtained
11. Comparing the data used SPSS 17.0 program.
12. Finally, discussing and concluding.

39
CHAPTER IV R ESEARCH FINDINGS AND D ISCU SSION
RESEARCH FINDINGS AND DISCUSSION
This chapter discusses the data that had been obtained from the research in
the field. It contains data presentation, research findings and discussion.
A. Data presentation
Here, the data will be described data improvement students‟ critical reading
comprehension after and before taught by using SQ4R strategy.
1. The Result of Pre-Test Score of the Control and Experiment Group
In this part, the data of control group consisted score the pre-test, the post-
test, and the comparison scores. Pre-test and the result of control group pre-test
conducted on Tuesday October 4th
in class A at 13.00-14.40 pm. Post-test was
conducted on Tuesday October 31st at 13.00-14.40 pm. The data are presented
below.
Table 4.1 the Comparison of Pre-test and Post-test Score of
Control Group
No Initial
Score
Pre-test Post-test Different
1 ENA 25 40 15
2 AR 37,5 25 -12,5
3 RDM. 22,5 22,5 0
4 YQ 45 25 -20
5 MI 35 30 -5
6 NH 25 32,5 7,5
7 ZSN 42,5 47,5 5
40

40
8 MH 17,5 17,5 0
9 AS 25 25 0
10 NF 22,5 27,5 5
11 ARS 20 30 10
12 ME 20 32,5 12,5
13 AW 25 25 0
14 IR 15 22,5 7,5
15 YSPSP 22,5 17,5 -5
SUM 400 420
Highest Score 45 47,5
Lowest Score 15 17,5
Mean 26,67 28
Standard Deviation 47,9 40,15
Standard Error 12,81 10,74
The table above described the comparison of critical reading comprehension
score between pre-test and post-test achieved by control group. First, in pre-test
score there was 1 student get score 15. There was 1 student gets score 17,5. There
were 2 students get score 20. There were 3 students get score 22,5. There were 4
students get score 25. There was 1 student get score 35. There was 1 student get
score 37,5. There was 1 student get score 42,5. There was 1 student get score 45.
Second, in post-test score there were 2 students get score 17. There were 2
students get score 22,5. There were 4 students get score 25. There was 1 student
get score 27,5. There were 2 students get score 30. There were 2 students get
score 32,5. There was 1 student gets score 40. There was 1 student gets score
47,5. The highest score from pre-test was 45 and the lowest score was 15.
Meanwhile, the post-test had the highest score was 47,5 and the lowest score was

41
17,5. If it is seen from the total score, the pre-test and the post-test have
improvement in score before and after getting the treatment.
For the table of pre-test above, it can be seen that students‟ score (100%)
were under score 50. The process to fine mean, standard deviation, and standard
error is in appendix.
a. The Result of Pre-test Score of Control Group (Class A)
Based on the data above, it has been known that the highest score was 45
and the lowest score was 15 in pre-test session. For determining the range of
score, the class interval, and temporary, the writer calculated the pre-test scores of
the control group using following formula (Sudijono, 2008:52):
The highest score (H) = 45
The lowest score (L) = 15
The range f score (R) =
=
=
= 31
The class interval (K) =
=
=
=
= 5
Interval of Temporary (I) =

42
Based on the calculation, the range of score was 31, the class interval was 5,
and interval of temporary was 6. Beneath was the table of frequency distribution:
Table 4.2 Frequency Distribution of the Pre-test Score of Control Group
Class
(K)
Interval
(I)
Frequency
(F)
Mid
Point
(X)
The
Limitation of
Each Group
Frequency
Relative
(%)
Frequency
Cumulative
(%)
1 2 42,5 13,33 100
2 2 36,5 13,33 86,67
3 0 30,5 0 73,34
4 7 24,5 46,67 73,34
5 4 18 26,67 26,67
∑ 15 100
The distribution of students‟ score in pre-test of control group can be seen in
following figure.
Figure 4.1 The Frequency Distribution of Pre-test of the Experimental Group
0
1
2
3
4
5
6
7
8
40-45 34-39 28-33 22-27 15-32
Frequency
frequency

43
b. The Result of Post-test Score of Control Group (Class A)
Based on the data above, it has been known that the highest score was 47,5
and the lowest score was 17,5 in post-test session. For determining the range of
score, the class interval, and temporary, the writer calculated the pre-test scores of
the control group using following formula:
The highest score (H) = 47,5
The lowest score (L) = 17,5
The range f score (R) =
=
=
=
The class interval (K) =
=
=
=
=
Interval of Temporary (I) =
Based on the calculation, the range of score was 31, the class interval was
5, and interval of temporary was 6. Beneath was the table of frequency
distribution:

44
Table 4.3 Frequency Distribution of the Post-test Score of Control Group
Class
(K)
Interval
(I)
Frequency
(F)
Mid
Point
(X)
The
Limitation of
Each Group
Frequency
Relative
(%)
Frequency
Cumulative
(%)
1 1 45 6,667 100
2 1 39 6,667 93,334
3 4 33 26,667 86,667
4 5 27 33,333 60
5 4 20,5 26,667 26,667
∑ 100
The distribution of students‟ score in post-test of control group can be seen
in following figure.
Figure 4.2 the Frequency Distribution of Post-test of the Control Group
2. The Result of Pre-test and Post-test Score of the Experiment Group
The pre-test was conducted to the Experimental group in class C on
Monday, October 3rd
2017 at 07.00-08.40 am. Meanwhile, post-test was done on
0
1
2
3
4
5
6
42.5-47,5 36.5-41.5 30.5-35.5 24.5-29.5 17.5-23.5
Frequensy
Frequensy

45
Monday October 30th
2017 at 07.00-08.40 am. The result of post-test are
presented in the following table.
Table 4.4 the Comparison of Pre-test and Post-test score of Experimental
group
No Initial
Score
Pre-test Post-test Improvement
1 RA 25 22,5 -2,5
2 MA 12,5 12,5 0
3 SNA 20 20 0
4 SMN 17,5 25 7,5
5 RRPL 30 15 -15
6 DM 20 22,5 2,5
7 RK 25 27,5 2,5
8 OD 32,5 30 -2,5
9 IS 21,5 15 -6,6
10 RHA 27,5 22,5 -5
11 SH 12,5 27,7 15
12 NH 35 17,5 -17,5
13 WS 22,5 20 -2,5
SUM 301,5 277,5
Highest Score 35 30
Lowest Score 12,5 12,5
Mean 23,19 21,35
Standard Deviation 30,51 22,81
Standard Error 8,82 6,59
The table above described the comparison of critical reading comprehension
score between pre-test and post-test achieved by experimental group. First, in pre-
46
test, there were 2 students get score 12,5. There was 1 get score 17,5. There were
2 students get score 20. There was 1 student get score 21,5. There was 1 student
get score 22,5. There were 2 students get score 25. There was 1 student get score
27,5. There was 1 student get score 30. There was 1 student get score 32,5. There
was 1 student get score 35.
Second, in post-test, there was 1 student gets score 12,5. There were 2
students get score 15. There was 1 student get 17,5. There were 2 students get
score 20. There were 3 students get score 22,5. There was 1student get score 25.
There were 2 students get 27,5. There was 1 student get score 30. The highest
score from pre-test was 35 and the lowest score was 12,5. Meanwhile, the post-
test had the highest score was 30 and the lowest score was 12,5. If it is seen from
the total score, the pre-test and the post-test have decrease in score before and
after getting the treatment.
For the table of pre-test above, it can be seen that students‟ score (100%)
were under score 50. The process to fine mean, standard deviation, and standard
error is in appendix.
a. The Result of Pre-test Score of Experimental Group (Class C)
To determine range of score (R), class of interval (K), interval of temporary
were calculated the pre-test scores of the experiment group using following
formula:
The highest score (H) = 35
The lowest score (L) = 12,5
The range f score (R) =
=
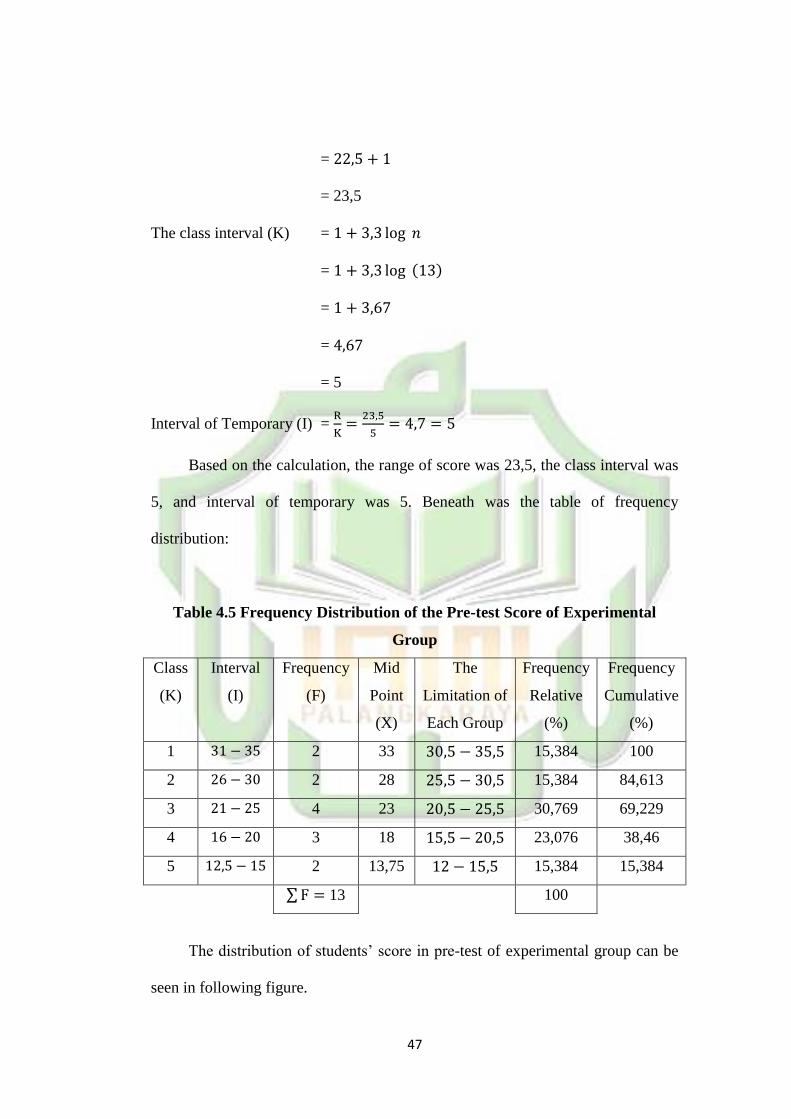
47
=
= 23,5
The class interval (K) =
=
=
=
= 5
Interval of Temporary (I) =
Based on the calculation, the range of score was 23,5, the class interval was
5, and interval of temporary was 5. Beneath was the table of frequency
distribution:
Table 4.5 Frequency Distribution of the Pre-test Score of Experimental
Group
Class
(K)
Interval
(I)
Frequency
(F)
Mid
Point
(X)
The
Limitation of
Each Group
Frequency
Relative
(%)
Frequency
Cumulative
(%)
1 2 33 15,384 100
2 2 28 15,384 84,613
3 4 23 30,769 69,229
4 3 18 23,076 38,46
5 2 13,75 15,384 15,384
∑ 13 100
The distribution of students‟ score in pre-test of experimental group can be
seen in following figure.

48
Figure 4.3 the Frequency Distribution of Pre-test of the Experimental Group
b. The Result of Post-test Score of Experimental Group (Class C)
The highest score (H) = 30
The lowest score (L) = 12,5
The range f score (R) =
=
=
=
The class interval (K) =
=
=
=
=
Interval of Temporary (I) =
0
0,5
1
1,5
2
2,5
3
3,5
4
4,5
31-35 26-30 21-25 16-20 12.5-15
Frequensy
Frequensy
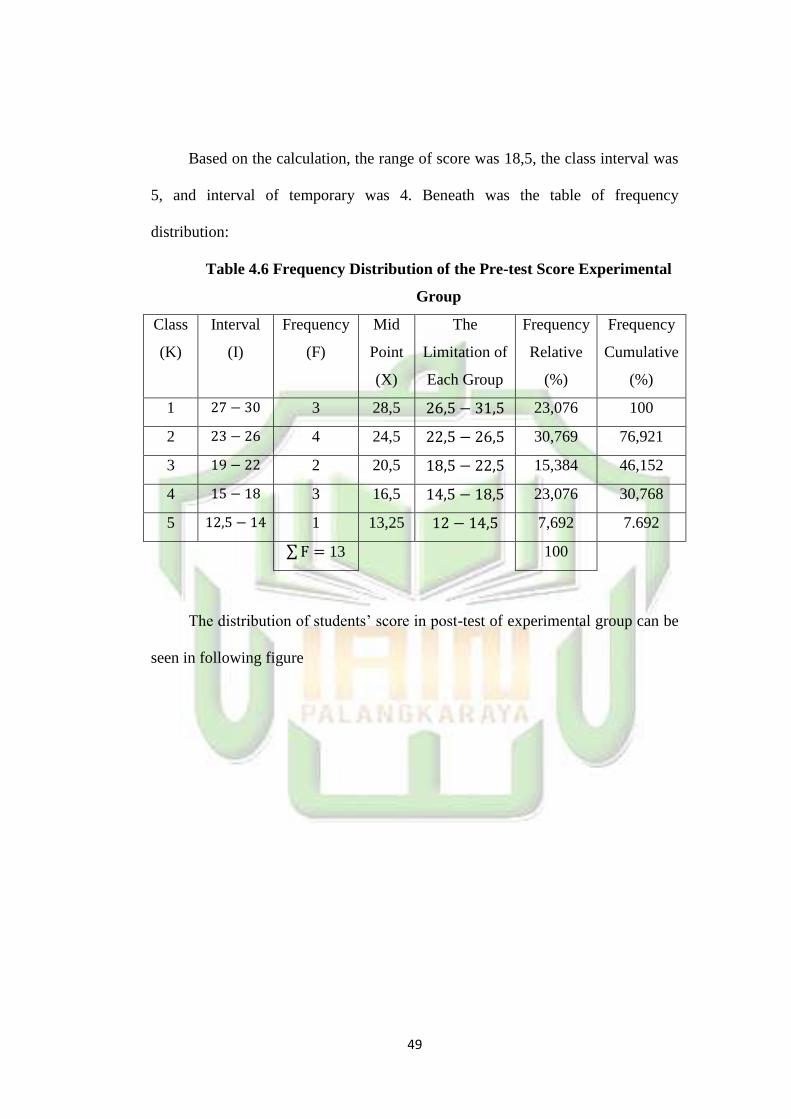
49
Based on the calculation, the range of score was 18,5, the class interval was
5, and interval of temporary was 4. Beneath was the table of frequency
distribution:
Table 4.6 Frequency Distribution of the Pre-test Score Experimental
Group
Class
(K)
Interval
(I)
Frequency
(F)
Mid
Point
(X)
The
Limitation of
Each Group
Frequency
Relative
(%)
Frequency
Cumulative
(%)
1 3 28,5 23,076 100
2 4 24,5 30,769 76,921
3 2 20,5 15,384 46,152
4 3 16,5 23,076 30,768
5 1 13,25 7,692 7.692
∑ 13 100
The distribution of students‟ score in post-test of experimental group can be
seen in following figure

50
Figure 4.4 the Frequency Distribution of Post-test of the Experimental Group
3. Comparison Between Control Group and Experiment Group at Post-
Test and Improvement
The scores are tabulated in comparison both of the group at post-test into the
table for calculating the improvement bellow:
Table 4.7 the Comparison Score of Pre-test and Post-test
No.
Control Group Experiment Group
Initial
Score
Initial
Score
Pre-
test
Post-
test
Imp Pre-
test
Post-
test
Imp
1 ENA 25 40 15 RA 25 22,5 -2,5
2 AR 37,5 25 -12,5 MA 12,5 12,5 0
3 RDM. 22,5 22,5 0 SNA 20 20 0
4 YQ 45 25 -20 SMN 17,5 25 7,5
0
0,5
1
1,5
2
2,5
3
3,5
4
4,5
27-30 23-26 19-22 15-18 12.5-14
Frequensy
Frequensy

51
5 MI 35 30 -5 RRPL 30 15 -15
6 NH 25 32,5 7,5 DM 20 22,5 2,5
7 ZSN 42,5 47,5 5 RK 25 27,5 2,5
8 MH 17,5 17,5 0 OD 32,5 30 -2,5
9 AS 25 25 0 IS 21,5 15 -6,6
10 NF 22,5 27,5 5 RHA 27,5 22,5 -5
11 ARS 20 30 10 SH 12,5 27,7 15
12 ME 20 32,5 12,5 NH 35 17,5 -17,5
13 AW 25 25 0 WS 22,5 20 -2,5
14 IRB 15 22,5 7,5
15 YSPSP 22,5 17,5 -5
SUM 400 420 301,5 277,5
Highest Score 45 47,5 35 30
Lowest Score 15 17,5 12,5 12,5
Mean 26,67 28 23,19 21,35
SD 47,9 40,15 30,51 22,81
SE 12,81 10,74 8,82 6,59
Note:
Imp : Improvement

52
SD : Standard Deviation
SE : Standard Error
The comparison of students‟ score in post-test both of the groups can be
seen in following figure.
Figure 4.5 the Comparison both of groups’ post-test scores
B. Research findings
1. Testing Normality and Homogeneity (Linearity)
a. Testing Normality and Homogeneity of Pre-test
This study, the result of pre-test and post-test scores of experimental
and control group calculated by using SPSS17.0. The homogeneity
was measured to know the normality of the data that is going to be
analyzed having normal distribution or not. The result of the test can
be seen in the following table.
0
50
100
150
200
250
300
350
400
450
Sum HighestScore
LowestScore
Mean St. Dev St. Error
Pre-test of Control Group
Post-test of Control Group2
Pre-test of Experimental GroupGroup2
Post-test of Experimental Group
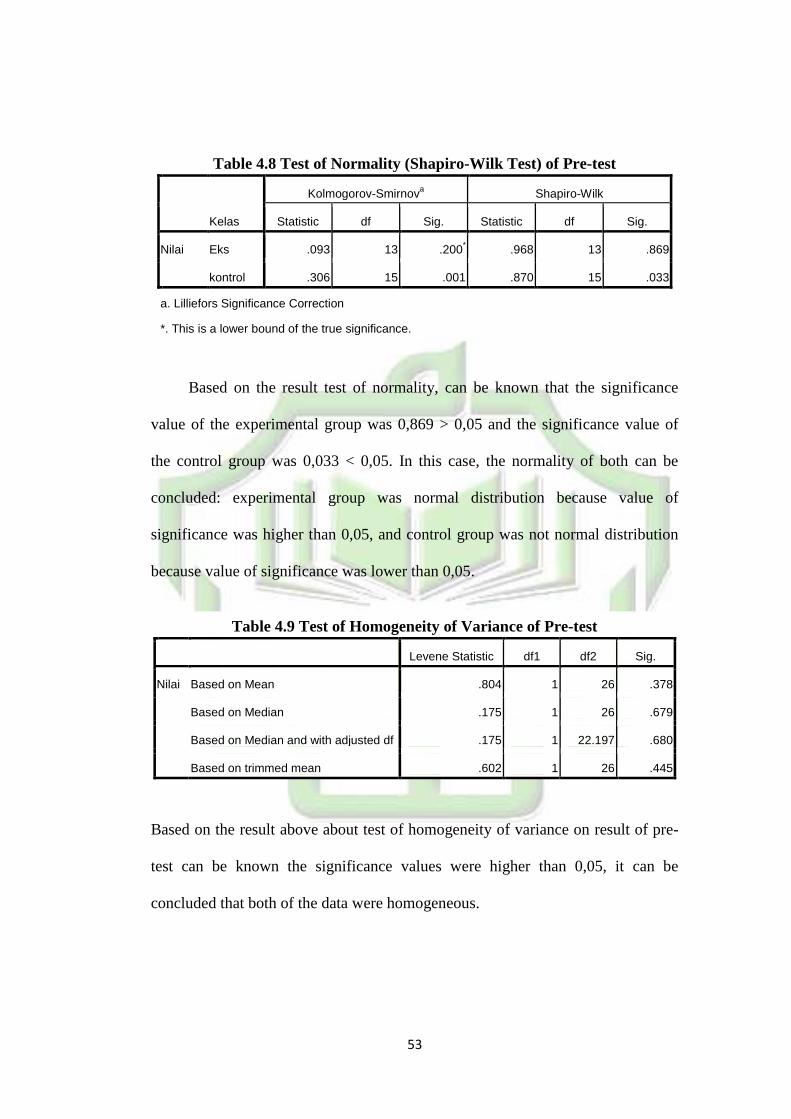
53
Table 4.8 Test of Normality (Shapiro-Wilk Test) of Pre-test
Kelas
Kolmogorov-Smirnova Shapiro-Wilk
Statistic df Sig. Statistic df Sig.
Nilai Eks .093 13 .200* .968 13 .869
kontrol .306 15 .001 .870 15 .033
a. Lilliefors Significance Correction
*. This is a lower bound of the true significance.
Based on the result test of normality, can be known that the significance
value of the experimental group was 0,869 > 0,05 and the significance value of
the control group was 0,033 < 0,05. In this case, the normality of both can be
concluded: experimental group was normal distribution because value of
significance was higher than 0,05, and control group was not normal distribution
because value of significance was lower than 0,05.
Table 4.9 Test of Homogeneity of Variance of Pre-test
Levene Statistic df1 df2 Sig.
Nilai Based on Mean .804 1 26 .378
Based on Median .175 1 26 .679
Based on Median and with adjusted df .175 1 22.197 .680
Based on trimmed mean .602 1 26 .445
Based on the result above about test of homogeneity of variance on result of pre-
test can be known the significance values were higher than 0,05, it can be
concluded that both of the data were homogeneous.
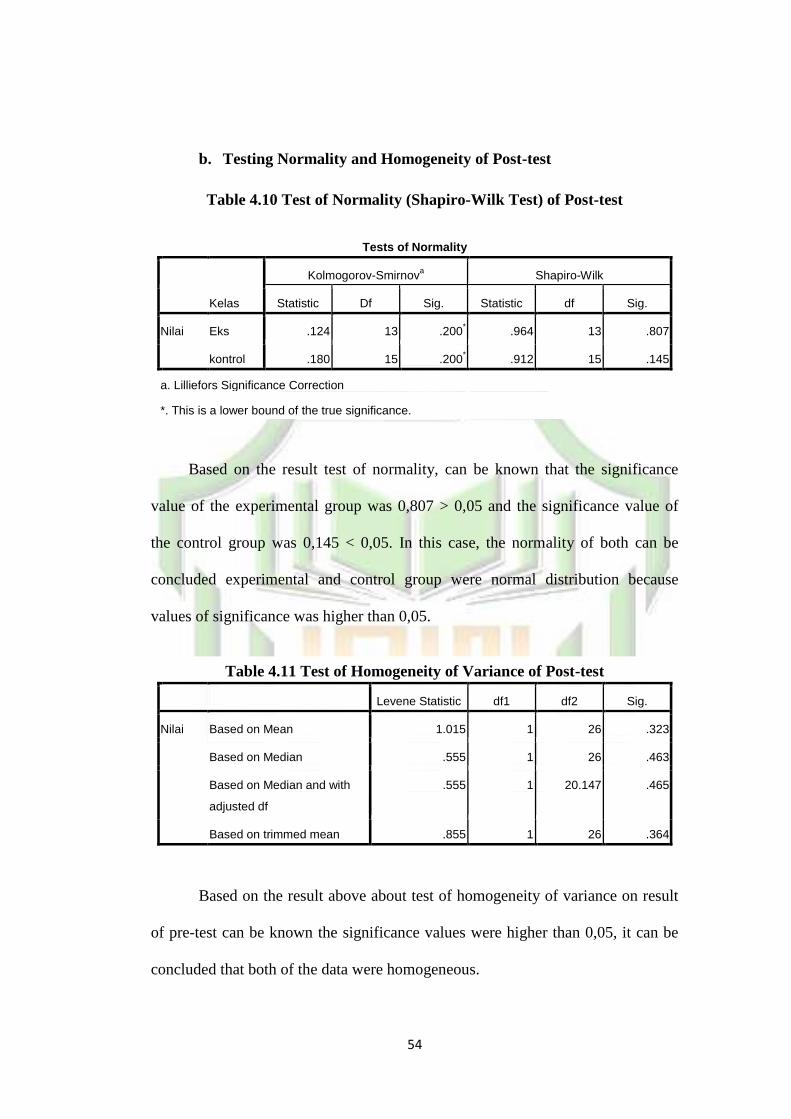
54
b. Testing Normality and Homogeneity of Post-test
Table 4.10 Test of Normality (Shapiro-Wilk Test) of Post-test
Tests of Normality
Kelas
Kolmogorov-Smirnova Shapiro-Wilk
Statistic Df Sig. Statistic df Sig.
Nilai Eks .124 13 .200* .964 13 .807
kontrol .180 15 .200* .912 15 .145
a. Lilliefors Significance Correction
*. This is a lower bound of the true significance.
Based on the result test of normality, can be known that the significance
value of the experimental group was 0,807 > 0,05 and the significance value of
the control group was 0,145 < 0,05. In this case, the normality of both can be
concluded experimental and control group were normal distribution because
values of significance was higher than 0,05.
Table 4.11 Test of Homogeneity of Variance of Post-test
Levene Statistic df1 df2 Sig.
Nilai Based on Mean 1.015 1 26 .323
Based on Median .555 1 26 .463
Based on Median and with
adjusted df
.555 1 20.147 .465
Based on trimmed mean .855 1 26 .364
Based on the result above about test of homogeneity of variance on result
of pre-test can be known the significance values were higher than 0,05, it can be
concluded that both of the data were homogeneous.

55
2. Testing Hypothesis
a. Testing Hypothesis Using Manual Calculation
Table 4.12 Standard Deviation and Mean of X1 and X2 of Critical Reading
Comprehension Score
Variable The Standard Deviation Mean (
X1
X2
Where:
X1 = Critical Reading Comprehension of Control Group
X2 = Critical Reading Comprehension of Experimental Group
Before finding value of tobserv the formula that used must be determined by using
following steps:
Where:
F : Homogeneity
S2 : Variance
If Fvalue < Ftable = equal variance
If Fvalue > Ftable = unequal variance

56
Based on the calculating above known that Fvalue = 0,57 df1 and df2 in Ftable
is 4,23 (look at F table). So, Fvalue < Ftable (0,57 < 4,23) means variance was equal
or homogeneous.. Then, to get the value of to, it was inserted to following
formula:
Calculating to using comparison the number of sample and homogeneity of
variances or not and
or not. Based on the data, this study
used and
(Purwanto, 2010:199)
√
(
)
√
(
)
√
√

57
√
If to ≥ ttable, Ha is accepted and Ho is rejected.
If to ≤ ttable, Ha is rejected and Ho is accepted.
Then, interpreting the result of t-test is to account the degree of freedom (df)
this study used following formula:
)
Table 4.13 the Result of T-test
tobserved Ttable (5%) Ttable (1%) df/db
2.056 2,779 26

58
Where:
tobserved : The Calculated Value
Ttable : The Distribution of tvalue
df/db : Degree of Freedom
Based on the manual calculating, can be known that t observe is greater than t table.
Picture 4.1 Applying two tails test
Based on the calculation of hypothesis test, can be known that the value of tobserve
was higher than the value of ttable at significance level or
It can be concluded that Ha was accepted and Ho was rejected.
accepted
H0 zone
2,056 -2,056
accepted
Ha zone accepted
Ha zone
-2,706 -2,706

59
b. Testing Hypothesis Using SPSS 17.0
To support the manual calculating the ttest, the study used SPSS 17.0 program.
Table 4.14 Standard Deviation and Standard Error of X1R and X2R Group
Statistic
Group Statistics
Class N Mean Std. Deviation Std. Error Mean
Value Exp Class 13 21.3462 5.36340 1.48754
Control Class 15 28.0000 7.97317 2.05866
Table 4.15 the Calculation T-test Using SPSS 17.0 Independent Sample Test
Independent Samples Test
Levene's Test for
Equality of Variances t-test for Equality of Means
F Sig. t df Sig.
(2-tailed) Mean
Difference Std. Error Difference
95% Confidence Interval of the
Difference
Lower Upper
Va
lue
Equal variances assumed
1.015 .323 -2.548 26 .017 -6.65385 2.61181 -12.02251 -1.28518
Equal variances not assumed
-2.620 24.609 .015 -6.65385 2.53986 -11.88899 -1.41870
The table above showed the calculation using SPSS 17.00 program.
If H0 accepted and Ha rejected
If Ha accepted and H0 rejected

60
Based on the result of hypothesis test calculation table above, it was found
that the result of post-test between experimental and control group had difference
score of variance that was lower than sig (0,17), so H0 was accepted and
Ha was rejected. The result of ttest was -2,548, mean difference between
experimental and control group was -6,65385, and standard error difference
between experimental and control group was 2,61181.
3. Interpretation
Based on manual calculating, the tables SPSS 17.0 program calculating and
picture showed that Ha was accepted and Ho was rejected. It could be interpreted
that SQ4R reading strategy has positive effect toward undergraduate critical
reading comprehension at fifth semester, IAIN Palangka Raya.
C. Discussion
It is seen that pre-test scores of students from the experimental and the
control groups do not have significant difference. Pre-test score average of
students from the experimental group was found to be 23,19 and that of the
students from control group was found to be 26,67. It shows that available
knowledge and critical reading of students from both groups are enough different
to each other. Then, post-test scores of students from the experimental and the
control groups have different significant different. Post-test score average of
students from the experimental group was found to be 21,35 and that of the
students from control group was found to be 28. It shows that knowledge and
critical reading of students from control is higher than experimental groups after
the treating. Based on the testing hypothesis, T count was bigger than t-table with

61
5% (-2,706 > 2,056) at degrees of freedom 26. T count was negative that means
control group‟ scores were higher than experimental group. Ho was rejected since
Pvalue < 0,05 (0,017 < 0,05). It meant there was difference between average score
of experimental group and control group. Value of tobserv was negative that means
experimental group‟s score was lower than control group. The difference of
average (mean difference were -6,65 (21,35-28), and the difference was -12,02
until -1,29. The fact really proved that SQ4R increased students‟ critical reading
comprehension since it gave positive effect toward the students‟ achievement in
reading lesson, even the score as the experimental group was lower than control
group. The previous studies are tabulated in comparison the result of this thesis
into the table of significant bellow:
Table 4.16 Comparison between the Previous of Study and the Result of the
Study
No Previous Study Result Result of This Thesis Conclusion
1 Ferez (2010) Significant
Significant
SQ4R technique is
recommended to be
applied to increase
undergraduate students‟
critical reading.
2 Putra (2013) Significant
3 Kinanthi (2013) Significant
4 Pardede (2013) Significant
5 Negara (2014) Significant
6 Rustiana (2014) Significant
7 Novita (2015) Significant
8 Runiatun at al.
(2016)
Significant
9 Gurbusz (2017) Significant
62
According to the studies, a conclusion was made that this reading strategy
provides positive contributions to the reading process. A study by Runiatun et al.
(2016) determined that the strategy during reading contributes to the
comprehension. Gurbusz (2017) concluded in his study the SQ4R strategy
contributes to the upper cognitive development in his country students, Turkey.
All these results show that reading comprehension strategy has a positive and
significant impact on critical reading comprehension skill.
63
CHAPTER V C ONCLU SION AND SUGESTION
CONCLUSION AND SUGESTION
In this chapter, will be presented conclusion and suggestion for students,
teachers or lecturers, and future researchers.
A. Conclusion
Based on the study was presented and calculated using T-test, the result can be
showed as following points:
1. There was significant effect of SQ4R toward students‟ critical reading
comprehension that applied on fifth semester students of English
department at IAIN Palangka Raya. Ha was accepted and Ho was rejected.
This study must be admitted that the result was not optimal, because some
cause from the students themselves. During the treatment there some
different reaction from the student. And also when the students did the
post test. A half of them did it less than an hour and without spirit.
B. Suggestion
This study is hope can be studied by students to better research. According to the
findings of the study the writer have suggest for the students, lecturers, and next
researchers.
1. For the students
The students still have some task to train their ability in critical reading
comprehend. To be a critical reader is not easy, but there is nothing
64

64
something impossible. Reading fluency is needed during the test. Many
factors can be the cause of the result. So, students need to practice more.
2. For Lectures
This study is hoped give contribution to lecturer in teaching reading class.
Reading strategy that used here can be used by lecturers to help students to
be better critical readers. Lecturers are hoped to find others appropriate
strategy to teach students.
3. For the next researchers
Based on the scope and limitation of the study, so the finding of this study
was limited only to measure the effect of SQ4R toward undergraduate
students‟ critical reading comprehension. This study did not elaborate
students‟s attitude and psychology on the treatment process. Then, the
study used quasi experimental and the sample are fifth students, so the
next researchers are hoped to continue to deep research on aspects that
have not observed by writer of this thesis.
65
REFERENCES
Alison Mackey and Susan M. Gass. 2005. Second Language Research
Methodology and Design, London.
Ary. Donald, (et, all), 2010 “Introduction to Research in Education (Eight
edition)”, United State: Wadsworth (engange learning).
Brown, D. H. 2001. Teaching by Principles: An Interactive Approach to
Language Pendagogy. San Francisco: San Francisco Stated University.
Critical thinking value rubric. Association of American College and university
Djiwandono, M. S. 2008. Tes Bahasa (Pegangan Bagi Pengajar Bahasa).
Malang: PT Indeks.
Donal Ary, (et, all),. 2010. Introduction to Research in Education, USA:
Wadsworth Cengange Learning.
Donald Ery. . 2011. Introduction to research in Education. Canada. Nelson
Education
Facione A Peter., Measured Reasons and the California Academic Press,
Millbrae, CA.
Fauziati. E. 2002. Teaching English as a Foreign Language. Surakarta:
Muhammadiyah University Press.
Ferez, N.A.G. 2010. Promoting Critical Thinking Skills through Reading
Comprehension. Bucaramanga: Universidad Industrial De Santander.
Glass, c. and Zygouris-Coe, V. 2005. Survey, Question, Read, Review, Recite,
Reflect.
Gunes, A., & Gunes, F. 2014. Teaching Critical Reading in Schools and Associate
with Education. Kastamonu: Kastamonu University
Gurbuz, M. 2017. Effect of the SQ4R Technique on the Reading Comprehension
of Elementary School 4th
Grade Elementary School Students. International
Journal of Instruction. Turky: Prof. Usak University, 10(2).
http://duwiconsultant.blogspot.co.id/2011/11/independent-samples-t-test.html
http://ujidata.blogspot.co.id/2016/07/uji-t-dependen-berpasangan-manual-
dan.html
http://www.salisbury.edu/counseling/new/7_critical_reading_strategies.html
66
66
https://aksiomatik.wordpress.com/2016/09/08/uji-independent-sample-t-test-
secara-manual/
https://freelearningji.wordpress.com/2013/04/06/uji-t-dua-sampel/
J.B. Heaton. 1974. Writing Language English Test. London: Longman
Kinanthi, I.T. 2013. Keektifan Penggunaan Metode SQ4R dalam Pembelajaran
Kerampilan Membaca Bahasa Jerman di SMA Negeri 1 Sayegan Sleman.
Unpublished Thesis. Yogyakarta: Universitas Negeri Yogyakarta.
Kustiawati. 2011. The Correlation Between Reading Comprehension Ability and
Writing Ability at the Eight Grade Students of MTsN Maliku. Unpublished
Thesis. Palangka Raya: The State Islamic College of Palangka Raya.
Leatemia, M. 2013. Pengaruh Strategi SQ4R Tipe Bantuan Multimedia vs Buku
Teks, Pengetahuan Awal, Gaya Belajar Kolb Terhadap Hasil Belajar Bahasa
Inggris Teknik. Jurnal Pendidikan Humaniora. 1(4) : 426-436
Lewis, H., Macgregor, D., Jones, H. M., 2009. Critical Reading. Pdf
Lisna, The Effect of Reading Aloud Practice Toward Students’ Pronunciation
Mastery in Reading English Text By The Second Year students of Islamic
Junior High School of Al-Azhar in Anjir Serapat of Kapuas Regency,
Unpublished Thesis. Palangka Raya: IAIN Palangka Raya.
Miftahudin. 2011. Implementasi Metode Pembelajaran SQ4R Sebagai Upaya
untuk Meningkatkan Activitas dan Hasil Belajar Matematika Siswa Kelas
VII SMPMuhammadiyah I Depok Sleman. Unpublished Thesis. Yogyakarta:
Universitas Sunan Kalijaga.
Nunan, D. 1998. Language Teaching Methodology: A Text Book for Teachers.
London: International Book Distributor Ltd.
Nunan, David. 1992. Research Methods in Language Learning. Cambridge:
Cambridge University Press.
Pandjaitan, N.& Palandeng, R. 2006. SQ4R Method and Reading Comprehension
Developmentamong the Sophomore Business Studnets. Unpublished Thesis,
Bandung, Bandung: Universitas Indonesia.
Pardede, E.C.P. 2013. Efektivitas Metode Sq4r (Survey, Question, Read, Reflect,
Recite, Review) dalam Pembelajaran Memahami Teks Feature Kelas Vii
SMP Negeri 1 Sidikalang Tahun Pelajaran 2012/2013. Unpublished Thesis.
Medan: Universitas Negeri Medan.
Pirozzi, R. 2003. Critical Reading, Critical Thinking a Contemporary Issues
Approach. New York: Longman.

67
Pujiono, S. 2012. Berfikir Critis dalam Literasi Membaca dan Menulis Untuk
memperkuat Jati Diri Bangsa. Yogyakarta: FBS UNY.
Rifqiyana, L. 2015. Analisis Kemampuan Berfikir Kritis Siswa dengan
Pembelajaran Model 4K Materi Geometri Kelas VIII Ditinjau dari Gaya
Kognitif Siswa. Unpublished Thesis. Semarang: Universitas Negeri
Semarang.
Runiatun, Istiyati, S., Matsuri, and Sriyanto,M.I. 2015. Penggunaan Strategi Sq4r
(Survey, Question, Read, Reflect, Recite, Review) Untuk Meningkatkan
Keterampilan Membaca Pemahaman. Unpublished Article. Surakarta: Universitas
sebelas Maret.
Rustiana, R. 2014. Pengaruh Penggunaan Pembelajaran Kontekstual dengan
Teknik SQ4R Terhadap Peningkatan Kemampuan Pemahaman dan Berfikir
Kritis Matematis Siswa SMP Negeri 8 Kota Tasikmalaya. Unpublished
Thesis. Tasikmalaya: Open University
Sabarun. 2012. Improving the Students‟ Reading Comprehension Ability Through
SQ4R Strategy. Journal on English as a Foreign Language. Palangka Raya:
STAIN Palangka Raya, 2(1).
Skill Development Team. 2014. Introduction to Critical Reading. Wolverhamton:
University of Wolverhamton.
Sugiono, A. 1978. Pengantar Statistik Pendidikan, Jakarta: Rajawali Press.
Sugiyono. 2013. Metode Penelitian Pendidikan (Pendekatan Kuantitatif,
Kualitatif, dan R&D). Bandung: Alfabeta.
Suharsimi Arikunto. 2002. Manajemen Penelitian. Jakarta: PT. Rineka Cipta.
Sukardi. 2007. Metode Penelitian Pendidikan, Kompetensi dan Praktik, Jakarta:
Bumi Aksara.
Wulandari, s. 2012. The Effectiveness of SQ3R Technique toward the Students’
Reading Comprehension Ability of the Eighth Grade Students at SMPN 1
Basarang. Unpublished Thesis. Palangka Raya: The State Islamic College
of Palangka Raya.

68
APPENDIX
70