The effect of rhAPC on contractile tension: an in-vitro...
103
I The effect of rhAPC on contractile tension: an in-vitro sepsis model of cardiomyocytes and endothelial cells Von der Fakultät für Mathematik, Informatik und Naturwissenschaften der RWTH Aachen University zur Erlangung des akademischen Grades einer Doktorin der Naturwissenschaften genehmigte Dissertation vorgelegt von Master of Science Eylem Kurulgan Demirci aus Izmir, Turkey Berichter: Univ.-Prof. Dr. rer. nat. Jörg Mey, RWTH Aachen Univ.-Prof. Dipl. Ing. Dr. Werner Baumgartner, RWTH Aachen Prof. Dr. Dr (TR). Aysegul (Temiz) Artmann Tag der mündlichen Prüfüng: 22.05.2012 Diese Dissertation ist auf den Internetseiten der Hochschulbibliothek online verfügbar.
Transcript of The effect of rhAPC on contractile tension: an in-vitro...

I
The effect of rhAPC on contractile tension: an in-vitro sepsis model of cardiomyocytes and
endothelial cells
Von der Fakultät für Mathematik, Informatik und Naturwissenschaften der RWTH Aachen
University zur Erlangung des akademischen Grades einer
Doktorin der Naturwissenschaften genehmigte Dissertation
vorgelegt von
Master of Science
Eylem Kurulgan Demirci
aus
Izmir, Turkey
Berichter:
Univ.-Prof. Dr. rer. nat. Jörg Mey, RWTH Aachen
Univ.-Prof. Dipl. Ing. Dr. Werner Baumgartner, RWTH Aachen
Prof. Dr. Dr (TR). Aysegul (Temiz) Artmann
Tag der mündlichen Prüfüng: 22.05.2012
Diese Dissertation ist auf den Internetseiten der Hochschulbibliothek online verfügbar.
II
The effect of rhAPC on contractile tension: an in-vitro sepsis model of cardiomyocytes and
endothelial cells
by Eylem Kurulgan Demirci
-DEPARTMENT OF ZOOLOGY AND ANIMAL PHYSIOLOGY
RWTH AACHEN UNIVERSITY
-INSTITUTE FOR BIOENGINEERING, CELL BIOPHYSICS AND
MEDICAL & MOLECULAR BIOLOGY LABORATORY,
FH- AACHEN
Explanation
All the experiments in this work have been done from July 2005 to 2011 at the Institute for
Bioengineering, Cell Biophysics and Medical & Molecular Biology Laboratory,
FH- Aachen under the supervision of Prof. Dr. Dr (TR) Aysegul Temiz Artmann
Eidesstattliche Erklärung
Hiermit versichere ich, dass ich die Dissertation selbstständig verfasst und keine anderen als die
angegebenen Quellen und Hilfsmittel benutzt habe.

III
For Taylan Demirci, 2011

IV
Acknowledgements:
I would like to thank to everybody who supported me during my studies and in the completion of
this thesis.
I would first like to thank Prof. Dr. Aysegul (Temiz) Artmann for her support, and for making it
possible for me to carry out my thesis work at her laboratory; and Prof. Dr. Jörg Mey for giving
me the opportunity to do my PhD at RWTH Aachen University.
I would also like to thank to all of the members of the Laboratory of Cellular Engineering for their
excellent team work, and for making my time at the laboratory so pleasant.
Finally, I want to thank my parents for their support, and my life friend, Taylan Demirci, for his
support in my scientific career, as well as in my life. In addition, I thank Basak Bayram for all of
her kind support, and hope to repay her great friendship.
V
Contents
Figure 1. Model of the inner and outer membranes of E. coli. ..................................................... 12
Figure 2. The structure of a sarcomere. ...................................................................................... 20 Figure 3. Actomyosin structure. .................................................................................................. 21
Figure 4. The ways in which target cells receive signals [72]. .................................................... 22 Figure 5. Regulation of MLC phosphorylation [78]. ................................................................... 24
Figure 6. Schematic view of the silicone ring body. ..................................................................... 43 Figure 7. The holder of the rings. ................................................................................................ 44
Figure 8. Schematic view of the body of the cellular tension measurement system. ...................... 45 Figure 9. Schematic view of the sample holder and laser system. ................................................ 46
Figure 10. DAQPad-6020E for data acquisition [60]. ................................................................ 47 Figure 11. The deflection versus pressure graph. (Software SubVI single scan). ......................... 50
Figure 12. Schematic view of the silicone membrane ring and respective pressure deflection
curve........................................................................................................................................... 50
Figure 13. Schematic view of the circle used to calculate strain/pressure of the cells. ................. 52 Figure 14. The triangulation principle of the CellDrum® system. ............................................... 52
Figure 15. The deflection/pressure ratio of the membrane .......................................................... 56 Figure 16. Strain graph for HAoEC after the application of certain chemicals............................ 58
Figure 17. F-actin stress fibers of HAoEC after the application of certain chemicals. ................. 59 Figure 18. Strain measurement of HAoEC after certain 2 U/ml thrombin application. ................ 59
Figure 19. Proliferation of endothelial cells after LPS application and rhAPC treatment. .......... 61 Figure 20. Proliferation of endothelial cells after LPS application and rhAPC treatment. .......... 62
Figure 21. HAoEC cytotoxicity and viability test after LPS application and rhAPC treatment..... 63 Figure 22. IL-6 level graph after LPS application. ...................................................................... 64
Figure 23. IL-6 level in medium after rhAPC treatment. ............................................................. 65 Figure 24. The mRNA expression level........................................................................................ 66
Figure 25. ROS production. ........................................................................................................ 67 Figure 26. Formation of actin stress fibers after thrombin application. ....................................... 68
Figure 27. Formation of actin stress fibers after LPS application. .............................................. 69 Figure 28. Actin stress fibers after rhAPC treatment. .................................................................. 70
Figure 29. Strain measurement results for endothelial cells after LPS application. ..................... 72 Figure 30. Strain measurements for endothelial cells with rhAPC treatment. .............................. 73
Figure 31. Proliferation of cardiomyocytes after LPS application and rhAPC treatment. ............ 76 Figure 32. Proliferation of cardiomyocytes after LPS application and rhAPC treatment. ............ 76
Figure 33. Proliferation of cardiomyocytes after LPS application and rhAPC treatment. ............ 77 Figure 34. Cardiomyocytes cytotoxicity and viability test after LPS application and rhAPC
treatment. ................................................................................................................................... 77 Figure 35. ROS production after LPS application. ...................................................................... 79
Figure 36. ROS production after rhAPC treatment. .................................................................... 80 Figure 37. mRNA expression level. ............................................................................................. 81
Figure 38. Actin stress fibers after LPS and rhAPC application. ................................................. 82 Figure 39. Beating frequency of cardiomyocytes after LPS application and rhAPC treatment. .... 83
Figure 40. Strain measurement results for cardiomyocytes after LPS and rhAPC application. .... 84

VI
Table 1. Normalized strain/pressure results after LPS application. The deflection/strain results of
for the LPS application groups were normalized with those of the control groups. 71
Table 2. Fold change contraction of normalization results. 71
Table 3. Normalized strain/pressure results after rhAPC treatment and LPS application. 73
Table 4. Absolute fold change strain measurements obtained from normalization results. 74
Table 5. Normalized strain results after LPS application and rhAPC treatment. 74
Table 6. Absolute fold change strain measurements obtained from of normalization results. 74
Table 7. Normalized strain results after rhAPC treatment and LPS application. 85
Table 8. Fold change strain measurements obtained from normalized results. 85
Table 9. Normalized strain results after rhAPC treatment and LPS application. 86
Table 10. Fold change strain measurements obtained from normalization results. 86
7
1. Introduction and Background
1.1 Objectives
Sepsis is the most common cause of death among patients in intensive care, due to multiple organ
dysfunction [1]. It is difficult to treat, and its incidence has steadily increased over the years. Since
it is characterized by hypotension due to endothelial barrier disruption, multiple organ dysfunction
and impaired cardiac contractility [2], hundreds of clinical trials have focused on endothelial cell
dysfunction [3] and cardiac depression [4]. Both endothelial dysfunction and cardiac depression
are regulated by mechanical properties of the cells such as contractile tension, and also involve
numerous signalling pathways.
Sepsis is the systemic inflammatory response to infection caused by excessive stimulation of
endotoxin [5]. The immune system is rapidly activated, resulting in the release of cytokines such
as TNF-alpha, IL-6 and IL-1Beta [6]. These cytokines help to control the infection by promoting a
number of pathways, including coagulation, oxidation, nitric oxide [7], reactive oxygen species
production [8], and activation of tissue factors [9]. These responses disrupt endothelial cells,
resulting in dysfunction, activation of coagulation and inflammation. Endothelial dysfunction
causes microvascular thrombosis, leading to cardiac dysfunction. Myocardial depression is a clear
and widely recognized sign of organ dysfunction in sepsis [7].
Once endothelial cells are activated, their surface becomes prothrombotic. Thrombomodulin
expression and EPCR expression are down-regulated, resulting in a decrease in the anticoagulant
and anti-inflammatory effects of the protein C pathway [10].
rhAPC has emerged as a novel therapeutic agent, indicated to improve survival in patients with
severe sepsis. In-vitro studies have shown that rhAPC has antiapoptotic, anticoagulant and anti-
inflammatory effects which cause cellular changes such as the enhancement of barrier function
and cytoprotection [11, 7]. Moreover, recent experimental studies have shown that APC induces
systemic and tissue inflammation and preserves cardiovascular function during experimental
endotoxemia [12, 13]. In addition, one group indicated that APC induces a positive inotropic
effect on cardiomyocytes which is dependent upon EPCR and PAR-1 pathways [20]. Although the
mechanisms underlying these pathways are not fully understood, sudden depletion of protein C
8
during sepsis might help us to understand better the importance of rhAPC. The administration of
rhAPC reduced mortality among treated versus placebo patients in the PROWESS trial [14, 15].
As previously indicated, many studies have investigated the effect of lipopolysaccharide (LPS)
and rhAPC through signaling pathways. Our study benefits from this earlier research, which
proves both our in-vitro sepsis model and the effect of rhAPC on this model. However, we have
chosen specifically to investigate the effect of LPS and the beneficial effect of rhAPC on
endothelial cells and the cardiomyocytes establishing an in-vitro sepsis model. The aim of this
project was to use the contractile tension measurements as a marker of mechanical properties of
cells. The mechanical properties of cells are strongly associated with diseases or syndromes like
sepsis. The multiple molecular mechanisms underlying disease offer many pathways which may
be used for diagnostic and therapeutic purposes, but which may also be very complex. This can
make it difficult to focus on one particular effect, whereas mechanical properties can give direct
information about diseases and the body’s response to treatments. It is also necessary to measure
contractile tension directly in order to understand how mechanical tension modulates a number of
cell-dependent processes during sepsis. For this reason, we have used the CellDrum® system to
measure the contractile tension of endothelial cells and cardiomyocytes after LPS application, and
after rhAPC treatment following LPS application. The reliability of the CellDrum® system was
validated by our preview studies [16, 17]. Our results support those of the previous studies [16,
17], which showed that LPS caused endothelial cell contraction that causes endothelial
permeability increase and cardiac depression that causes cardiogenic shock. Moreover, novel data
was found to demonstrate that APC inhibits the effect of LPS through the mechanical tension of
cardiomyocytes in vitro. We believe that the mechanical tension at the cellular level is an
important parameter to understand the full process and the problem and might help us in
diagnosis, treatment and prognosis of the diseases. These new results with endothelial cells and
cardiomyocytes are believed to shed new light on the mechanical properties of cells during
septicemia, which is crucial for improving the success of therapy.
1.2. Sepsis
The concept of sepsis was first recognized and described by Hippocrates, who defined it as the
breaking down of living tissue due to one of two contrasting processes [18, 19]. The first clinical
study of sepsis was carried out in 1982 [20, 21].
9
Today, sepsis is identified as a clinical syndrome due to the host response to infection, and is
known to be the major cause of death among critically ill patients [22, 23]. Although many studies
of sepsis have been made, the mortality rate among patients is still about 30-40%, which is very
high. It is estimated that in Germany approximately 60 000 [24] and in the USA more than 200
000 people die each year due to sepsis [25].
When a person develops an infection, the immune system is activated promptly in order to keep
infection localized [9]. Bacterial cell surface components (mostly lipopolysaccharide during
Gram-negative bacteria infections) are the key triggers for the immune response. A number of
mediators and cytokines such as TNF-alpha, IL-6, IL-8 and IL-1 are released to control and clear
the infection. The cytokines affect a number of pathways/processes such as coagulation, oxidation,
nitric oxide production, adhesion and apoptosis [26, 27]. Sepsis-increased pro-inflammatory
cytokines enhance the expression in endothelial cells of key adhesion molecules, including ICAM-
1, P-selectin and E-selectin [25]. The mediators and cytokines induce the expression of tissue
factors on vascular monocytes, activating the coagulation system and endothelial cells [28]. The
activation of inflammation and coagulation pathways leads to an increase in microvascular
coagulation and endothelial cell dysfunction, eventually resulting in multiple organ failure.
The heart is one of the organs subject to failure. Although many studies have investigated
myocardial dysfunction in sepsis, the mechanisms underlying heart failure are still not fully
understood [29]. Echocardiographic studies suggest that 40% to 50% of patients with prolonged
septic shock develop myocardial depression [30]. Changes caused by sepsis to circulating volume
and vessel tonus inevitably affect cardiac performance.
In summary, the body’s immune system tries to localize and clear the infection, and this immune
response activates endothelial cells, which in turn leads to the activation of numerous pathways.
The result is multiple organ dysfunctions, including heart failure. In this situation, intensive care
treatment is the only possible means of survival.
It is sometimes very difficult to diagnose sepsis, as its symptoms – including confusion, low blood
pressure and high body temperature – are non-specific.
When the infection and its source are named among these symptoms, the patient is considered to
be suffering from sepsis. In the following section, the criteria for systemic inflammatory response
syndrome (SIRS) are discussed. When two or more of these criteria occur together, the condition
may again be considered sepsis.
10
1.3. Classification of Sepsis
Sepsis is a complex syndrome that can lead to multiple organ failure and death. As mortality rates
among patients suffering from severe sepsis range from 30% to 50% [31], it is important to
determine the severity of the disease in order to ensure proper treatment. For this purpose, sepsis
can be divided into four stages:
1.3.1. Systemic Inflammatory Response Syndrome (SIRS)
Sepsis may be triggered by infections or non-infectious conditions, such as burns, acute
inflammation of the pancreas or lymphoma.
The symptoms:
Tachycardia
Hypocapnia
Hyperventilation (high respiratory rate)
Changes in the number of white blood cells [28, 32].
1.3.2. Severe Sepsis
Severe sepsis is characterised by organ dysfunction.
Sepsis which occurs together with at least one sign of organ hypo-perfusion or organ dysfunction
is described as severe sepsis.
The symptoms:
Abrupt change in mental state or abnormal EEG findings
Acute lung injury/acute respiratory distress syndrome
Cardiac dysfunction (diagnosed using echocardiography)
11
1.3.3. Septic Shock
Septic shock (during which hypotension occurs despite adequate fluid resuscitation) is a
subcategory of severe sepsis. At the end of the spectrum is multiple organ dysfunction syndrome
(MODS), defined as the presence of altered organ function in an acutely ill patient such that
homeostasis cannot be maintained without intervention [28].
Although sepsis is classified according to its symptoms, it is distinguished by the bacteria which
trigger it. There is a difference between gram-negative (gram (-)) and gram-positive (gram (+))
sepsis [33]. This thesis focuses on gram (-) sepsis induced by lipopolysaccharide (serotype 055:B5
from Sigma; L2880) in-vitro.
1.4. Treatment of Sepsis
Severe sepsis and septic shock represent 10% of cases in intensive care units. Many studies have
been carried out for the purpose of developing therapeutic agents; however, clinical studies
targeting inflammatory cytokines in sepsis have been unsuccessful [34, 35]. Pharmacological
treatments are diverse, and include sedative agents, antimicrobial and vasoactive drugs, and
optimal fluid management [36, 37]. The nature of the septic response – secretion of cytokines,
endovascular injury and procoagulant host response – necessitates the use of many different drugs,
each of which aims to prevent one step of the cascade. Of these, only APC has shown promising
results for the treatment of sepsis [36].
Two strategies may be used to treat sepsis. One targets the cause, and the other relieves symptoms.
The treatment of causes relies on surgery and the use of antibiotics. Antibiotics are extremely
important in treating both surgical and non-surgical cases of severe sepsis [38].
1.5. LPS
The bacterial cell wall consists of a macromolecular network called peptidoglycan, which is
present either alone or in combination with other substances [39, 40]. The cell wall of gram-
negative bacteria is composed of an outer membrane and a single layer (in some cases, several
layers) of peptidoglycans. The peptidoglycans are found in the periplasm, bound to the outer
membrane of the cell wall. The periplasm, a space between the outer and inner membrane, is filled
with liquid. Since gram-negative bacteria contain only one layer of peptidoglycans, they lack the
12
teichoic acid which prevents extensive wall breakdown. For this reason, the cell walls of gram-
negative bacteria are more vulnerable. The outer membrane of gram-negative bacterial cells is
composed of LPS (lipopolysaccharide), lipoproteins and phospholipids. Bacterial
lipopolysaccharide (LPS) typically consists of a hydrophobic portion known as lipid A (or
endotoxin), a non-repeating “core” of oligosaccharide, and a distal polysaccharide or O antigen.
LPS fulfills two particular roles in gram-negative bacteria. The first relates to its polysaccharide
portion, which is composed of a sugar and functions as an antigen. This is important for the
distinction of gram-negative bacteria. The second function is provided by Lipid A, the lipid
component of LPS, which is endotoxic; it causes fever and shock.
The endotoxins in LPS take effect when cell walls break down as a result of death. Endotoxins all
cause the same symptoms, but to different degrees. These symptoms include chills, fever,
weakness, and in some cases shock and even death [40].
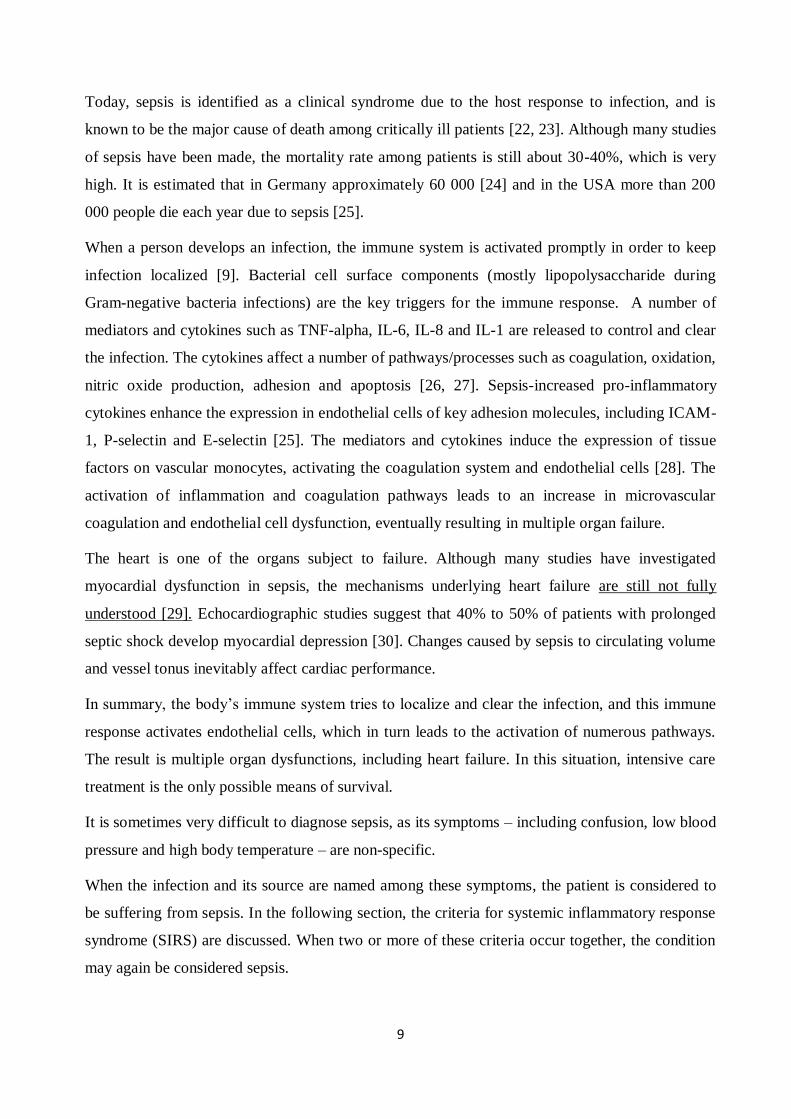
Figure 1. Model of the inner and outer membranes of E. coli.
Membranes are separated by a compartment (the periplasm) that contains a thin peptidoglycan
(or murein) layer. The inner membrane is in direct contact with the cytoplasm and the periplasm,
whereas the outer membrane separates the periplasm from the external environment [40].
1.6. Recombinant Activated Protein C
Protein C is a plasma proteinase and an important modulator for coagulatory and inflammatory
response in severe sepsis [26, 27]. It has anti-inhibitory, anti-inflammatory, pro-fibrinolytic and
anti-apoptotic effects. Some studies have observed a relation between low levels of the circulating
protein C and an increase in mortality rate [41, 42]. Protein C is activated by the thrombin-
thrombomodulin complex on the endothelial cell surface, and results in the production of activated
protein C [43, 43]. APC inactivates factors Va and VIIIa, blocking the amplification of the
coagulation system. Protein S is a cofactor which works to accelerate the process. Moreover, as
13
mentioned above, APC has anti-inflammatory effects, since it inactivates IL-6, IL-8 and TNF
alpha and inhibits neutrophil chemotaxis [45, 46]. APC inhibits plasminogen activator inhibitor 1,
a potent anti-fibrinolytic factor, resulting in fibronolysis. In addition, APC has anti-apoptotic
effects [45]. Several studies have shown that these anti-apoptotic properties may have a
neuroprotective effect [47]. Pharmalogical studies indicate that APC directly modulates
endothelial dysfunction by blocking cytokine signaling, inhibiting functional cell adhesion
expression and vascular permeability, and preventing the induction of apoptosis [7].
In 2001, the Recombinant Human Activated Protein C Worldwide Evaluation in Severe Sepsis
(PROWESS) published trial results indicating that the activated form of APC – drotrecogin alpha
(Xigris)– was associated with a 19.4% reduction in the relative risk of death and a 6.1% reduction
in the absolute risk of death. However, the risk of bleeding was higher in the APC group (3.5% vs
2.0%) [15]. The study was double-blind, placebo-controlled and randomized [41], and took place
in 11 countries, involving 164 centers. The use of APC for treatment of multiple organ
dysfunction was approved in November 2001 by the US Food and Drug Administration (FDA),
and in 2002 by the European Medicines Evaluation Agency (EMEA) [48]. However, the
RESOLVE study with child participants showed that APC has no efficacy in treating severe sepsis
in children [49].
Since the original publication of the PROWESS trial, there has been much debate about the use of
APC; however, it remains the only drug proven by randomized controlled trials to decrease
mortality in severe sepsis [41].
1.6.1. Activation of Protein C
The activation of protein C is part of a pathway including thrombin, thrombomodulin, endothelial
protein C receptor (EPCR) and protein S. Protein C is activated by thrombin-mediated cleavage.
The activation of protein C by thrombin is a Ca2+
-dependent reaction. When thrombin binds to a
thrombomodulin cell surface receptor, it causes a 1000-fold increase in the activation of protein C
[7]. If protein C binds to EPCR in the presence of the thrombin-thrombomodulin complex, the
activation rate of protein C shows a further 10-fold increase [26].
14
1.6.2. Cytoprotective Activity of APC
APC has a direct cytoprotective effect on cells in the reactions mediated by EPCR, effector
receptor, and protease-activated receptor-1 (PAR-1). These reactions include changing gene
expression, anti-inflammatory activity, anti-protective activity, and protection of endothelial
barrier function [45, 50].
Several studies show that APC signals utilize protease-activated receptors (PARs); however, most
signals are mediated by PAR-1. Thrombin up-regulates pro-inflammatory mediators through
PAR-1 signaling [7]. Unlike thrombin, APC cannot induce the activation of proinflamotory
cytokines using PAR-1, due to limitations in its biological structure. APC has poor cleavage
efficiency, as it lacks a hirudin-binding site with which to facilitate PAR-1 cleavage [51].
Many studies demonstrate that the cellular response generated by APC is EPCR-dependent;
however, the apoptosis-inducing ligand related to the suppression of the TNF alpha is PAR-1-
dependent [52]. EPCR-dependent APC has a protective effect on endothelial barrier function, as a
result of coupling with the sphingosine-1-phosphate receptor S1P1. The sphingosine-1-phosphate
receptor S1P1 functions to maintain endothelial barriers during sepsis [53]. The coupling of
endothelial EPCR-APC signaling should therefore be considered a mechanistic link between anti-
apoptotic and cytoprotective activities in the PC pathway.
The anti-inflammatory and cytoprotective effects of APC are mediated by the activation of PARs
and receptor crosstalk with lipid-sensing receptors such as S1P1 [52].
1.6.3. APC Anti-inflammatory Activity
The inflammatory pathway seeks to repair injury resulting from many different mechanisms,
including infection. After the microorganism dies, endotoxins such as LPS are secreted, which
stimulate the endothelial cells, in turn causing the secretion of certain cytokines including IL-1,
IL-2, IL-6, IL-8, and TNF-alpha [54]. These cytokines initiate the expression of adhesion
molecules – intracellular adhesion molecules (ICAMs), vascular adhesion molecules (VCAMs)
and E-selectin – by assembling neutrophils and monocytes at the inflammation site. Since
thrombin may stimulate cytokines, it is also a pro-inflammatory agent. APC is considered an anti-
inflammatory agent, as it is capable of inhibiting the generation of thrombin. This is known as the
indirect anti-inflammatory effect of APC [55].
15
The indirect effect of APC inhibits nuclear factor κB (NfκB), which is induced by LPS, causing
the down-regulation of pro-inflammatory cytokines. APC inhibits inflammatory mediators
released by leukocytes and endothelial cells. It also reduces the rate of cytokine release from
leukocytes, and may thereby minimize the initiation of systemic inflammatory responses. This
APC reaction may thus be capable of reducing the so-called ‘cytokine storm’ associated with
sepsis [50].
1.6.4. APC Anti-apoptotic Activity
Several studies suggest that apoptosis can cause organ injury and immune dysfunction in sepsis
[45, 56]. APC exerts an anti-apoptotic effect by means of EPCR and PAR-1, and its serine
protease activity is dependent on many types of cells. APC reduces many characteristic features of
apoptosis, such as DNA degradation, caspase-3 activation and the translocation of
phosphatidylserine to the outer cell membrane [57].
Until now, there has been no specific intracellular target, mediating the apoptotic effect of APC.
However, APC decreases the amount of p53 protein and hypoxia-induced mRNA in stressed
human brain endothelial cells. It also reduces p21 and p53, mediating apoptosis in a murine sepsis
model. In the cortical neurons of mice, APC blocks caspase activation and inhibits nuclear
translocation of apoptosis-inducing factor (AIF), an effect which requires PAR-1 and PAR-3. The
result is to prevent apoptosis [45, 58].
The effect of APC is not limited to the intrinsic apoptosis pathway; it also affects the extrinsic
pathway by preventing tissue plasminogen activator (tPA) from becoming neurotoxic. As a result,
we can conclude that the anti-apoptotic effect of APC is broadly cytoprotective [59].
Research should be carried out in the future to determine whether APC affects only gene
expression, or whether additional effects such as APC-specific signaling might also be present.
1.6.5. APC Anticoagulant Activity
A variety of biochemical transformations and cellular protein receptors are localized and promoted
by cell surfaces. These reactions include protein C activation, APC anticoagulant activity
expression, and initiation of the APC cytoprotective process [26].
16
Protein C is the inactive form of APC. When bound to thrombomodulin, thrombin triggers the
activation of protein C, resulting in the generation of APC [50].
APC is a serine protease and inhibits clot formation. The anticoagulant activity of APC is based
on the degradation of factor Va and VIIIa, resulting in a diminished coagulation cascade.
Inflammatory cytokines, endotoxins or vascular injury initiate the coagulation cascade, resulting
in blood clot formation and thrombin generation [58]. The surplus thrombin binds to
thrombomodulin, which is a cell surface receptor. This complex leads to the generation of APC
from protein C. EPCR also binds to protein C, resulting in a 10-fold acceleration of APC
generation by the thrombin-thrombomodulin complex. The APC generated acts as an anti-
coagulator by degrading coagulation factors. In addition, protein C binds to the thrombin-
thrombomodulin complex, thereby reducing the excessive level of thrombin [58].
Recent studies suggest that the protective effect of rhAPC therapy may in part reflect the ability of
rhAPC to dampen the procoagulant potential [31].
1.6.6. APC in Endothelial Cell Barrier Dysfunction
Endothelial cells form a dynamically regulated barrier, and disruption of this barrier is the key
pathogenic factor in sepsis. Thrombin and PAR-1 agonist peptide both cause a breakdown in
endothelial barrier integrity. Bioactive lipid sphingosine-1-phosphatase (S1P) has been found to
protect against barrier disruption. Feistritzer and Riewald [60] showed that APC decreased the
thrombin-induced permeability of endothelial monolayers in culture with APC. They also found
that both the protective effects of APC and the disruptive effects of thrombin were
blocked by a
specific antibody to PAR-1. The S1P pathway seems to explain this paradox. S1P has a protective
effect on endothelial barrier integrity via cytoskeletal rearrangement [60, 61, 62] Riewald et al.
[63] showed that the endothelial barrier protection conferred by APC is mediated through PAR-1
and by crosstalk with the S1P pathway.
1.6.7. APC in Cardiovascular Dysfunction
The effects of pro-inflammatory cytokines such as tumor necrosis factor (TNF) α, the production
of large amounts of oxygen reactive species, and interleukin (IL) 1β are the mechanisms
underlying cardiovascular dysfunction [64].
17
In recent years, researchers have gained a fuller understanding of the contribution of coagulopathy
to endotoxin-induced sepsis pathophysiology [22]. As a result, interest in components which
modulate coagulation, such as anti-thrombin and APC, has increased. Scientists have focused on
the close association between coagulation and inflammation. The rapid depletion of protein C
which occurs during sepsis can cause uncontrolled inflammation, coagulopathy and endothelial
cell dysfunction. Recent studies suggest that APC can protect cell function directly, through
interactions with EPCR and PAR-1 [57]. Moreover, Favory et al. published results indicating that
APC was responsible for almost entirely preventing endotoxin-induced cardiovascular
dysfunction, functional capillary density reduction [57] and myocardial contractile inflammatory
response [12]. Scientists now recognize the potential of APC to offer protection against
cardiovascular dysfunction in sepsis.
1.7. Endothelial Cells
The endothelial cells which line blood vessels form an interface between circulating blood in the
lumen and the rest of the wall of the vascular lumen. The area of this cellular sheet is huge. As a
result, endothelial cells interact very effectively with plasma, white cells and platelets, enabling
the endothelium itself to interact effectively with all of the tissues of the body [65].
The basic role of the endothelium is to generate a selective, adjustable porous membrane. The
membrane allows signaling molecules to move between blood and tissues, but it is also
responsible for maintaining a certain volume of water in the bloodstream. Plasma proteins retain
water osmotically, and, in turn, the retention of plasma proteins in the circulating blood is itself a
regulated balancing act. The endothelium balances all of these requirements through the use of
different transfer pathways for different classes of substances [66].
The structure of the endothelium is not constantly stable. Growth factors and inflammatory
mediators can both regulate and cause rapid changes to the stability of endothelial cells [67].
Endothelial cells, which are directly exposed to shear stress from the blood flow, thus synthesize
and secrete a number of vasoactive agents, such as nitric oxide and endothelin. These agents elicit
local flow-regulating responses in the underlying vascular smooth muscle [68].
18
1.7.1. Structure of Endothelial Cell
Endothelial cells are only 0.2-0.3 µm thick at their edge and 1-5 µm around the nucleus. They
form a monolayer by leaving very narrow gaps between cells. Organelles such as mitochondria,
endosomes, the Golgi apparatus, microtubules and cytoskeletal filaments are located in the
cytoplasm. Intercellular junctions, and the cells’ caveolar/vesicular system, surface glycocalyx and
actin-myosin cytoskeleton are of particular importance in determining permeability [67]
Like smooth muscle, endothelial cells include isomers of actin and myosin; however, endothelial
cells are less actively contractile than vascular myocytes. Cell permeability, the formation of stress
fibers, and cell migration in angiogenesis are all regulated by endothelial actin and myosin [68].
Rather like muscle cells, the protein monomers polymerize to form thin actin filaments and thick
myosin filaments.
Endothelial cells lie closely against adjacent cells and leave very narrow clefts in between. These
clefts enable water and small lipid-insoluble solutes, such as amino acids, glucose, vitamins,
hormones, and drugs, to cross the endothelial monolayer. However, large solutes cannot pass
through the clefts.
As a result, endothelial cells control enzymatic actions on plasma relating to permeability, defense
against pathogens, antihaemostatis and haemostatis, and angiogenic and atherogenic roles in
arterial diseases [47, 68].
1.8. Cardiomyocytes
The heart is the first organ to develop from the embryo. During development, the cardiomyocytes
take on the structure of terminally differentiated muscular cells by attaching end to end. This
structure leads the cells to contract simultaneously [69].
The heart-beat is started by a special electrical system known as the pacemaker conduction
system, which is located in the heart wall. This system is composed of muscle cells which are not
nervous cells. The system transmits an electrical signal to the muscle cells that form the bulk of
the heart, resulting in an action potential which increases intracellular Ca2+
levels, and thereby
activates the contractile machinery [31]. The cardiac muscle cells involved in this process can be
divided into two groups. Most are composed of myocytes, which assist the mechanical work of the
heart. These cells do not contract if they are not stimulated electrically. The other types of cardiac
muscle cells are merely responsible for initiating an electrical impulse and transmitting it to the
19
myocytes. These cells are specialized to produce the electrical system, and are composed of
pacemaker at sinoatrial nodes. Sinoatrial Nodes are starters for the stimulus; and trio-ventricular
nodes, known as delaying nodes. The latter are conduction bundles: a rapidly distributing network
of Purkinje fibers in the ventricles [68, 69].
1.8.1. The Structure of Myocytes
The diameter of human myocytes is 10-20 µm, and their length is 50-100 µm. Human myocytes
each contain one, two, or very rarely three or four nuclei. Typically, these cells have branched
structures, and attach themselves to adjacent cells. The resulting structures are called end-to-end
junctions or intercalated disks, and are composed of both smaller junctions (desmosomes) and gap
junctions. Desmosomes enable the cells to come together via cadherins. The gap junctions are
electrically conductive, allowing them to transmit ionic currents from one cell to another by means
of a protein called connexin. Six subunits combine to form the connexon hollow, tubes which
connect the cytoplasm of the cells at each side so that ions can be transmitted through these
channels from one cell to the other. As a result, the myocardium acts as an electrical panel, which
is very important for the myocytes, as it guarantees that they can be active simultaneously.
Myocytes consists of myofibrils, whose diameter is 1 µm. These myofibrils are composed of
sarcomeres, which are 1.8-2 µm long in resting myocytes. They are responsible for the striated
appearance of myocytes under a microscope. Sarcomeres are described as the material between
two Z lines composed of α-actinin. The sarcomere includes thick and thin filaments. Thick
filaments are comprised of myosin proteins and thin filaments are composed of actin proteins. The
central region of the sarcomere is defined as the A-band, composed of thick filaments aligned in
parallel. Thin filaments are rooted in the Z-line and form the pale I-band. In this structure, myosin
and actin filaments overlap. Both actin and myosin contain troponin and tropomyosin, which have
an important role in contraction. The non-contractile cytoskeletal filaments connectin and titin are
also present. They help to ensure the mechanical stiffness of the heart [70].

20
1.9. Mechanism of Contraction
The structures chiefly responsible for the contraction of myocytes are the sarcomeres. The I-bands
in sarcomeres shorten, while the A-bands do not; this indicates that contraction is caused by thin
filaments. The I-band slides into the spaces between the thick filaments of the A-band by means of
a sliding filament mechanism. The myosin heads protrude from one side of the thick filament to
generate crossbridges to the actin-binding side. As filaments slide past each other during
contraction and relaxation, the crossbridges between the thin and thick filaments are broken.
While resting, tropomyosin blocks the actin-binding side, thereby disconnecting the myosin heads.
When the concentration of free intracellular calcium ions rises abruptly due to their release from
the sarcoplasmic reticulum store, contraction begins. The binding of some of these ions to the
troponin C, which is a component of the troponin complex, allows troponin C to change the
position of the tropomyosin molecule. By this means, the myosin head can cross-link to the actin-
binding site. The angle of the myosin head changes and pulls the thick filament towards the Z-line.
The cycle repeats [71, 69].
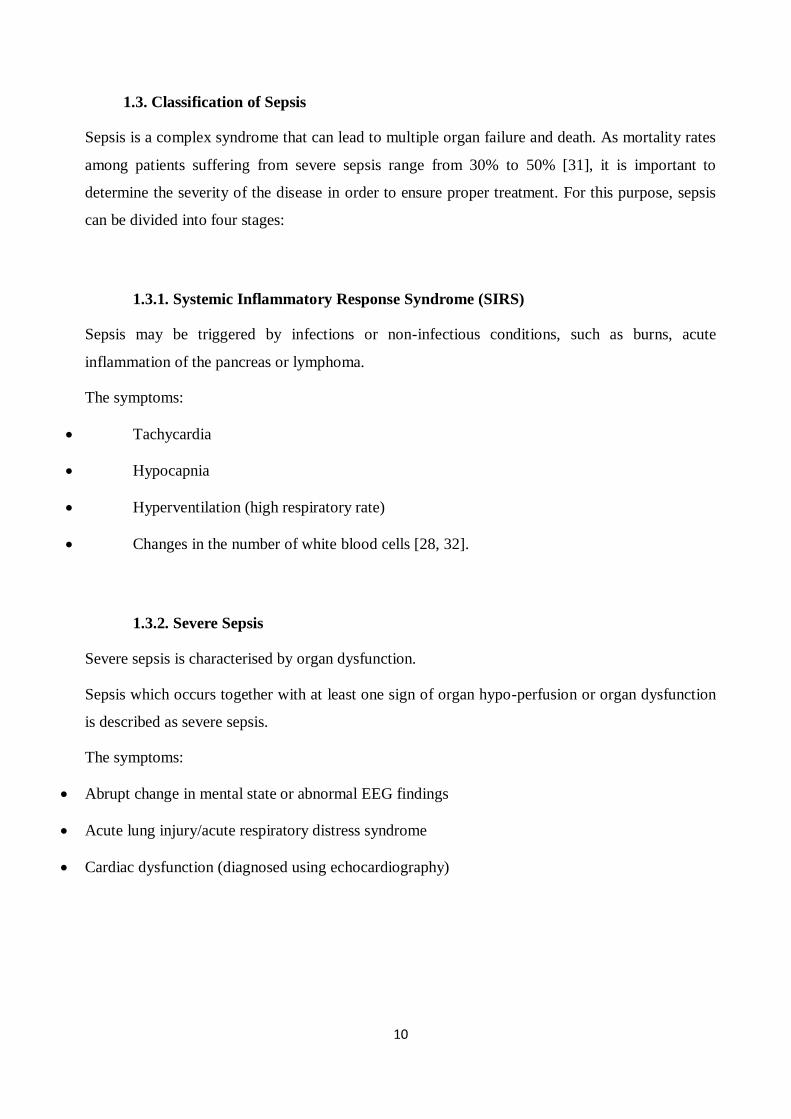
Figure 2. The structure of a sarcomere.
The sarcomere, is a highly regular array offilaments of the contractile proteins actin and myosin
that are crosslinked in the Z-disk (actin) and M-band (myosin). The sarcomere also contains
numerous proteins with multiple localizations and with the potential to exchange between Z-disks,
I-bands and M-bands, as well as to translocate to the nucleus [69].
21
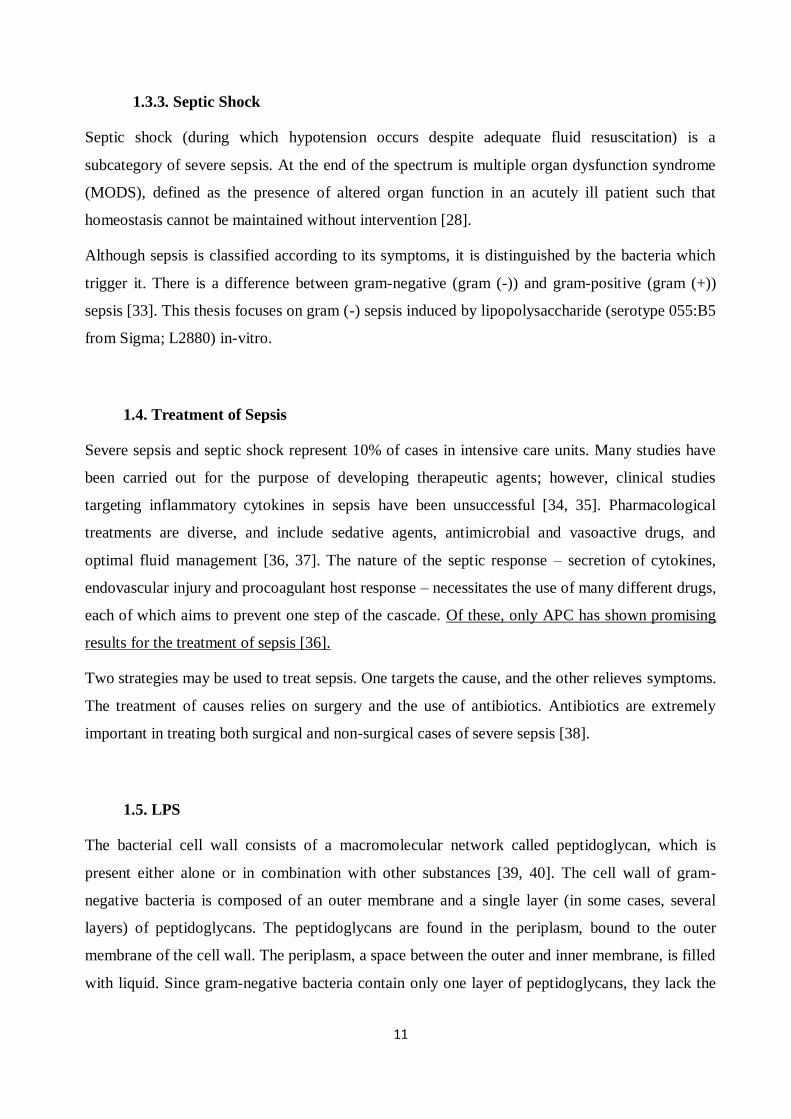
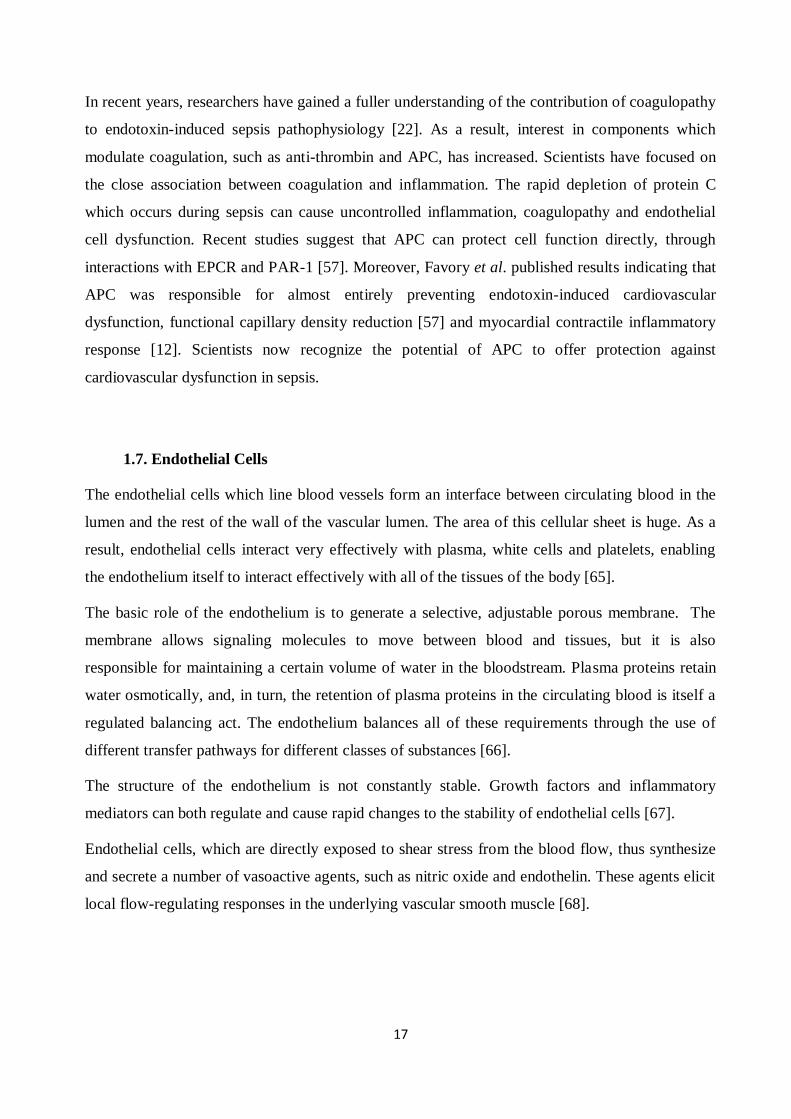
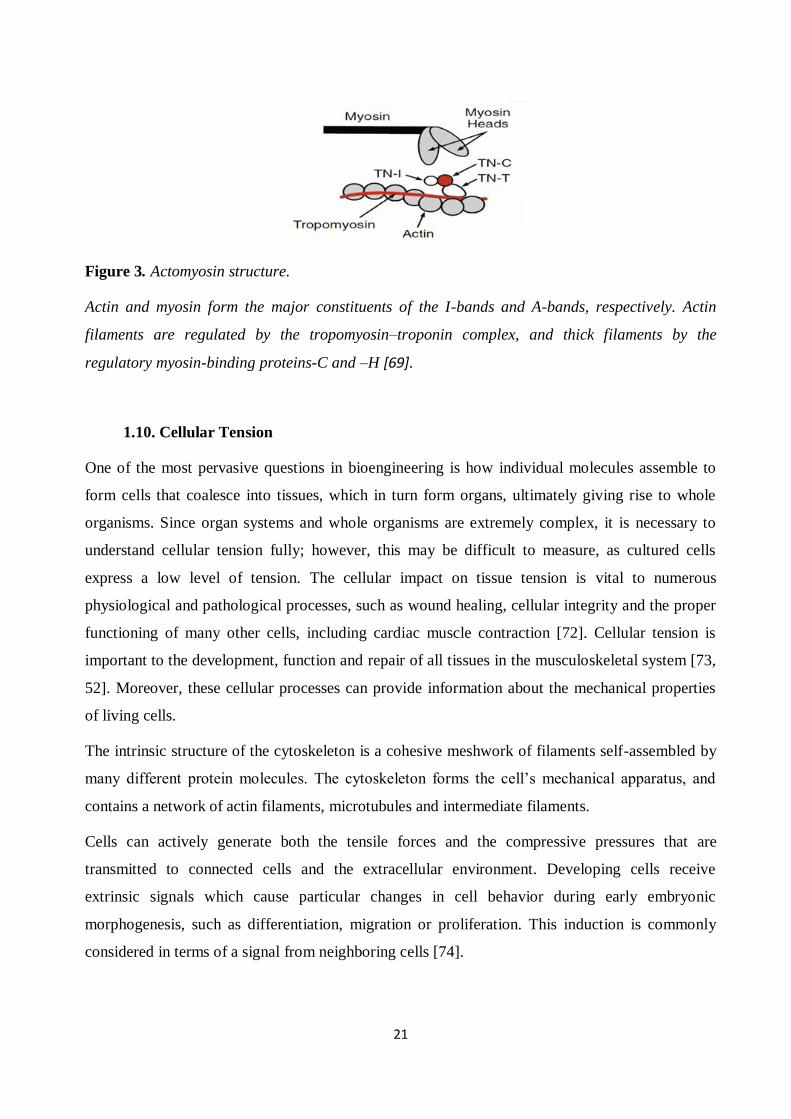
Figure 3. Actomyosin structure.
Actin and myosin form the major constituents of the I-bands and A-bands, respectively. Actin
filaments are regulated by the tropomyosin–troponin complex, and thick filaments by the
regulatory myosin-binding proteins-C and –H [69].
1.10. Cellular Tension
One of the most pervasive questions in bioengineering is how individual molecules assemble to
form cells that coalesce into tissues, which in turn form organs, ultimately giving rise to whole
organisms. Since organ systems and whole organisms are extremely complex, it is necessary to
understand cellular tension fully; however, this may be difficult to measure, as cultured cells
express a low level of tension. The cellular impact on tissue tension is vital to numerous
physiological and pathological processes, such as wound healing, cellular integrity and the proper
functioning of many other cells, including cardiac muscle contraction [72]. Cellular tension is
important to the development, function and repair of all tissues in the musculoskeletal system [73,
52]. Moreover, these cellular processes can provide information about the mechanical properties
of living cells.
The intrinsic structure of the cytoskeleton is a cohesive meshwork of filaments self-assembled by
many different protein molecules. The cytoskeleton forms the cell’s mechanical apparatus, and
contains a network of actin filaments, microtubules and intermediate filaments.
Cells can actively generate both the tensile forces and the compressive pressures that are
transmitted to connected cells and the extracellular environment. Developing cells receive
extrinsic signals which cause particular changes in cell behavior during early embryonic
morphogenesis, such as differentiation, migration or proliferation. This induction is commonly
considered in terms of a signal from neighboring cells [74].
22
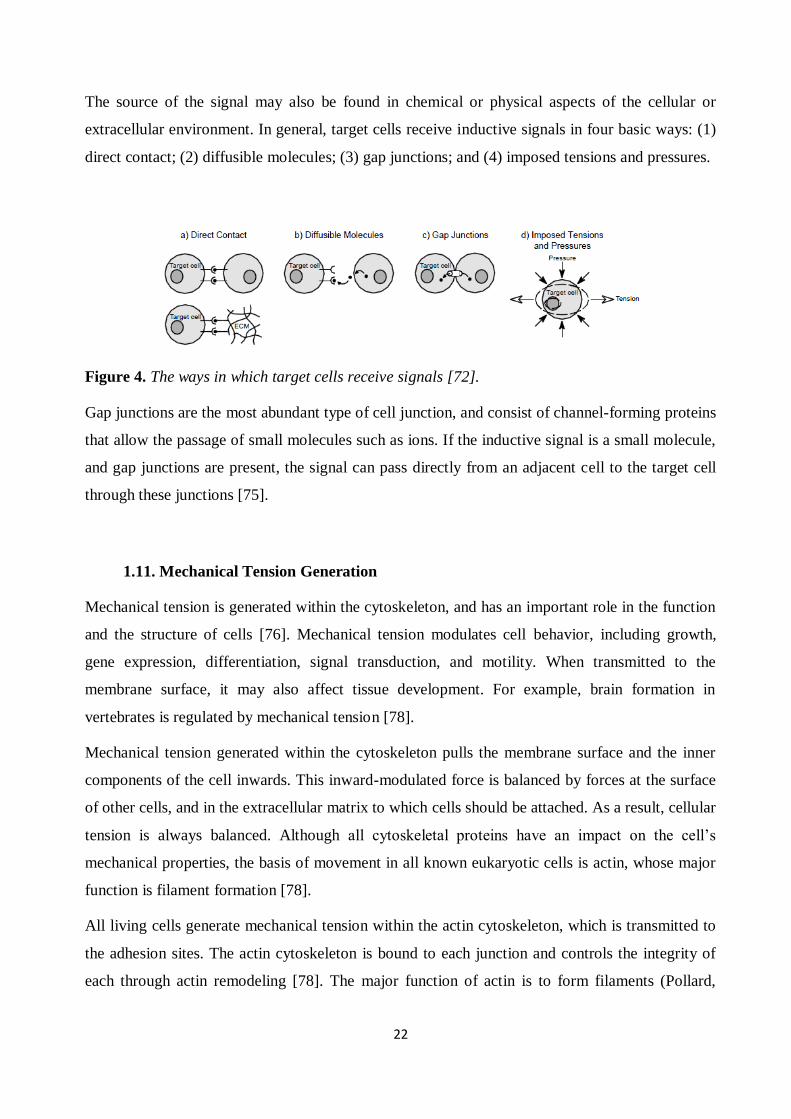
The source of the signal may also be found in chemical or physical aspects of the cellular or
extracellular environment. In general, target cells receive inductive signals in four basic ways: (1)
direct contact; (2) diffusible molecules; (3) gap junctions; and (4) imposed tensions and pressures.
Figure 4. The ways in which target cells receive signals [72].
Gap junctions are the most abundant type of cell junction, and consist of channel-forming proteins
that allow the passage of small molecules such as ions. If the inductive signal is a small molecule,
and gap junctions are present, the signal can pass directly from an adjacent cell to the target cell
through these junctions [75].
1.11. Mechanical Tension Generation
Mechanical tension is generated within the cytoskeleton, and has an important role in the function
and the structure of cells [76]. Mechanical tension modulates cell behavior, including growth,
gene expression, differentiation, signal transduction, and motility. When transmitted to the
membrane surface, it may also affect tissue development. For example, brain formation in
vertebrates is regulated by mechanical tension [78].
Mechanical tension generated within the cytoskeleton pulls the membrane surface and the inner
components of the cell inwards. This inward-modulated force is balanced by forces at the surface
of other cells, and in the extracellular matrix to which cells should be attached. As a result, cellular
tension is always balanced. Although all cytoskeletal proteins have an impact on the cell’s
mechanical properties, the basis of movement in all known eukaryotic cells is actin, whose major
function is filament formation [78].
All living cells generate mechanical tension within the actin cytoskeleton, which is transmitted to
the adhesion sites. The actin cytoskeleton is bound to each junction and controls the integrity of
each through actin remodeling [78]. The major function of actin is to form filaments (Pollard,
23
1986). Since the subunit of actin has only one polypeptide chain, it exists as a monomer. Each
actin subunit has binding sites for peptides which allow connection with two other actin
monomers generating actin filaments (F-actin, or filamentous). A kinetic equilibrium is needed for
the assembly and disassembly of actin at both ends of the polymer filament. If the concentration of
actin is high at the beginning of polymerization, filaments are formed more quickly, and are
distinguished by a slow growing minus end and a rapidly growing plus end [79].
The transition between non-muscle cells and the muscle cell cytoskeleton is provided by myotube
differentiation. Myotubes are composed of myofibrils which are self-assembled by muscle-
specific myosin and the α-muscle isoform of actin, in contrast to the β- and γ-actin isoforms
characteristic of non-muscle cells. The myofibrillar apparatus is the dominating component of the
cytoskeleton, and the force-generating unit in muscle cells. The contraction signal in electrically
coupled cardiac muscle cells is transmitted through low resistance gap junctions. Although the
heart is extensively innervated by sympathetic and parasympathetic axons, these are only
regulatory in function; they are responsible for speeding up and slowing the heart rate [80].
Recent studies have shown that the force generated by cells provides regulation information for
the cells. Cells ensure that their structure and shape remain balanced by means of external ECM
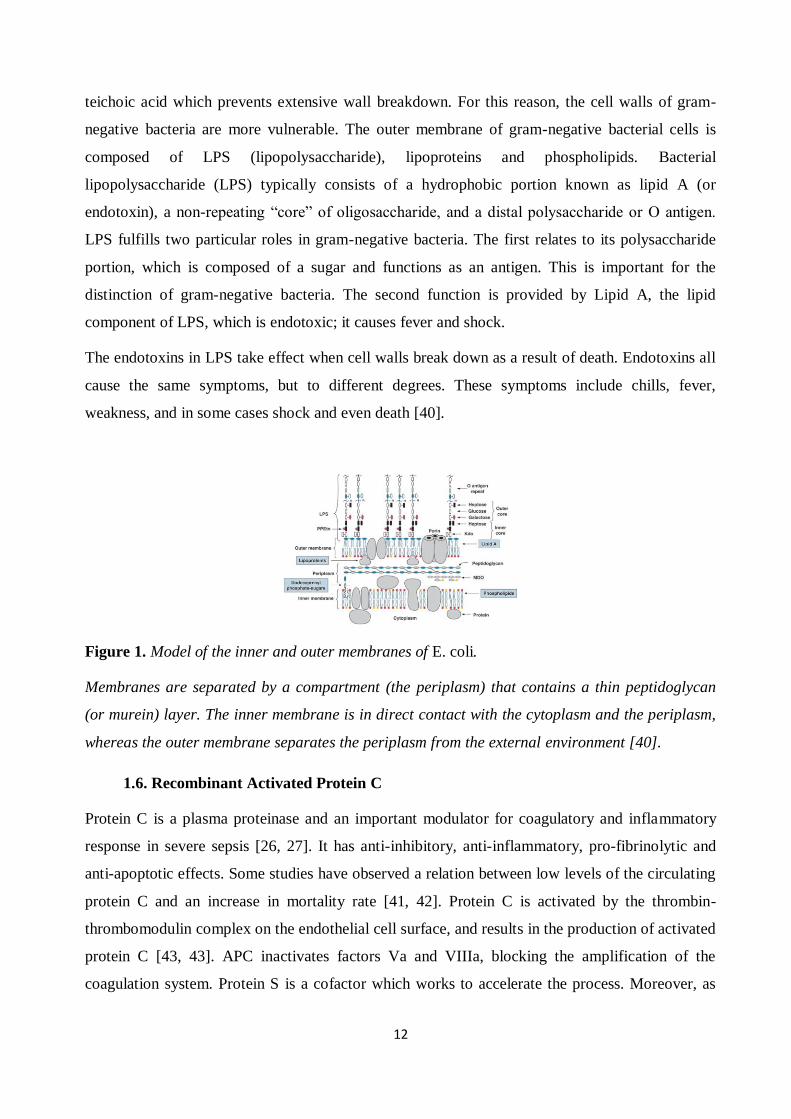
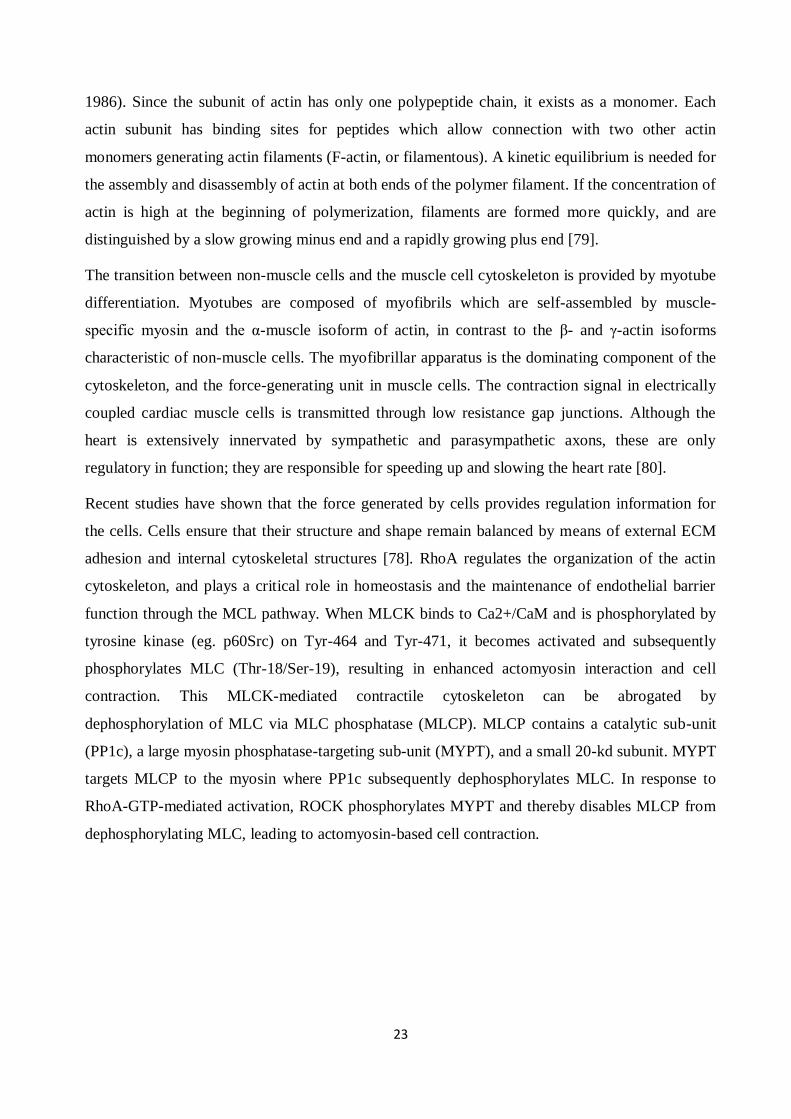
adhesion and internal cytoskeletal structures [78]. RhoA regulates the organization of the actin
cytoskeleton, and plays a critical role in homeostasis and the maintenance of endothelial barrier
function through the MCL pathway. When MLCK binds to Ca2+/CaM and is phosphorylated by
tyrosine kinase (eg. p60Src) on Tyr-464 and Tyr-471, it becomes activated and subsequently
phosphorylates MLC (Thr-18/Ser-19), resulting in enhanced actomyosin interaction and cell
contraction. This MLCK-mediated contractile cytoskeleton can be abrogated by
dephosphorylation of MLC via MLC phosphatase (MLCP). MLCP contains a catalytic sub-unit
(PP1c), a large myosin phosphatase-targeting sub-unit (MYPT), and a small 20-kd subunit. MYPT
targets MLCP to the myosin where PP1c subsequently dephosphorylates MLC. In response to
RhoA-GTP-mediated activation, ROCK phosphorylates MYPT and thereby disables MLCP from
dephosphorylating MLC, leading to actomyosin-based cell contraction.
24
Figure 5. Regulation of MLC phosphorylation [78].
The main components of the cytoskeleton are as follows:
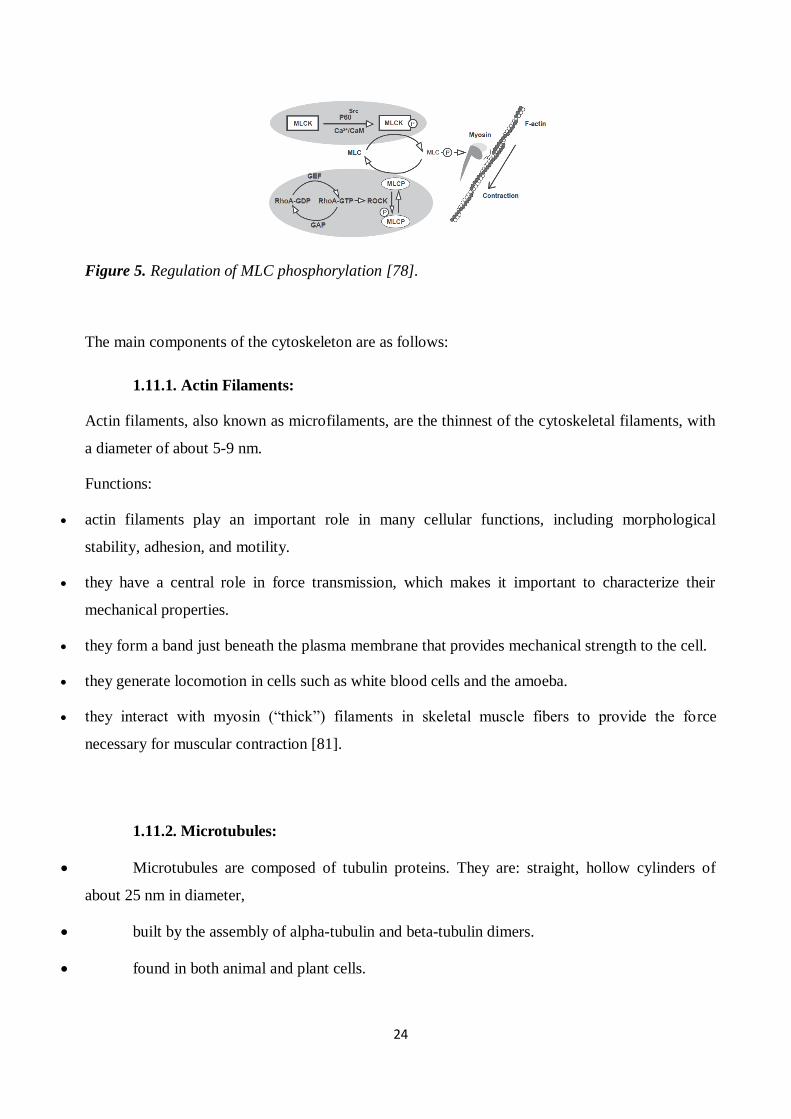
1.11.1. Actin Filaments:
Actin filaments, also known as microfilaments, are the thinnest of the cytoskeletal filaments, with
a diameter of about 5-9 nm.
Functions:
actin filaments play an important role in many cellular functions, including morphological
stability, adhesion, and motility.
they have a central role in force transmission, which makes it important to characterize their
mechanical properties.
they form a band just beneath the plasma membrane that provides mechanical strength to the cell.
they generate locomotion in cells such as white blood cells and the amoeba.
they interact with myosin (“thick”) filaments in skeletal muscle fibers to provide the force
necessary for muscular contraction [81].
1.11.2. Microtubules:
Microtubules are composed of tubulin proteins. They are: straight, hollow cylinders of
about 25 nm in diameter,
built by the assembly of alpha-tubulin and beta-tubulin dimers.
found in both animal and plant cells.
25
Microtubules participate in a wide variety of cell activities, most of which involve motion. This is
generated by protein “motors” that use the energy of ATP to move along the microtubule [81].
1.11.3. Intermediate Filaments:
These have an average diameter of 10 nm, and are thus “intermediate” in size between actin
filaments (10 nm) and microtubules (25 nm).
There are several types of intermediate filament, each constructed from one or more characteristic
proteins:
keratins are found in epithelial cells and also form hair and nails;
nuclear lamins form a meshwork that stabilizes the inner membrane of the nuclear
envelope;
neurofilaments strengthen the long axons of neurons;
vimentins provide mechanical strength to muscle (and other) cells [81].
Despite their chemical diversity, intermediate filaments have a common role within the cell:
providing a supporting framework. For example, the nucleus in epithelial cells is held within the
cell by a basket-like network of intermediate filaments made of keratins.
26
2. Materials and Methods
2.1. Cell Culturing
2.1.1. Mouse Embryonic Stem Cell-Derived Cardiomyocytes (mESC)
Primary mESC-derived cardiomyocytes (Cat. No. XCAC-1010E MESC 1M GFP, from
Axiogenesis) were used for the experiments. Cells were stored in liquid nitrogen before thawing.
Thawing a Vial of mESC
Media Preparation
The mESC culture medium (Cat. No. XCAM-250E mESC Complete Culture Medium)
and the puromycin stock solution were thawed following the instructions, which
recommended thawing at 4°C overnight or at room temperature (RT: 15 – 25°C). To avoid
precipitation of the proteins in the medium, the mESC culture medium was not thawed at
37oC. It is recommended that the culture medium be thawed in the dark, as it contains
light-sensitive compounds.
50 mL of the thawed mESC culture medium was pipetted into a sterile 50 mL
polypropylene tube (PP) , and 50 µL of puromycin stock solution was added. The medium
was mixed well and warmed to 37°C.
Puromycin is used as a selecting agent. mESC culture medium containing puromycin is required
for medium change at 24 hours of culture.
Another 8 mL of mESC culture medium was pipetted into a second sterile 50 mL PP.
Puromycin was added to the tube. This medium was used to wash the cells once they had
been thawed.
The remaining mESC culture medium was stored at 4°C. It can be kept at 4°C for up to
three weeks, and used for medium changes after 48 hours (or 2 days) of culture.
However, it cannot be used if it has been opened and stored at 4oC for more than three
weeks.
The cardiomyocytes were cultured in this specialized medium in 25 cm² fibronectin-precoated
27
plastic culture flasks and on fibronectin-precoated CellDrum® rings until the necessary amount of
cells was reached. Cell morphology and monolayer confluence were checked every 12 hours.
Cardiomyocytes were worked only at first passage, and at a density of 100 000 cells/cm2.
2.1.2. Endothelial Cells
Primary human aortic endothelial cells (HAoEC) from the company PromoCell (Cat. No. C-
12271) were used for the experiments. The cells were stored in liquid nitrogen.
The HAoEC cells were cultured in specialized endothelial cell growth medium (Cat. No. 22020B)
in 25 cm² fibronectin-precoated plastic culture flasks and on fibronectin-precoated CellDrum®
rings until the necessary amount of cells was reached. Cell morphology and monolayer confluence
were checked every 12 hours. The HAoEC were passaged for no more than 7 generations.
The following procedures were used for the handling of HAoEC and 3T3 cells in the experiments.
Thawing a Vial of HAoEC
To ensure that the HAoEC could be kept for a long period, they were stored at -196°C in liquid
nitrogen. A special procedure for thawing the cells was used to reduce cell damage.
Endothelial Cell Growth Medium was incubated at 37°C, 5 % (vol/vol) CO2 in a steam-
saturated atmosphere in a T–25 cell culture flask for approximately 30 minutes.
The frozen tube was removed from the liquid nitrogen and put into a 37°C warmed water
bath until about 90 % of the contents were thawed.
The vial was taken out of the water and allowed to stand until all of the cell suspension was
completely fluid.
The suspended HAoEC w transferred to the prepared T–25 culture flask. The flask was
placed in an incubator at 37 °C, 5 % (vol/vol) CO2, with a steam-saturated atmosphere.
To make gas exchange possible, the screw lid on the culture flask was only lightly closed, so that a
gap remained between lid and flask.
28
Changing Medium
After two or three days it is necessary to change the culture media to avoid intoxication by the
products of cell metabolism, and to maintain the conditions for further proliferation. The old
medium was thus removed, and fresh complete medium added.
Splitting of HAoEC
As soon as the cells formed a nearly complete monolayer over the bottom of the culture flasks,
they had to be splitted and introduced to a new surface in order to ensure further proliferation of
the culture. The aim was to split the cells at confluence to avoid a change in morphology. The
cells were splitted according to the manufacturer’s instructions (PromoCell, Germany), and at a
density of 10 000 cells/cm2.
The cells were rinsed twice with 6 ml of PBS (without Mg++ or Ca++). This was
necessary to ensure that trypsin, which is used to break up the intercellular junctions in cell
separation, was inactivated.
2 ml of 1:1 trypsin, PBS (w/o Mg++ or Ca++) was added to the cells. The detachment of
cells was accomplished by hitting the flask.
The cells were resuspended in complete media to inactivate the trypsin, which has a
harmful effect on cells if they are exposed to it for a longer time.
The medium was centrifuged for 5 minutes at 120 x g to form a pellet of cells on the
bottom of a 50 ml centrifuge tube.
The supernatant was removed and the pellet resuspended by mixing in 6 ml of complete
media.
The cells were seeded on the surfaces of the new flasks, with care taken to maintain a
constant cell density. Prior to seeding the cells, the surfaces were wetted by adding 4 ml of
complete media.
29
Freezing Procedure for HAoEC
Since it was necessary to have cells available at any time during the study, they were kept frozen
in liquid nitrogen. A special freezing cocktail was used to avoid any cell damage caused by crystal
formation during the freezing process.
The reagents for the freezing cocktail for HAoEC were 10% DMSO, 10% ECGM and 80%
DMEM. Dimethyl Sulfoxide (DMSO) is very toxic to cells above freezing temperature. Its
purpose was to help maintain the cells in their frozen state by facilitating the passage of molecules
through the membrane, and by removing ice crystals which could otherwise damage the cells. This
freezing cocktail was incubated at about 8 C in the refrigerator.
The next steps were similar to the splitting procedure:
The cells were rinsed with HepesBSS, trypsinized and centrifuged at 203 x g for 5 minutes.
The supernatant was removed and the pellet resuspended in the prepared freezing solution.
For every 25 cm2 cells, 1 ml solution was used.
Each 1 ml of cell suspension was transferred into a single Cryo Tube vial.
Each Cryo Tube vial was put into a special container with isopropanol to create a freezing
speed of 1°C per minute. This container was placed in a -80°C freezer overnight. The Cryo
Tube vials were removed from the freezer the next day and placed into a liquid nitrogen
container to ensure that the cells remained available for a long time.
2.1.3. 3T3 NIH Fibroblasts
Cell Culturing Procedures
3T3 NIH fibroblasts (CLS Cellbank, Heidelberg, Germany) were used for all experiments.
Culture Media
The chemicals for the culture media were purchased from Sigma Company, Germany.
The used culture media or complete media were obtained by adding the following reagents to
Dulbecco’s Modified Eagle Medium (DMEM):
30
1% Penicillin-Streptomycin (5000/5000)
1% L-Glutamine
10% Fetal Calf Serum (FCS)
L-glutamine, FCS and DMEM are used to maintain and increase cell proliferation, and Penicillin-
Streptomycin is expected to decrease or eliminate the appearance of microorganisms. The
complete media is only stable for one month.
2.2. Bacteria and Fungi-Free Environment
Cell culture contamination by any microorganisms would have severely affected the cell
properties and behavior under investigation. All cell cultures were thus routinely checked for
bacterial or fungal contamination using standard microscopic methods.
2.3. Mycoplasma-Free Environment
Mycoplasmas (0.2-2 μm in diameter) are extracellular parasites usually attached to the external
surface of the cell membrane. Contamination with mycoplasmas represents a much greater
problem than microbial infection in terms of incidence, detectability, prevention and impact. It has
been estimated that between 5 and 35% of cell cultures in current use are infected with
mycoplasmas [87].
Since it is impossible to detect mycoplasmas using standard microscopic observation, we proved
the absence of mycoplasmic contamination by means of a very sensitive Polymerase Chain
Reaction (PCR) amplification method. A commercially available VenorGeM® (BIOCHROM AG,
Berlin, Germany), PCR detection kit was used for this purpose. Media from cell lines with a high
passage number, which had been used intensively during most experiments, were analyzed.
31
2.4. Study Groups
The study groups were prepared by application of LPS and/or rhAPC. Different concentrations of
LPS were used, but APC concentration remained the same.
To identify suitable LPS concentrations and turning points, dose response and time course
experiments were carried out.
The study groups used to determine LPS concentration were as follows:
1. Control
2. LPS 0.1 µg/ml
3. LPS 0.1 µg/ml + rhAPC 5 µg/ml
4. LPS 0.5 µg/ml
5. LPS 0.5 µg/ml + rhAPC 5 µg/ml
6. LPS 1 µg/ml
7. LPS 1 µg/ml + rhAPC 5 µg/ml
8. LPS 2 µg/ml
9. LPS 2 µg/ml + rhAPC 5 µg/ml
10. rhAPC 5 µg/ml
2.5. Lipopolysaccharide Preparation
Lipopolysaccharide (LPS) from E. coli was derived from Sigma (Lipopolysaccharide from
Escherichia Coli 055:B5; product number L2880). It was diluted in sterile Dulbecco’s phosphate
buffered saline (DPBS).
LPS concentrations from 0.1 µg/ml to 2 µg/ml were used.
Incubation time varied from initial incubation to 24 hours.
To enable long storage, small volumes of the LPS stock solutions were frozen at -20 °C. Before
application, the LPS solution was thawed and shaken for about 30 minutes on a shaker to prevent
the LPS from binding to the tube surface. After the solution had been defrosted once, it was stored
at +8°C, and kept sterile.
32
2.6. Recombinant Activated Protein C Preparation
Recombinant activated protein C (rhAPC) was provided by Lilly Company (Cat. No. LY203638).
It was diluted in distilled water in non-glass vials and stored at -80oC according to the
manufacturer’s instructions.
5 µg/ml rhAPC was applied for 1-24 hours after 30 minutes’ LPS application LPS
application.
2.7. Stimulation of Cells with LPS
Endothelial cells were seeded in 300 μl complete medium with a density of 10 000
cells/well, in 48-96 well plates or 50 000 cells/well on a silicone membrane.
Cardiomyocytes were seeded in 300 µl complete medium with a density of 100 000 cells
per well and/or silicone membrane.
When the cells were confluent, they were washed once with PBS.
Different amounts of LPS were diluted in complete cell culture medium and added to the
cells. Control cultures were incubated with complete medium only.
Cell culture supernatants were collected and frozen at -80oC before analysis by ELISA.
2.8. Treating the Cells with rhAPC After LPS Stimulation
Endothelial cells were seeded in 300 μl complete medium with a density of 10 000
cells/well, in 48-96 well plates or 50 000 cells/well on a silicone membrane.
Cardiomyocytes were seeded in 300 µl complete medium with a density of 100 000 cells
per well and/or silicone membrane.
After reaching confluency, the cells were incubated with different concentrations of LPS
from 0.1 µg/ml to 2µg/ml for 30 minutes.
5µg/ml rhAPC was applied to each sample for incubation times between 3 hours and 24
hours.
Cell culture mediums were collected after incubation and stored at -80oC for ELISA experiments.
Control samples were incubated with complete medium only.
33
2.9. Cell Proliferation
CellTiter 96® AQueous One Solution Cell Proliferation Assay, 200 assays (Cat. No. G3582) were
used to detect the proliferation of the cells after LPS and rhAPC application.
The CellTiter 96® AQueous One Solution Cell Proliferation Assay is a colorimetric method for
determining the number of viable cells in proliferation. The Solution Reagent contains a novel
tetrazolium compound [3-(4.5-dimethylthiazol-2-yl)-5-(3-carboxymethoxyphenyl)-2-(4-
sulfophenyl)-2H-tetrazolium, inner salt; MTS(a)] and an electron-coupling reagent (phenazine
ethosulfate; PES). PES has an enhanced chemical stability, which allows it to be combined with
MTS to form a stable solution. The MTS tetrazolium compound (Owen’s reagent) is bioreduced
by cells into a colored formazan product that is soluble in tissue culture medium. This conversion
is presumably accomplished by NADPH or NADH, produced by dehydrogenase enzymes in
metabolically active cells.
The CellTiter 96® AQueous One Solution Reagent was thawed. The manufacturer’s
instructions indicate that it should take approximately 90 minutes at room temperature, or
10 minutes in a water bath at 37°C, to completely thaw 20ml of the reagent.
20 μl of CellTiter 96® AQueous One Solution Reagent was pipetted into each well of the
96-well assay plate containing the samples in 100 μl of culture medium.
The plate was incubated at 37°C for 1, 2 and 3 hours in a humidified, 5% CO2 atmosphere.
The absorbance was recorded at 490 nm using a 96-well plate reader.
2.10. Cell Cytotoxicity
The MultiTox-Glo Multiplex Cytotoxicity Assay, 10 ml (Cat nm.;G9270) was used to detect the
viability and cytotoxicity of the cells after LPS and rhAPC application.
The MultiTox-Glo Multiplex Cytotoxicity Assay (a–c) is a sequential-reagent-addition fluorescent
and luminescent assay that measures the relative number of live and dead cells in cell populations.
It gives ratiometric, inversely correlated measures of cell viability and cytotoxicity, which
correlate well with established methods for measuring viability and cytotoxicity.
34
The MultiTox-Glo Assay sequentially measures two protease activities; one is a marker of cell
viability, and the other is a marker of cytotoxicity.
Adherent cells were harvested (by trypsinization), washed with fresh medium to remove
residual trypsin and resuspended in fresh medium.
The number of viable cells was determined by trypan blue exclusion using a
hemacytometer, then diluted to 100 000 viable cells/ml in at least 3.0 ml of fresh medium.
100 μl of the 100 000 cells/ml suspension (10 000 cells/well) was added to all wells of
rows A and B in a 96-well plate.
100 μl of fresh medium were added to all wells in rows B–H.
Using a multichannel pipettor, the cell suspension in row B was mixed by pipetting, with
care taken not to create foam or bubbles. 100 μl were transferred from each well of row B
to row C. Mixing was repeated, and 100 μl were transferred from row C to row D. This
process was repeated to row G. After mixing the diluted suspension at row G, 100 μl was
aspirated from the wells, and discarded. This procedure created dilutions of 10,000
cells/well in row A to 156 cells/well in row G. Row H serves as a no-cell background
control.
Digitonin was diluted to 300 μg/ml in water. Using a multichannel pipettor, care was taken
to add 10 μl to the lyse cells in all wells of columns 7–12; these were the treated samples.
10 μl of water was added to all wells of columns 1–6 so that the volume in all wells was
equal; these were the untreated cells.
50 μl of the GF-AFC Reagent was added to all wells, mixed briefly by orbital shaking to
ensure homogeneity and incubated at 37°C for at least 30 minutes. The plates were
protected from light.
The resulting live-cell fluorescence was measured at ~400nmEx/~505nmEm.
50 μl of AAF-Glo™ Reagent was added to all wells, mixed briefly by orbital shaking, and
incubated for 15 minutes at room temperature. The plates were protected from ambient
light sources.
The resulting dead-cell luminescence was measured.
35
The signal-to-noise ratios were calculated to determine the practical sensitivity of cells for
each dilution (10 000 cells/well; 5 000 cells/well; etc.).
2.11. Total RNA Extraction
The RNeasy® Mini Kit (Cat. No. 74104) was used to isolate total RNA from HAoEC and
cardiomyocytes.
2.11.1. Determination of RNA Yield and Purity
The concentration of RNA was determined by measuring the absorbance at 260 nm
(A260) in a spectrophotometer. Readings were greater than 0.15.
(An absorbance of 1 unit at 260 nm corresponds to 40 μg of RNA per ml (A260 =1⇒ 40
μg/ml).
Water was used to dilute the RNA sample and to measure samples.
The ratio between the absorbance values at 260 and 280 nm was used to estimate RNA
purity.
RNase–free cuvettes were used for measurements.
The quantitation of RNA was calculated as below:
Concentration of RNA sample = 40 x A260 x dilution factor (µg/ml)
2.11.2. Integrity of RNA
Formaldehyde Agarose (FA) Gel Electrophoresis was carried out to check the integrity and size
distribution of total RNA.
36
2.11.3. 1.2 % FA Gel Preparation
FA gel (1. 2% agarose) of size 10 x 14 x 0.7 cm was mixed with:
1.2 g agarose
10 ml 10x FA gel buffer
RNase-free water to 100 ml
The mixture was heated to melt the agarose, and cooled to 65°C in a water bath.
1.8 ml of 37% (12.3 M) formaldehyde and 1 μl of a 10 mg/ml SYBR Green I solution were
added.
The gel solution was mixed thoroughly and poured onto gel support. The buffer was
equilibrated in 1x FA gel for at least 30 min.
2.11.4. RNA Sample Preparation for FA Gel Electrophoresis
1 volume of 5x loading buffer and 4 volumes of RNA sample (for 10 μl of loading buffer
and 40 μl of RNA) were mixed.
It was incubated for 3–5 min at 65°C, chilled on ice, and loaded onto the equilibrated FA
gel.
2.11.5. Gel Running Conditions
Samples were run at 5–7 V/cm in 1x FA gel running buffer for 45 min.
2.12. Reverse Transcription
Omniscript® Reverse Transcription Kit, Qiagen, (Cat. No. 205311) was used to carry out the
reverse transcription of RNA into cDNA.
Template RNA was thawed on ice.
The primer solutions, Quantiscript RT Buffer, Quantiscript Reverse Transcriptase, gDNA
Wipeout buffer and RNase-free water were thawed at room temperature (15–25°C) and
stored on ice immediately after thawing.
37
Each solution was mixed by vortexing, and centrifuged briefly to collect residual liquid
from the sides of the tubes.
The genomic DNA elimination reaction was prepared on ice according to the table below.
The mixture was incubated for 2 min at 42 0C and then placed immediately on ice.
The reverse-transcription master mix was prepared on ice according to the table below.
Components were mixed and stored on ice.
The mixture was incubated for 15 min at 420C and then incubated for 3 min at 95
0C to
inactivate Quantiscript Reverse Transcriptase.
The yield was aliquoted for real-time PCR.
2.13. Real-Time PCR
Real-time PCR was carried out to examine the changes in the transcription of target genes at the
level of mRNA.
The QuantiTect SYBR Green PCR Kit (Qiagen, Cat. No.: 204143) was used for real-time PCR,
which was performed by means of the iCycler device.
The forward and reverse primers were bought from Qiagen Company.
HAoEC
Real Time Quantitative PCR for Endothelial Cells
18srRNA primer kit (Qiagen, Hs_RRN18S_1_SG, QuantiTect Primer Assay, Cat. No.
QT00199367). The 18srRNA gene was used as a housekeeping gene.
IL-6 primer kit (Qiagen, Hs_IL6_1_SG QuantiTect Primer Assay, Cat. No. QT00083720).
RhoA primer kit (Qiagen, Hs_RHOA_1_SG QuantiTect Primer Assay, Cat. no.
QT00044723)).
38
Cardiomyocytes
18srRNA primer kit (Qiagen, Ms_RRN18S_1_SG, QuantiTect Primer Assay, Cat. No.
QT01036875). The 18srRNA gene was used as a housekeeping gene.
F2r primer kit (Mm_F2r_1_SG QuantiTect Primer Assay, Cat. No. QT00119812),
Procr primer kit (Mm_Procr_1_SG QuantiTect Primer Assay, Cat. No. QT00103061)).
Real-Time PCR procedure
2x QuantiTect SYBR Green PCR Master Mix, cDNA, primers, and RNase-free water were
thawed. They were mixed in individual solutions.
A reaction mix was prepared according to Table 3 below.
The reaction mix was mixed thoroughly, and appropriate volumes were dispensed into
PCR plates.
Template cDNA was added to the individual PCR wells containing the reaction mix.
The real-time cycler was programmed according to the program outlined in Table 4 below:
Data acquisition was performed during the extension step.
The PCR plates were placed in the real-time cycler, and the cycling program started.
A melting curve analysis of the PCR product(s) was performed.
The PCR products were run in 1.5% agarose gel with 80V for 1 hour.
The Ct values were analyzed using the relative expression analysis program REST-2008 (Corbett,
Version 1.9.2), and the relative expression ratio was evaluated. (Threshold cycle (CT): This is the
cycle at which the amplification plot crosses the threshold, i.e., at which there is a significant
detectable increase in fluorescence. The CT serves as a tool for calculating the starting template
amount in each sample).
39
2.14. Cytokines, ELISA
2.14.1. Cytokine IL-6, ELISA, HAoEC
The cytokine IL-6 concentration in cell culture supernatants was quantified by sandwich-ELISA
using specific pairs of monoclonal antibodies against IL-6 (eBioscience, Cat. No. 88-7966) for
HAoEC.
The standards were prepared using assay diluents.
100 μl/well of standard was added to the appropriate wells. 2-fold serial dilutions of the top
standards were performed to create the standard curve.
100 μl/well of the samples was added to the appropriate wells. The plate was covered and
incubated at room temperature overnight at 4°C for maximal sensitivity.
The wells were aspirated and washed 5 times with 300 µl/well Wash Buffer (diluted to
1X). (Allowing time for soaking (~1 minute) during each wash step increases the
effectiveness of the washes.) Any residual buffer was removed with absorbent paper.
100 μl/well of detection antibody diluted in 1X Assay diluent was added, and the plate was
covered.
The plate was incubated for 1 hour at room temperature.
The wells were aspirated and washed 5 times with 300 µl/well Wash Buffer (diluted to
1X). (Allowing time for soaking (~1 minute) during each wash step increases the
effectiveness of the washes.) Any residual buffer was removed with absorbent paper.
100 μl/well of Avidin-HRP* diluted in 1X Assay diluent was added (diluted as noted on C
of A) and the plate was covered and incubated at room temperature for 30 minutes.
The wells were aspirated and washed 5 times with 300 µl/well Wash Buffer (diluted to
1X). (Allowing time for soaking (~1 minute) during each wash step increases the
effectiveness of the washes.) Any residual buffer was removed with absorbent paper.
100 μl/well of Substrate Solution was added to each well. The plate was incubated at room
temperature for 15 minutes.
50 μl of Stop Solution was added to each well.
Readings of the plate were carried out at 450 nm.
40
2.14.2. Cytokine IL-6 and TNF-alpha, ELISA, Cardiomyocytes
Concentrations of the cytokines IL-6 and TNF-alpha in cell culture supernatants were quantified
by sandwich-ELISA using specific pairs of monoclonal antibodies against IL-6 (R&D systems,
Cat. No. M6000B and Cat. No. MTA00) for cardiomyocytes. The assays were carried out
according to the protocols set out by the manufacturers.
Reagents, samples, and standard dilutions were prepared as described in the
manufacturer’s protocol.
Excess microplate strips were removed from the plate frame.
50 µl of Assay Diluent RD1W was added to each well.
50 µl of Standard, Control, or sample was added per well.
They were mixed gently by tapping the plate frame for 1 minute. The plate was covered
with the adhesive strip provided and incubated for 2 hours at room temperature.
Each well was aspirated and washed, repeating the process four times for a total of five
washes. (Wells were washed by filling each with Wash Buffer (400 µl). The complete
removal of liquid at each step is essential to good performance.) The plate was inverted
against clean paper towels.
100 µl of mouse TNF-α Conjugate was added to each well. The plate was inverted against
clean paper towels and incubated for 2 hours at room temperature.
The aspiration/wash step was repeated.
100 µl of Substrate Solution was added to each well and the plate was incubated for 30
minutes at room temperature, with light protection.
100 µl of Stop Solution was added to each well and the plate was gently tapped to ensure
thorough mixing.
The optical density of each well was determined within 30 minutes, using a microplate
reader set to 450 nm.
41
2.15. ROS Activation
3´-(p-hydroxyphenyl) fluorescein (HPF) (Molecular Probes, Cat. No. H36004) was used as an
indicator for highly reactive oxygen species.
HAoEC and cardiomyocytes were seeded in 300 μl complete medium with a density of 20
000 cells/well in 48-well plates.
The cells were treated with LPS after confluency. The 3´-(p- hydroxyphenyl) fluorescein
stock solution was diluted in the DMEM.
The cells were incubated with the diluted HPF solution for 10 minutes at room
temperature, washed to remove excess probe and replaced with fresh buffer.
The pictures were taken under confocal microscopy. The fluorescence excitation and
emission maxima used were 490 and 515 nm respectively.
2.16. Actin Stress Fiber Staining and Confocal Microscopy
HAoEC and cardiomyocytes were seeded in 48-well plates with a density of 20 000
cells/well. 2U/ml thrombin was applied for 1, 5, 10, 20, and 30 minutes, and actin stress
fiber staining was carried out with phalloidin labeling.
HAoEC and cardiomyocytes were seeded in 300 μl complete medium with a density of 20
000 cells/well in 48-well plates.
After becoming confluent, the cells were treated with LPS and/or thrombin.
The cells were washed twice with pre-warmed phosphate-buffered saline, pH 7.4 (PBS,
D8537).
The cells were fixed with 3.7% formaldehyde in PBS for 15 minutes at room temperature.
After fixation the cells were washed with PBS.
For staining with fluorescent phallotoxin (Invitrogen, Cat. No.A12379), 5 μl of methanolic
stock solution was diluted in 200 μl PBS.
The phallotoxin staining solution was placed on the cover slip for 20 minutes at room
temperature.
The samples were washed twice with PBS and mounting solution was added.
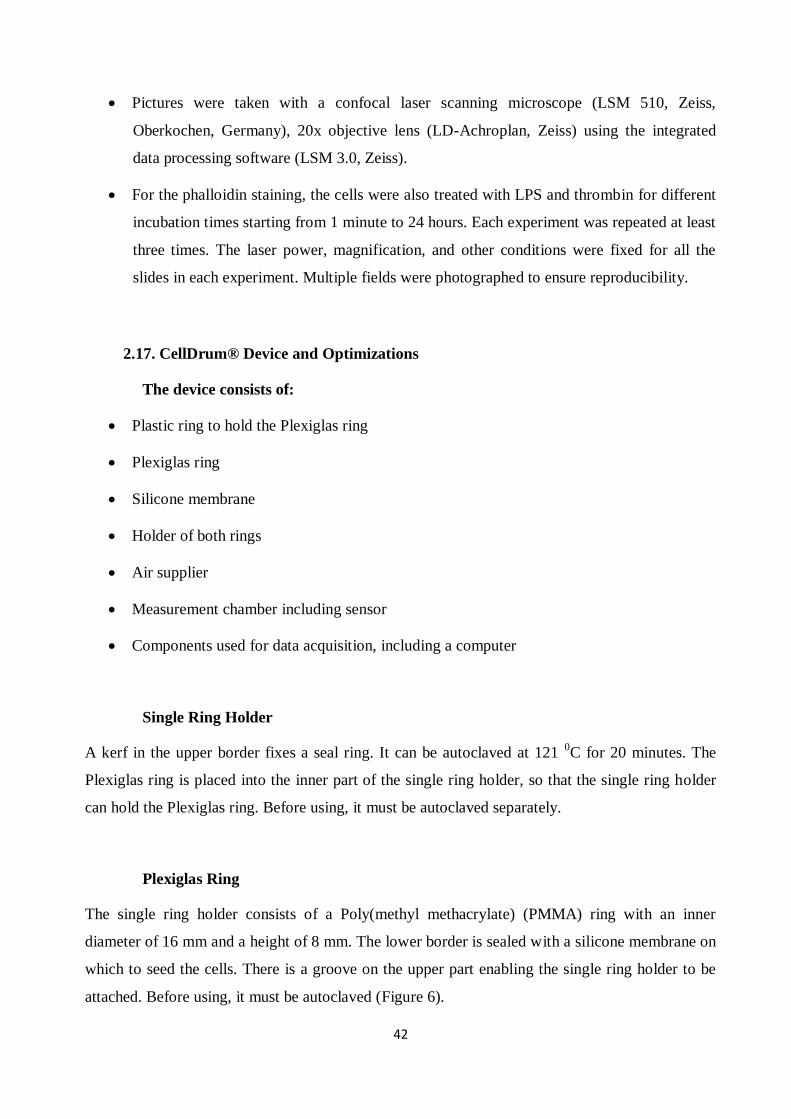
42
Pictures were taken with a confocal laser scanning microscope (LSM 510, Zeiss,
Oberkochen, Germany), 20x objective lens (LD-Achroplan, Zeiss) using the integrated
data processing software (LSM 3.0, Zeiss).
For the phalloidin staining, the cells were also treated with LPS and thrombin for different
incubation times starting from 1 minute to 24 hours. Each experiment was repeated at least
three times. The laser power, magnification, and other conditions were fixed for all the
slides in each experiment. Multiple fields were photographed to ensure reproducibility.
2.17. CellDrum® Device and Optimizations
The device consists of:
Plastic ring to hold the Plexiglas ring
Plexiglas ring
Silicone membrane
Holder of both rings
Air supplier
Measurement chamber including sensor
Components used for data acquisition, including a computer
Single Ring Holder
A kerf in the upper border fixes a seal ring. It can be autoclaved at 121 0C for 20 minutes. The
Plexiglas ring is placed into the inner part of the single ring holder, so that the single ring holder
can hold the Plexiglas ring. Before using, it must be autoclaved separately.
Plexiglas Ring
The single ring holder consists of a Poly(methyl methacrylate) (PMMA) ring with an inner
diameter of 16 mm and a height of 8 mm. The lower border is sealed with a silicone membrane on
which to seed the cells. There is a groove on the upper part enabling the single ring holder to be
attached. Before using, it must be autoclaved (Figure 6).
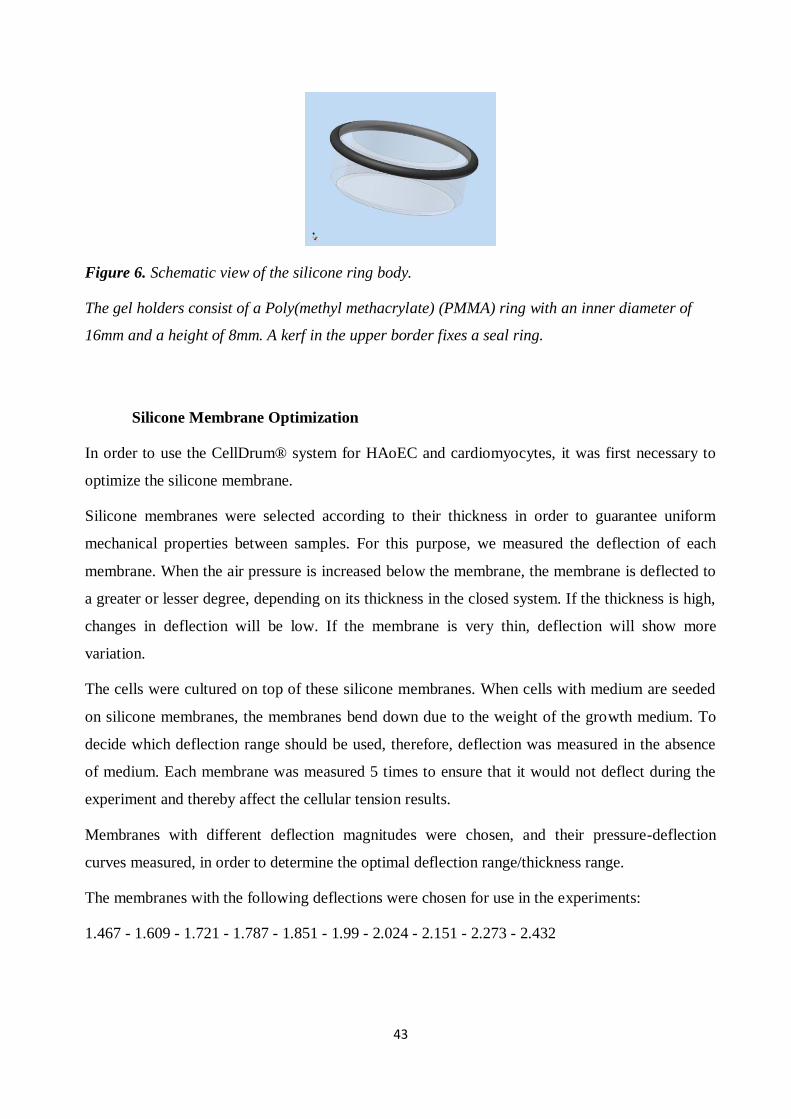
43
Figure 6. Schematic view of the silicone ring body.
The gel holders consist of a Poly(methyl methacrylate) (PMMA) ring with an inner diameter of
16mm and a height of 8mm. A kerf in the upper border fixes a seal ring.
Silicone Membrane Optimization
In order to use the CellDrum® system for HAoEC and cardiomyocytes, it was first necessary to
optimize the silicone membrane.
Silicone membranes were selected according to their thickness in order to guarantee uniform
mechanical properties between samples. For this purpose, we measured the deflection of each
membrane. When the air pressure is increased below the membrane, the membrane is deflected to
a greater or lesser degree, depending on its thickness in the closed system. If the thickness is high,
changes in deflection will be low. If the membrane is very thin, deflection will show more
variation.
The cells were cultured on top of these silicone membranes. When cells with medium are seeded
on silicone membranes, the membranes bend down due to the weight of the growth medium. To
decide which deflection range should be used, therefore, deflection was measured in the absence
of medium. Each membrane was measured 5 times to ensure that it would not deflect during the
experiment and thereby affect the cellular tension results.
Membranes with different deflection magnitudes were chosen, and their pressure-deflection
curves measured, in order to determine the optimal deflection range/thickness range.
The membranes with the following deflections were chosen for use in the experiments:
1.467 - 1.609 - 1.721 - 1.787 - 1.851 - 1.99 - 2.024 - 2.151 - 2.273 - 2.432
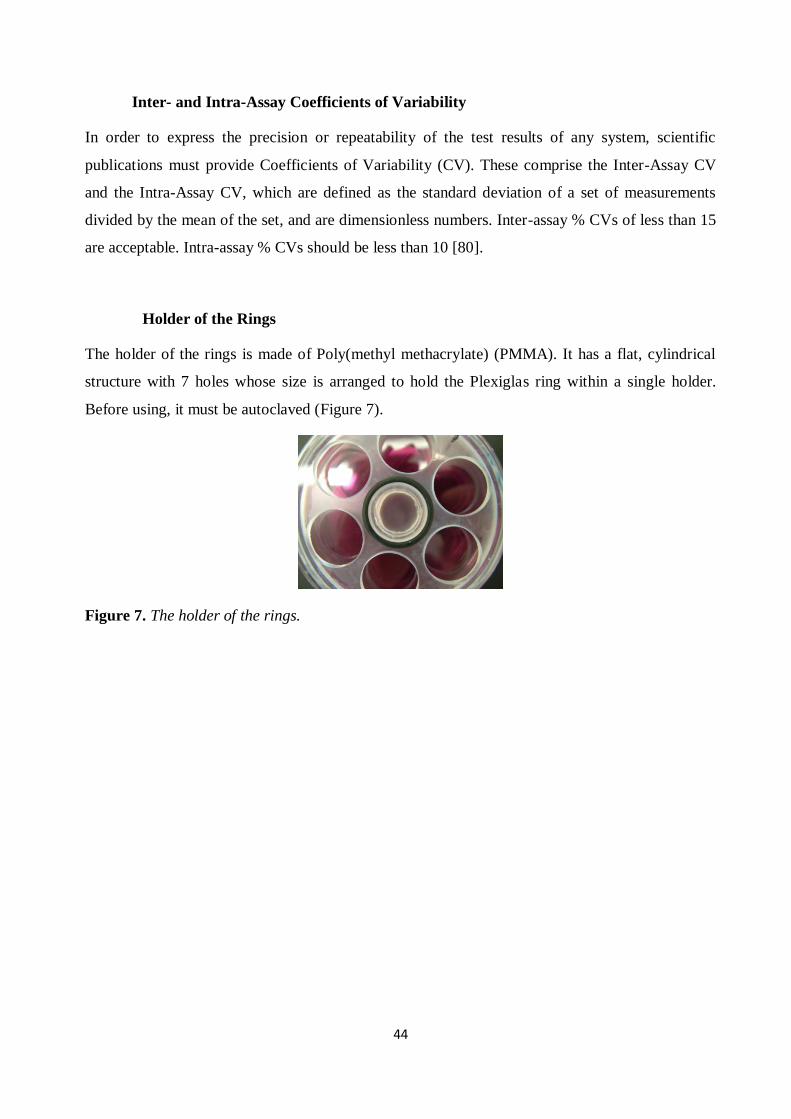
44
Inter- and Intra-Assay Coefficients of Variability
In order to express the precision or repeatability of the test results of any system, scientific
publications must provide Coefficients of Variability (CV). These comprise the Inter-Assay CV
and the Intra-Assay CV, which are defined as the standard deviation of a set of measurements
divided by the mean of the set, and are dimensionless numbers. Inter-assay % CVs of less than 15
are acceptable. Intra-assay % CVs should be less than 10 [80].
Holder of the Rings
The holder of the rings is made of Poly(methyl methacrylate) (PMMA). It has a flat, cylindrical
structure with 7 holes whose size is arranged to hold the Plexiglas ring within a single holder.
Before using, it must be autoclaved (Figure 7).
Figure 7. The holder of the rings.
45
The Measurement Chamber, Including the Sensor
The body of the device is constructed from a PMMA block (Figure 8).
Figure 8. Schematic view of the body of the cellular tension measurement system.
The body of the device is constructed from a PMMA block. Inside this block there is the distance
sensor. It is based on a laser triangulation method to determine the exact distance to the gel
surface. The laser beam hits the center of the collagen membrane orthogonally. The hit point is
tracked under an angle of 40° by a CCD-chip so that the exact distance between the sensor and
the surface can be calculated with a resolution of 1 µm.
There is a laser system inside this block. The exact distance that the membrane bends to the
starting point is determined by a laser triangulation method.
The laser beam hits the center of the membrane orthogonally. The hit point is tracked under an
angle of 40° by a CCD-chip so that the exact distance between the sensor and the surface can be
calculated with a resolution of 1 µm.
The probe holder (Figure 9) of the device is a ring made of aluminum, enabling it to be
autoclaved. On its outside surface, there is a fine pitch thread which may be turned to adjust the
distance between the probe and the sensor. Tunnels around the centered hole for the PMMA ring
allow the pressure to escape.
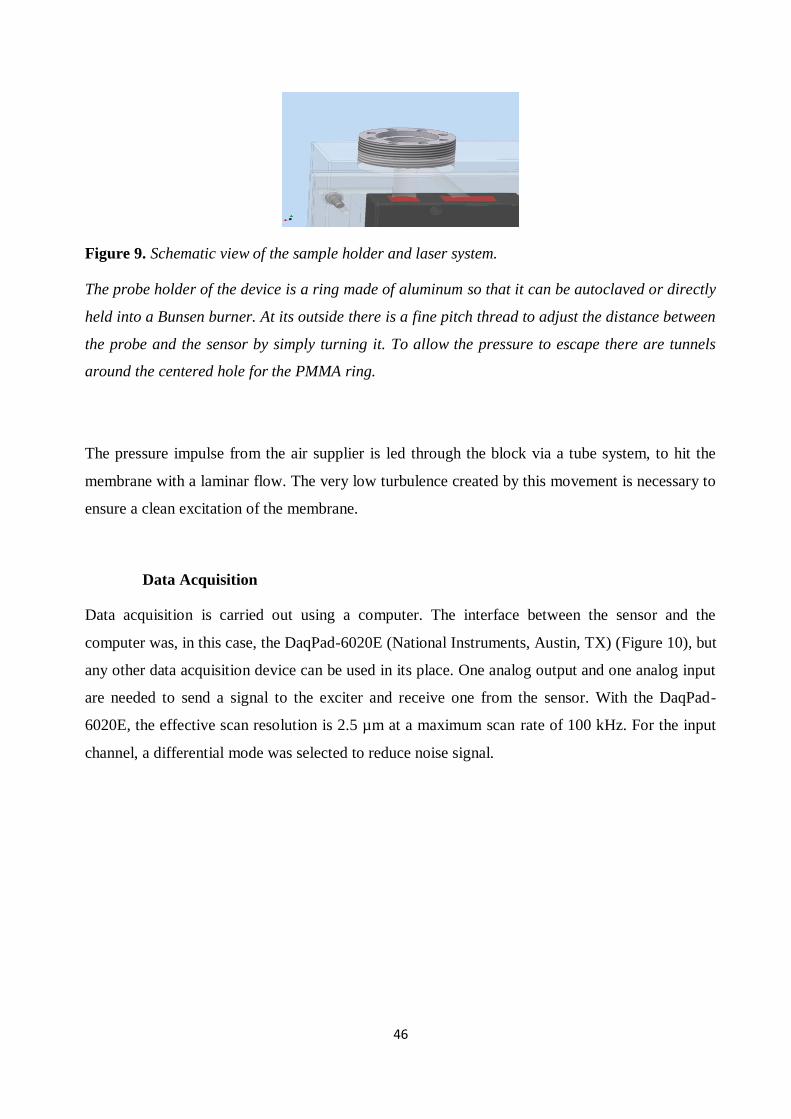
46
Figure 9. Schematic view of the sample holder and laser system.
The probe holder of the device is a ring made of aluminum so that it can be autoclaved or directly
held into a Bunsen burner. At its outside there is a fine pitch thread to adjust the distance between
the probe and the sensor by simply turning it. To allow the pressure to escape there are tunnels
around the centered hole for the PMMA ring.
The pressure impulse from the air supplier is led through the block via a tube system, to hit the
membrane with a laminar flow. The very low turbulence created by this movement is necessary to
ensure a clean excitation of the membrane.
Data Acquisition
Data acquisition is carried out using a computer. The interface between the sensor and the
computer was, in this case, the DaqPad-6020E (National Instruments, Austin, TX) (Figure 10), but
any other data acquisition device can be used in its place. One analog output and one analog input
are needed to send a signal to the exciter and receive one from the sensor. With the DaqPad-
6020E, the effective scan resolution is 2.5 µm at a maximum scan rate of 100 kHz. For the input
channel, a differential mode was selected to reduce noise signal.
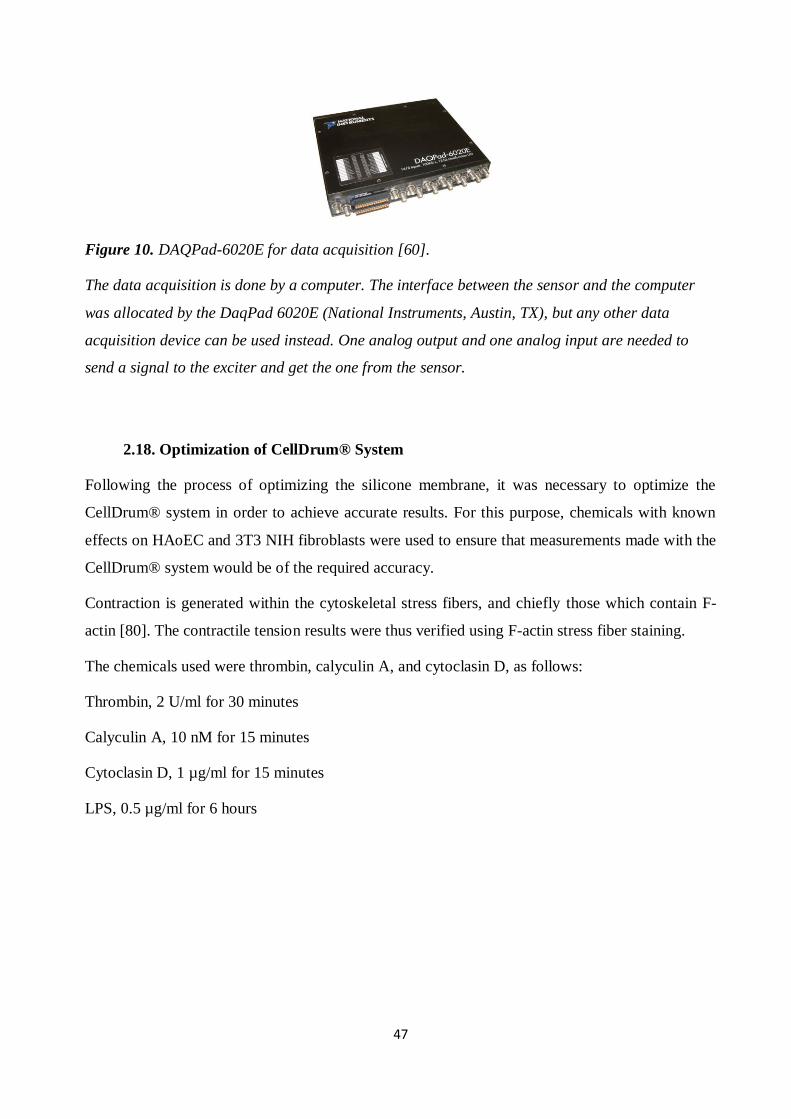
47
Figure 10. DAQPad-6020E for data acquisition [60].
The data acquisition is done by a computer. The interface between the sensor and the computer
was allocated by the DaqPad 6020E (National Instruments, Austin, TX), but any other data
acquisition device can be used instead. One analog output and one analog input are needed to
send a signal to the exciter and get the one from the sensor.
2.18. Optimization of CellDrum® System
Following the process of optimizing the silicone membrane, it was necessary to optimize the
CellDrum® system in order to achieve accurate results. For this purpose, chemicals with known
effects on HAoEC and 3T3 NIH fibroblasts were used to ensure that measurements made with the
CellDrum® system would be of the required accuracy.
Contraction is generated within the cytoskeletal stress fibers, and chiefly those which contain F-
actin [80]. The contractile tension results were thus verified using F-actin stress fiber staining.
The chemicals used were thrombin, calyculin A, and cytoclasin D, as follows:
Thrombin, 2 U/ml for 30 minutes
Calyculin A, 10 nM for 15 minutes
Cytoclasin D, 1 µg/ml for 15 minutes
LPS, 0.5 µg/ml for 6 hours
48
2.19. Measurement
2.19.1. Culturing of the Cells on the Silicon Membrane
This process begins by coating the membrane with fibronectin at 370C for 3 hours or at 4
0C
overnight. The fibronectin was removed after incubation, and the cells with 300 µl of medium
were added to the fibronectin-coated membrane. After the seeded cells were incubated at room
temperature for one hour, 200 µl of medium was added. The reason for adding 300 µl of medium
first, and then waiting for one hour, is to prevent the edge effect of the cell attachment. Silicone
membranes are very flexible; the medium added causes the membrane to bend, which makes the
cell pool in the middle of the membrane.
2.19.2. Device Preparation
Since contractile tension can be measured in less than one minute, and the cells cannot be used
more than once, the measurement can be made outside a laminar flow cabinet.
First, the device is cleaned with alcohol. Subsequently, the holder is screwed into the right
position to enable the laser to focus on the middle of the membrane. The DaqPad is connected to a
computer and both are switched on. The last step is to turn on the key switch at the laser control
module.
2.19.3. CellDrum® System Measurement Principle
The CellDrum® measurement system is a drum-like construct used to assess the biomechanical
properties of various cell types in in-vitro conditions [86]. It consists of a cylindrical body, one
side of which is sealed with biocompatible silicone membrane. The cells are seeded on top of the
silicon membrane, which is coated with fibronectin. Typically, 500 μl of cell culture medium is
poured into a CellDrum® ring. Since silicone membranes are very thin, any change in cell
contraction will be transmitted to the membrane. The air pressure below the membrane is
increased, which causes the membrane to deflect. The amount of deflection changes depending on
the stiffness of the membrane. This stiffness gives us information about the properties of each
sample. The main factor which affects the stiffness of the membrane is membrane displacement,
and the main factor influencing displacement is cell contraction. Any change in deflection
(displacement) can be detected using a laser system (LK-031, KEYENCE GmbH, Neu-lsenburg,
Germany) [86]. The results are evaluated with LabVIEW-based software. The displacement of the
49
membrane gives us the strain value, which refers to the deformation per unit length according to
the strain/pressure curves obtained by CellDrum® measurement. When the cells contract, the
length of the membrane shortens, resulting in an increasing proportion of strain/pressure. In
relation to contractile tension results, this represents an indirect ratio between cellular contraction
and the strain applied to the membrane.
2.19.4. Calculation of Strain
The deflection versus pressure graph was used to calculate the strain value, with pressure constant
for each application (Figure 11).
The principle of this graph is as follows:
At first, the membrane bends as a result of its own weight, together with that of the cells and
medium it carries. Meanwhile, the air pressure is increasing below the membrane. Since this is a
closed system, there is no air leakage. We assume that, at the beginning, the deflection value must
be negative; however, as the graph shows, the LabVIEW software system adjusts the initial value
to ‘0’ As soon as the air pressure increases, the deflection value changes, moving from ‘negative’
to ‘0’. Deflection increases exponentially until the membrane reaches the deflection value of ‘0’,
which is a point of balance: the moment of transition from negative to positive, when atmospheric
pressure and the weight of the medium are balanced. There is thus no weight effect at this point,
which explains why we use this part of the results to calculate strain values (Figure 12 and Figure
13). As seen in Figure 11, the graph is more linear in this area.
In the positive area, deflection as shown in the graph decreases exponentially as it passes the
balance point and overcomes the weight effect of the medium. The slopes of deflection versus
pressure in the area of balance are calculated by the software.

50
Figure 11. The deflection versus pressure graph. (Software SubVI single scan).
(a)
(b)
(c)
Figure 12. Schematic view of the silicone membrane ring and respective pressure deflection
curve.
With medium in starting position (a). Schematic view of the silicone membrane ring with medium
in ´0´-point position (b). Schematic view of the silicone membrane ring with medium in positive
side position (c).
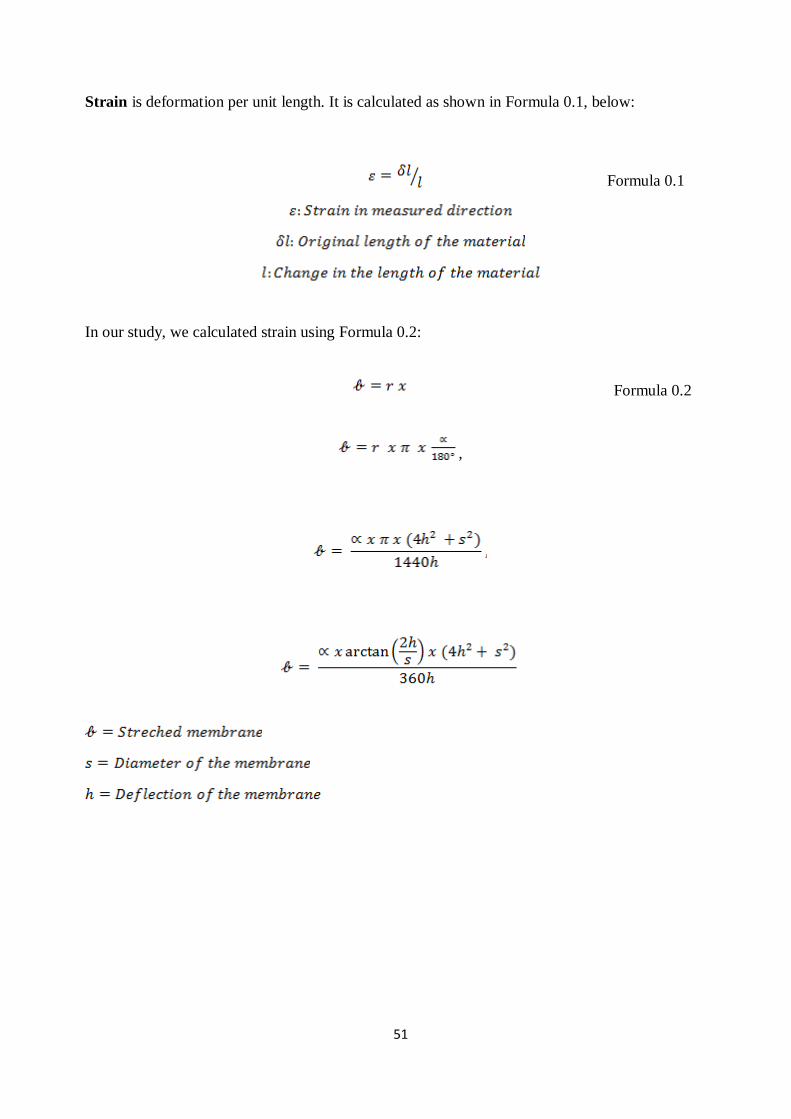
51
Strain is deformation per unit length. It is calculated as shown in Formula 0.1, below:
Formula 0.1
In our study, we calculated strain using Formula 0.2:
Formula 0.2
,
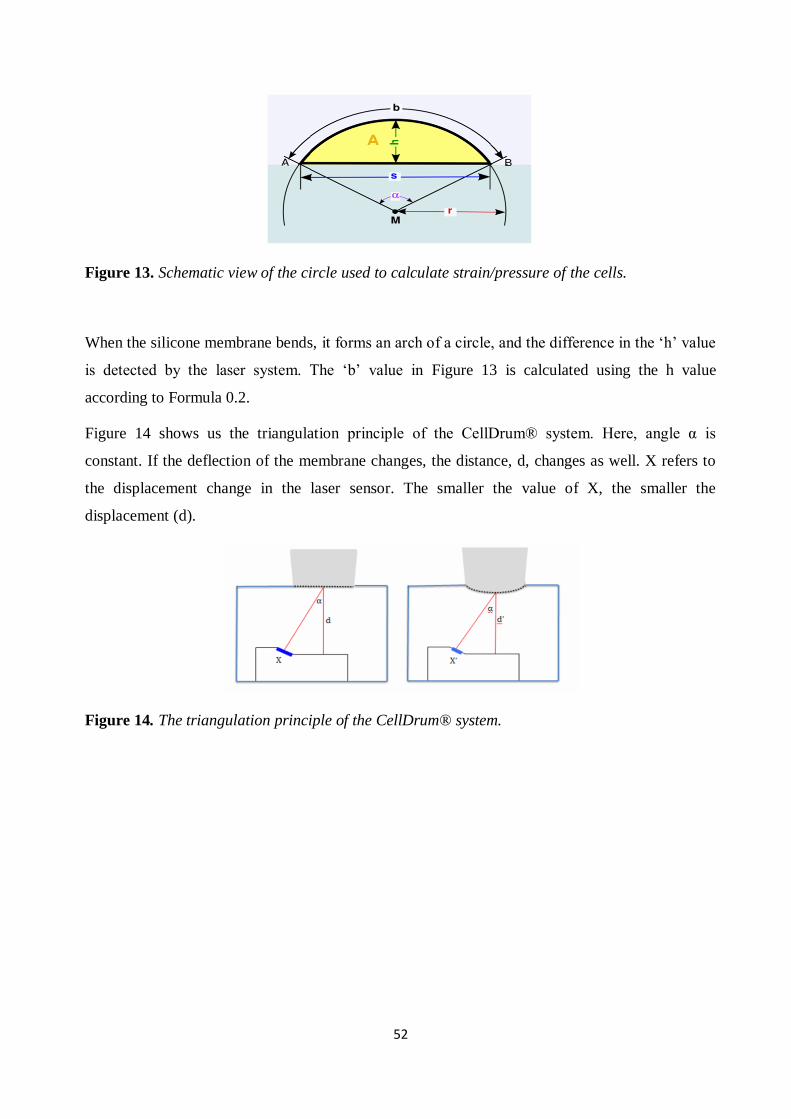
52
Figure 13. Schematic view of the circle used to calculate strain/pressure of the cells.
When the silicone membrane bends, it forms an arch of a circle, and the difference in the ‘h’ value
is detected by the laser system. The ‘b’ value in Figure 13 is calculated using the h value
according to Formula 0.2.
Figure 14 shows us the triangulation principle of the CellDrum® system. Here, angle α is
constant. If the deflection of the membrane changes, the distance, d, changes as well. X refers to
the displacement change in the laser sensor. The smaller the value of X, the smaller the
displacement (d).
Figure 14. The triangulation principle of the CellDrum® system.
53
Normalized Strain/Pressure Results
The results were normalized to minimize variability.
The normalization formula used was as follows:
Formula 0.3
The results were normalized in two different ways. If they included only the control and LPS
application groups, the results for the two groups were normalized together. However, if the
results included rhAPC treatment as well as LPS application groups, the LPS application and
rhAPC treatment groups were normalized with the control groups; in addition, the rhAPC and LPS
groups were normalized with each other to enable the results of rhAPC treatment to be compared
with those of LPS application.
Since there is an indirect ratio between strain/pressure and contraction, in order to understand the
fold change difference between the groups, the fold change contraction values were calculated
using normalized strain/pressure results.
The formula used for absolute fold change contraction is as follows:
Formula 0.4
2.19.4. The Measuring Software
The data acquisition software is written in LabVIEW VII. LabVIEW (National Instruments,
Austin, TX) allows flexible acquisition and processing of analog and digital data. The main
feature that distinguishes LabVIEW from other data acquisition programs is its highly modular
graphical programming language, “G”, and a large library of mathematical and statistical
functions. The advantage of graphical programming is that the code is flexible, reusable, and self-
documenting [53].

54
2.19.5. Statistical Analysis
All experiments were carried out with materials collected from at least three separate cell cultures
in triplicate. All data was analyzed with Sigma Stat for Windows, version 3.5. Comparison of
more than two groups was carried out using a two-way analysis of variance followed by the Rank
Sum test, with significance defined as p < 0.05.
55
3.Results
3.1. Optimization of CellDrum® system
3.1.1. Optimization of the silicone membranes
The respective slopes (deflection/pressure ratios) for the membranes with deflections of 1.467 -
1.609 - 1.721 - 1.787 - 1.851 - 1.99 - 2.024 - 2.151 - 2.273 - 2.432 are shown in Figure 15.
Each membrane was measured 5 times. The fluctuation within each set of five measurements, and
the deflection/pressure ratio for all membranes were compared (Figure 15).
The thinner the membrane, the better environment it provides for the cells in terms of mimicking
their natural environment. However, as seen in Figure 15, higher levels of deflection (thinner
membranes), also cause greater fluctuation. For this reason, a deflection higher than 2.024 could
affect the cells on the silicone membrane, leading to incorrect results. When we checked variation
levels in the results we had obtained, we found that variation is lower than 15% until the
deflection reaches 2.151 mm.
Because a thinner membrane is preferable, the membranes with deflection levels between 1.850
and 2.00 were chosen for the experiments.
As the inter-assay % CV of the CellDrum® system is less than 15, and the intra-assay % CVs are
both less than 10, the contractile tension measurement results are deemed to be acceptable.
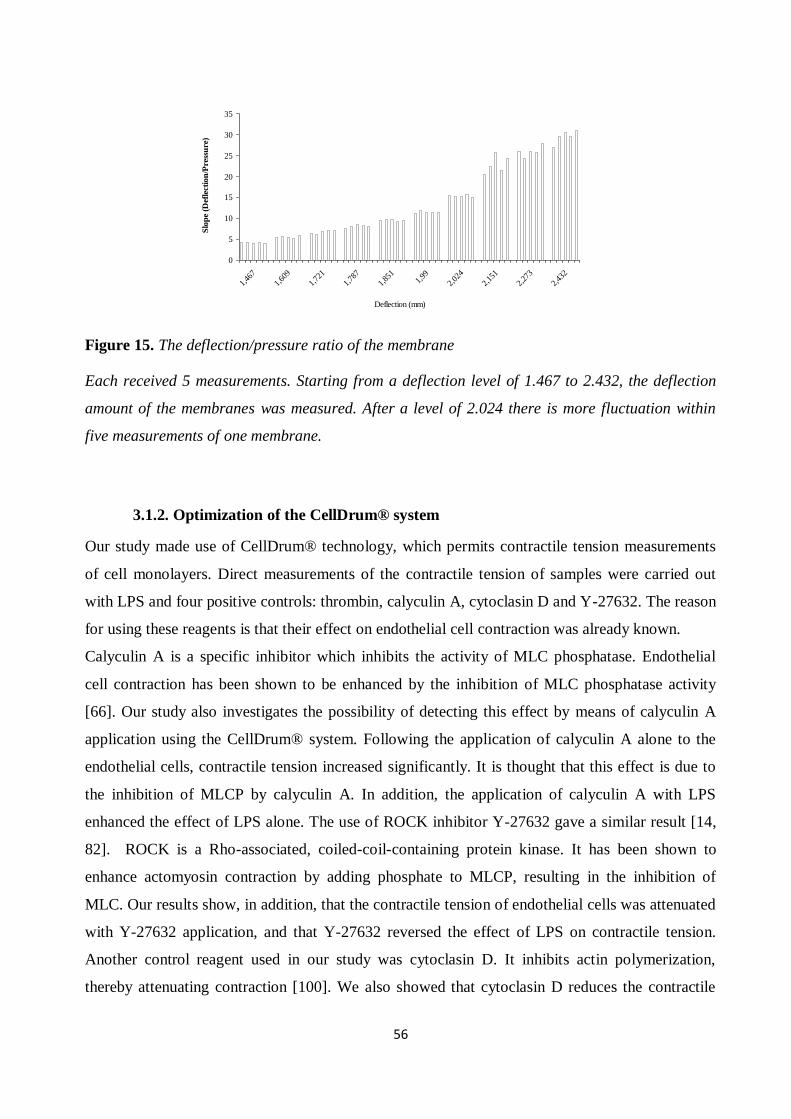
56
0
5
10
15
20
25
30
35
1,46
7
1,60
9
1,72
1
1,78
7
1,85
11,
99
2,02
4
2,15
1
2,27
3
2,43
2
Deflection (mm)
Slo
pe
(Def
lect
ion
/Pre
ssu
re)
Figure 15. The deflection/pressure ratio of the membrane
Each received 5 measurements. Starting from a deflection level of 1.467 to 2.432, the deflection
amount of the membranes was measured. After a level of 2.024 there is more fluctuation within
five measurements of one membrane.
3.1.2. Optimization of the CellDrum® system
Our study made use of CellDrum® technology, which permits contractile tension measurements
of cell monolayers. Direct measurements of the contractile tension of samples were carried out
with LPS and four positive controls: thrombin, calyculin A, cytoclasin D and Y-27632. The reason
for using these reagents is that their effect on endothelial cell contraction was already known.
Calyculin A is a specific inhibitor which inhibits the activity of MLC phosphatase. Endothelial
cell contraction has been shown to be enhanced by the inhibition of MLC phosphatase activity
[66]. Our study also investigates the possibility of detecting this effect by means of calyculin A
application using the CellDrum® system. Following the application of calyculin A alone to the
endothelial cells, contractile tension increased significantly. It is thought that this effect is due to
the inhibition of MLCP by calyculin A. In addition, the application of calyculin A with LPS
enhanced the effect of LPS alone. The use of ROCK inhibitor Y-27632 gave a similar result [14,
82]. ROCK is a Rho-associated, coiled-coil-containing protein kinase. It has been shown to
enhance actomyosin contraction by adding phosphate to MLCP, resulting in the inhibition of
MLC. Our results show, in addition, that the contractile tension of endothelial cells was attenuated
with Y-27632 application, and that Y-27632 reversed the effect of LPS on contractile tension.
Another control reagent used in our study was cytoclasin D. It inhibits actin polymerization,
thereby attenuating contraction [100]. We also showed that cytoclasin D reduces the contractile
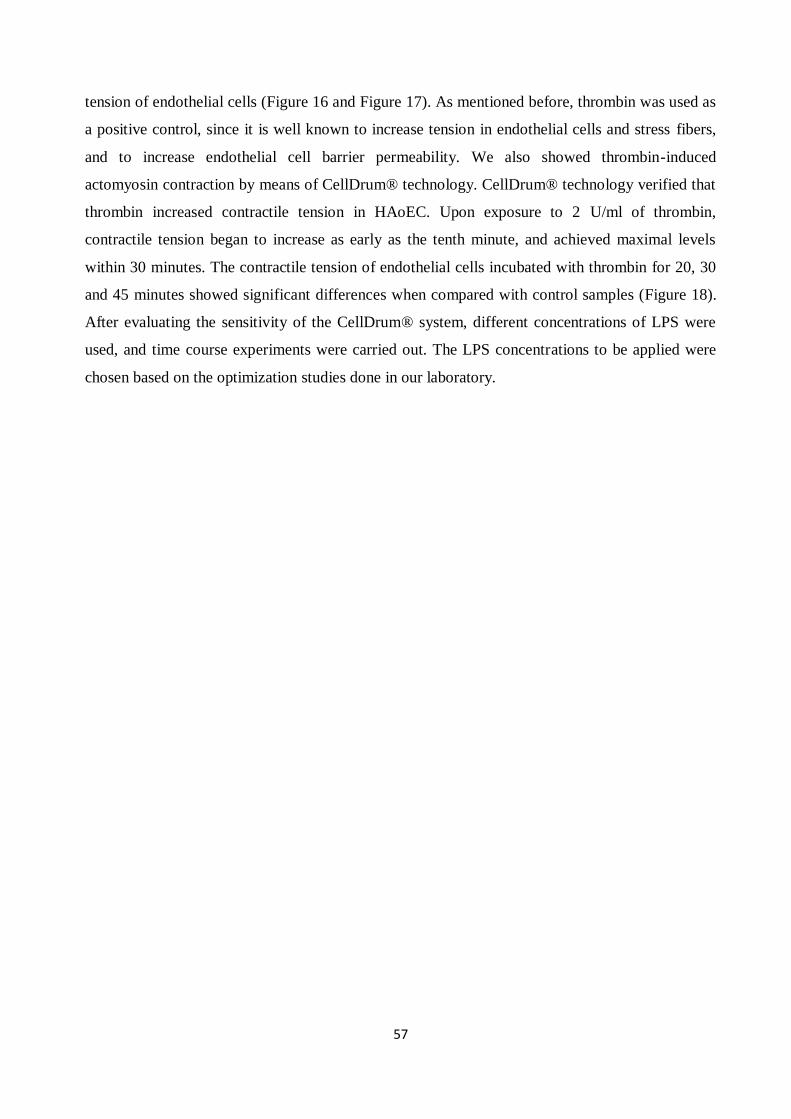
57
tension of endothelial cells (Figure 16 and Figure 17). As mentioned before, thrombin was used as
a positive control, since it is well known to increase tension in endothelial cells and stress fibers,
and to increase endothelial cell barrier permeability. We also showed thrombin-induced
actomyosin contraction by means of CellDrum® technology. CellDrum® technology verified that
thrombin increased contractile tension in HAoEC. Upon exposure to 2 U/ml of thrombin,
contractile tension began to increase as early as the tenth minute, and achieved maximal levels
within 30 minutes. The contractile tension of endothelial cells incubated with thrombin for 20, 30
and 45 minutes showed significant differences when compared with control samples (Figure 18).
After evaluating the sensitivity of the CellDrum® system, different concentrations of LPS were
used, and time course experiments were carried out. The LPS concentrations to be applied were
chosen based on the optimization studies done in our laboratory.
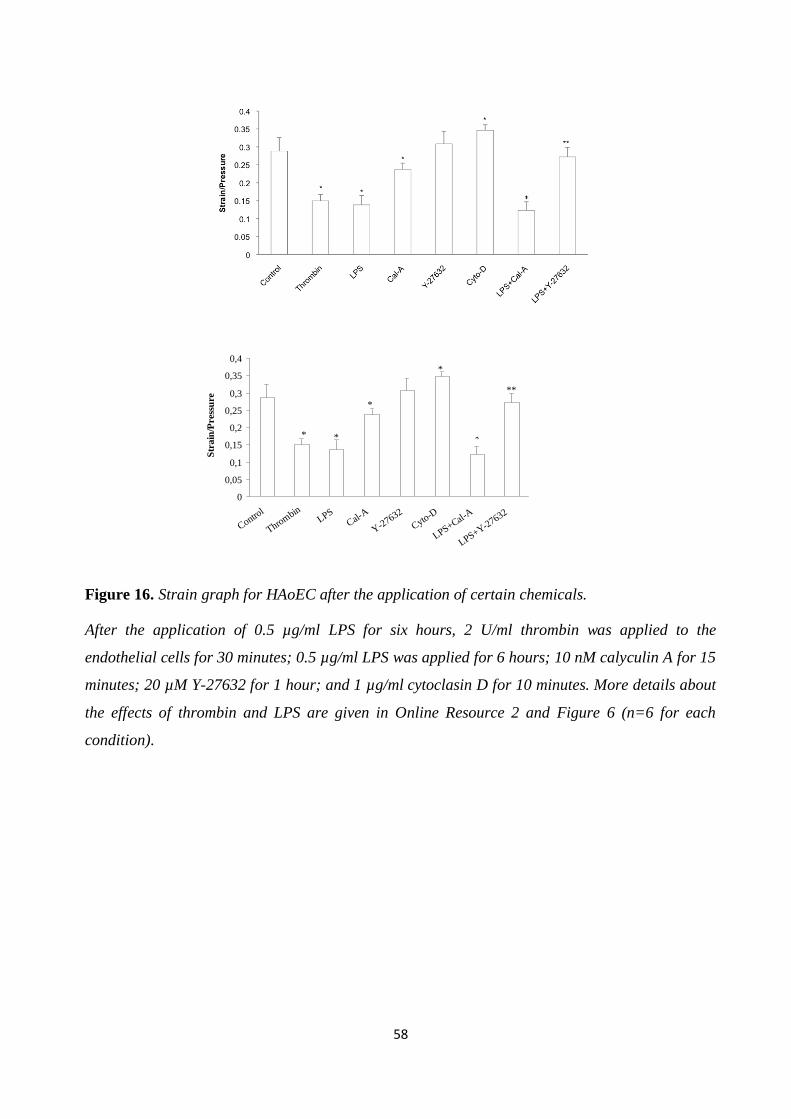
58
0
0,05
0,1
0,15
0,2
0,25
0,3
0,35
0,4
Control
Throm
binLPS
Cal-A
Y-2
7632
Cyto-D
LPS+Cal-A
LPS+Y-27632
Str
ain
/Pre
ssu
re
*
*
*
*
**
Figure 16. Strain graph for HAoEC after the application of certain chemicals.
After the application of 0.5 µg/ml LPS for six hours, 2 U/ml thrombin was applied to the
endothelial cells for 30 minutes; 0.5 µg/ml LPS was applied for 6 hours; 10 nM calyculin A for 15
minutes; 20 µM Y-27632 for 1 hour; and 1 µg/ml cytoclasin D for 10 minutes. More details about
the effects of thrombin and LPS are given in Online Resource 2 and Figure 6 (n=6 for each
condition).
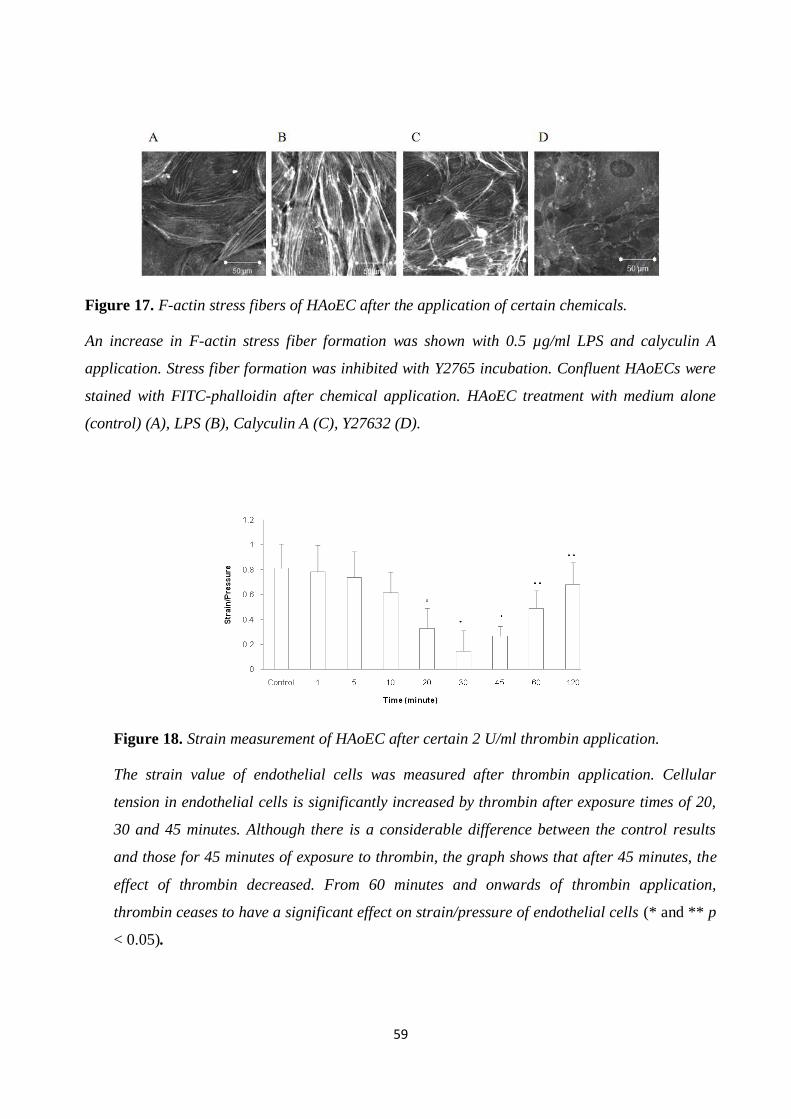
59
Figure 17. F-actin stress fibers of HAoEC after the application of certain chemicals.
An increase in F-actin stress fiber formation was shown with 0.5 µg/ml LPS and calyculin A
application. Stress fiber formation was inhibited with Y2765 incubation. Confluent HAoECs were
stained with FITC-phalloidin after chemical application. HAoEC treatment with medium alone
(control) (A), LPS (B), Calyculin A (C), Y27632 (D).
Figure 18. Strain measurement of HAoEC after certain 2 U/ml thrombin application.
The strain value of endothelial cells was measured after thrombin application. Cellular
tension in endothelial cells is significantly increased by thrombin after exposure times of 20,
30 and 45 minutes. Although there is a considerable difference between the control results
and those for 45 minutes of exposure to thrombin, the graph shows that after 45 minutes, the
effect of thrombin decreased. From 60 minutes and onwards of thrombin application,
thrombin ceases to have a significant effect on strain/pressure of endothelial cells (* and ** p
< 0.05).
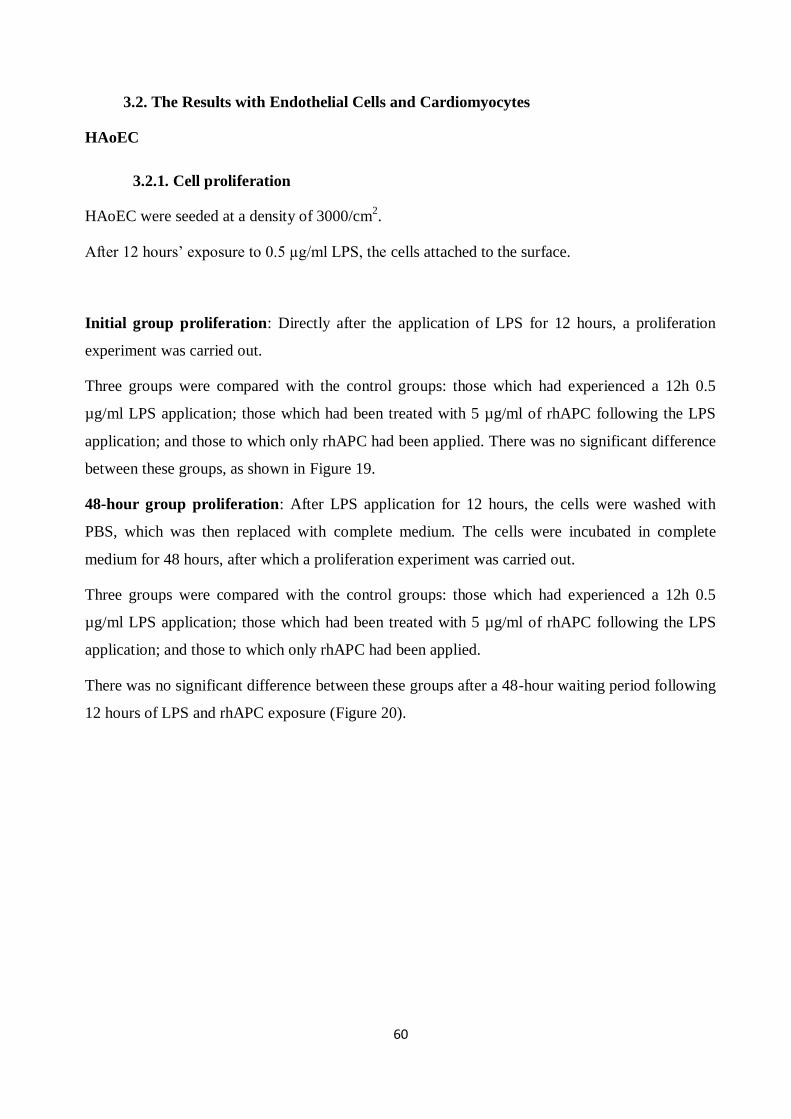
60
3.2. The Results with Endothelial Cells and Cardiomyocytes
HAoEC
3.2.1. Cell proliferation
HAoEC were seeded at a density of 3000/cm2.
After 12 hours’ exposure to 0.5 µg/ml LPS, the cells attached to the surface.
Initial group proliferation: Directly after the application of LPS for 12 hours, a proliferation
experiment was carried out.
Three groups were compared with the control groups: those which had experienced a 12h 0.5
µg/ml LPS application; those which had been treated with 5 µg/ml of rhAPC following the LPS
application; and those to which only rhAPC had been applied. There was no significant difference
between these groups, as shown in Figure 19.
48-hour group proliferation: After LPS application for 12 hours, the cells were washed with
PBS, which was then replaced with complete medium. The cells were incubated in complete
medium for 48 hours, after which a proliferation experiment was carried out.
Three groups were compared with the control groups: those which had experienced a 12h 0.5
µg/ml LPS application; those which had been treated with 5 µg/ml of rhAPC following the LPS
application; and those to which only rhAPC had been applied.
There was no significant difference between these groups after a 48-hour waiting period following
12 hours of LPS and rhAPC exposure (Figure 20).
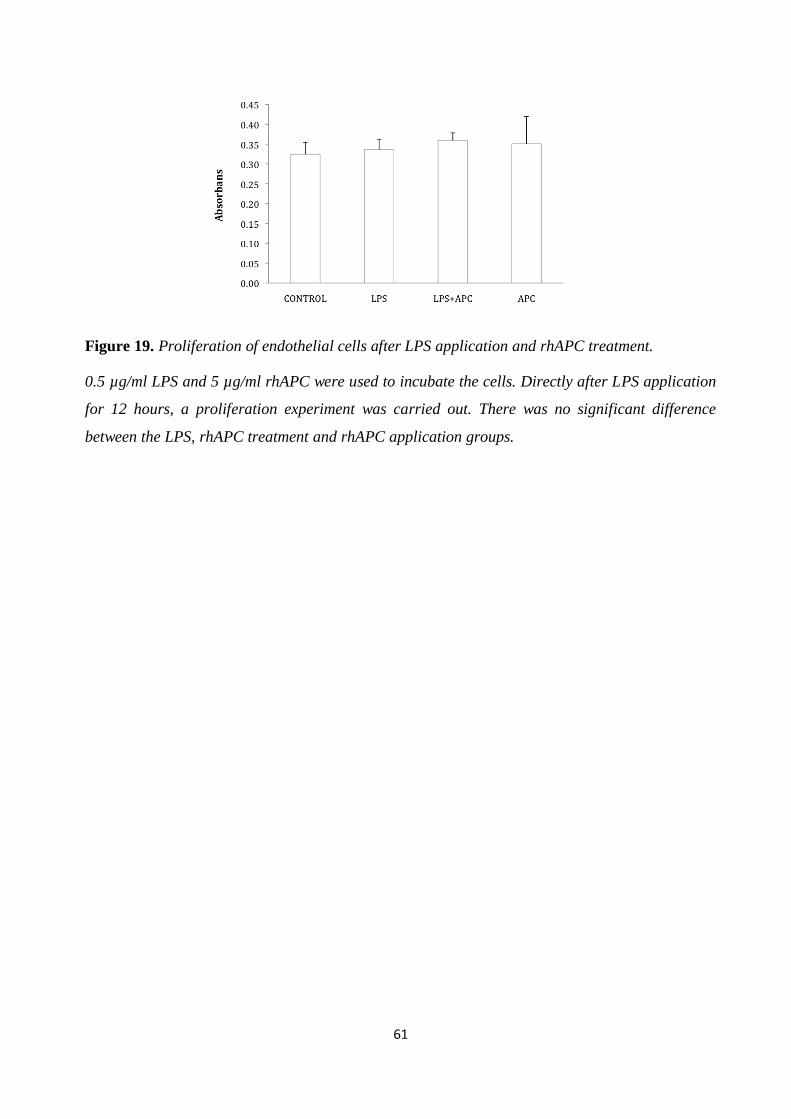
61
Figure 19. Proliferation of endothelial cells after LPS application and rhAPC treatment.
0.5 µg/ml LPS and 5 µg/ml rhAPC were used to incubate the cells. Directly after LPS application
for 12 hours, a proliferation experiment was carried out. There was no significant difference
between the LPS, rhAPC treatment and rhAPC application groups.
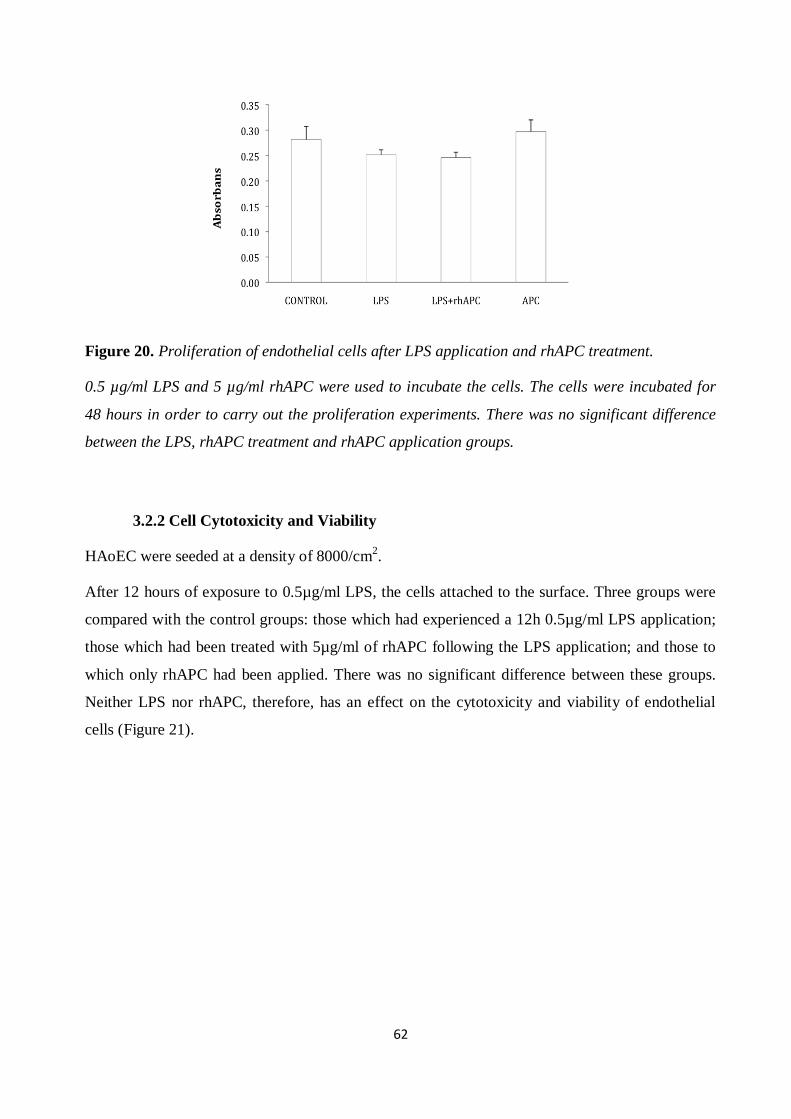
62
Figure 20. Proliferation of endothelial cells after LPS application and rhAPC treatment.
0.5 µg/ml LPS and 5 µg/ml rhAPC were used to incubate the cells. The cells were incubated for
48 hours in order to carry out the proliferation experiments. There was no significant difference
between the LPS, rhAPC treatment and rhAPC application groups.
3.2.2 Cell Cytotoxicity and Viability
HAoEC were seeded at a density of 8000/cm2.
After 12 hours of exposure to 0.5µg/ml LPS, the cells attached to the surface. Three groups were
compared with the control groups: those which had experienced a 12h 0.5µg/ml LPS application;
those which had been treated with 5µg/ml of rhAPC following the LPS application; and those to
which only rhAPC had been applied. There was no significant difference between these groups.
Neither LPS nor rhAPC, therefore, has an effect on the cytotoxicity and viability of endothelial
cells (Figure 21).

63
Figure 21. HAoEC cytotoxicity and viability test after LPS application and rhAPC treatment.
There is no significant difference between the groups.
3.2.3 LPS Induces IL-6 Level, ELISA, HAoEC
Pro-inflammatory cytokines are secreted during sepsis. An IL-6 level increase is a well known
marker of LPS-induced sepsis [18, 55, 74]. In our study, therefore, IL-6 levels were obtained by
ELISA to verify that the HAoEC were affected by LPS.
The cells were incubated with different concentrations of LPS from 0.1 through 0.5 to 1 µg/ml for
3, 6, 12 and 24 hours, and at the initial step (0 hours). The dose response and time course results
showed a dose- and time-dependent increase in IL-6 levels. As little as 0.1 μg/ml of LPS led to a
significant rise in cytokine release for incubation times between 3 and 24 hours. There was no
significant difference between the controls and samples from initial application (0 hours) to 3
hours’ incubation time. A detectable increase in IL-6 concentrations was determined as early as 3
hours after stimulation (Figure 22). These results show the activation of endothelial cells after LPS
application. In light of the IL-6 results, a 12-hour LPS incubation time-period was decided for
further experiments. The dose response experiments indicated that an appropriate LPS
concentration would be 0.5 µg/ml. The suitability of this LPS concentration and incubation time
was also supported by the results of the stress fiber activation and cellular contractile tension tests.
To determine the turning point of the LPS effect, dose response and time course experiments were
carried out.
64
For the dose response experiments, concentrations of LPS at 0.001, 0.005, 0.01 and 0.05 µg/ml
were used. For the time course experiments, exposure times of 0 (initial), 5, 10, and 30 minutes, 1
and 2 hours were tried. However, no increase in IL-6 secretion was detected.
Figure 22. IL-6 level graph after LPS application.
IL-6 ELISA analysis of HAoEC medium after 3, 6, 12 and 24 hours’ stimulation at 37°C with
various concentrations of LPS (*p<0.05).
3.2.4 rhAPC Decreases LPS-induced IL-6 Level in HAoEC
rhAPC is known to have anti-inflammatory properties [90], as it inhibits anti-inflammatory
cytokines. The cells were incubated with 5 µg/ml rhAPC for 3, 6, 12 and 24 hours, and at the
initial step, following 30 minutes of LPS application at concentrations of 0.1, 0.5, 1 and 2 µg/ml.
Our results also indicated that treating endothelial cells with 5 µg/ml rhAPC for 6 hours
significantly decreased the level of IL-6 following 0.1, 0.5 and 1 µg/ml LPS application; and that
the IL-6 level increased with rhAPC treatment for 12 hours after 0.5 and 1 µg/ml LPS incubation,
when compared with control groups. The contractile tension results also supported the reversible
phenomenon Figure 23. The results of rhAPC treatment after LPS exposure times of 0 (initial), 3
and 24 hours are not shown here, as there is no significant difference in IL-6 level from that of the
control groups.
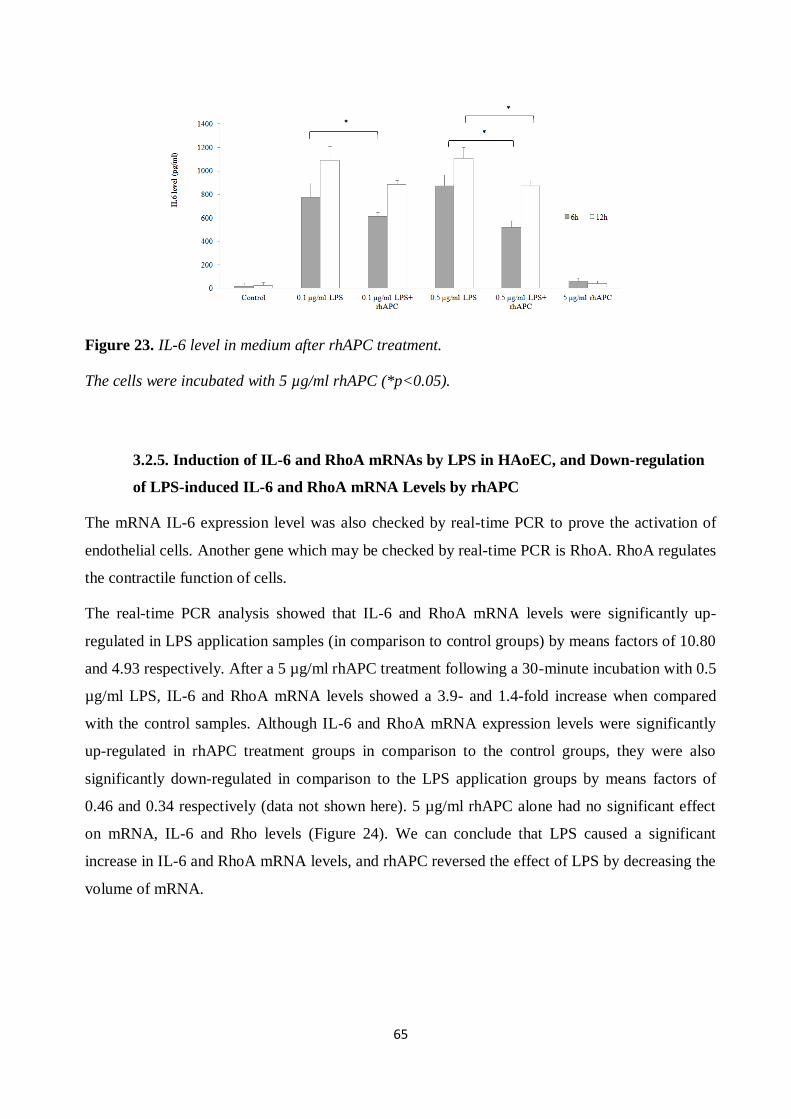
65
Figure 23. IL-6 level in medium after rhAPC treatment.
The cells were incubated with 5 µg/ml rhAPC (*p<0.05).
3.2.5. Induction of IL-6 and RhoA mRNAs by LPS in HAoEC, and Down-regulation
of LPS-induced IL-6 and RhoA mRNA Levels by rhAPC
The mRNA IL-6 expression level was also checked by real-time PCR to prove the activation of
endothelial cells. Another gene which may be checked by real-time PCR is RhoA. RhoA regulates
the contractile function of cells.
The real-time PCR analysis showed that IL-6 and RhoA mRNA levels were significantly up-
regulated in LPS application samples (in comparison to control groups) by means factors of 10.80
and 4.93 respectively. After a 5 µg/ml rhAPC treatment following a 30-minute incubation with 0.5
µg/ml LPS, IL-6 and RhoA mRNA levels showed a 3.9- and 1.4-fold increase when compared
with the control samples. Although IL-6 and RhoA mRNA expression levels were significantly
up-regulated in rhAPC treatment groups in comparison to the control groups, they were also
significantly down-regulated in comparison to the LPS application groups by means factors of
0.46 and 0.34 respectively (data not shown here). 5 µg/ml rhAPC alone had no significant effect
on mRNA, IL-6 and Rho levels (Figure 24). We can conclude that LPS caused a significant
increase in IL-6 and RhoA mRNA levels, and rhAPC reversed the effect of LPS by decreasing the
volume of mRNA.
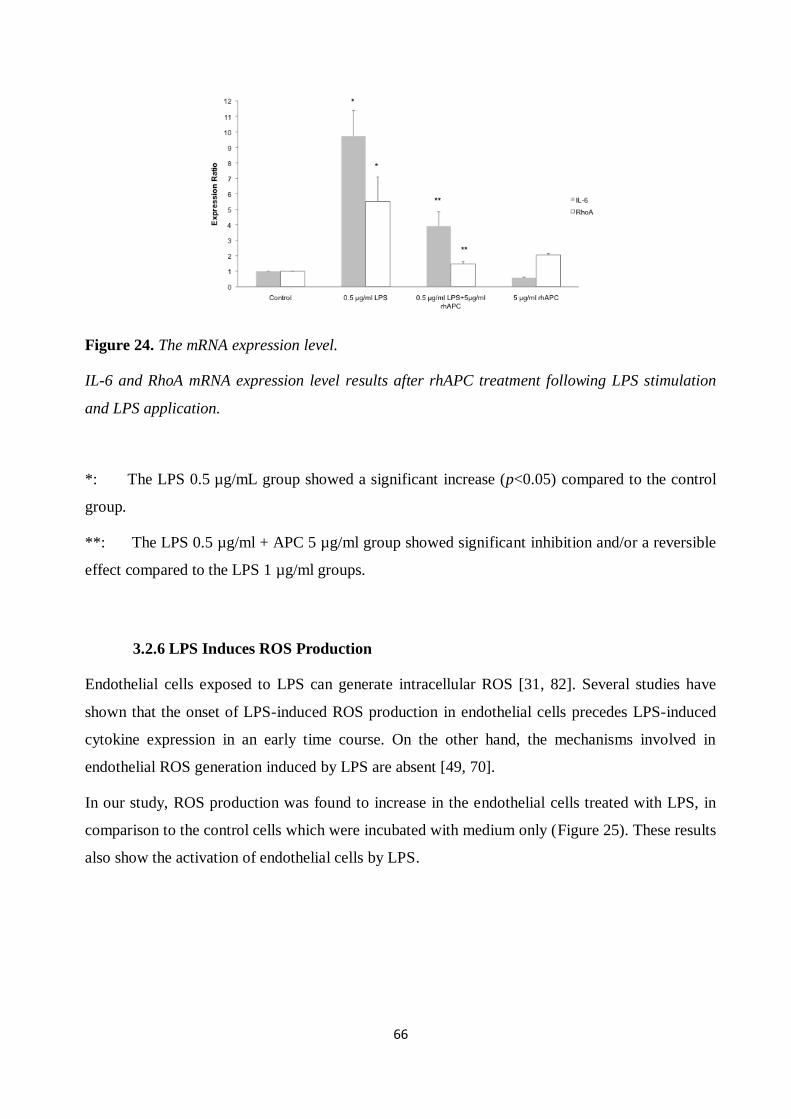
66
Figure 24. The mRNA expression level.
IL-6 and RhoA mRNA expression level results after rhAPC treatment following LPS stimulation
and LPS application.
*: The LPS 0.5 µg/mL group showed a significant increase (p<0.05) compared to the control
group.
**: The LPS 0.5 µg/ml + APC 5 µg/ml group showed significant inhibition and/or a reversible
effect compared to the LPS 1 µg/ml groups.
3.2.6 LPS Induces ROS Production
Endothelial cells exposed to LPS can generate intracellular ROS [31, 82]. Several studies have
shown that the onset of LPS-induced ROS production in endothelial cells precedes LPS-induced
cytokine expression in an early time course. On the other hand, the mechanisms involved in
endothelial ROS generation induced by LPS are absent [49, 70].
In our study, ROS production was found to increase in the endothelial cells treated with LPS, in
comparison to the control cells which were incubated with medium only (Figure 25). These results
also show the activation of endothelial cells by LPS.
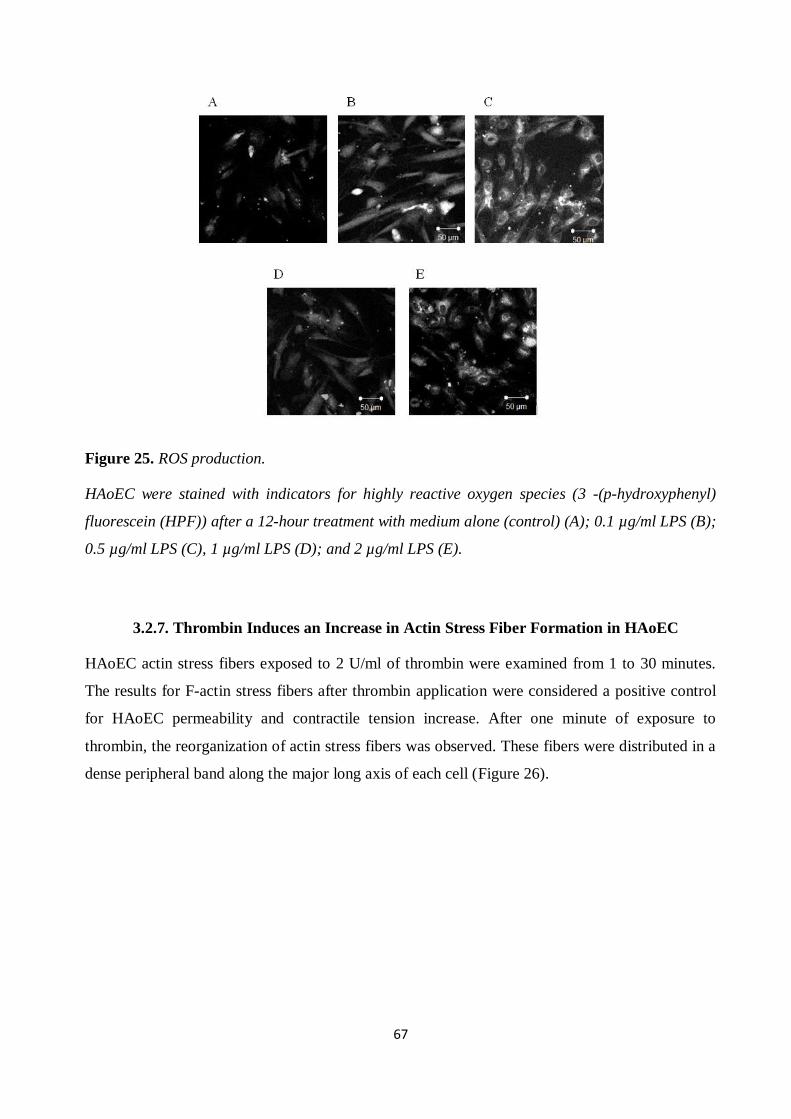
67
Figure 25. ROS production.
HAoEC were stained with indicators for highly reactive oxygen species (3 -(p-hydroxyphenyl)
fluorescein (HPF)) after a 12-hour treatment with medium alone (control) (A); 0.1 µg/ml LPS (B);
0.5 µg/ml LPS (C), 1 µg/ml LPS (D); and 2 µg/ml LPS (E).
3.2.7. Thrombin Induces an Increase in Actin Stress Fiber Formation in HAoEC
HAoEC actin stress fibers exposed to 2 U/ml of thrombin were examined from 1 to 30 minutes.
The results for F-actin stress fibers after thrombin application were considered a positive control
for HAoEC permeability and contractile tension increase. After one minute of exposure to
thrombin, the reorganization of actin stress fibers was observed. These fibers were distributed in a
dense peripheral band along the major long axis of each cell (Figure 26).
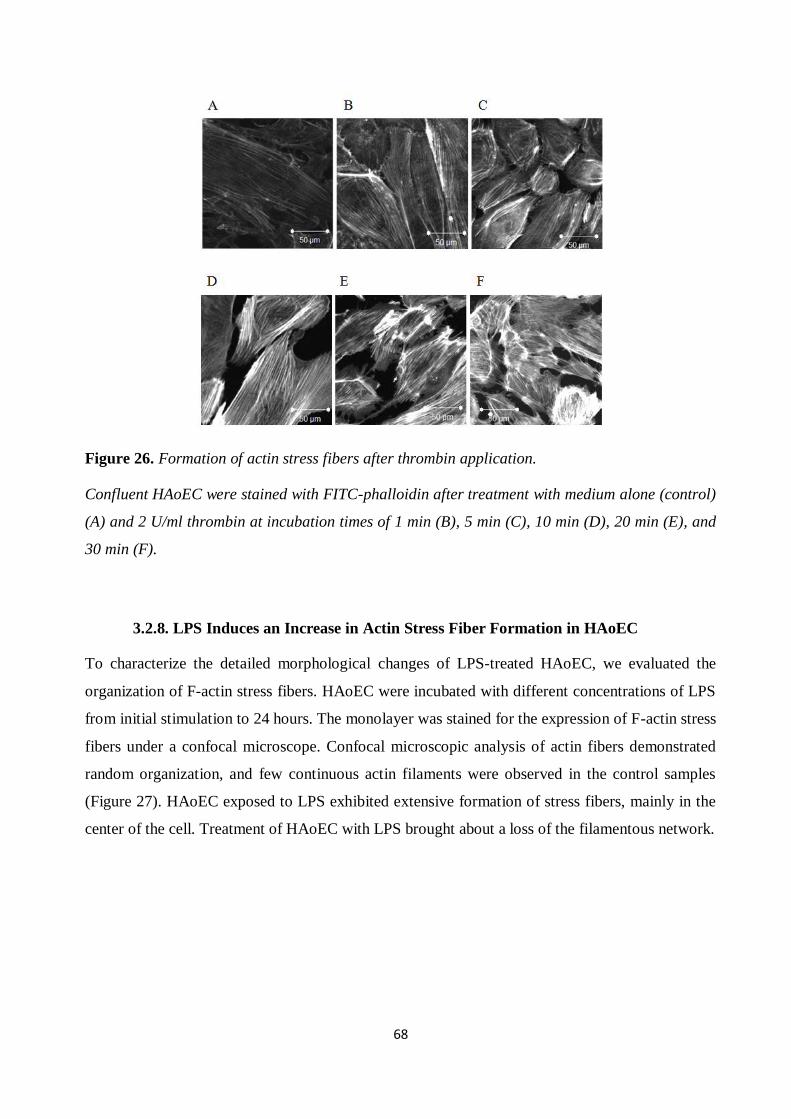
68
Figure 26. Formation of actin stress fibers after thrombin application.
Confluent HAoEC were stained with FITC-phalloidin after treatment with medium alone (control)
(A) and 2 U/ml thrombin at incubation times of 1 min (B), 5 min (C), 10 min (D), 20 min (E), and
30 min (F).
3.2.8. LPS Induces an Increase in Actin Stress Fiber Formation in HAoEC
To characterize the detailed morphological changes of LPS-treated HAoEC, we evaluated the
organization of F-actin stress fibers. HAoEC were incubated with different concentrations of LPS
from initial stimulation to 24 hours. The monolayer was stained for the expression of F-actin stress
fibers under a confocal microscope. Confocal microscopic analysis of actin fibers demonstrated
random organization, and few continuous actin filaments were observed in the control samples
(Figure 27). HAoEC exposed to LPS exhibited extensive formation of stress fibers, mainly in the
center of the cell. Treatment of HAoEC with LPS brought about a loss of the filamentous network.
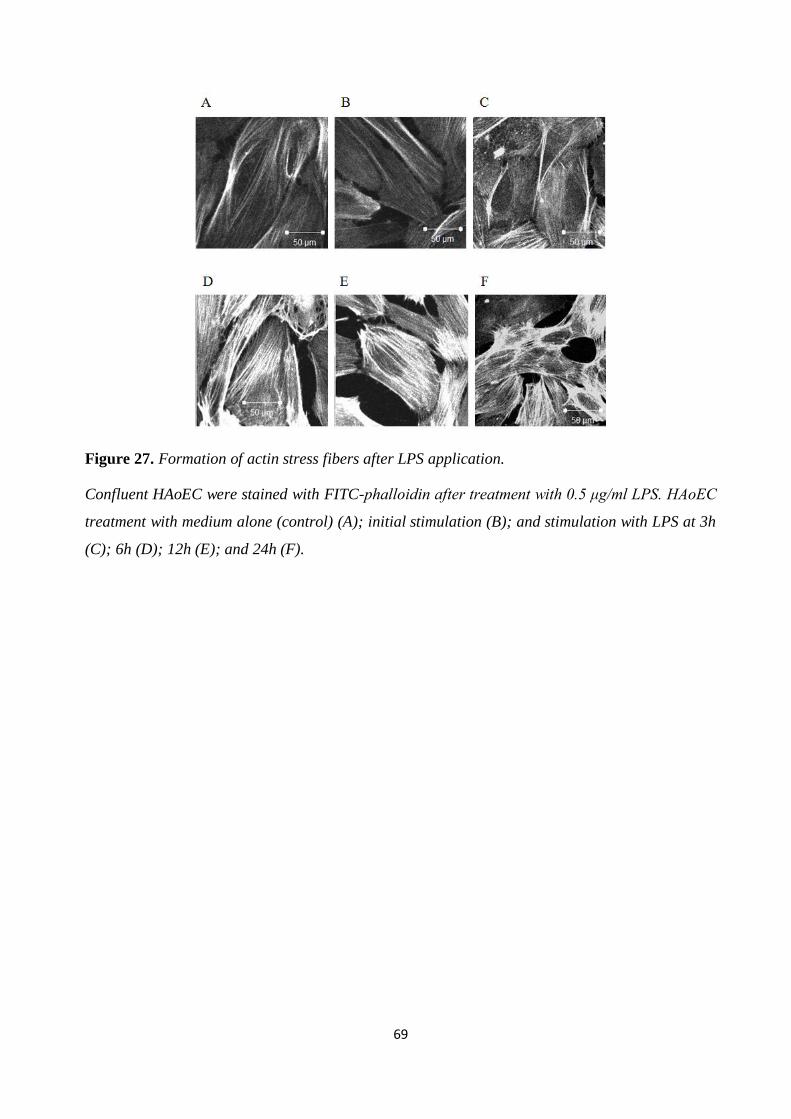
69
Figure 27. Formation of actin stress fibers after LPS application.
Confluent HAoEC were stained with FITC-phalloidin after treatment with 0.5 μg/ml LPS. HAoEC
treatment with medium alone (control) (A); initial stimulation (B); and stimulation with LPS at 3h
(C); 6h (D); 12h (E); and 24h (F).

70
3.2.9 rhAPC Decreases LPS-Induced Actin Stress Fiber Formation in HAoEC
The results of this study show that rhAPC reverses the effect of LPS. After 30 minutes of
0.5µg/ml LPS application, 5 g/ml rhAPC was applied for 12 hours. The results show that there are
fewer actin stress fibers following rhAPC treatment
Figure 28. Actin stress fibers after rhAPC treatment.
Confluent HAoEC were stained with FITC-phalloidin after LPS application and rhAPC treatment.
HAoEC treatment with medium alone (control) (A); LPS (B); rhAPC after LPS application (C);
and rhAPC (D).
3.2.10. Contractile Tension of HAoEC
Our study made use of CellDrum® technology, which permits multiple simultaneous
measurements of contractile tension in cell monolayers. Direct measurements of contractile
tension in the samples were carried out following LPS and/or thrombin application. Thrombin was
used as a positive control, as it is well known to increase contractile tension in endothelial cells
[10, 65], promote the formation of stress fibers and increase endothelial cell barrier permeability
[41].
Different concentrations of LPS and/or thrombin were used, and time course experiments were
carried out. LPS concentrations were chosen based on the optimization studies done in our
laboratory. CellDrum® technology was used to confirm that thrombin increases contractile
tension in HAoEC. Upon exposure to 2 U/ml of thrombin, contractile tension was increased as
early as the tenth minute and achieved maximal levels within 30 minutes. The contractile tension
of endothelial cells incubated with thrombin for 20 and 30 minutes showed significant differences
when compared with the control samples (Figure 18).
LPS caused a similar increase in contractile tension at dosages of 0.5 μg/ml and above. Depending
on exposure and dose response, endothelial cellular contraction increased significantly from 3 to
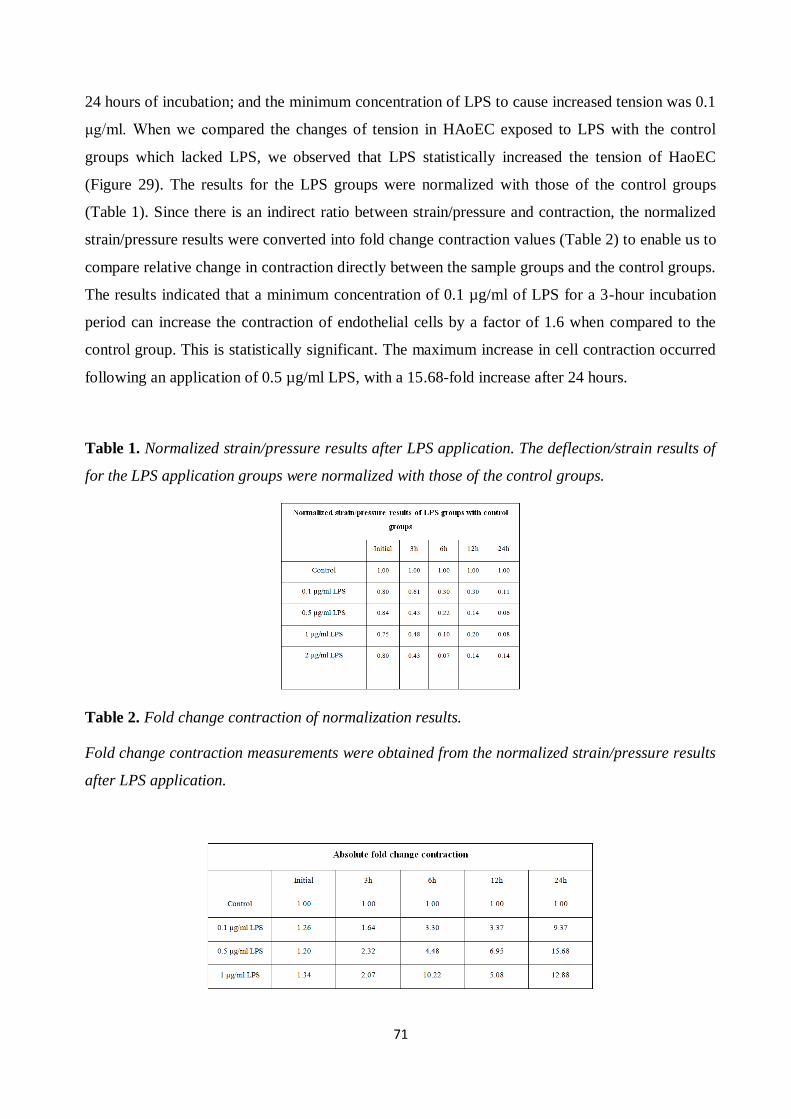
71
24 hours of incubation; and the minimum concentration of LPS to cause increased tension was 0.1
μg/ml. When we compared the changes of tension in HAoEC exposed to LPS with the control
groups which lacked LPS, we observed that LPS statistically increased the tension of HaoEC
(Figure 29). The results for the LPS groups were normalized with those of the control groups
(Table 1). Since there is an indirect ratio between strain/pressure and contraction, the normalized
strain/pressure results were converted into fold change contraction values (Table 2) to enable us to
compare relative change in contraction directly between the sample groups and the control groups.
The results indicated that a minimum concentration of 0.1 µg/ml of LPS for a 3-hour incubation
period can increase the contraction of endothelial cells by a factor of 1.6 when compared to the
control group. This is statistically significant. The maximum increase in cell contraction occurred
following an application of 0.5 µg/ml LPS, with a 15.68-fold increase after 24 hours.
Table 1. Normalized strain/pressure results after LPS application. The deflection/strain results of
for the LPS application groups were normalized with those of the control groups.
Table 2. Fold change contraction of normalization results.
Fold change contraction measurements were obtained from the normalized strain/pressure results
after LPS application.
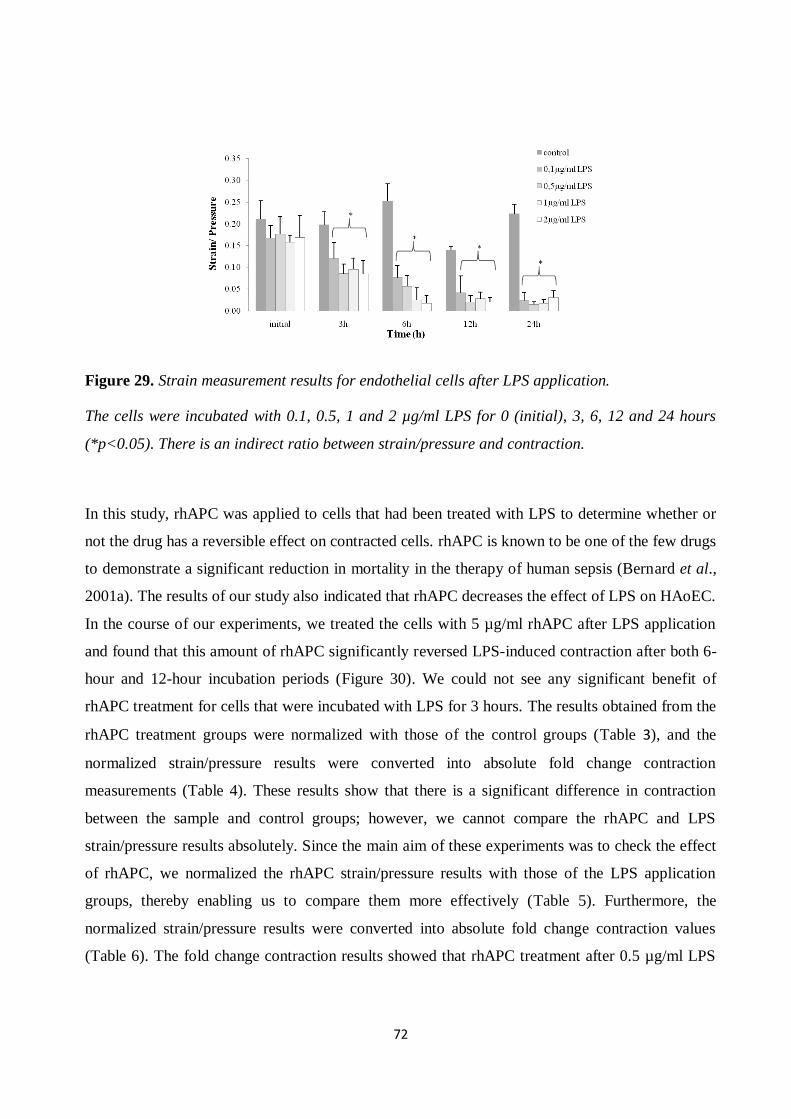
72
Figure 29. Strain measurement results for endothelial cells after LPS application.
The cells were incubated with 0.1, 0.5, 1 and 2 µg/ml LPS for 0 (initial), 3, 6, 12 and 24 hours
(*p<0.05). There is an indirect ratio between strain/pressure and contraction.
In this study, rhAPC was applied to cells that had been treated with LPS to determine whether or
not the drug has a reversible effect on contracted cells. rhAPC is known to be one of the few drugs
to demonstrate a significant reduction in mortality in the therapy of human sepsis (Bernard et al.,
2001a). The results of our study also indicated that rhAPC decreases the effect of LPS on HAoEC.
In the course of our experiments, we treated the cells with 5 µg/ml rhAPC after LPS application
and found that this amount of rhAPC significantly reversed LPS-induced contraction after both 6-
hour and 12-hour incubation periods (Figure 30). We could not see any significant benefit of
rhAPC treatment for cells that were incubated with LPS for 3 hours. The results obtained from the
rhAPC treatment groups were normalized with those of the control groups (Table 3), and the
normalized strain/pressure results were converted into absolute fold change contraction
measurements (Table 4). These results show that there is a significant difference in contraction
between the sample and control groups; however, we cannot compare the rhAPC and LPS
strain/pressure results absolutely. Since the main aim of these experiments was to check the effect
of rhAPC, we normalized the rhAPC strain/pressure results with those of the LPS application
groups, thereby enabling us to compare them more effectively (Table 5). Furthermore, the
normalized strain/pressure results were converted into absolute fold change contraction values
(Table 6). The fold change contraction results showed that rhAPC treatment after 0.5 µg/ml LPS
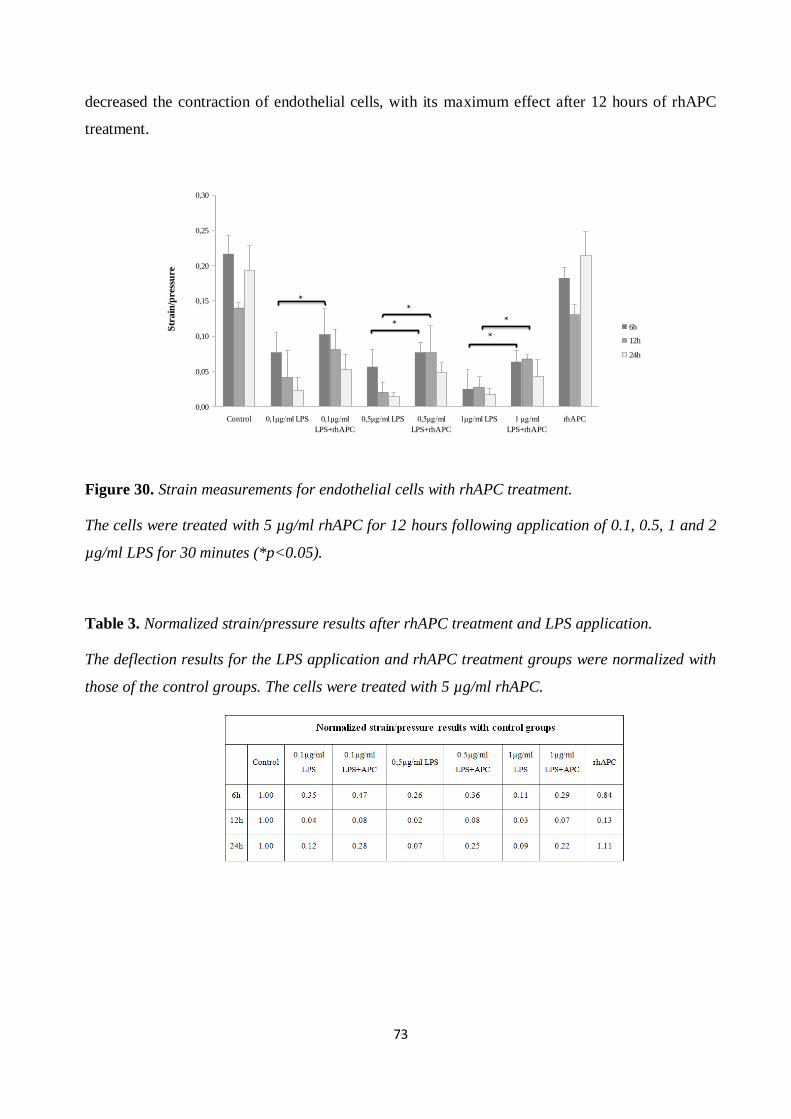
73
decreased the contraction of endothelial cells, with its maximum effect after 12 hours of rhAPC
treatment.
0,00
0,05
0,10
0,15
0,20
0,25
0,30
Control 0,1µg/ml LPS 0,1µg/ml
LPS+rhAPC
0,5µg/ml LPS 0,5µg/ml
LPS+rhAPC
1µg/ml LPS 1 µg/ml
LPS+rhAPC
rhAPC
Str
ain
/pre
ssu
re
6h
12h
24h
*
*
*
*
*
Figure 30. Strain measurements for endothelial cells with rhAPC treatment.
The cells were treated with 5 µg/ml rhAPC for 12 hours following application of 0.1, 0.5, 1 and 2
µg/ml LPS for 30 minutes (*p<0.05).
Table 3. Normalized strain/pressure results after rhAPC treatment and LPS application.
The deflection results for the LPS application and rhAPC treatment groups were normalized with
those of the control groups. The cells were treated with 5 µg/ml rhAPC.
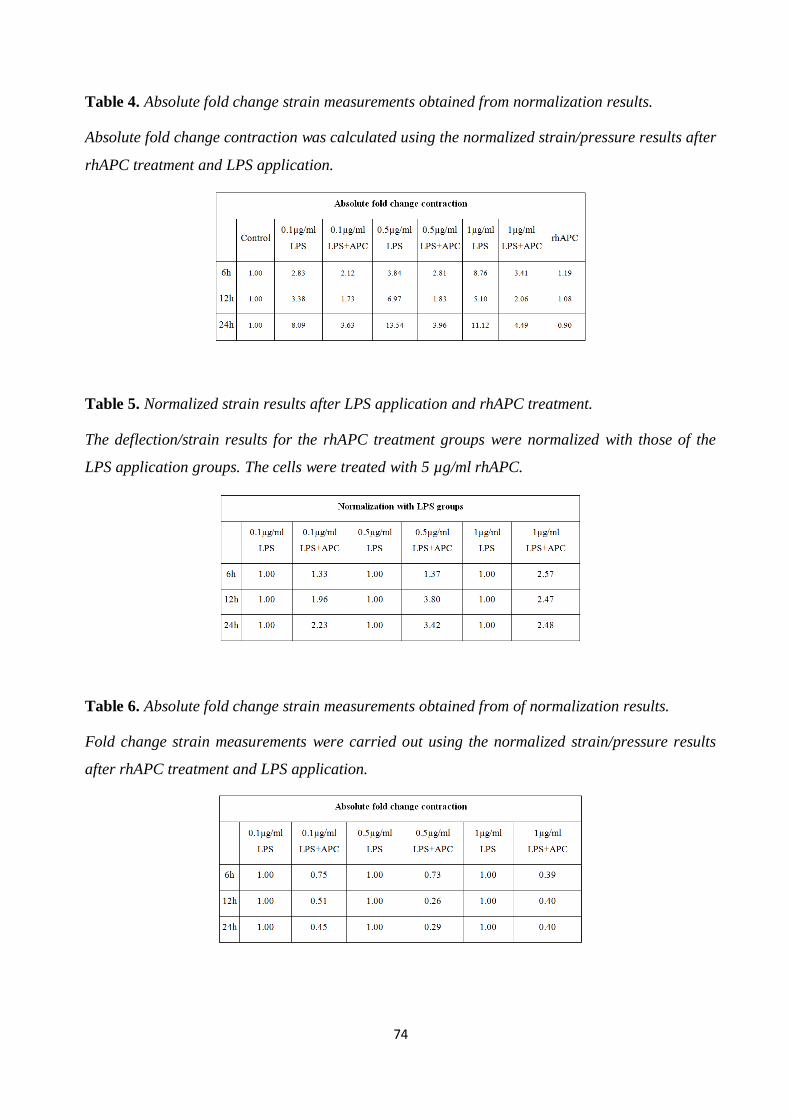
74
Table 4. Absolute fold change strain measurements obtained from normalization results.
Absolute fold change contraction was calculated using the normalized strain/pressure results after
rhAPC treatment and LPS application.
Table 5. Normalized strain results after LPS application and rhAPC treatment.
The deflection/strain results for the rhAPC treatment groups were normalized with those of the
LPS application groups. The cells were treated with 5 µg/ml rhAPC.
Table 6. Absolute fold change strain measurements obtained from of normalization results.
Fold change strain measurements were carried out using the normalized strain/pressure results
after rhAPC treatment and LPS application.
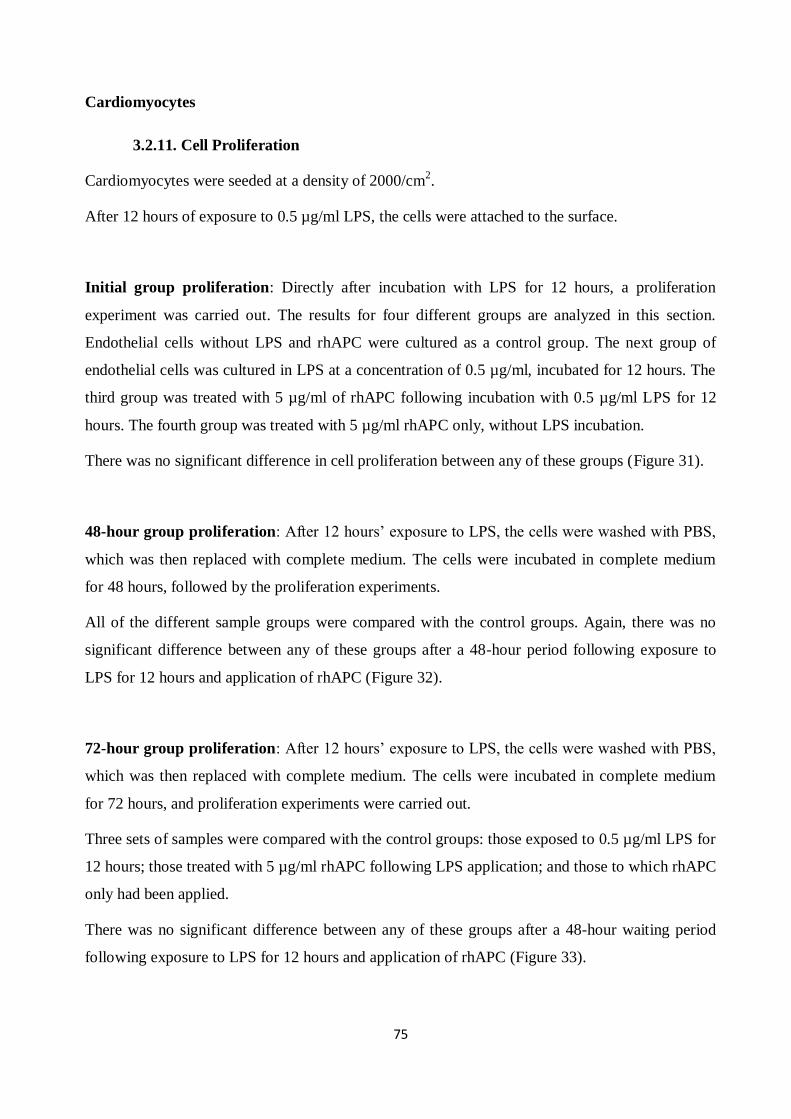
75
Cardiomyocytes
3.2.11. Cell Proliferation
Cardiomyocytes were seeded at a density of 2000/cm2.
After 12 hours of exposure to 0.5 µg/ml LPS, the cells were attached to the surface.
Initial group proliferation: Directly after incubation with LPS for 12 hours, a proliferation
experiment was carried out. The results for four different groups are analyzed in this section.
Endothelial cells without LPS and rhAPC were cultured as a control group. The next group of
endothelial cells was cultured in LPS at a concentration of 0.5 µg/ml, incubated for 12 hours. The
third group was treated with 5 µg/ml of rhAPC following incubation with 0.5 µg/ml LPS for 12
hours. The fourth group was treated with 5 µg/ml rhAPC only, without LPS incubation.
There was no significant difference in cell proliferation between any of these groups (Figure 31).
48-hour group proliferation: After 12 hours’ exposure to LPS, the cells were washed with PBS,
which was then replaced with complete medium. The cells were incubated in complete medium
for 48 hours, followed by the proliferation experiments.
All of the different sample groups were compared with the control groups. Again, there was no
significant difference between any of these groups after a 48-hour period following exposure to
LPS for 12 hours and application of rhAPC (Figure 32).
72-hour group proliferation: After 12 hours’ exposure to LPS, the cells were washed with PBS,
which was then replaced with complete medium. The cells were incubated in complete medium
for 72 hours, and proliferation experiments were carried out.
Three sets of samples were compared with the control groups: those exposed to 0.5 µg/ml LPS for
12 hours; those treated with 5 µg/ml rhAPC following LPS application; and those to which rhAPC
only had been applied.
There was no significant difference between any of these groups after a 48-hour waiting period
following exposure to LPS for 12 hours and application of rhAPC (Figure 33).
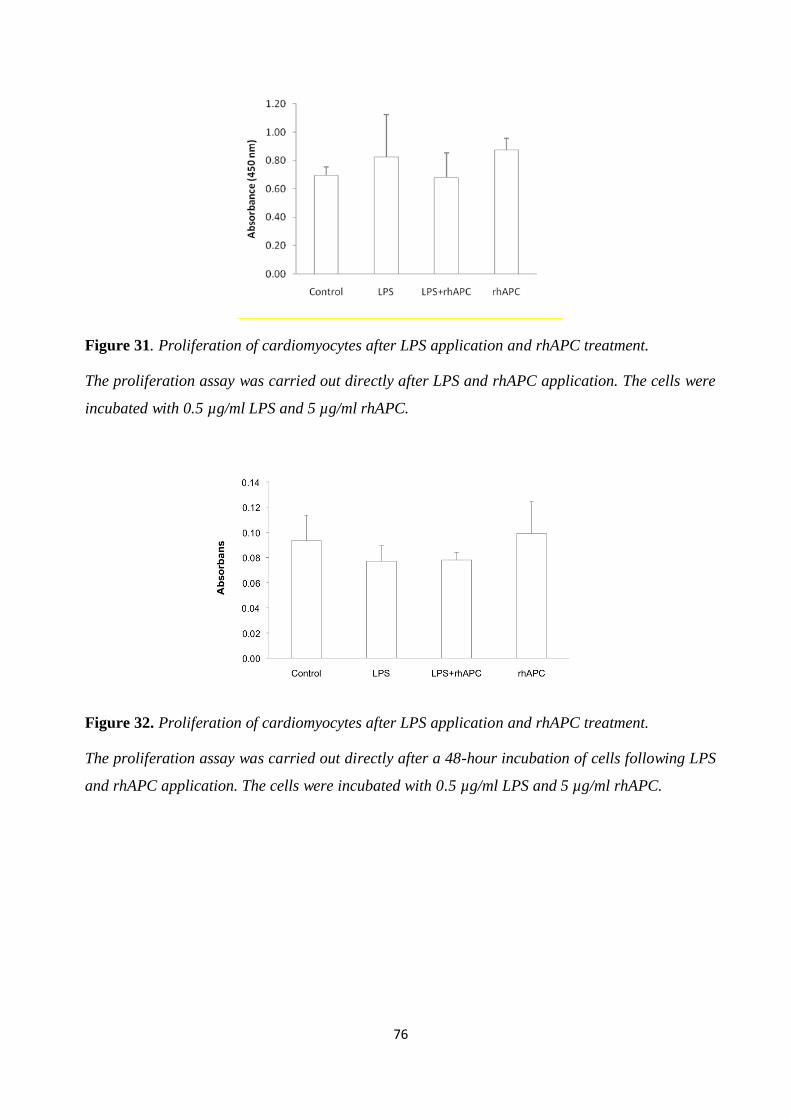
76
Figure 31. Proliferation of cardiomyocytes after LPS application and rhAPC treatment.
The proliferation assay was carried out directly after LPS and rhAPC application. The cells were
incubated with 0.5 µg/ml LPS and 5 µg/ml rhAPC.
Figure 32. Proliferation of cardiomyocytes after LPS application and rhAPC treatment.
The proliferation assay was carried out directly after a 48-hour incubation of cells following LPS
and rhAPC application. The cells were incubated with 0.5 µg/ml LPS and 5 µg/ml rhAPC.
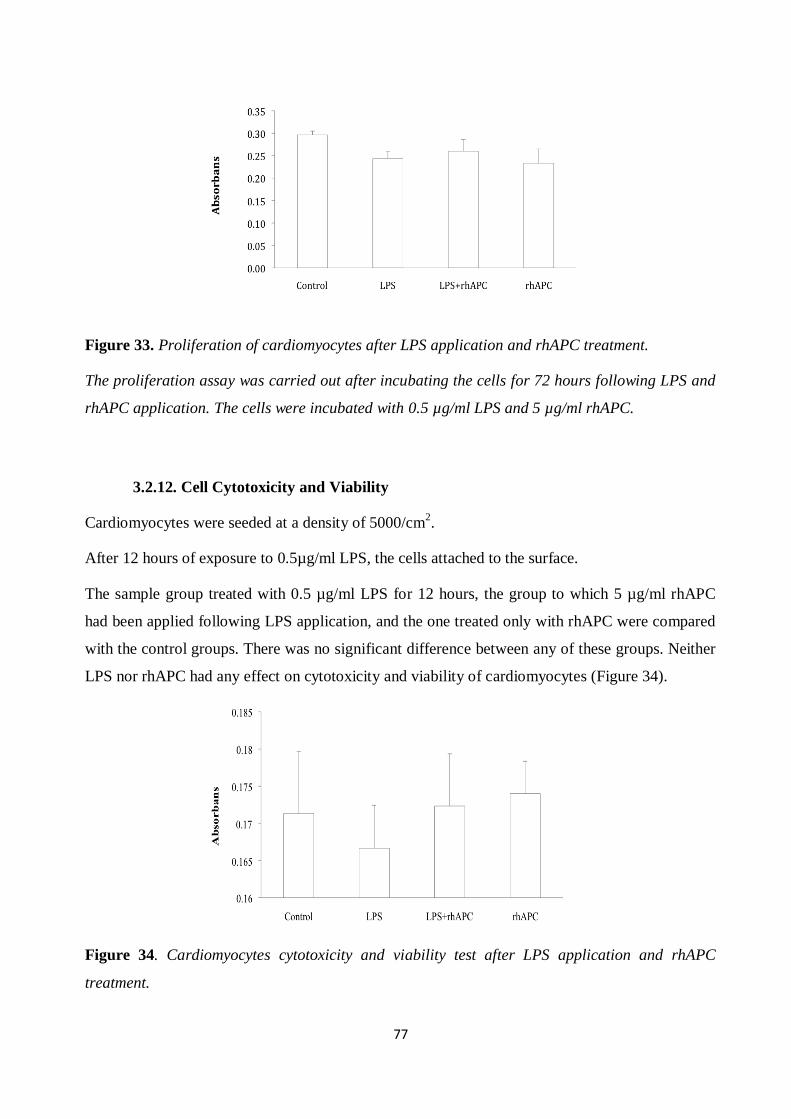
77
Figure 33. Proliferation of cardiomyocytes after LPS application and rhAPC treatment.
The proliferation assay was carried out after incubating the cells for 72 hours following LPS and
rhAPC application. The cells were incubated with 0.5 µg/ml LPS and 5 µg/ml rhAPC.
3.2.12. Cell Cytotoxicity and Viability
Cardiomyocytes were seeded at a density of 5000/cm2.
After 12 hours of exposure to 0.5µg/ml LPS, the cells attached to the surface.
The sample group treated with 0.5 µg/ml LPS for 12 hours, the group to which 5 µg/ml rhAPC
had been applied following LPS application, and the one treated only with rhAPC were compared
with the control groups. There was no significant difference between any of these groups. Neither
LPS nor rhAPC had any effect on cytotoxicity and viability of cardiomyocytes (Figure 34).
Figure 34. Cardiomyocytes cytotoxicity and viability test after LPS application and rhAPC
treatment.
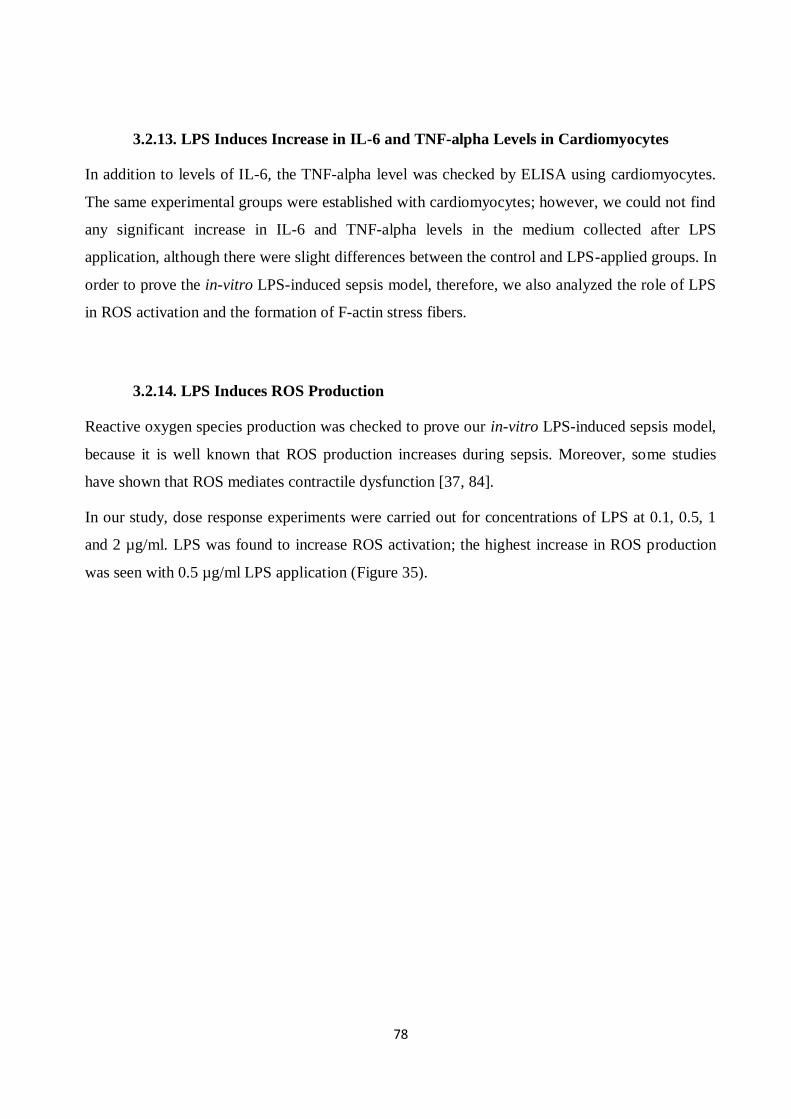
78
3.2.13. LPS Induces Increase in IL-6 and TNF-alpha Levels in Cardiomyocytes
In addition to levels of IL-6, the TNF-alpha level was checked by ELISA using cardiomyocytes.
The same experimental groups were established with cardiomyocytes; however, we could not find
any significant increase in IL-6 and TNF-alpha levels in the medium collected after LPS
application, although there were slight differences between the control and LPS-applied groups. In
order to prove the in-vitro LPS-induced sepsis model, therefore, we also analyzed the role of LPS
in ROS activation and the formation of F-actin stress fibers.
3.2.14. LPS Induces ROS Production
Reactive oxygen species production was checked to prove our in-vitro LPS-induced sepsis model,
because it is well known that ROS production increases during sepsis. Moreover, some studies
have shown that ROS mediates contractile dysfunction [37, 84].
In our study, dose response experiments were carried out for concentrations of LPS at 0.1, 0.5, 1
and 2 µg/ml. LPS was found to increase ROS activation; the highest increase in ROS production
was seen with 0.5 µg/ml LPS application (Figure 35).
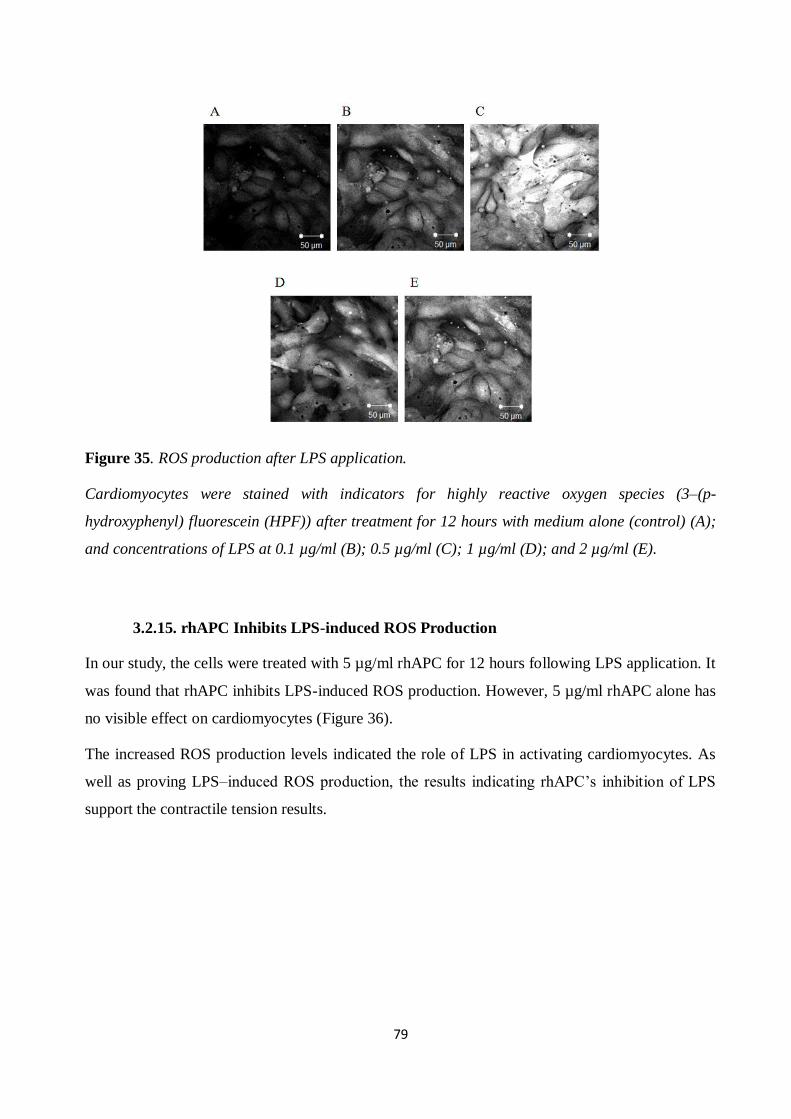
79
Figure 35. ROS production after LPS application.
Cardiomyocytes were stained with indicators for highly reactive oxygen species (3–(p-
hydroxyphenyl) fluorescein (HPF)) after treatment for 12 hours with medium alone (control) (A);
and concentrations of LPS at 0.1 µg/ml (B); 0.5 µg/ml (C); 1 µg/ml (D); and 2 µg/ml (E).
3.2.15. rhAPC Inhibits LPS-induced ROS Production
In our study, the cells were treated with 5 µg/ml rhAPC for 12 hours following LPS application. It
was found that rhAPC inhibits LPS-induced ROS production. However, 5 µg/ml rhAPC alone has
no visible effect on cardiomyocytes (Figure 36).
The increased ROS production levels indicated the role of LPS in activating cardiomyocytes. As
well as proving LPS–induced ROS production, the results indicating rhAPC’s inhibition of LPS
support the contractile tension results.
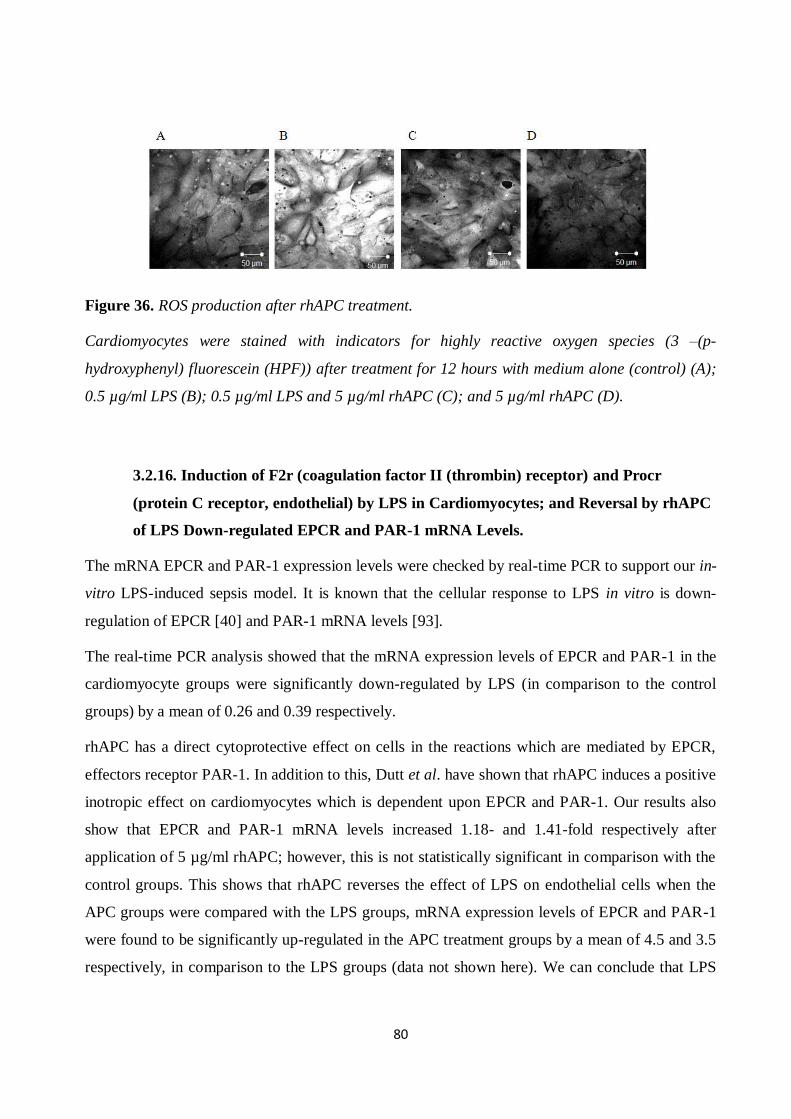
80
Figure 36. ROS production after rhAPC treatment.
Cardiomyocytes were stained with indicators for highly reactive oxygen species (3 –(p-
hydroxyphenyl) fluorescein (HPF)) after treatment for 12 hours with medium alone (control) (A);
0.5 µg/ml LPS (B); 0.5 µg/ml LPS and 5 µg/ml rhAPC (C); and 5 µg/ml rhAPC (D).
3.2.16. Induction of F2r (coagulation factor II (thrombin) receptor) and Procr
(protein C receptor, endothelial) by LPS in Cardiomyocytes; and Reversal by rhAPC
of LPS Down-regulated EPCR and PAR-1 mRNA Levels.
The mRNA EPCR and PAR-1 expression levels were checked by real-time PCR to support our in-
vitro LPS-induced sepsis model. It is known that the cellular response to LPS in vitro is down-
regulation of EPCR [40] and PAR-1 mRNA levels [93].
The real-time PCR analysis showed that the mRNA expression levels of EPCR and PAR-1 in the
cardiomyocyte groups were significantly down-regulated by LPS (in comparison to the control
groups) by a mean of 0.26 and 0.39 respectively.
rhAPC has a direct cytoprotective effect on cells in the reactions which are mediated by EPCR,
effectors receptor PAR-1. In addition to this, Dutt et al. have shown that rhAPC induces a positive
inotropic effect on cardiomyocytes which is dependent upon EPCR and PAR-1. Our results also
show that EPCR and PAR-1 mRNA levels increased 1.18- and 1.41-fold respectively after
application of 5 µg/ml rhAPC; however, this is not statistically significant in comparison with the
control groups. This shows that rhAPC reverses the effect of LPS on endothelial cells when the
APC groups were compared with the LPS groups, mRNA expression levels of EPCR and PAR-1
were found to be significantly up-regulated in the APC treatment groups by a mean of 4.5 and 3.5
respectively, in comparison to the LPS groups (data not shown here). We can conclude that LPS
81
caused a significant decrease in EPCR and PAR-1 mRNA levels, and that rhAPC reversed the
effect of LPS by up-regulating levels of mRNA.
Figure 37. mRNA expression level.
EPCR (Procr) and PAR-1 (F2R) mRNA levels after LPS incubation and rhAPC treatment
following LPS application (*p<0.05).
*: The group treated with 0.5 µg/mL LPS showed a significant increase (p<0.05) compared to
the control group.
**: The group treated with 0.5 µg/mlLPS + 5 µg/ml APC showed significant inhibition and/or
a reversible effect compared to the groups incubated with 1 µg/ml LPS.
3.2.17. LPS Decreases and rhAPC Increases F-actin Stress Fiber Formation in
Cardiomyocytes
To characterize the detailed morphological changes of LPS-treated cardiomyocytes, we evaluated
the organization of F-actin stress fibers. Cardiomyocytes were cultured with 0.5 µg/ml LPS for 12
hours. The monolayer was stained for the expression of F-actin stress fibers under a confocal
microscope. Confocal microscopic analysis of actin fibers revealed a large amount of actin
filaments in untreated cardiomyocytes (Figure 38). Cardiomyocytes exposed to LPS exhibited
fewer actin stress filaments, since LPS causes cardiomyocyte depression. The results obtained
from this analysis of actin stress fibers also support our study’s contractile tension results.
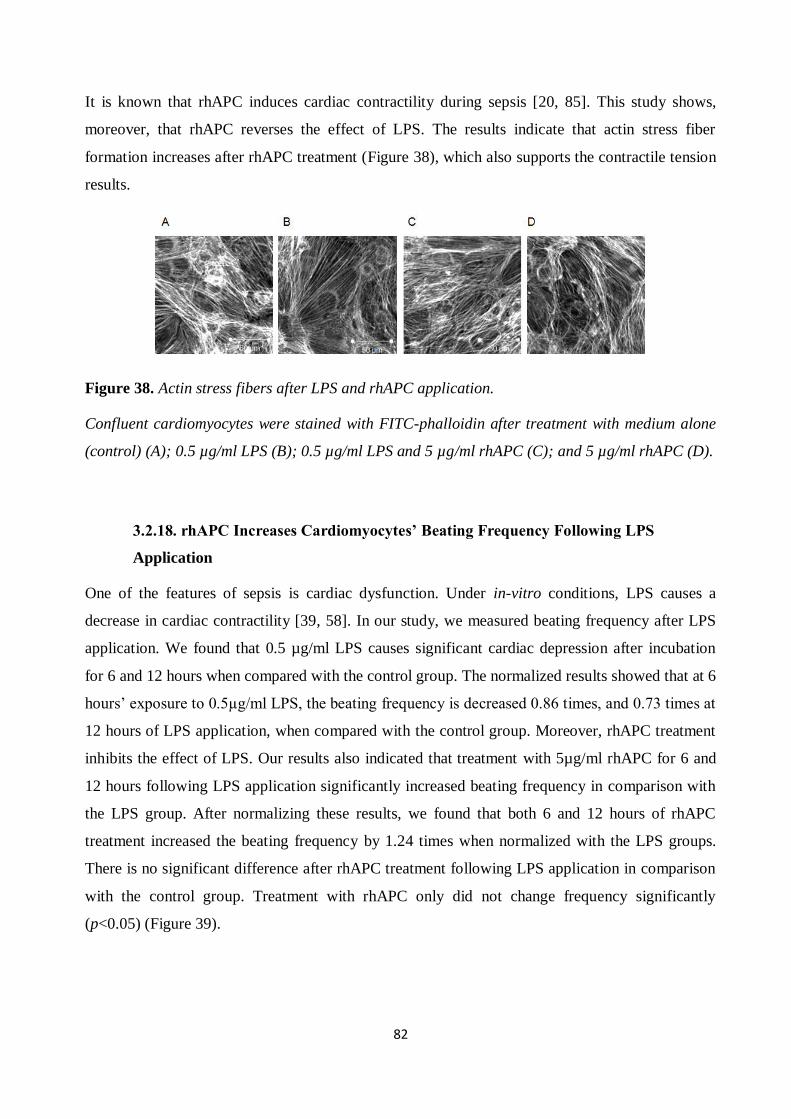
82
It is known that rhAPC induces cardiac contractility during sepsis [20, 85]. This study shows,
moreover, that rhAPC reverses the effect of LPS. The results indicate that actin stress fiber
formation increases after rhAPC treatment (Figure 38), which also supports the contractile tension
results.
Figure 38. Actin stress fibers after LPS and rhAPC application.
Confluent cardiomyocytes were stained with FITC-phalloidin after treatment with medium alone
(control) (A); 0.5 µg/ml LPS (B); 0.5 µg/ml LPS and 5 µg/ml rhAPC (C); and 5 µg/ml rhAPC (D).
3.2.18. rhAPC Increases Cardiomyocytes’ Beating Frequency Following LPS
Application
One of the features of sepsis is cardiac dysfunction. Under in-vitro conditions, LPS causes a
decrease in cardiac contractility [39, 58]. In our study, we measured beating frequency after LPS
application. We found that 0.5 µg/ml LPS causes significant cardiac depression after incubation
for 6 and 12 hours when compared with the control group. The normalized results showed that at 6
hours’ exposure to 0.5µg/ml LPS, the beating frequency is decreased 0.86 times, and 0.73 times at
12 hours of LPS application, when compared with the control group. Moreover, rhAPC treatment
inhibits the effect of LPS. Our results also indicated that treatment with 5µg/ml rhAPC for 6 and
12 hours following LPS application significantly increased beating frequency in comparison with
the LPS group. After normalizing these results, we found that both 6 and 12 hours of rhAPC
treatment increased the beating frequency by 1.24 times when normalized with the LPS groups.
There is no significant difference after rhAPC treatment following LPS application in comparison
with the control group. Treatment with rhAPC only did not change frequency significantly
(p<0.05) (Figure 39).

83
Figure 39. Beating frequency of cardiomyocytes after LPS application and rhAPC treatment.
The cells were incubated with 0.5 µg/ml LPS for 30 minutes then treated with 5 µg/ml rhAPC
(*p<0.05).
3.2.19. Contractile Tension of HAoEC
LPS decreased contractile tension in cardiomyocytes at a dose of 0.5 μg/ml, depending on
exposure time: cellular contraction decreased between 3 and 12 hours of incubation. When we
compared the tension changes of cardiomyocytes exposed to LPS with the control groups in which
LPS is absent, we observed that LPS statistically decreased the contractile tension of
cardiomyocytes. (There is an indirect ratio between strain and contractile tension.).
We also treated the cells with rhAPC to determine whether or not it reverses the effect of LPS.
This was achieved by testing the mechanical properties of cardiomyocytes (Figure 40). The
strain/pressure results were normalized with those of the control groups (Table 11) and the LPS
application groups (Table13), and then converted to fold change contraction values (Tables 12 and
14). The fold change contraction results showed that 3, 6 and 12 hours of LPS application inhibit
cardiac frequency by 5.4, 6.01 and 8.98 times respectively
Our experiments involved treating the cells with rhAPC after LPS application, which showed that
5 µg/ml rhAPC significantly reverses the effect of 0.5 µg/ml LPS after only 12 hours. The
normalized strain/pressure results for treatment with rhAPC indicated that beating frequency
increased 1.46 times in comparison with LPS application groups. Although there was no
significant increase after 3 and 6 hours of treatment with rhAPC alone, 3h and 6h rhAPC
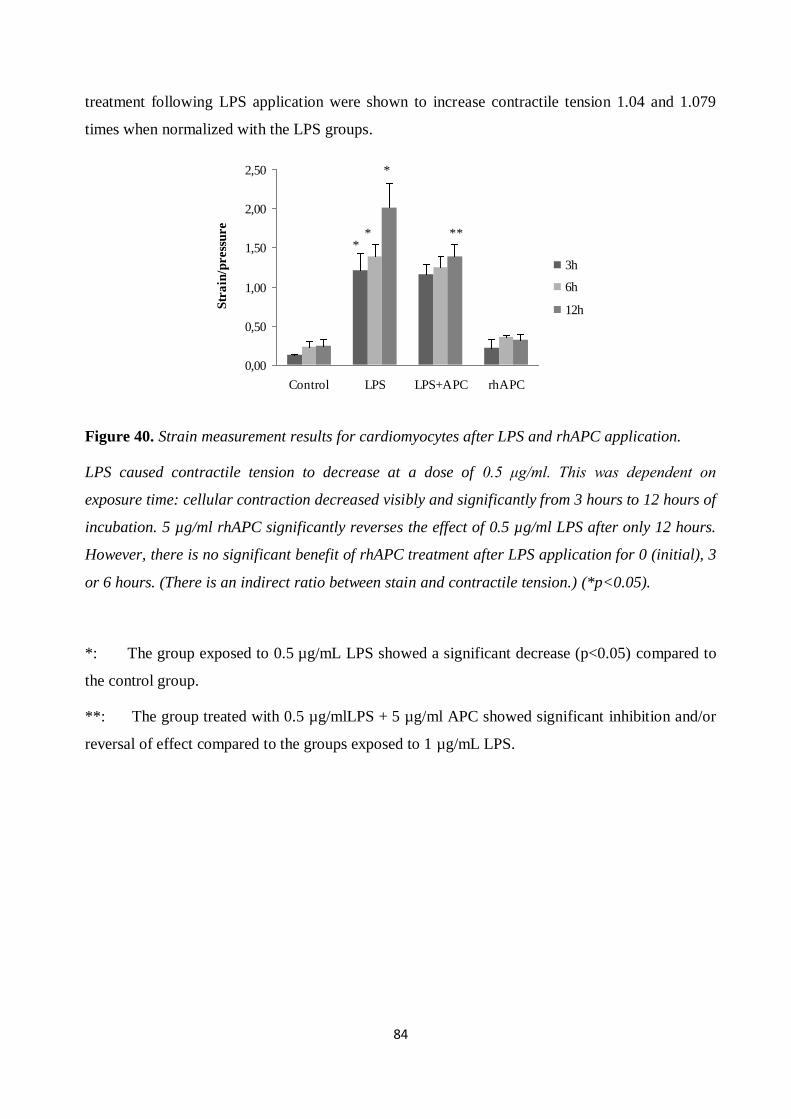
84
treatment following LPS application were shown to increase contractile tension 1.04 and 1.079
times when normalized with the LPS groups.
0,00
0,50
1,00
1,50
2,00
2,50
Control LPS LPS+APC rhAPC
Str
ain
/press
ure
3h
6h
12h
**
*
**
Figure 40. Strain measurement results for cardiomyocytes after LPS and rhAPC application.
LPS caused contractile tension to decrease at a dose of 0.5 μg/ml. This was dependent on
exposure time: cellular contraction decreased visibly and significantly from 3 hours to 12 hours of
incubation. 5 µg/ml rhAPC significantly reverses the effect of 0.5 µg/ml LPS after only 12 hours.
However, there is no significant benefit of rhAPC treatment after LPS application for 0 (initial), 3
or 6 hours. (There is an indirect ratio between stain and contractile tension.) (*p<0.05).
*: The group exposed to 0.5 µg/mL LPS showed a significant decrease (p<0.05) compared to
the control group.
**: The group treated with 0.5 µg/mlLPS + 5 µg/ml APC showed significant inhibition and/or
reversal of effect compared to the groups exposed to 1 µg/mL LPS.
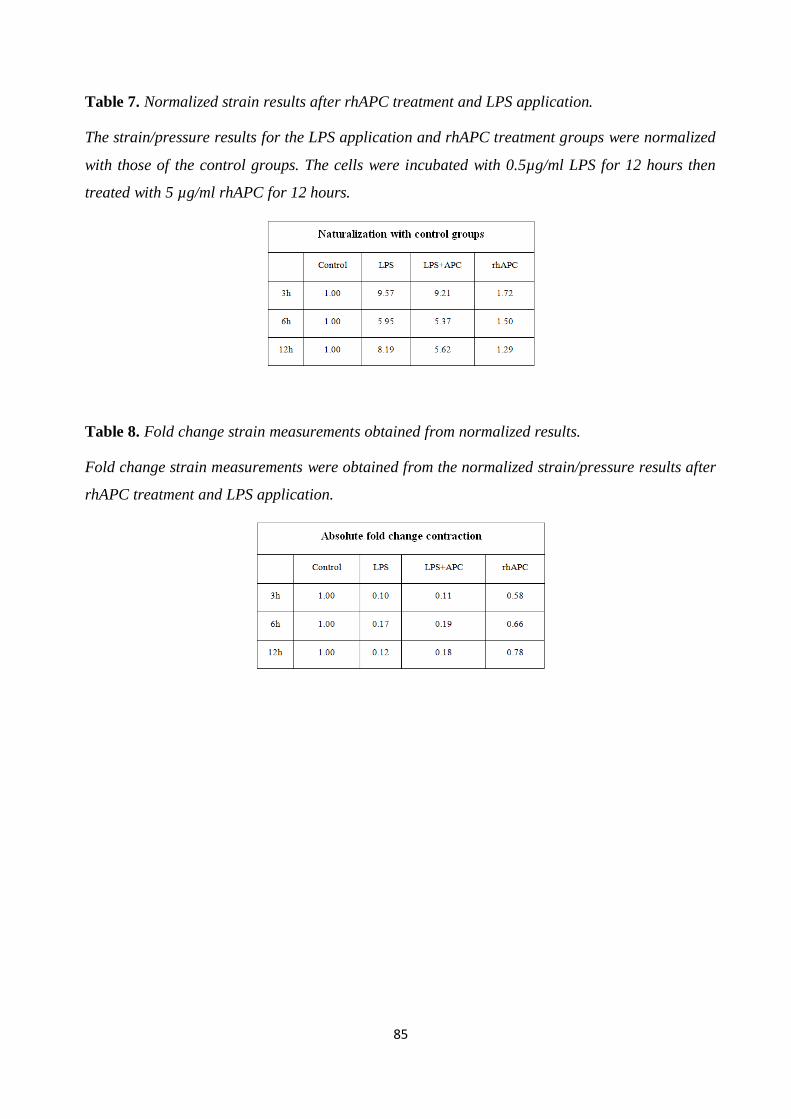
85
Table 7. Normalized strain results after rhAPC treatment and LPS application.
The strain/pressure results for the LPS application and rhAPC treatment groups were normalized
with those of the control groups. The cells were incubated with 0.5µg/ml LPS for 12 hours then
treated with 5 µg/ml rhAPC for 12 hours.
Table 8. Fold change strain measurements obtained from normalized results.
Fold change strain measurements were obtained from the normalized strain/pressure results after
rhAPC treatment and LPS application.
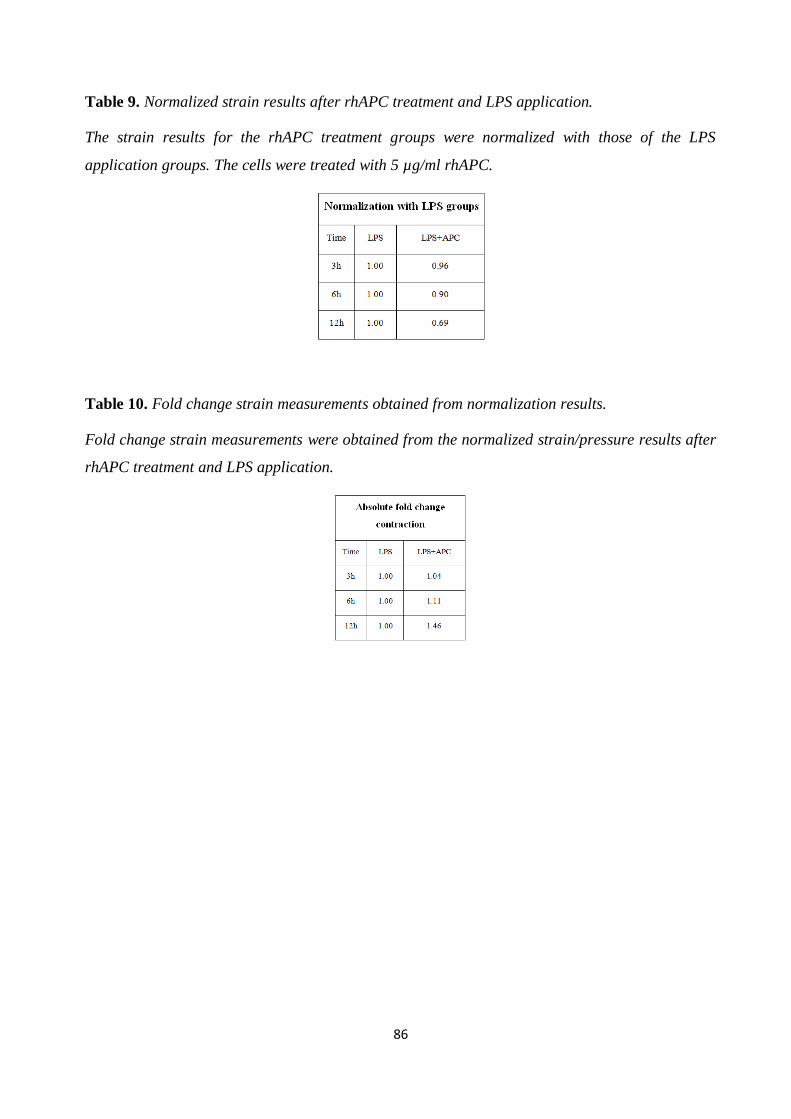
86
Table 9. Normalized strain results after rhAPC treatment and LPS application.
The strain results for the rhAPC treatment groups were normalized with those of the LPS
application groups. The cells were treated with 5 µg/ml rhAPC.
Table 10. Fold change strain measurements obtained from normalization results.
Fold change strain measurements were obtained from the normalized strain/pressure results after
rhAPC treatment and LPS application.
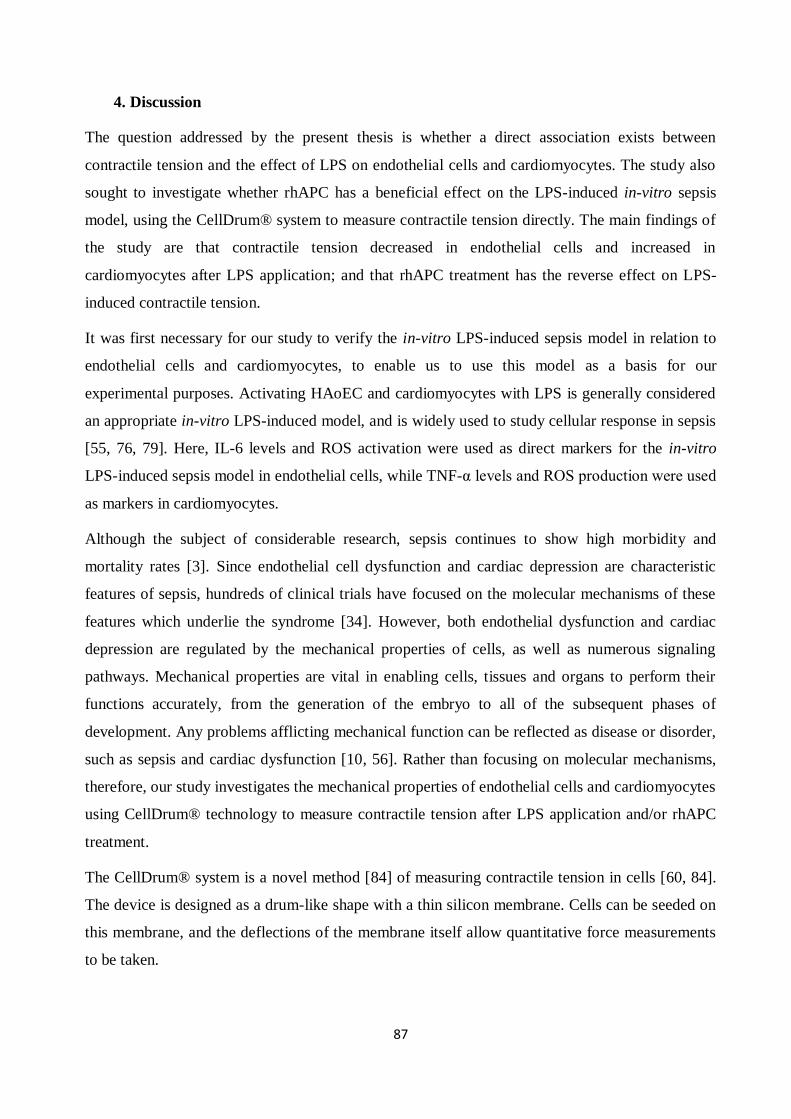
87
4. Discussion
The question addressed by the present thesis is whether a direct association exists between
contractile tension and the effect of LPS on endothelial cells and cardiomyocytes. The study also
sought to investigate whether rhAPC has a beneficial effect on the LPS-induced in-vitro sepsis
model, using the CellDrum® system to measure contractile tension directly. The main findings of
the study are that contractile tension decreased in endothelial cells and increased in
cardiomyocytes after LPS application; and that rhAPC treatment has the reverse effect on LPS-
induced contractile tension.
It was first necessary for our study to verify the in-vitro LPS-induced sepsis model in relation to
endothelial cells and cardiomyocytes, to enable us to use this model as a basis for our
experimental purposes. Activating HAoEC and cardiomyocytes with LPS is generally considered
an appropriate in-vitro LPS-induced model, and is widely used to study cellular response in sepsis
[55, 76, 79]. Here, IL-6 levels and ROS activation were used as direct markers for the in-vitro
LPS-induced sepsis model in endothelial cells, while TNF-α levels and ROS production were used
as markers in cardiomyocytes.
Although the subject of considerable research, sepsis continues to show high morbidity and
mortality rates [3]. Since endothelial cell dysfunction and cardiac depression are characteristic
features of sepsis, hundreds of clinical trials have focused on the molecular mechanisms of these
features which underlie the syndrome [34]. However, both endothelial dysfunction and cardiac
depression are regulated by the mechanical properties of cells, as well as numerous signaling
pathways. Mechanical properties are vital in enabling cells, tissues and organs to perform their
functions accurately, from the generation of the embryo to all of the subsequent phases of
development. Any problems afflicting mechanical function can be reflected as disease or disorder,
such as sepsis and cardiac dysfunction [10, 56]. Rather than focusing on molecular mechanisms,
therefore, our study investigates the mechanical properties of endothelial cells and cardiomyocytes
using CellDrum® technology to measure contractile tension after LPS application and/or rhAPC
treatment.
The CellDrum® system is a novel method [84] of measuring contractile tension in cells [60, 84].
The device is designed as a drum-like shape with a thin silicon membrane. Cells can be seeded on
this membrane, and the deflections of the membrane itself allow quantitative force measurements
to be taken.
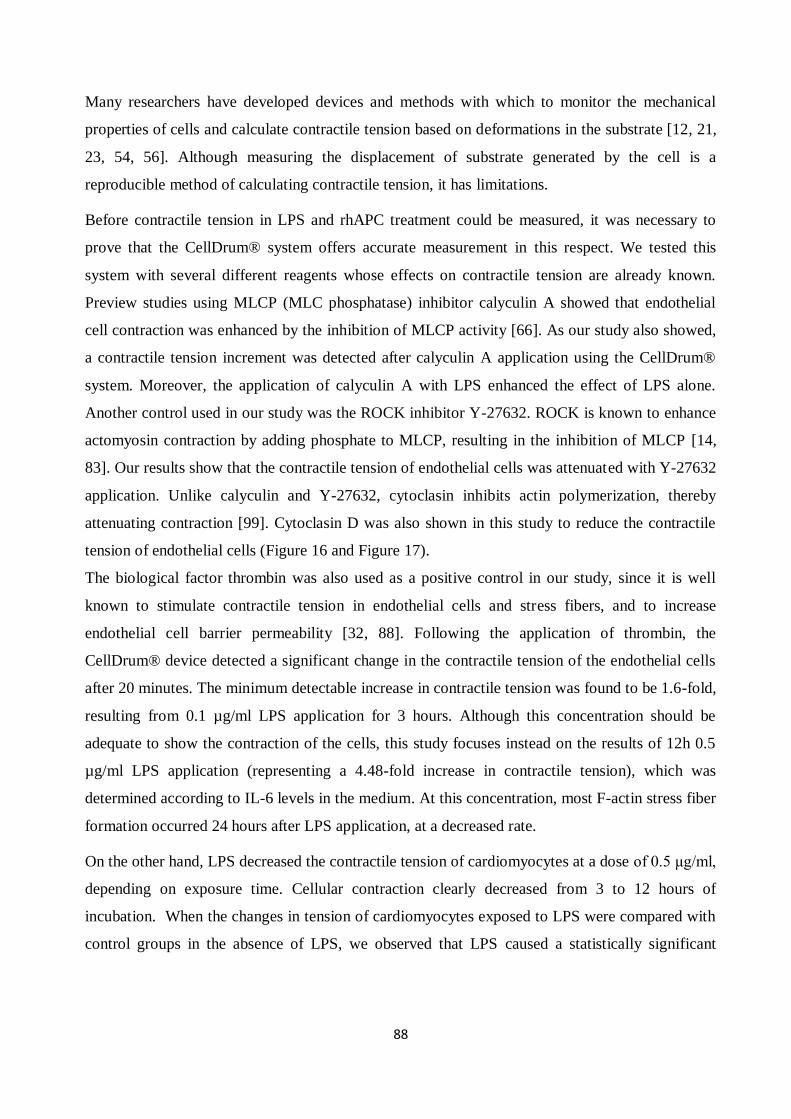
88
Many researchers have developed devices and methods with which to monitor the mechanical
properties of cells and calculate contractile tension based on deformations in the substrate [12, 21,
23, 54, 56]. Although measuring the displacement of substrate generated by the cell is a
reproducible method of calculating contractile tension, it has limitations.
Before contractile tension in LPS and rhAPC treatment could be measured, it was necessary to
prove that the CellDrum® system offers accurate measurement in this respect. We tested this
system with several different reagents whose effects on contractile tension are already known.
Preview studies using MLCP (MLC phosphatase) inhibitor calyculin A showed that endothelial
cell contraction was enhanced by the inhibition of MLCP activity [66]. As our study also showed,
a contractile tension increment was detected after calyculin A application using the CellDrum®
system. Moreover, the application of calyculin A with LPS enhanced the effect of LPS alone.
Another control used in our study was the ROCK inhibitor Y-27632. ROCK is known to enhance
actomyosin contraction by adding phosphate to MLCP, resulting in the inhibition of MLCP [14,
83]. Our results show that the contractile tension of endothelial cells was attenuated with Y-27632
application. Unlike calyculin and Y-27632, cytoclasin inhibits actin polymerization, thereby
attenuating contraction [99]. Cytoclasin D was also shown in this study to reduce the contractile
tension of endothelial cells (Figure 16 and Figure 17).
The biological factor thrombin was also used as a positive control in our study, since it is well
known to stimulate contractile tension in endothelial cells and stress fibers, and to increase
endothelial cell barrier permeability [32, 88]. Following the application of thrombin, the
CellDrum® device detected a significant change in the contractile tension of the endothelial cells
after 20 minutes. The minimum detectable increase in contractile tension was found to be 1.6-fold,
resulting from 0.1 µg/ml LPS application for 3 hours. Although this concentration should be
adequate to show the contraction of the cells, this study focuses instead on the results of 12h 0.5
µg/ml LPS application (representing a 4.48-fold increase in contractile tension), which was
determined according to IL-6 levels in the medium. At this concentration, most F-actin stress fiber
formation occurred 24 hours after LPS application, at a decreased rate.
On the other hand, LPS decreased the contractile tension of cardiomyocytes at a dose of 0.5 μg/ml,
depending on exposure time. Cellular contraction clearly decreased from 3 to 12 hours of
incubation. When the changes in tension of cardiomyocytes exposed to LPS were compared with
control groups in the absence of LPS, we observed that LPS caused a statistically significant
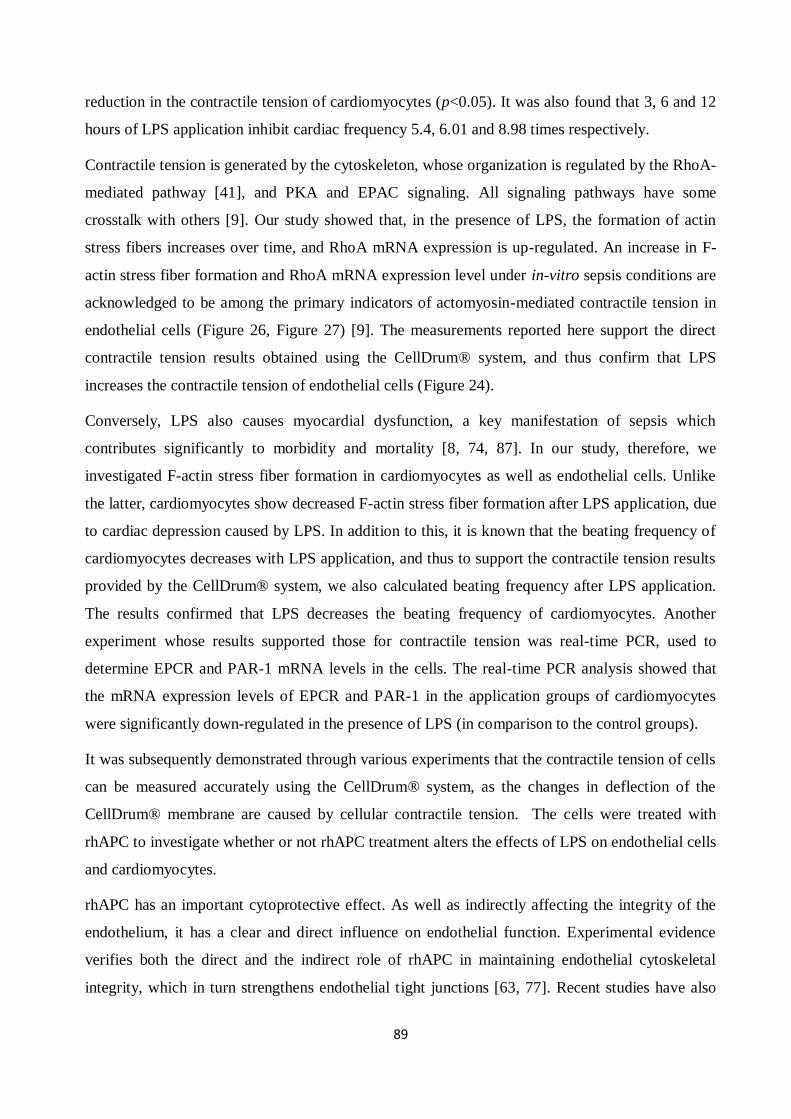
89
reduction in the contractile tension of cardiomyocytes (p<0.05). It was also found that 3, 6 and 12
hours of LPS application inhibit cardiac frequency 5.4, 6.01 and 8.98 times respectively.
Contractile tension is generated by the cytoskeleton, whose organization is regulated by the RhoA-
mediated pathway [41], and PKA and EPAC signaling. All signaling pathways have some
crosstalk with others [9]. Our study showed that, in the presence of LPS, the formation of actin
stress fibers increases over time, and RhoA mRNA expression is up-regulated. An increase in F-
actin stress fiber formation and RhoA mRNA expression level under in-vitro sepsis conditions are
acknowledged to be among the primary indicators of actomyosin-mediated contractile tension in
endothelial cells (Figure 26, Figure 27) [9]. The measurements reported here support the direct
contractile tension results obtained using the CellDrum® system, and thus confirm that LPS
increases the contractile tension of endothelial cells (Figure 24).
Conversely, LPS also causes myocardial dysfunction, a key manifestation of sepsis which
contributes significantly to morbidity and mortality [8, 74, 87]. In our study, therefore, we
investigated F-actin stress fiber formation in cardiomyocytes as well as endothelial cells. Unlike
the latter, cardiomyocytes show decreased F-actin stress fiber formation after LPS application, due
to cardiac depression caused by LPS. In addition to this, it is known that the beating frequency of
cardiomyocytes decreases with LPS application, and thus to support the contractile tension results
provided by the CellDrum® system, we also calculated beating frequency after LPS application.
The results confirmed that LPS decreases the beating frequency of cardiomyocytes. Another
experiment whose results supported those for contractile tension was real-time PCR, used to
determine EPCR and PAR-1 mRNA levels in the cells. The real-time PCR analysis showed that
the mRNA expression levels of EPCR and PAR-1 in the application groups of cardiomyocytes
were significantly down-regulated in the presence of LPS (in comparison to the control groups).
It was subsequently demonstrated through various experiments that the contractile tension of cells
can be measured accurately using the CellDrum® system, as the changes in deflection of the
CellDrum® membrane are caused by cellular contractile tension. The cells were treated with
rhAPC to investigate whether or not rhAPC treatment alters the effects of LPS on endothelial cells
and cardiomyocytes.
rhAPC has an important cytoprotective effect. As well as indirectly affecting the integrity of the
endothelium, it has a clear and direct influence on endothelial function. Experimental evidence
verifies both the direct and the indirect role of rhAPC in maintaining endothelial cytoskeletal
integrity, which in turn strengthens endothelial tight junctions [63, 77]. Recent studies have also
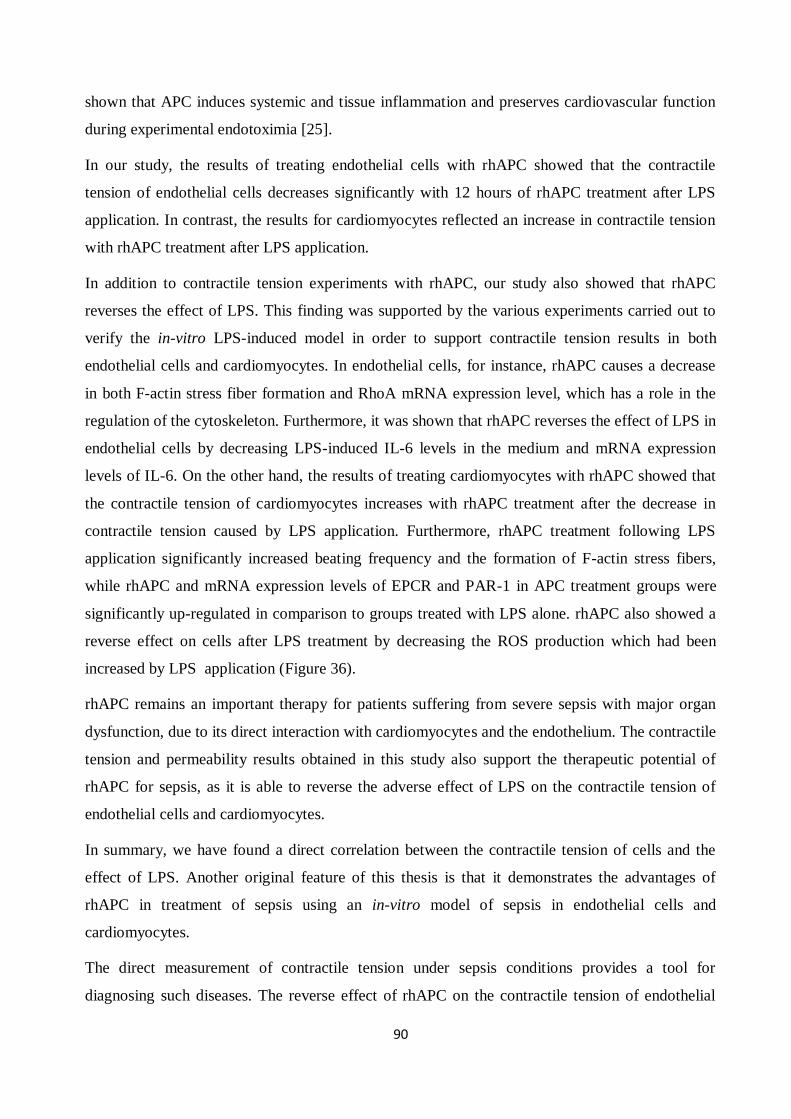
90
shown that APC induces systemic and tissue inflammation and preserves cardiovascular function
during experimental endotoximia [25].
In our study, the results of treating endothelial cells with rhAPC showed that the contractile
tension of endothelial cells decreases significantly with 12 hours of rhAPC treatment after LPS
application. In contrast, the results for cardiomyocytes reflected an increase in contractile tension
with rhAPC treatment after LPS application.
In addition to contractile tension experiments with rhAPC, our study also showed that rhAPC
reverses the effect of LPS. This finding was supported by the various experiments carried out to
verify the in-vitro LPS-induced model in order to support contractile tension results in both
endothelial cells and cardiomyocytes. In endothelial cells, for instance, rhAPC causes a decrease
in both F-actin stress fiber formation and RhoA mRNA expression level, which has a role in the
regulation of the cytoskeleton. Furthermore, it was shown that rhAPC reverses the effect of LPS in
endothelial cells by decreasing LPS-induced IL-6 levels in the medium and mRNA expression
levels of IL-6. On the other hand, the results of treating cardiomyocytes with rhAPC showed that
the contractile tension of cardiomyocytes increases with rhAPC treatment after the decrease in
contractile tension caused by LPS application. Furthermore, rhAPC treatment following LPS
application significantly increased beating frequency and the formation of F-actin stress fibers,
while rhAPC and mRNA expression levels of EPCR and PAR-1 in APC treatment groups were
significantly up-regulated in comparison to groups treated with LPS alone. rhAPC also showed a
reverse effect on cells after LPS treatment by decreasing the ROS production which had been
increased by LPS application (Figure 36).
rhAPC remains an important therapy for patients suffering from severe sepsis with major organ
dysfunction, due to its direct interaction with cardiomyocytes and the endothelium. The contractile
tension and permeability results obtained in this study also support the therapeutic potential of
rhAPC for sepsis, as it is able to reverse the adverse effect of LPS on the contractile tension of
endothelial cells and cardiomyocytes.
In summary, we have found a direct correlation between the contractile tension of cells and the
effect of LPS. Another original feature of this thesis is that it demonstrates the advantages of
rhAPC in treatment of sepsis using an in-vitro model of sepsis in endothelial cells and
cardiomyocytes.
The direct measurement of contractile tension under sepsis conditions provides a tool for
diagnosing such diseases. The reverse effect of rhAPC on the contractile tension of endothelial
91
cells and cardiomyocytes, as amply shown in this study, may have therapeutic value for patients
with sepsis.
The system established here is a suitable basis for a high-throughput system providing
simultaneous data for large numbers of various kinds of tissue constructs. The method employed
in this study also facilitates investigation of the mechanical properties of cells, and may thus be
used to solve biomechanical questions posed by diseases. The CellDrum® device can be operated
easily in sterile conditions, since all of its components are autoclaveable. This method, and its
associated procedures of data acquisition and data processing software, offers the opportunity to
analyze the mechanical properties of tissue constructs in greater depth. In summary, the device
introduced here is a powerful tool to determine tensions in tissue constructs, as well as to explore a
wide variety of other material properties.
92
5. Reference List
1. Abraham L.Kierszenbaum, Histology and Cell Biology, An Introduction to Pathology,
Mosby, 2002.
2. E.Abraham, P.F.Laterre, R.Garg, H.Levy, D.Talwar, B.L.Trzaskoma, B.Francois, J.S.Guy,
M.Bruckmann, A.Rea-Neto, R.Rossaint, D.Perrotin, A.Sablotzki, N.Arkins,
B.G.Utterback, and W.L.Macias, Drotrecogin alfa (activated) for adults with
severe sepsis and a low risk of death, N. Engl. J. Med. 353 (2005) 1332.
3. W.C.Aird, The role of the endothelium in severe sepsis and multiple organ dysfunction
syndrome, Blood 101 (2003) 3765.
4. D.Annane, E.Bellissant, and J.M.Cavaillon, Septic shock, Lancet 365 (2005) 63.
5. M.E.Astiz and E.C.Rackow, Septic shock, Lancet 351 (1998) 1501.
6. R.M.Baron, M.J.Baron, and M.A.Perrella, Pathobiology of sepsis: are we still asking the
same questions?, Am. J. Respir. Cell Mol. Biol. 34 (2006) 129.
7. G.R.Bernard, J.L.Vincent, P.F.Laterre, S.P.LaRosa, J.F.Dhainaut, A.Lopez-Rodriguez,
J.S.Steingrub, G.E.Garber, J.D.Helterbrand, E.W.Ely, and C.J.Fisher, Jr., Efficacy
and safety of recombinant human activated protein C for severe sepsis, N. Engl. J.
Med. 344 (2001) 699.
8. B.W.Binck, M.F.Tsen, M.Islas, D.J.White, R.A.Schultz, M.S.Willis, J.V.Garcia,
J.W.Horton, and J.A.Thomas, Bone marrow-derived cells contribute to contractile
dysfunction in endotoxic shock, Am. J. Physiol Heart Circ. Physiol 288 (2005)
H577-H583.
9. A.A.Birukova, T.Zagranichnaya, E.Alekseeva, G.M.Bokoch, and K.G.Birukov, Epac/Rap
and PKA are novel mechanisms of ANP-induced Rac-mediated pulmonary
endothelial barrier protection, J. Cell Physiol 215 (2008) 715.
10. J.E.Bodmer, E.J.Van, G.Reyes, K.Blackwell, A.Kamath, D.M.Shasby, and A.B.Moy,
Isometric tension of cultured endothelial cells: new technical aspects, Microvasc.
Res. 53 (1997) 261.
11. K.M.Bray and U.Quast, A specific binding site for K+ channel openers in rat aorta, J.
Biol. Chem. 267 (1992) 11689.
12. R.A.Brown, R.Prajapati, D.A.McGrouther, I.V.Yannas, and M.Eastwood, Tensional
homeostasis in dermal fibroblasts: mechanical responses to mechanical loading in
three-dimensional substrates, J. Cell Physiol 175 (1998) 323.

93
13. Bruce Alberts, Alexander Johnson, Julian Lewis, MArtin Raff, Keith Roberts, and Peter
Walter, Molecular Biology of the Cell, Garland Science, United States of America,
10 (2001) 1250.
14. C.K.Chan, J.C.Mak, R.Y.Man, and P.M.Vanhoutte, Rho kinase inhibitors prevent
endothelium-dependent contractions in the rat aorta, J. Pharmacol. Exp. Ther. 329
(2009) 820.
15. T.Cheng, D.Liu, J.H.Griffin, J.A.Fernandez, F.Castellino, E.D.Rosen, K.Fukudome, and
B.V.Zlokovic, Activated protein C blocks p53-mediated apoptosis in ischemic
human brain endothelium and is neuroprotective, Nat. Med. 9 (2003) 338.
16. M.E.Chicurel, C.S.Chen, and D.E.Ingber, Cellular control lies in the balance of forces,
Curr. Opin. Cell Biol. 10 (1998) 232.
17. S.R.Coughlin, Sol Sherry lecture in thrombosis: how thrombin 'talks' to cells: molecular
mechanisms and roles in vivo, Arterioscler. Thromb. Vasc. Biol. 18 (1998) 514.
18. P.Damas, D.Ledoux, M.Nys, Y.Vrindts, G.D.De, P.Franchimont, and M.Lamy, Cytokine
serum level during severe sepsis in human IL-6 as a marker of severity, Ann. Surg.
215 (1992) 356.
19. L.A.Davidson, M.A.Koehl, R.Keller, and G.F.Oster, How do sea urchins invaginate?
Using biomechanics to distinguish between mechanisms of primary invagination,
Development 121 (1995) 2005.
20. D.E.P.-C.M.W.G.H.G.T.C.Dutt1 T., Activated Protein C Regulates Cardiomyocyte
Function Via EPCR and PAR1, Journal of Thrombosis and Haemostasis, 2009.
21. M.Eastwood, D.A.McGrouther, and R.A.Brown, A culture force monitor for measurement
of contraction forces generated in human dermal fibroblast cultures: evidence for
cell-matrix mechanical signalling, Biochim. Biophys. Acta 1201 (1994) 186.
22. C.Engel, F.M.Brunkhorst, H.G.Bone, R.Brunkhorst, H.Gerlach, S.Grond, M.Gruendling,
G.Huhle, U.Jaschinski, S.John, K.Mayer, M.Oppert, D.Olthoff, M.Quintel,
M.Ragaller, R.Rossaint, F.Stuber, N.Weiler, T.Welte, H.Bogatsch, C.Hartog,
M.Loeffler, and K.Reinhart, Epidemiology of sepsis in Germany: results from a
national prospective multicenter study, Intensive Care Med. 33 (2007) 606.
23. T.Eschenhagen, C.Fink, U.Remmers, H.Scholz, J.Wattchow, J.Weil, W.Zimmermann,
H.H.Dohmen, H.Schafer, N.Bishopric, T.Wakatsuki, and E.L.Elson, Three-
dimensional reconstitution of embryonic cardiomyocytes in a collagen matrix: a
new heart muscle model system, FASEB J. 11 (1997) 683.
94
24. C.T.Esmon, The regulation of natural anticoagulant pathways, Science 235 (1987) 1348.
25. R.Favory, S.Lancel, X.Marechal, S.Tissier, and R.Neviere, Cardiovascular protective role
for activated protein C during endotoxemia in rats, Intensive Care Med. 32 (2006)
899.
26. C.Feistritzer and M.Riewald, Endothelial barrier protection by activated protein C through
PAR1-dependent sphingosine 1-phosphate receptor-1 crossactivation, Blood 105
(2005) 3178.
27. C.J.Fernandes, Jr., N.Akamine, and E.Knobel, Myocardial depression in sepsis, Shock 30
Suppl 1 (2008) 14.
28. K.Fijnvandraat, B.Derkx, M.Peters, R.Bijlmer, A.Sturk, M.H.Prins, S.J.van Deventer, and
J.W.ten Cate, Coagulation activation and tissue necrosis in meningococcal septic
shock: severely reduced protein C levels predict a high mortality, Thromb.
Haemost. 73 (1995) 15.
29. J.H.Finigan, S.M.Dudek, P.A.Singleton, E.T.Chiang, J.R.Jacobson, S.M.Camp, S.Q.Ye,
and J.G.Garcia, Activated protein C mediates novel lung endothelial barrier
enhancement: role of sphingosine 1-phosphate receptor transactivation, J. Biol.
Chem. 280 (2005) 17286.
30. M.Flesch, H.Kilter, B.Cremers, U.Laufs, M.Sudkamp, M.Ortmann, F.U.Muller, and
M.Bohm, Effects of endotoxin on human myocardial contractility involvement of
nitric oxide and peroxynitrite, J. Am. Coll. Cardiol. 33 (1999) 1062.
31. A.N.Flynn and A.G.Buret, Proteinase-activated receptor 1 (PAR-1) and cell apoptosis,
Apoptosis. 9 (2004) 729.
32. K.S.Galdal, S.A.Evensen, and E.Nilsen, Thrombin-induced shape changes of cultured
endothelial cells: metabolic and functional observations, Thromb. Res. 32 (1983)
57.
33. J.G.Garcia, F.Liu, A.D.Verin, A.Birukova, M.A.Dechert, W.T.Gerthoffer, J.R.Bamberg,
and D.English, Sphingosine 1-phosphate promotes endothelial cell barrier integrity
by Edg-dependent cytoskeletal rearrangement, J. Clin. Invest 108 (2001) 689.
34. D.M.Gates, Cardiac dysfunction in septic shock and multiple organ dysfunction syndrome,
Crit Care Nurs. Q. 16 (1994) 39.
35. George Richard Kelman, Applied Cardiovascular Physiology, Butterworths, Boston, 1977.
36. A.R.Girbes, A.Beishuizen, and R.J.Strack van Schijndel, Pharmacological treatment of
sepsis, Fundam. Clin. Pharmacol. 22 (2008) 355.
95
37. M.M.Givertz, D.B.Sawyer, and W.S.Colucci, Antioxidants and myocardial contractility:
illuminating the "Dark Side" of beta-adrenergic receptor activation?, Circulation
103 (2001) 782.
38. Z.M.Goeckeler and R.B.Wysolmerski, Myosin light chain kinase-regulated endothelial cell
contraction: the relationship between isometric tension, actin polymerization, and
myosin phosphorylation, J. Cell Biol. 130 (1995) 613.
39. U.Grandel, L.Fink, A.Blum, M.Heep, M.Buerke, H.J.Kraemer, K.Mayer, R.M.Bohle,
W.Seeger, F.Grimminger, and U.Sibelius, Endotoxin-induced myocardial tumor
necrosis factor-alpha synthesis depresses contractility of isolated rat hearts:
evidence for a role of sphingosine and cyclooxygenase-2-derived thromboxane
production, Circulation 102 (2000) 2758.
40. J.M.Gu, Y.Katsuura, G.L.Ferrell, P.Grammas, and C.T.Esmon, Endotoxin and thrombin
elevate rodent endothelial cell protein C receptor mRNA levels and increase
receptor shedding in vivo, Blood 95 (2000) 1687.
41. D.Gunduz, F.Hirche, F.V.Hartel, C.W.Rodewald, M.Schafer, G.Pfitzer, H.M.Piper, and
T.Noll, ATP antagonism of thrombin-induced endothelial barrier permeability,
Cardiovasc. Res. 59 (2003) 470.
42. H.Guo, D.Liu, H.Gelbard, T.Cheng, R.Insalaco, J.A.Fernandez, J.H.Griffin, and
B.V.Zlokovic, Activated protein C prevents neuronal apoptosis via protease
activated receptors 1 and 3, Neuron 41 (2004) 563.
43. S.Harbarth, J.Garbino, J.Pugin, J.A.Romand, D.Lew, and D.Pittet, Inappropriate initial
antimicrobial therapy and its effect on survival in a clinical trial of
immunomodulating therapy for severe sepsis, Am. J. Med. 115 (2003) 529.
44. J.H.Henderson and D.R.Carter, Mechanical induction in limb morphogenesis: the role of
growth-generated strains and pressures, Bone 31 (2002) 645.
45. M.J.Horgan, J.W.Fenton, and A.B.Malik, Alpha-thrombin-induced pulmonary
vasoconstriction, J. Appl. Physiol 63 (1987) 1993.
46. R.S.Hotchkiss and I.E.Karl, The pathophysiology and treatment of sepsis, N. Engl. J. Med.
348 (2003) 138.
47. G.Houston and B.H.Cuthbertson, Activated protein C for the treatment of severe sepsis,
Clin. Microbiol. Infect. 15 (2009) 319.
48. J.D.Hunter and M.Doddi, Sepsis and the heart, Br. J. Anaesth. 104 (2010) 3.
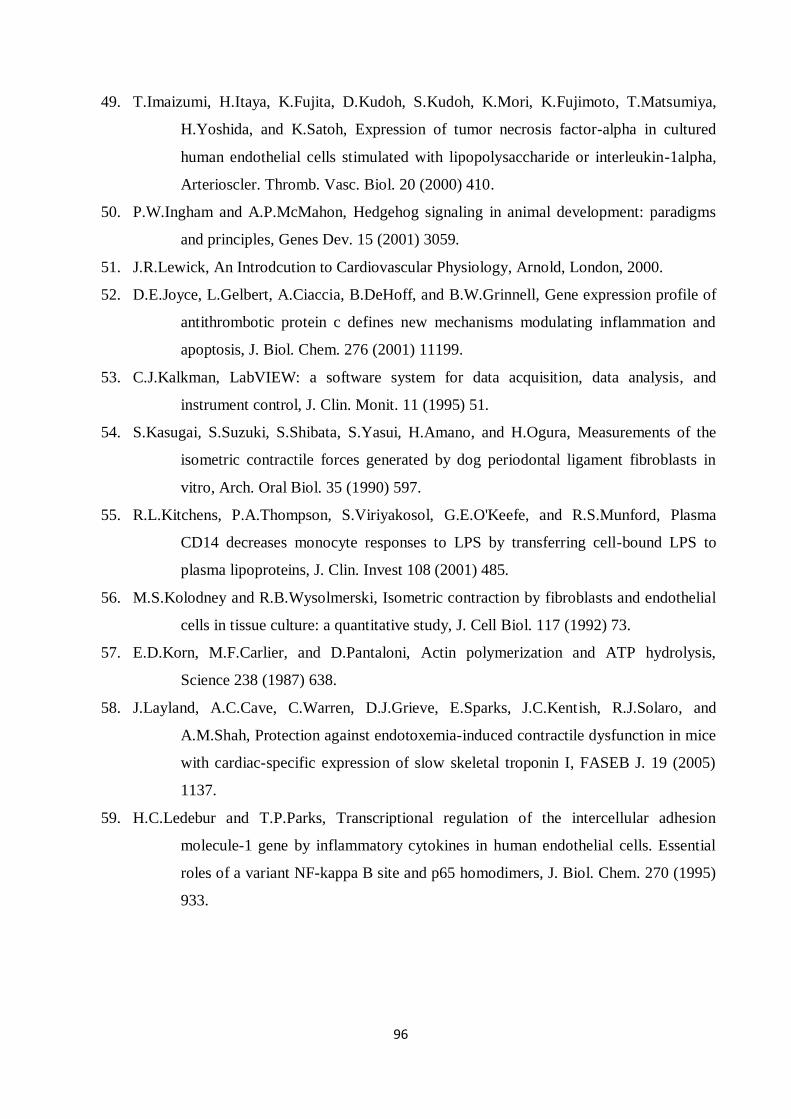
96
49. T.Imaizumi, H.Itaya, K.Fujita, D.Kudoh, S.Kudoh, K.Mori, K.Fujimoto, T.Matsumiya,
H.Yoshida, and K.Satoh, Expression of tumor necrosis factor-alpha in cultured
human endothelial cells stimulated with lipopolysaccharide or interleukin-1alpha,
Arterioscler. Thromb. Vasc. Biol. 20 (2000) 410.
50. P.W.Ingham and A.P.McMahon, Hedgehog signaling in animal development: paradigms
and principles, Genes Dev. 15 (2001) 3059.
51. J.R.Lewick, An Introdcution to Cardiovascular Physiology, Arnold, London, 2000.
52. D.E.Joyce, L.Gelbert, A.Ciaccia, B.DeHoff, and B.W.Grinnell, Gene expression profile of
antithrombotic protein c defines new mechanisms modulating inflammation and
apoptosis, J. Biol. Chem. 276 (2001) 11199.
53. C.J.Kalkman, LabVIEW: a software system for data acquisition, data analysis, and
instrument control, J. Clin. Monit. 11 (1995) 51.
54. S.Kasugai, S.Suzuki, S.Shibata, S.Yasui, H.Amano, and H.Ogura, Measurements of the
isometric contractile forces generated by dog periodontal ligament fibroblasts in
vitro, Arch. Oral Biol. 35 (1990) 597.
55. R.L.Kitchens, P.A.Thompson, S.Viriyakosol, G.E.O'Keefe, and R.S.Munford, Plasma
CD14 decreases monocyte responses to LPS by transferring cell-bound LPS to
plasma lipoproteins, J. Clin. Invest 108 (2001) 485.
56. M.S.Kolodney and R.B.Wysolmerski, Isometric contraction by fibroblasts and endothelial
cells in tissue culture: a quantitative study, J. Cell Biol. 117 (1992) 73.
57. E.D.Korn, M.F.Carlier, and D.Pantaloni, Actin polymerization and ATP hydrolysis,
Science 238 (1987) 638.
58. J.Layland, A.C.Cave, C.Warren, D.J.Grieve, E.Sparks, J.C.Kentish, R.J.Solaro, and
A.M.Shah, Protection against endotoxemia-induced contractile dysfunction in mice
with cardiac-specific expression of slow skeletal troponin I, FASEB J. 19 (2005)
1137.
59. H.C.Ledebur and T.P.Parks, Transcriptional regulation of the intercellular adhesion
molecule-1 gene by inflammatory cytokines in human endothelial cells. Essential
roles of a variant NF-kappa B site and p65 homodimers, J. Biol. Chem. 270 (1995)
933.
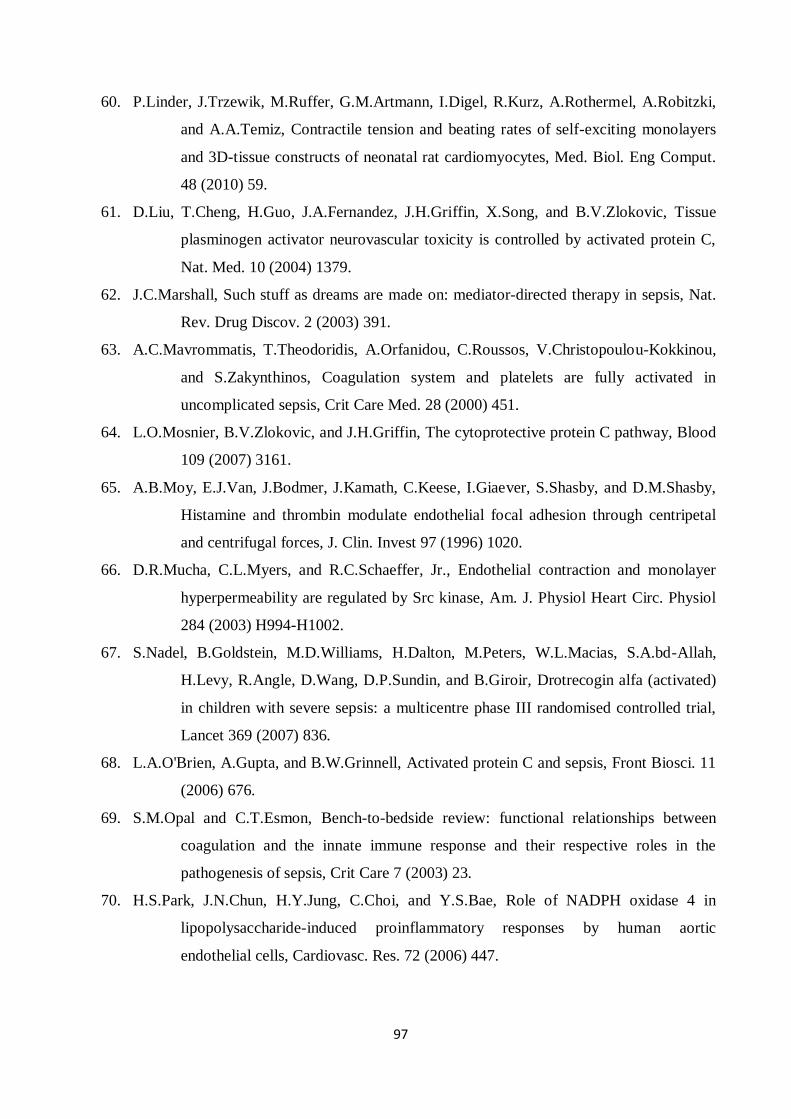
97
60. P.Linder, J.Trzewik, M.Ruffer, G.M.Artmann, I.Digel, R.Kurz, A.Rothermel, A.Robitzki,
and A.A.Temiz, Contractile tension and beating rates of self-exciting monolayers
and 3D-tissue constructs of neonatal rat cardiomyocytes, Med. Biol. Eng Comput.
48 (2010) 59.
61. D.Liu, T.Cheng, H.Guo, J.A.Fernandez, J.H.Griffin, X.Song, and B.V.Zlokovic, Tissue
plasminogen activator neurovascular toxicity is controlled by activated protein C,
Nat. Med. 10 (2004) 1379.
62. J.C.Marshall, Such stuff as dreams are made on: mediator-directed therapy in sepsis, Nat.
Rev. Drug Discov. 2 (2003) 391.
63. A.C.Mavrommatis, T.Theodoridis, A.Orfanidou, C.Roussos, V.Christopoulou-Kokkinou,
and S.Zakynthinos, Coagulation system and platelets are fully activated in
uncomplicated sepsis, Crit Care Med. 28 (2000) 451.
64. L.O.Mosnier, B.V.Zlokovic, and J.H.Griffin, The cytoprotective protein C pathway, Blood
109 (2007) 3161.
65. A.B.Moy, E.J.Van, J.Bodmer, J.Kamath, C.Keese, I.Giaever, S.Shasby, and D.M.Shasby,
Histamine and thrombin modulate endothelial focal adhesion through centripetal
and centrifugal forces, J. Clin. Invest 97 (1996) 1020.
66. D.R.Mucha, C.L.Myers, and R.C.Schaeffer, Jr., Endothelial contraction and monolayer
hyperpermeability are regulated by Src kinase, Am. J. Physiol Heart Circ. Physiol
284 (2003) H994-H1002.
67. S.Nadel, B.Goldstein, M.D.Williams, H.Dalton, M.Peters, W.L.Macias, S.A.bd-Allah,
H.Levy, R.Angle, D.Wang, D.P.Sundin, and B.Giroir, Drotrecogin alfa (activated)
in children with severe sepsis: a multicentre phase III randomised controlled trial,
Lancet 369 (2007) 836.
68. L.A.O'Brien, A.Gupta, and B.W.Grinnell, Activated protein C and sepsis, Front Biosci. 11
(2006) 676.
69. S.M.Opal and C.T.Esmon, Bench-to-bedside review: functional relationships between
coagulation and the innate immune response and their respective roles in the
pathogenesis of sepsis, Crit Care 7 (2003) 23.
70. H.S.Park, J.N.Chun, H.Y.Jung, C.Choi, and Y.S.Bae, Role of NADPH oxidase 4 in
lipopolysaccharide-induced proinflammatory responses by human aortic
endothelial cells, Cardiovasc. Res. 72 (2006) 447.
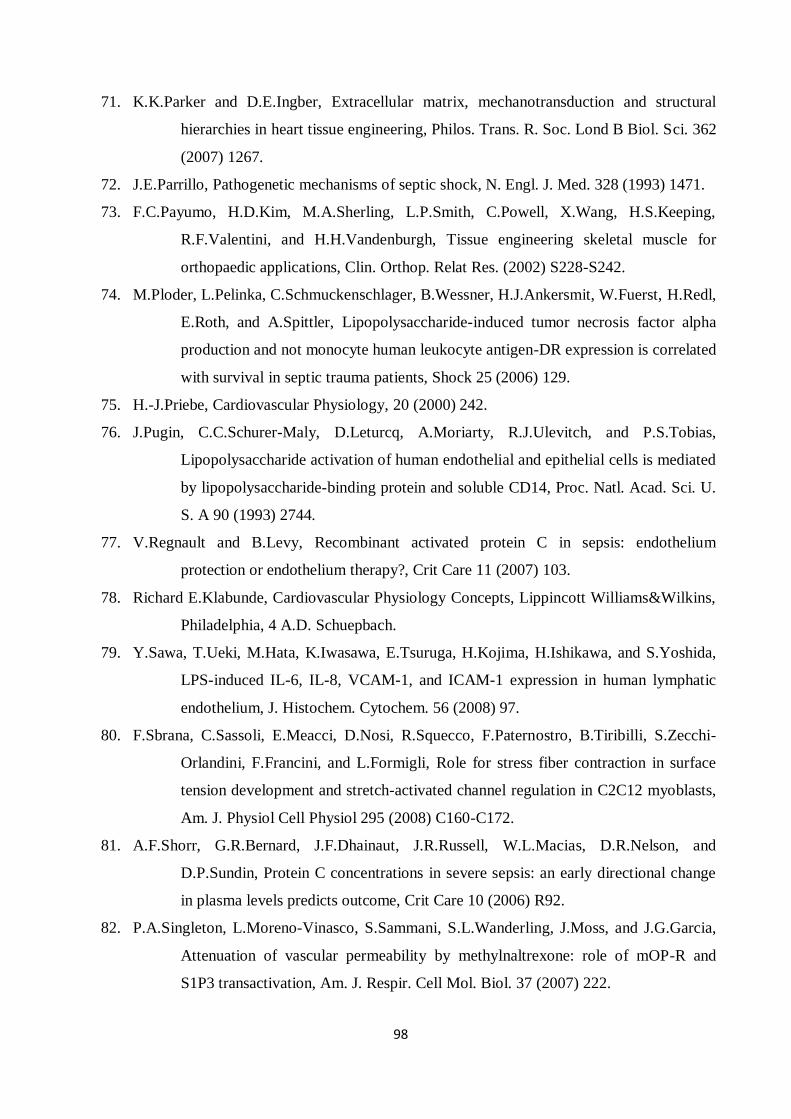
98
71. K.K.Parker and D.E.Ingber, Extracellular matrix, mechanotransduction and structural
hierarchies in heart tissue engineering, Philos. Trans. R. Soc. Lond B Biol. Sci. 362
(2007) 1267.
72. J.E.Parrillo, Pathogenetic mechanisms of septic shock, N. Engl. J. Med. 328 (1993) 1471.
73. F.C.Payumo, H.D.Kim, M.A.Sherling, L.P.Smith, C.Powell, X.Wang, H.S.Keeping,
R.F.Valentini, and H.H.Vandenburgh, Tissue engineering skeletal muscle for
orthopaedic applications, Clin. Orthop. Relat Res. (2002) S228-S242.
74. M.Ploder, L.Pelinka, C.Schmuckenschlager, B.Wessner, H.J.Ankersmit, W.Fuerst, H.Redl,
E.Roth, and A.Spittler, Lipopolysaccharide-induced tumor necrosis factor alpha
production and not monocyte human leukocyte antigen-DR expression is correlated
with survival in septic trauma patients, Shock 25 (2006) 129.
75. H.-J.Priebe, Cardiovascular Physiology, 20 (2000) 242.
76. J.Pugin, C.C.Schurer-Maly, D.Leturcq, A.Moriarty, R.J.Ulevitch, and P.S.Tobias,
Lipopolysaccharide activation of human endothelial and epithelial cells is mediated
by lipopolysaccharide-binding protein and soluble CD14, Proc. Natl. Acad. Sci. U.
S. A 90 (1993) 2744.
77. V.Regnault and B.Levy, Recombinant activated protein C in sepsis: endothelium
protection or endothelium therapy?, Crit Care 11 (2007) 103.
78. Richard E.Klabunde, Cardiovascular Physiology Concepts, Lippincott Williams&Wilkins,
Philadelphia, 4 A.D. Schuepbach.
79. Y.Sawa, T.Ueki, M.Hata, K.Iwasawa, E.Tsuruga, H.Kojima, H.Ishikawa, and S.Yoshida,
LPS-induced IL-6, IL-8, VCAM-1, and ICAM-1 expression in human lymphatic
endothelium, J. Histochem. Cytochem. 56 (2008) 97.
80. F.Sbrana, C.Sassoli, E.Meacci, D.Nosi, R.Squecco, F.Paternostro, B.Tiribilli, S.Zecchi-
Orlandini, F.Francini, and L.Formigli, Role for stress fiber contraction in surface
tension development and stretch-activated channel regulation in C2C12 myoblasts,
Am. J. Physiol Cell Physiol 295 (2008) C160-C172.
81. A.F.Shorr, G.R.Bernard, J.F.Dhainaut, J.R.Russell, W.L.Macias, D.R.Nelson, and
D.P.Sundin, Protein C concentrations in severe sepsis: an early directional change
in plasma levels predicts outcome, Crit Care 10 (2006) R92.
82. P.A.Singleton, L.Moreno-Vinasco, S.Sammani, S.L.Wanderling, J.Moss, and J.G.Garcia,
Attenuation of vascular permeability by methylnaltrexone: role of mOP-R and
S1P3 transactivation, Am. J. Respir. Cell Mol. Biol. 37 (2007) 222.
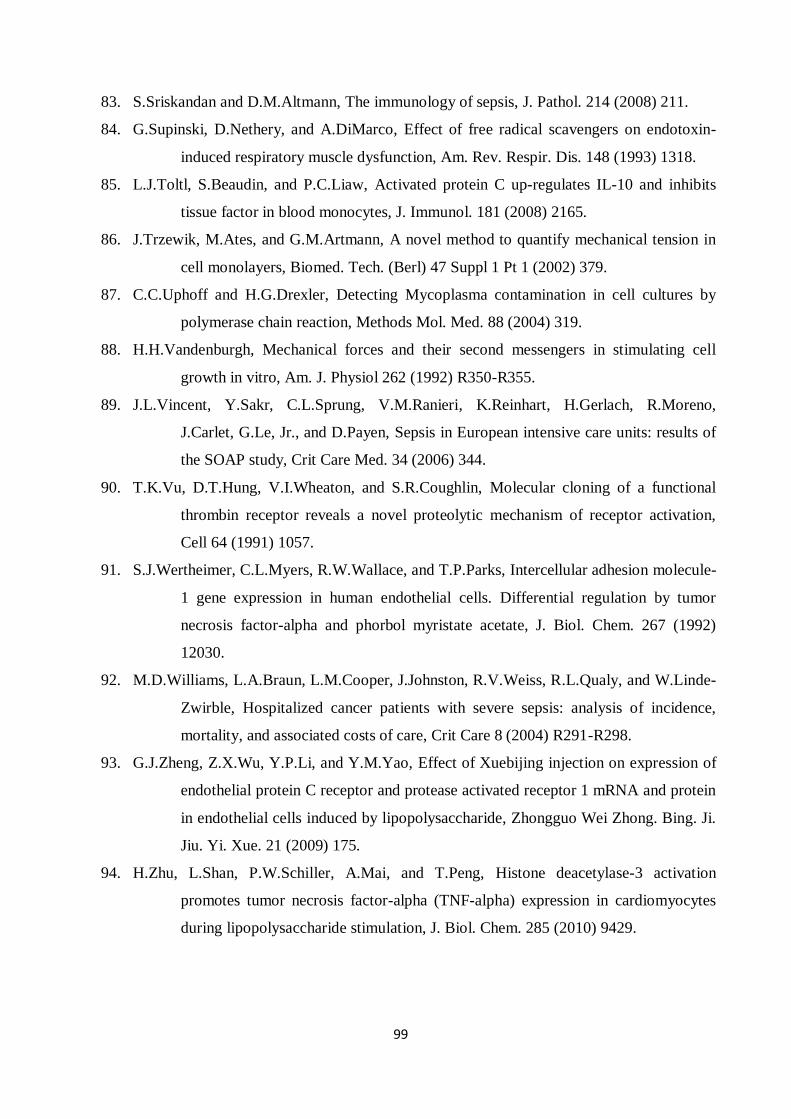
99
83. S.Sriskandan and D.M.Altmann, The immunology of sepsis, J. Pathol. 214 (2008) 211.
84. G.Supinski, D.Nethery, and A.DiMarco, Effect of free radical scavengers on endotoxin-
induced respiratory muscle dysfunction, Am. Rev. Respir. Dis. 148 (1993) 1318.
85. L.J.Toltl, S.Beaudin, and P.C.Liaw, Activated protein C up-regulates IL-10 and inhibits
tissue factor in blood monocytes, J. Immunol. 181 (2008) 2165.
86. J.Trzewik, M.Ates, and G.M.Artmann, A novel method to quantify mechanical tension in
cell monolayers, Biomed. Tech. (Berl) 47 Suppl 1 Pt 1 (2002) 379.
87. C.C.Uphoff and H.G.Drexler, Detecting Mycoplasma contamination in cell cultures by
polymerase chain reaction, Methods Mol. Med. 88 (2004) 319.
88. H.H.Vandenburgh, Mechanical forces and their second messengers in stimulating cell
growth in vitro, Am. J. Physiol 262 (1992) R350-R355.
89. J.L.Vincent, Y.Sakr, C.L.Sprung, V.M.Ranieri, K.Reinhart, H.Gerlach, R.Moreno,
J.Carlet, G.Le, Jr., and D.Payen, Sepsis in European intensive care units: results of
the SOAP study, Crit Care Med. 34 (2006) 344.
90. T.K.Vu, D.T.Hung, V.I.Wheaton, and S.R.Coughlin, Molecular cloning of a functional
thrombin receptor reveals a novel proteolytic mechanism of receptor activation,
Cell 64 (1991) 1057.
91. S.J.Wertheimer, C.L.Myers, R.W.Wallace, and T.P.Parks, Intercellular adhesion molecule-
1 gene expression in human endothelial cells. Differential regulation by tumor
necrosis factor-alpha and phorbol myristate acetate, J. Biol. Chem. 267 (1992)
12030.
92. M.D.Williams, L.A.Braun, L.M.Cooper, J.Johnston, R.V.Weiss, R.L.Qualy, and W.Linde-
Zwirble, Hospitalized cancer patients with severe sepsis: analysis of incidence,
mortality, and associated costs of care, Crit Care 8 (2004) R291-R298.
93. G.J.Zheng, Z.X.Wu, Y.P.Li, and Y.M.Yao, Effect of Xuebijing injection on expression of
endothelial protein C receptor and protease activated receptor 1 mRNA and protein
in endothelial cells induced by lipopolysaccharide, Zhongguo Wei Zhong. Bing. Ji.
Jiu. Yi. Xue. 21 (2009) 175.
94. H.Zhu, L.Shan, P.W.Schiller, A.Mai, and T.Peng, Histone deacetylase-3 activation
promotes tumor necrosis factor-alpha (TNF-alpha) expression in cardiomyocytes
during lipopolysaccharide stimulation, J. Biol. Chem. 285 (2010) 9429.
100
Abbreviations:
IL: Interleukin
TNF: Tumor necrosis factor
EPCR: Endothelial Protein C Receptor
rhAPC: Recombinant activated protein C
PAR: protease-activated receptor-1
PROWESS: the Recombinant Human Activated Protein C Worldwide Evaluation in Severe Sepsis
LPS: Lipopolysaccharide
ICAM: Intracellular adhesion molecules
VCAMs: Vascular adhesion molecules
MODS: Multiple organ dysfunction syndrome
EMEA: European Medicines Evaluation Agency
FDA:the US Food and Drug Administration
EPCR: Endothelial protein C receptor
S1P1: Sphingosine-1-phosphate receptor
NfκB:Nuclear factor κB
DNA: Deoksiribonükleik
RNA: Ribonucleicacid
AIF: Apoptosis-inducing factor
tPA: tissue plasminogen activator
MLCK: Myosin light chain kinase
ECM: Extra cellular matrix
MLCP: Myosin light chain phosphatase
MYPT: Myosin phosphatase-targeting sub-unit
Rho: Ras homolog gene family
mESC: Mouse Embryonic Stem Cell-Derived Cardiomyocytes
HaoEC: Human aortic endothelial cells
101
DMSO: Dimethyl Sulfoxide
DMEM: Dulbecco’s Modified Eagle Medium
FCS: Fetal Calf Serum
PES: Phenazine ethosulfate;
ELISA: Enzyme-Linked ImmunoSorbent Assay
HPF: 3´-(p-hydroxyphenyl) fluorescein
LSM: Laser scanning microscope
PMMA: Poly(methyl methacrylate)
CV: Coefficients of Variability
ROCK: Ras homolog gene family kinase
FITC: Fluorescein isothiocyanate
ROS: Reactive oxygen species
Procr: Protein C receptor
F2r: coagulation factor II (thrombin) receptor
102
Curriculum Vitae
Personal details
First Name, Name: Eylem, Kurulgan Demirci
Date and place of birth: 25/08/1979, Izmir (Turkey)
Nationality: Turkish
Marital status: unmarried
E-mail: [email protected]
Education and qualifications
09/2003 – 07/2005 Study of Master of Science in Molecular Medicine, Istanbul
University Institute of Health Science, Medicine School, Turkey
09/1999 – 07/2003 Study of Bachelor of Science in the Department of Biochemistry,
Faculty of Science, Izmir, Turkey
Research and professional experience
05/2010-12/2010 The Wellcome Trust Sanger Institute, Cambridge, United Kingdom
09/2005 – 07/2011 FH Aachen Applied Sciences University Germany

103
List of publications
1. Kurulgan Demirci E., P. Linder, T. Demirci, J. Trzewik, I.Digel, P. Kayser, D. Porst, G.
M. Artmann, A. Temiz Artmann. Contractile Tension of Endothelial Cells: An LPS
Based In-vitro Sepsis Model. Medical & Biological Engineering & Computing (Journal
of Bioscience and Bioengineering, 2012).
2. Demirci T., Demirci Kurulgan E., Oflaz H., Karakullah G. Sarikanat M., Sakizli M1.
Tubacin Inhibits Adiposeness with Mechanical Stress. Journal of Tissue Engineering
and Regenerative Medicine (Submitted, 2011).
3. Kurulgan Demirci E., Demirci, P. Linder, T. J. Trzewik, I.Digel, P. Kayser, D. Porst, G.
M. Artmann, A. Temiz Artmann. Recombinant Activated Protein C regulates the
contractility of the cardiomyocytes: an in-vitro sepsis model. Medical & Biological
Engineering & Computing (Submitted, 2011).
4. Kurulgan Demirci E., Demirci T., Trzewik J., Linder P., Artmann GM, Sakızlı M., Temiz
Artmann A., Genome-wide gene expression analysis of nih 3t3 cell line under
mechanical Stimulation. Cellular and Molecular Bioengineering 2010 March; 4(1): 46-
55.
5. Varda Sengul S, Demirci T, Sen BH, Erkizan V, Kurulgan E., Baylas H. Human beta
defensin-1 and -2 expression in the gingiva of patients with specific periodontal
diseases. J Periodontal Res. 2007 Oct; 42(5):429-37.
6. Digel I, Kurulgan E., Linder P, Kayser P, Porst D, Braem GJ, Zerlin K, Artmann GM,
Artmann AT. Decrease in extracellular collagen cross linking after NMR magnetic
field application in skin fibroblasts. Medical & Biological Engineering & Computing.
2007 Jan; 42(1): 91-7.
7. Digel I, Temiz Artmann A, Nishikawa K, Cook M, Kurulgan E., Artmann GM.
Bactericidal effects of plasma-generated cluster ions. Med Biol. Eng Comput. 2005
Nov;43(6):800-7.


![UNIVERSITY OF PUNE [4362]-113unipune.ac.in/.../april2013/Engineering/SE-2008-Mechanical.pdf · UNIVERSITY OF PUNE [4362]-113 S. E. ... State and explain Pascal’s law. (2) b) Prove](https://static.fdocuments.in/doc/165x107/5ae4f88e7f8b9a9e5d8bd3ef/university-of-pune-4362-of-pune-4362-113-s-e-state-and-explain-pascals.jpg)