THE EFFECT OF RESIDENTIAL SOLAR PHOTOVOLTAIC SYSTEMS ON...
22
THE EFFECT OF RESIDENTIAL SOLAR PHOTOVOLTAIC SYSTEMS ON HOME VALUE: A CASE STUDY OF HAWAI‘I Sherilyn Wee October 19, 2015 Seminar in Energy And Environmental Policy
Transcript of THE EFFECT OF RESIDENTIAL SOLAR PHOTOVOLTAIC SYSTEMS ON...
THE EFFECT OF RESIDENTIAL SOLAR PHOTOVOLTAIC SYSTEMS ON HOME VALUE: A CASE STUDY OF HAWAI‘I
Sherilyn Wee
October 19, 2015
Seminar in Energy And Environmental Policy
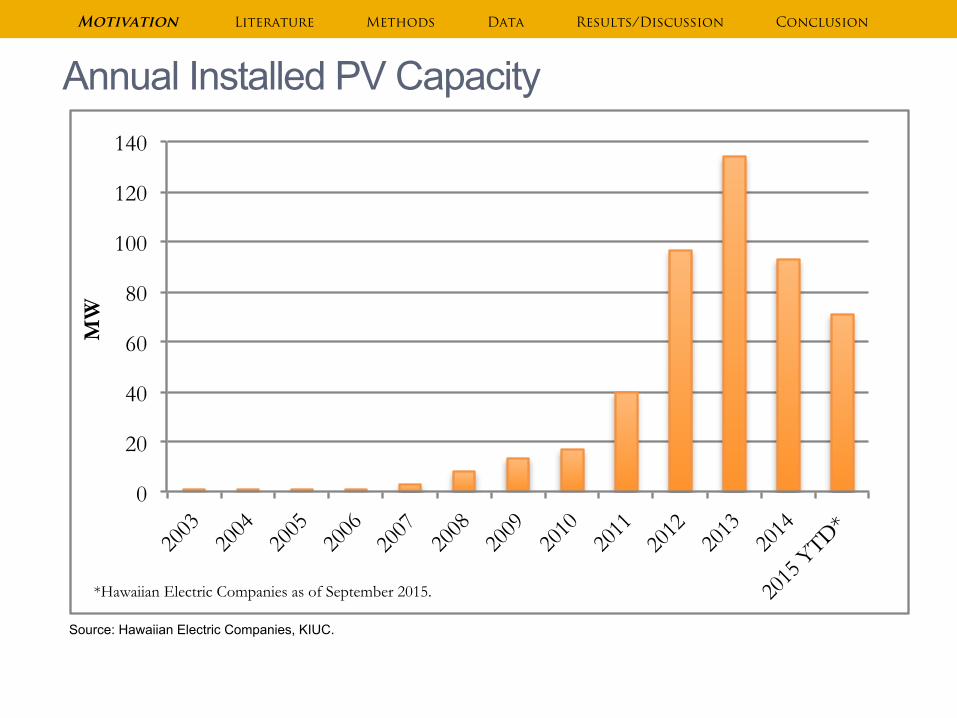
Annual Installed PV Capacity
Source: Hawaiian Electric Companies, KIUC.
Motivation Literature Methods Data Results/Discussion Conclusion
0
20
40
60
80
100
120
140
2003
20
04
2005
20
06
2007
20
08
2009
20
10
2011
20
12
2013
20
14
2015
YTD*
MW
*Hawaiian Electric Companies as of September 2015.
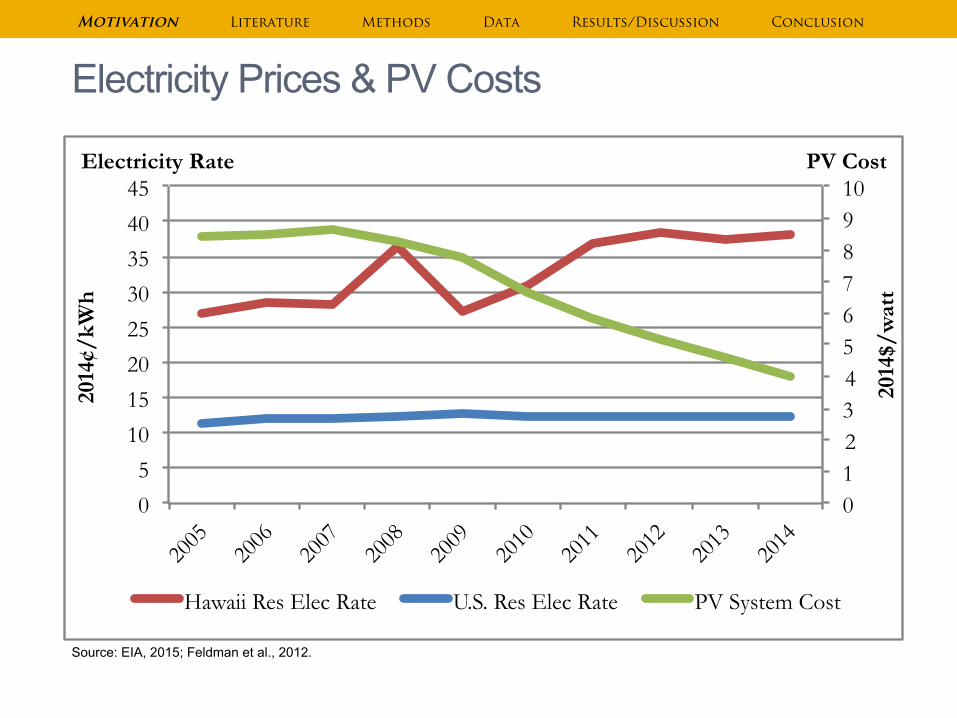
Electricity Prices & PV Costs
Source: EIA, 2015; Feldman et al., 2012.
0 1 2 3 4 5 6 7 8 9 10
0
5
10
15
20
25
30
35
40
45
2005
20
06
2007
20
08
2009
20
10
2011
20
12
2013
20
14
2014
$/w
att
2014
¢/kW
h
Hawaii Res Elec Rate U.S. Res Elec Rate PV System Cost
Electricity Rate PV Cost
Motivation Literature Methods Data Results/Discussion Conclusion
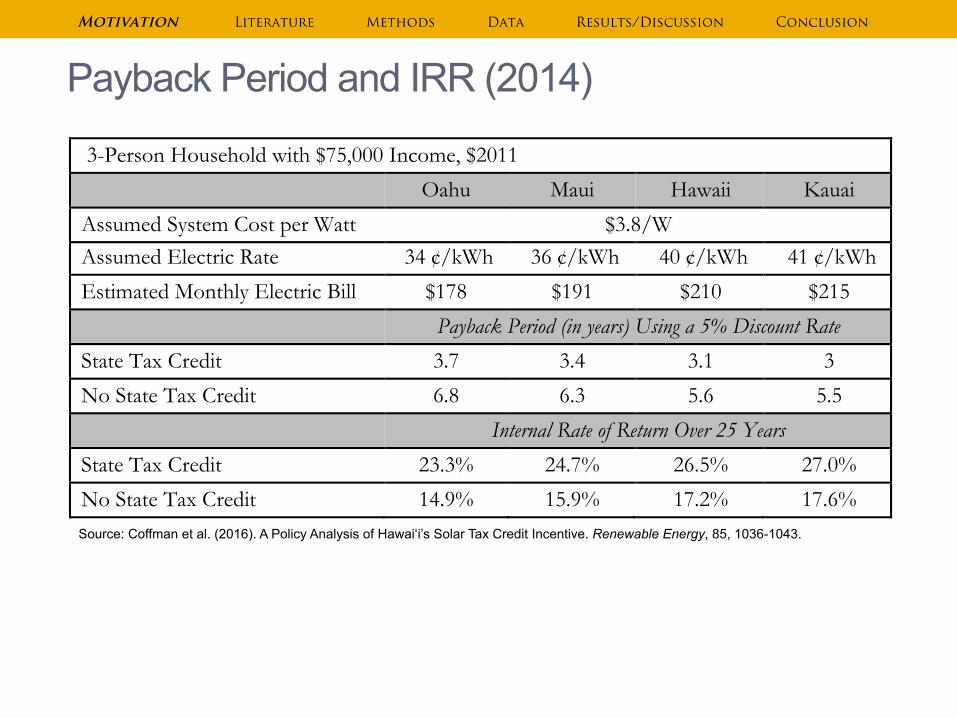
Payback Period and IRR (2014)
Source: Coffman et al. (2016). A Policy Analysis of Hawai‘i’s Solar Tax Credit Incentive. Renewable Energy, 85, 1036-1043.
Motivation Literature Methods Data Results/Discussion Conclusion
3-Person Household with $75,000 Income, $2011
Oahu Maui Hawaii Kauai
Assumed System Cost per Watt $3.8/W Assumed Electric Rate 34 ¢/kWh 36 ¢/kWh 40 ¢/kWh 41 ¢/kWh
Estimated Monthly Electric Bill $178 $191 $210 $215
Payback Period (in years) Using a 5% Discount Rate
State Tax Credit 3.7 3.4 3.1 3
No State Tax Credit 6.8 6.3 5.6 5.5
Internal Rate of Return Over 25 Years
State Tax Credit 23.3% 24.7% 26.5% 27.0%
No State Tax Credit 14.9% 15.9% 17.2% 17.6%
!1!
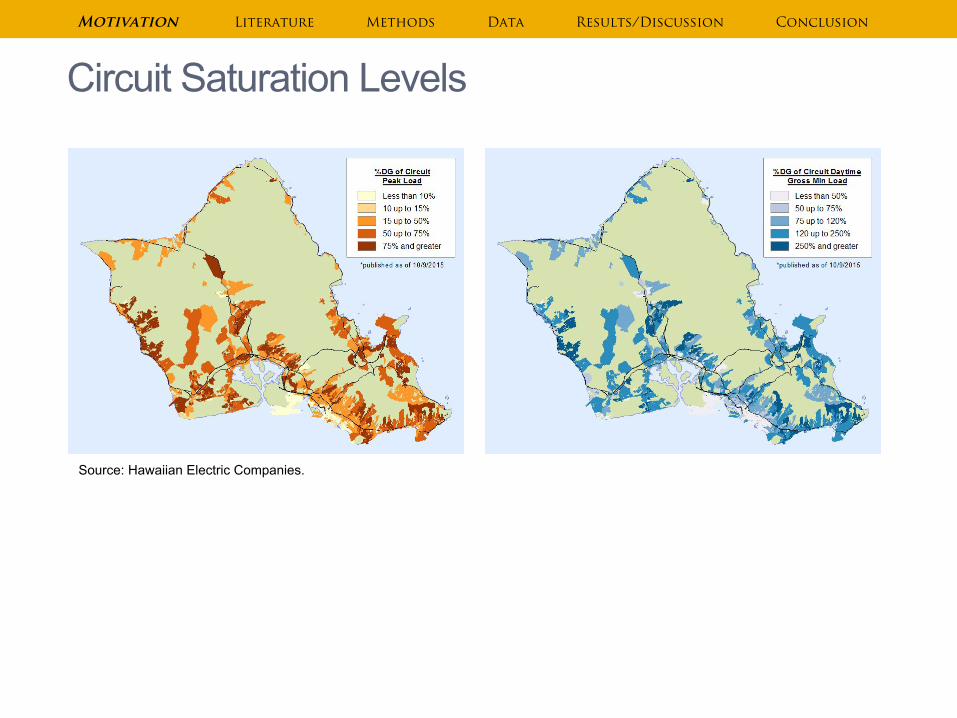
Circuit Saturation Levels
Source: Hawaiian Electric Companies.
Motivation Literature Methods Data Results/Discussion Conclusion
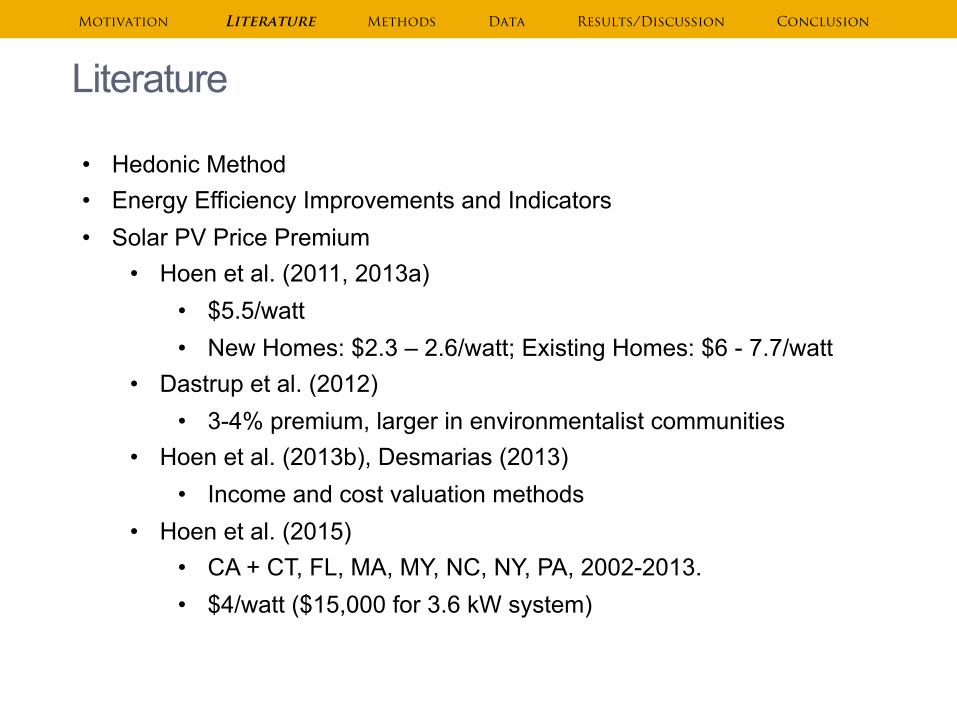
Literature
• Hedonic Method • Energy Efficiency Improvements and Indicators • Solar PV Price Premium
• Hoen et al. (2011, 2013a) • $5.5/watt • New Homes: $2.3 – 2.6/watt; Existing Homes: $6 - 7.7/watt
• Dastrup et al. (2012) • 3-4% premium, larger in environmentalist communities
• Hoen et al. (2013b), Desmarias (2013) • Income and cost valuation methods
• Hoen et al. (2015) • CA + CT, FL, MA, MY, NC, NY, PA, 2002-2013. • $4/watt ($15,000 for 3.6 kW system)
Motivation Literature Methods Data Results/Discussion Conclusion
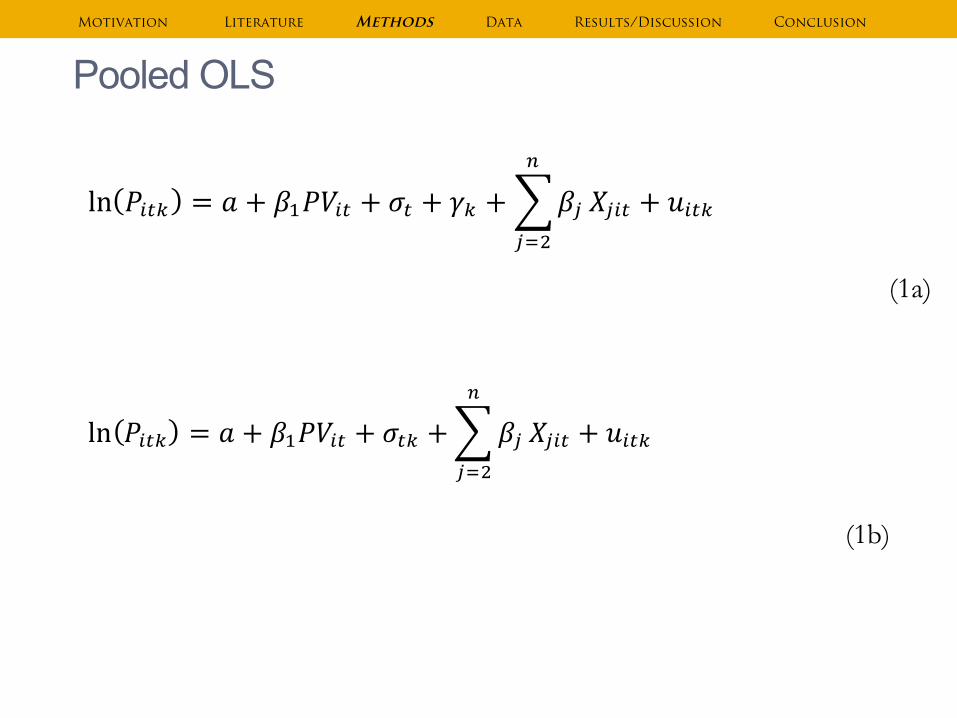
Pooled OLS
ln !!"# = ! + !!!"!" + !! + !! + !!!
!!!!!"# + !!"#
(1a) where ! is a constant; !!"# represents the sale price of home ! in quarter !, in neighborhood !; !! approximately reports the value of PV as a percentage of the sale price; !"!" indicates whether there is a PV system present; !! is the quarter and year in which the home was sold; !! is the neighborhood (zipcode) in which the home was sold; !! ’s represent ! − 1 home and property characteristics; and !!"# is a random disturbance term
ln !!"# = ! + !!!"!" + !!" + !!!
!!!!!"# + !!"#
(1b) where σ!" is a neighborhood-by-time effect at the zip code and quarter-year level.
Motivation Literature Methods Data Results/Discussion Conclusion
ln !!"# = ! + !!!"!" + !! + !! + !!!
!!!!!"# + !!"#
(1a) where ! is a constant; !!"# represents the sale price of home ! in quarter !, in neighborhood !; !! approximately reports the value of PV as a percentage of the sale price; !"!" indicates whether there is a PV system present; !! is the quarter and year in which the home was sold; !! is the neighborhood (zipcode) in which the home was sold; !! ’s represent ! − 1 home and property characteristics; and !!"# is a random disturbance term
ln !!"# = ! + !!!"!" + !!" + !!!
!!!!!"# + !!"#
(1b) where σ!" is a neighborhood-by-time effect at the zip code and quarter-year level.
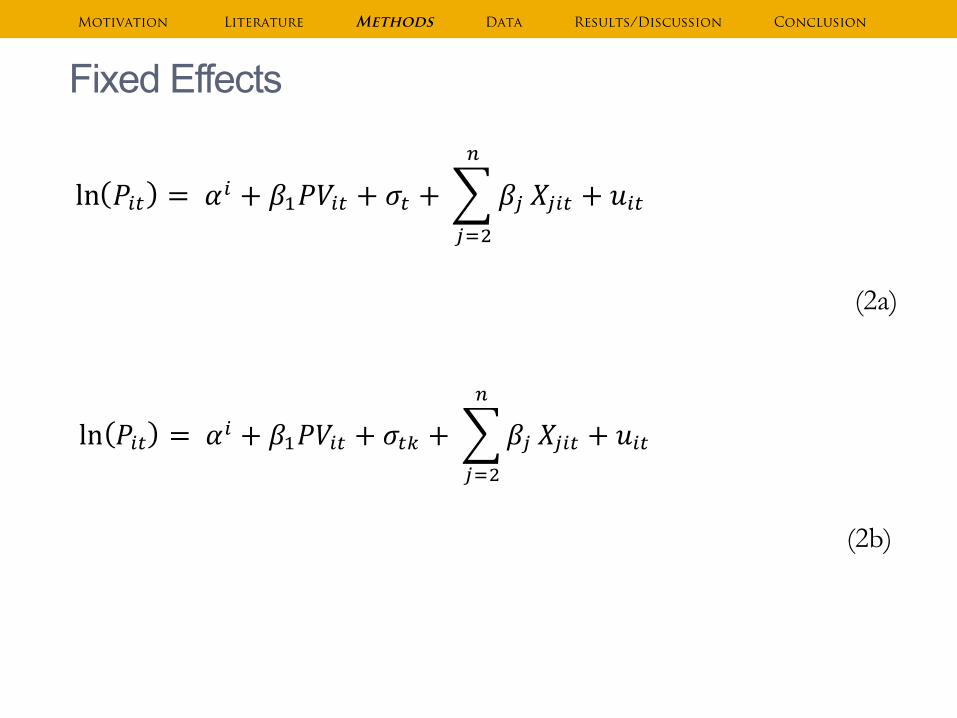
Fixed Effects
ln !!" = !!! + !!!"!" + !! + ! !!!
!!!!!"# + !!"
(2a)
where !!are time-invariant home identification dummies based on the street number, street name, apartment number, lot number, and tax map key of each property.
ln !!" = !!! + !!!"!" + !!" + ! !!!
!!!!!"# + !!"
(2b)
where !!" is the interaction of time at the quarter-year level with the time-invariant zip code dummy.
Motivation Literature Methods Data Results/Discussion Conclusion
ln !!" = !!! + !!!"!" + !! + ! !!!
!!!!!"# + !!"
(2a)
where !!are time-invariant home identification dummies based on the street number, street name, apartment number, lot number, and tax map key of each property.
ln !!" = !!! + !!!"!" + !!" + ! !!!
!!!!!"# + !!"
(2b)
where !!" is the interaction of time at the quarter-year level with the time-invariant zip code dummy.

System Size (Permit Value) ln !!"# = !! + !! ln !"#$%&'( + !! + !! + !!
!
!!!!!"# + !!"#
(3a)
ln !!"# = !! + !! ln !"#$%&'( + !!" + !!!
!!!!!"# + !!"#
(3b)
ln !!" = !!! + !!!"(!!"#$!"#)+ !! + !!!
!!!!!"# + !!"
(4a)
ln !!" = !!! + !!!"(!"#$%&'()+ !!" + !!!
!!!!!"# + !!"
(4b)
where !"#$%&'( denotes the value of the building permit(s) issued up until the time of home sale; and !! is the percentage change in sales price from a one percent increase in permit value (partial elasticity).
Motivation Literature Methods Data Results/Discussion Conclusion
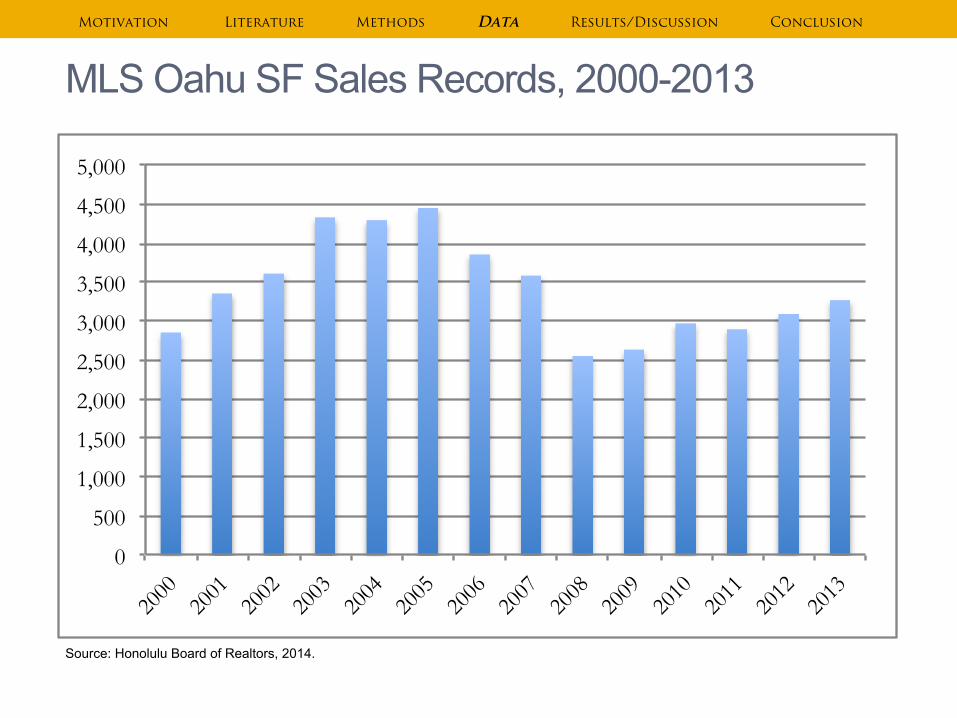
MLS Oahu SF Sales Records, 2000-2013
Source: Honolulu Board of Realtors, 2014.
0
500
1,000
1,500
2,000
2,500
3,000
3,500
4,000
4,500
5,000
2000
20
01
2002
20
03
2004
20
05
2006
20
07
2008
20
09
2010
20
11
2012
20
13
Motivation Literature Methods Data Results/Discussion Conclusion
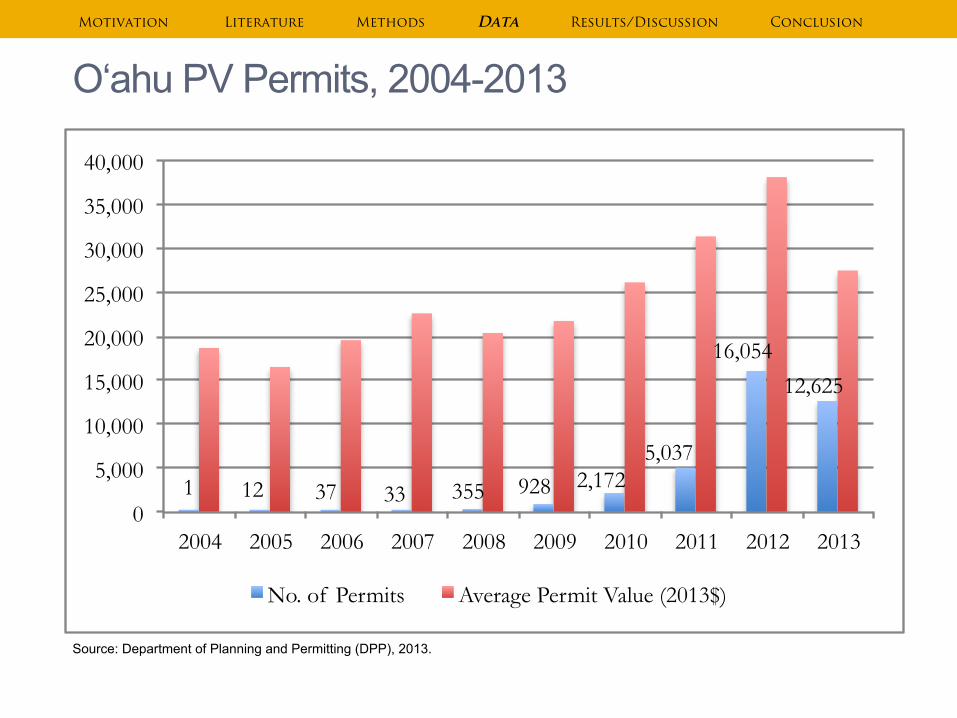
Oʻahu PV Permits, 2004-2013
Source: Department of Planning and Permitting (DPP), 2013.
1 12 37 33 355 928 2,172 5,037
16,054
12,625
0
5,000
10,000
15,000
20,000
25,000
30,000
35,000
40,000
2004 2005 2006 2007 2008 2009 2010 2011 2012 2013
No. of Permits Average Permit Value (2013$)
Motivation Literature Methods Data Results/Discussion Conclusion
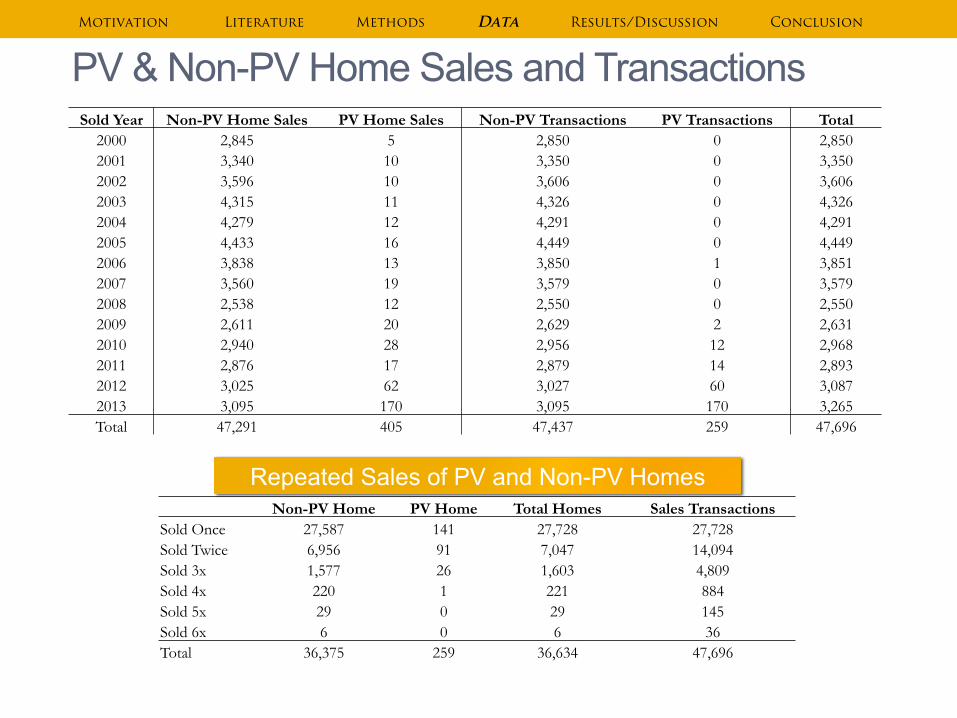
PV & Non-PV Home Sales and Transactions Motivation Literature Methods Data Results/Discussion Conclusion
Sold Year Non-PV Home Sales PV Home Sales Non-PV Transactions PV Transactions Total 2000 2,845 5 2,850 0 2,850 2001 3,340 10 3,350 0 3,350 2002 3,596 10 3,606 0 3,606 2003 4,315 11 4,326 0 4,326 2004 4,279 12 4,291 0 4,291 2005 4,433 16 4,449 0 4,449 2006 3,838 13 3,850 1 3,851 2007 3,560 19 3,579 0 3,579 2008 2,538 12 2,550 0 2,550 2009 2,611 20 2,629 2 2,631 2010 2,940 28 2,956 12 2,968 2011 2,876 17 2,879 14 2,893 2012 3,025 62 3,027 60 3,087 2013 3,095 170 3,095 170 3,265 Total 47,291 405 47,437 259 47,696
Non-PV Home PV Home Total Homes Sales Transactions Sold Once 27,587 141 27,728 27,728 Sold Twice 6,956 91 7,047 14,094 Sold 3x 1,577 26 1,603 4,809 Sold 4x 220 1 221 884 Sold 5x 29 0 29 145 Sold 6x 6 0 6 36 Total 36,375 259 36,634 47,696
Repeated Sales of PV and Non-PV Homes

Summary Statistics Motivation Literature Methods Data Results/Discussion Conclusion
PV Transaction Non- PV Transaction
(n = 259 ) (n = 47,437) Variable Description Mean SD Min Median Max Mean SD Min Median Max
soldpr sale price (not adjusted for inflation) $913,385 $512,567 $175,500 $730,000 $3,000,000 $628,850 $440,438 $133,716 $530,000 $3,000,000 adjsoldpr adjusted sold price in 2013 dollars $924,284 $518,366 $178,631 $740,000 $3,053,513 $753,675 $516,338 $133,716 $630,000 $4,320,885 lnsoldpr natural log of adjsoldpr 14 0.46 12 14 15 13 0.53 12 13 15 year built year the home was built 1986 22 1926 1989 2013 1976 21 1884 1975 2013 age age of home (year 2013 as baseline) 27 22 0 24 87 37 21 0 38 129
age2 age of home squared (1,000s) 1.2 1.6 0 0.58 7.6 1.8 1.7 0 1.4 17 living sqft size of living area (1,000s) 2.1 0.79 0.63 1.9 6.2 1.8 0.88 0.4 1.6 22 total sqft total square feet (10,000s) 0.24 0.10 0.06 0.21 0.85 0.21 0.11 0.04 0.18 2.2 land sqft size of parcel (10,000s) 0.86 1.9 0.20 0.60 28 0.83 1.7 0.06 0.60 48 bedrooms no. of bedrooms 3.8 1 2 4 9 3.7 1.3 1 3 42 full baths no. of full bathrooms 2.6 0.83 1 3 6 2.2 0.90 1 2 9 half baths no. of half bathrooms 2.4 0.50 2 2 4 2.4 0.50 1 2 7
pool pool feature dummy 0.21 0.41 0 0 1 0.12 0.32 0 0 1
mountain mountain view dummy 0.60 0.49 0 1 1 0.50 0.50 0 0 1
ocean ocean view dummy 0.30 0.46 0 0 1 0.24 0.43 0 0 1
pvage age (months) of PV system at the time of sale 20 14 1 17 73 - - - - -
permvals permit value at time of sale (proxy for PV system size) $32,751 $20,069 $7,378 $28,900 $120,000 - - - - -
adjpermvals adjusted permit value at time of sale in 2013 dollars $33,047 $20,147 $7,510 $29,476 $130,000 - - - - -
lnpermvals natural log of adjpermval 10 0.59 8.9 10 12 - - - - -
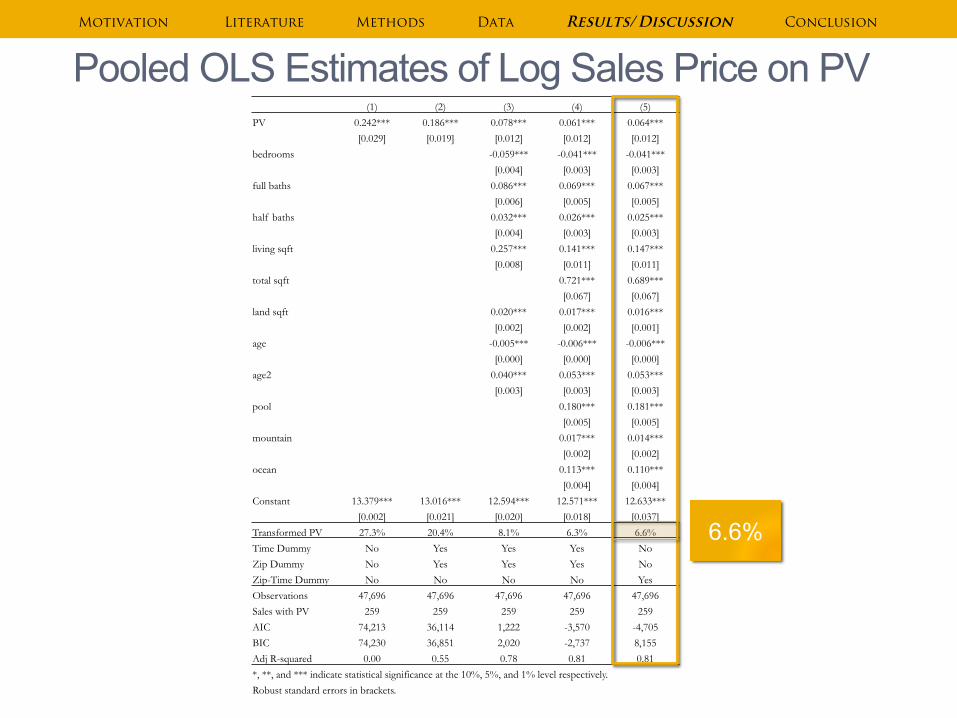
(1) (2) (3) (4) (5)
PV 0.242*** 0.186*** 0.078*** 0.061*** 0.064***
[0.029] [0.019] [0.012] [0.012] [0.012]
bedrooms -0.059*** -0.041*** -0.041***
[0.004] [0.003] [0.003]
full baths 0.086*** 0.069*** 0.067***
[0.006] [0.005] [0.005]
half baths 0.032*** 0.026*** 0.025***
[0.004] [0.003] [0.003]
living sqft 0.257*** 0.141*** 0.147***
[0.008] [0.011] [0.011]
total sqft 0.721*** 0.689***
[0.067] [0.067]
land sqft 0.020*** 0.017*** 0.016***
[0.002] [0.002] [0.001]
age -0.005*** -0.006*** -0.006***
[0.000] [0.000] [0.000]
age2 0.040*** 0.053*** 0.053***
[0.003] [0.003] [0.003]
pool 0.180*** 0.181***
[0.005] [0.005]
mountain 0.017*** 0.014***
[0.002] [0.002]
ocean 0.113*** 0.110***
[0.004] [0.004]
Constant 13.379*** 13.016*** 12.594*** 12.571*** 12.633***
[0.002] [0.021] [0.020] [0.018] [0.037]
Transformed PV 27.3% 20.4% 8.1% 6.3% 6.6%
Time Dummy No Yes Yes Yes No
Zip Dummy No Yes Yes Yes No
Zip-Time Dummy No No No No Yes
Observations 47,696 47,696 47,696 47,696 47,696
Sales with PV 259 259 259 259 259
AIC 74,213 36,114 1,222 -3,570 -4,705
BIC 74,230 36,851 2,020 -2,737 8,155
Adj R-squared 0.00 0.55 0.78 0.81 0.81
*, **, and *** indicate statistical significance at the 10%, 5%, and 1% level respectively.
Robust standard errors in brackets.
Pooled OLS Estimates of Log Sales Price on PV Motivation Literature Methods Data Results/Discussion Conclusion
6.6%
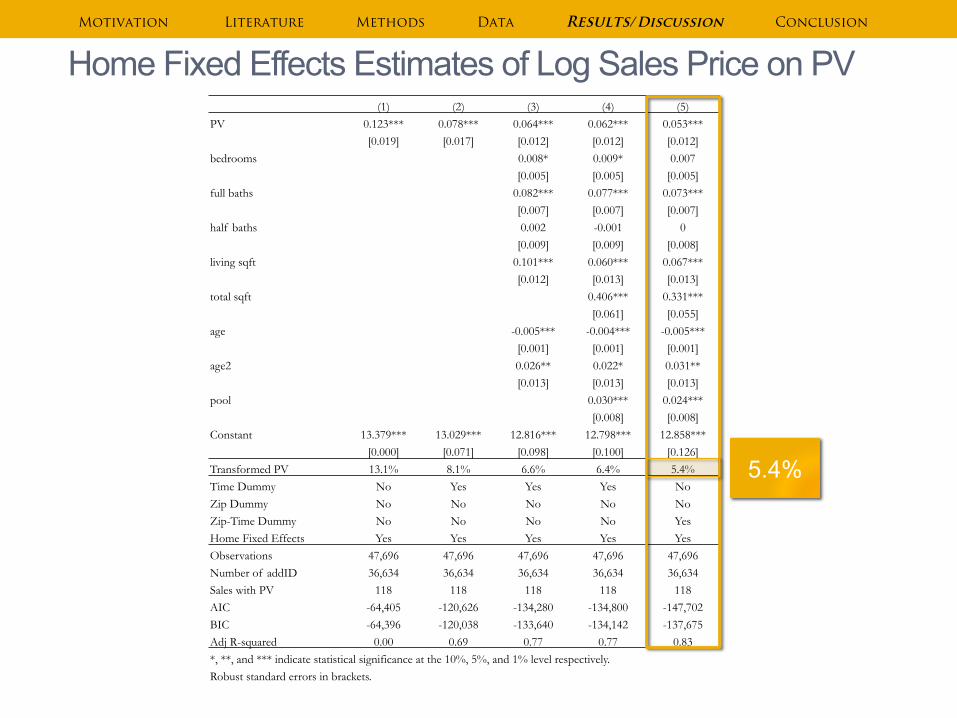
(1) (2) (3) (4) (5) PV 0.123*** 0.078*** 0.064*** 0.062*** 0.053***
[0.019] [0.017] [0.012] [0.012] [0.012] bedrooms 0.008* 0.009* 0.007
[0.005] [0.005] [0.005] full baths 0.082*** 0.077*** 0.073***
[0.007] [0.007] [0.007] half baths 0.002 -0.001 0
[0.009] [0.009] [0.008] living sqft 0.101*** 0.060*** 0.067***
[0.012] [0.013] [0.013] total sqft 0.406*** 0.331***
[0.061] [0.055] age -0.005*** -0.004*** -0.005***
[0.001] [0.001] [0.001] age2 0.026** 0.022* 0.031**
[0.013] [0.013] [0.013] pool 0.030*** 0.024***
[0.008] [0.008] Constant 13.379*** 13.029*** 12.816*** 12.798*** 12.858***
[0.000] [0.071] [0.098] [0.100] [0.126] Transformed PV 13.1% 8.1% 6.6% 6.4% 5.4% Time Dummy No Yes Yes Yes No Zip Dummy No No No No No Zip-Time Dummy No No No No Yes Home Fixed Effects Yes Yes Yes Yes Yes Observations 47,696 47,696 47,696 47,696 47,696 Number of addID 36,634 36,634 36,634 36,634 36,634 Sales with PV 118 118 118 118 118 AIC -64,405 -120,626 -134,280 -134,800 -147,702 BIC -64,396 -120,038 -133,640 -134,142 -137,675 Adj R-squared 0.00 0.69 0.77 0.77 0.83 *, **, and *** indicate statistical significance at the 10%, 5%, and 1% level respectively. Robust standard errors in brackets.
Home Fixed Effects Estimates of Log Sales Price on PV Motivation Literature Methods Data Results/Discussion Conclusion
5.4%
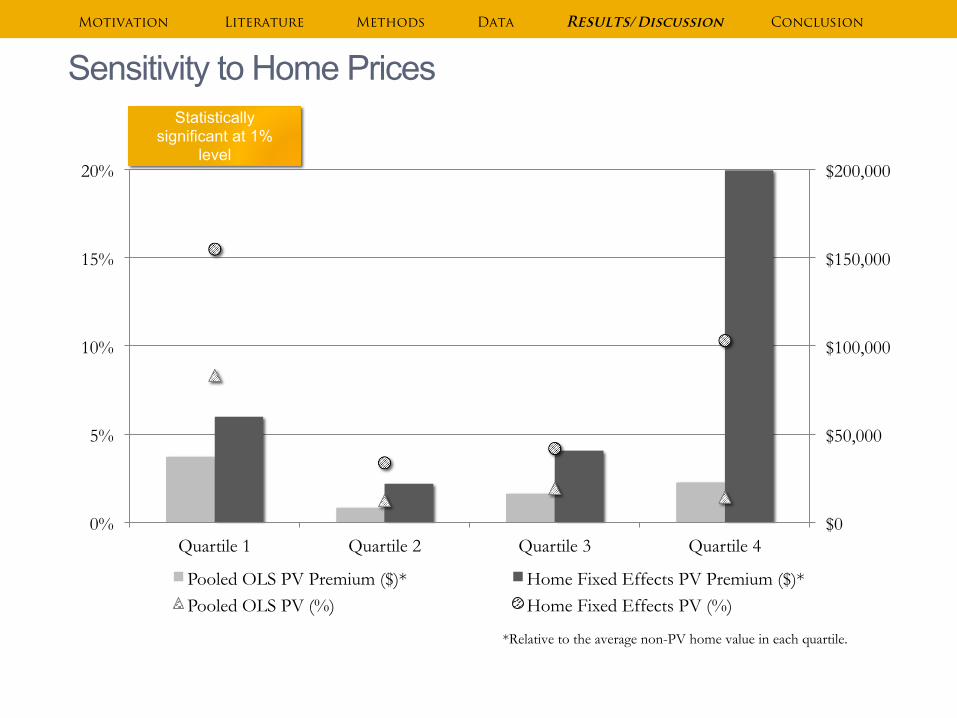
Sensitivity to Home Prices Motivation Literature Methods Data Results/Discussion Conclusion
$0
$50,000
$100,000
$150,000
$200,000
0%
5%
10%
15%
20%
Quartile 1 Quartile 2 Quartile 3 Quartile 4
Pooled OLS PV Premium ($)* Home Fixed Effects PV Premium ($)* Pooled OLS PV (%) Home Fixed Effects PV (%)
*Relative to the average non-PV home value in each quartile.
Statistically significant at 1%
level
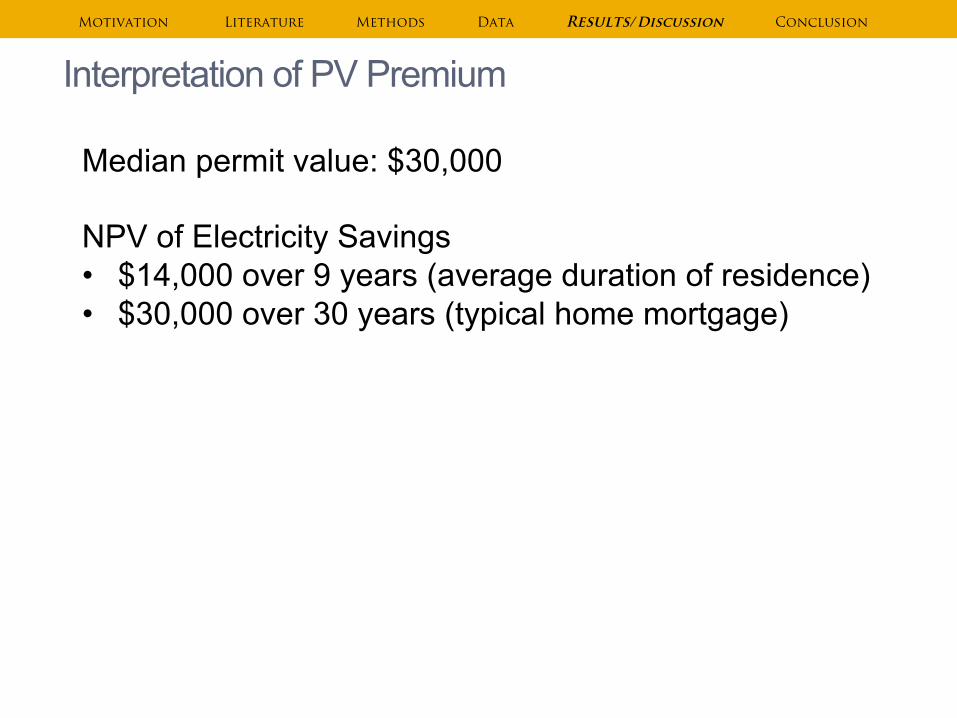
Interpretation of PV Premium Motivation Literature Methods Data Results/Discussion Conclusion
Median permit value: $30,000 NPV of Electricity Savings • $14,000 over 9 years (average duration of residence) • $30,000 over 30 years (typical home mortgage)
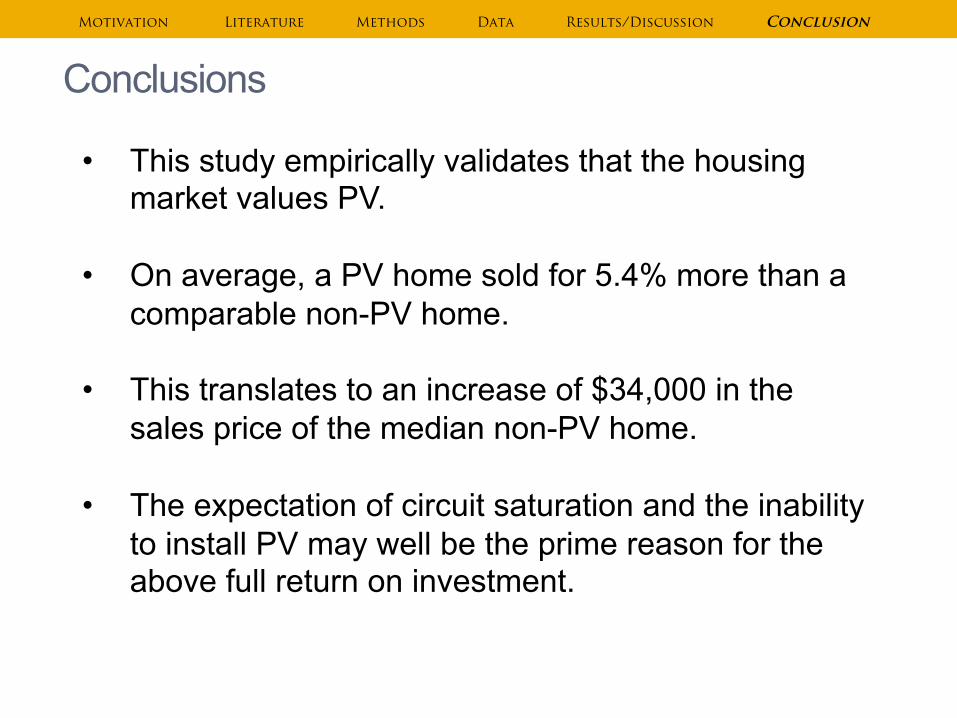
Conclusions
• This study empirically validates that the housing market values PV.
• On average, a PV home sold for 5.4% more than a
comparable non-PV home. • This translates to an increase of $34,000 in the
sales price of the median non-PV home. • The expectation of circuit saturation and the inability
to install PV may well be the prime reason for the above full return on investment.
Motivation Literature Methods Data Results/Discussion Conclusion

Mahalo
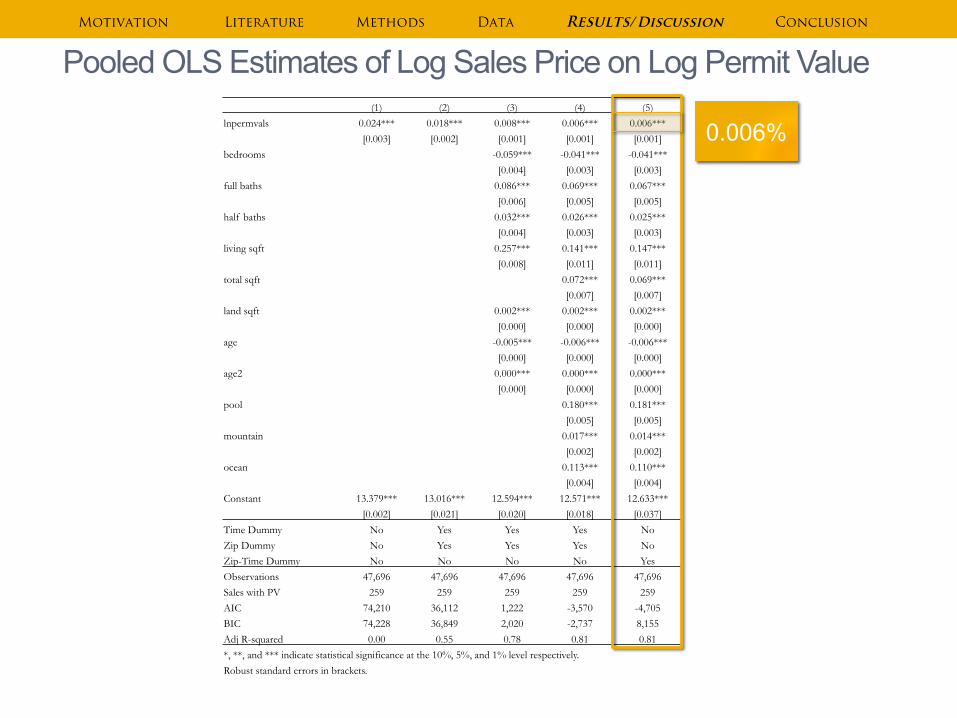
(1) (2) (3) (4) (5) lnpermvals 0.024*** 0.018*** 0.008*** 0.006*** 0.006***
[0.003] [0.002] [0.001] [0.001] [0.001] bedrooms -0.059*** -0.041*** -0.041***
[0.004] [0.003] [0.003] full baths 0.086*** 0.069*** 0.067***
[0.006] [0.005] [0.005] half baths 0.032*** 0.026*** 0.025***
[0.004] [0.003] [0.003] living sqft 0.257*** 0.141*** 0.147***
[0.008] [0.011] [0.011] total sqft 0.072*** 0.069***
[0.007] [0.007] land sqft 0.002*** 0.002*** 0.002***
[0.000] [0.000] [0.000] age -0.005*** -0.006*** -0.006***
[0.000] [0.000] [0.000] age2 0.000*** 0.000*** 0.000***
[0.000] [0.000] [0.000] pool 0.180*** 0.181***
[0.005] [0.005] mountain 0.017*** 0.014***
[0.002] [0.002] ocean 0.113*** 0.110***
[0.004] [0.004] Constant 13.379*** 13.016*** 12.594*** 12.571*** 12.633***
[0.002] [0.021] [0.020] [0.018] [0.037] Time Dummy No Yes Yes Yes No Zip Dummy No Yes Yes Yes No Zip-Time Dummy No No No No Yes Observations 47,696 47,696 47,696 47,696 47,696 Sales with PV 259 259 259 259 259 AIC 74,210 36,112 1,222 -3,570 -4,705 BIC 74,228 36,849 2,020 -2,737 8,155 Adj R-squared 0.00 0.55 0.78 0.81 0.81 *, **, and *** indicate statistical significance at the 10%, 5%, and 1% level respectively. Robust standard errors in brackets.
Pooled OLS Estimates of Log Sales Price on Log Permit Value Motivation Literature Methods Data Results/Discussion Conclusion
0.006%
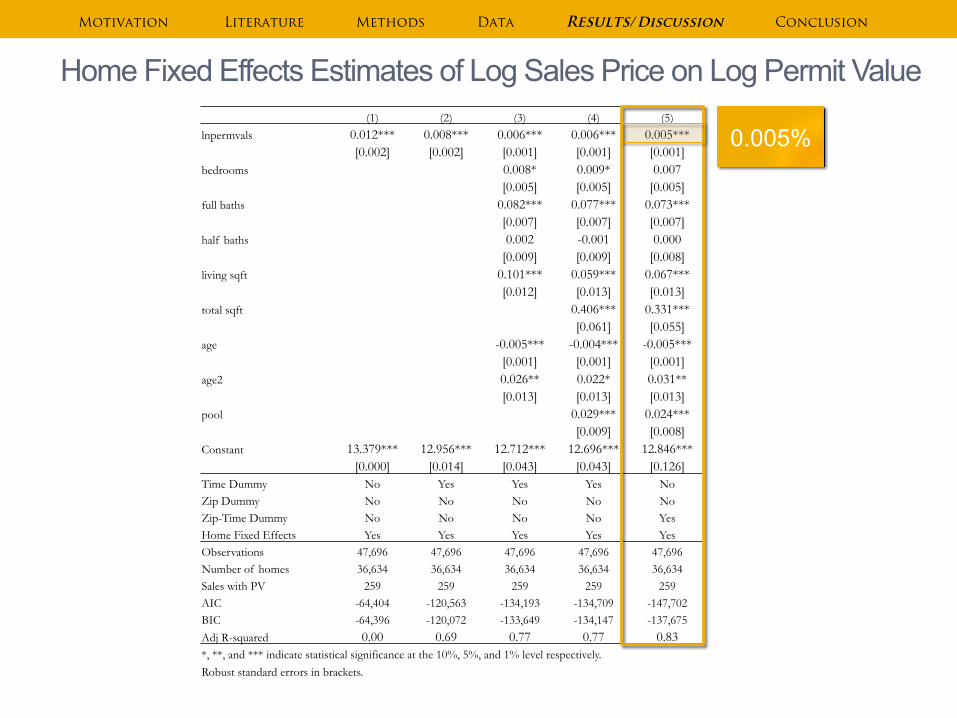
(1) (2) (3) (4) (5) lnpermvals 0.012*** 0.008*** 0.006*** 0.006*** 0.005***
[0.002] [0.002] [0.001] [0.001] [0.001] bedrooms 0.008* 0.009* 0.007
[0.005] [0.005] [0.005] full baths 0.082*** 0.077*** 0.073***
[0.007] [0.007] [0.007] half baths 0.002 -0.001 0.000
[0.009] [0.009] [0.008] living sqft 0.101*** 0.059*** 0.067***
[0.012] [0.013] [0.013] total sqft 0.406*** 0.331***
[0.061] [0.055] age -0.005*** -0.004*** -0.005***
[0.001] [0.001] [0.001] age2 0.026** 0.022* 0.031**
[0.013] [0.013] [0.013] pool 0.029*** 0.024***
[0.009] [0.008] Constant 13.379*** 12.956*** 12.712*** 12.696*** 12.846***
[0.000] [0.014] [0.043] [0.043] [0.126] Time Dummy No Yes Yes Yes No Zip Dummy No No No No No Zip-Time Dummy No No No No Yes Home Fixed Effects Yes Yes Yes Yes Yes Observations 47,696 47,696 47,696 47,696 47,696 Number of homes 36,634 36,634 36,634 36,634 36,634 Sales with PV 259 259 259 259 259 AIC -64,404 -120,563 -134,193 -134,709 -147,702 BIC -64,396 -120,072 -133,649 -134,147 -137,675 Adj R-squared 0.00 0.69 0.77 0.77 0.83 *, **, and *** indicate statistical significance at the 10%, 5%, and 1% level respectively. Robust standard errors in brackets.
Home Fixed Effects Estimates of Log Sales Price on Log Permit Value
Motivation Literature Methods Data Results/Discussion Conclusion
0.005%
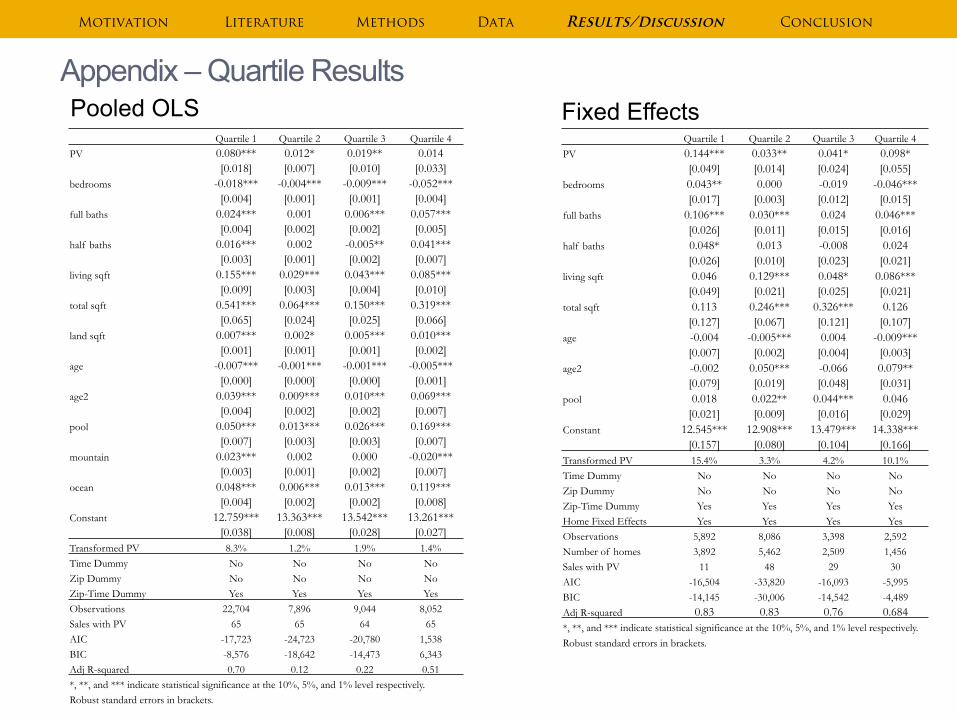
Appendix – Quartile Results
Motivation Literature Methods Data Results/Discussion Conclusion
Pooled OLS Fixed Effects Quartile 1 Quartile 2 Quartile 3 Quartile 4 PV 0.144*** 0.033** 0.041* 0.098* [0.049] [0.014] [0.024] [0.055] bedrooms 0.043** 0.000 -0.019 -0.046*** [0.017] [0.003] [0.012] [0.015] full baths 0.106*** 0.030*** 0.024 0.046*** [0.026] [0.011] [0.015] [0.016] half baths 0.048* 0.013 -0.008 0.024 [0.026] [0.010] [0.023] [0.021] living sqft 0.046 0.129*** 0.048* 0.086*** [0.049] [0.021] [0.025] [0.021] total sqft 0.113 0.246*** 0.326*** 0.126 [0.127] [0.067] [0.121] [0.107] age -0.004 -0.005*** 0.004 -0.009*** [0.007] [0.002] [0.004] [0.003] age2 -0.002 0.050*** -0.066 0.079** [0.079] [0.019] [0.048] [0.031] pool 0.018 0.022** 0.044*** 0.046 [0.021] [0.009] [0.016] [0.029] Constant 12.545*** 12.908*** 13.479*** 14.338*** [0.157] [0.080] [0.104] [0.166] Transformed PV 15.4% 3.3% 4.2% 10.1% Time Dummy No No No No Zip Dummy No No No No Zip-Time Dummy Yes Yes Yes Yes Home Fixed Effects Yes Yes Yes Yes Observations 5,892 8,086 3,398 2,592 Number of homes 3,892 5,462 2,509 1,456 Sales with PV 11 48 29 30 AIC -16,504 -33,820 -16,093 -5,995 BIC -14,145 -30,006 -14,542 -4,489 Adj R-squared 0.83 0.83 0.76 0.684 *, **, and *** indicate statistical significance at the 10%, 5%, and 1% level respectively. Robust standard errors in brackets.
Quartile 1 Quartile 2 Quartile 3 Quartile 4 PV 0.080*** 0.012* 0.019** 0.014 [0.018] [0.007] [0.010] [0.033] bedrooms -0.018*** -0.004*** -0.009*** -0.052*** [0.004] [0.001] [0.001] [0.004] full baths 0.024*** 0.001 0.006*** 0.057*** [0.004] [0.002] [0.002] [0.005] half baths 0.016*** 0.002 -0.005** 0.041*** [0.003] [0.001] [0.002] [0.007] living sqft 0.155*** 0.029*** 0.043*** 0.085*** [0.009] [0.003] [0.004] [0.010] total sqft 0.541*** 0.064*** 0.150*** 0.319*** [0.065] [0.024] [0.025] [0.066] land sqft 0.007*** 0.002* 0.005*** 0.010*** [0.001] [0.001] [0.001] [0.002] age -0.007*** -0.001*** -0.001*** -0.005*** [0.000] [0.000] [0.000] [0.001] age2 0.039*** 0.009*** 0.010*** 0.069*** [0.004] [0.002] [0.002] [0.007] pool 0.050*** 0.013*** 0.026*** 0.169*** [0.007] [0.003] [0.003] [0.007] mountain 0.023*** 0.002 0.000 -0.020*** [0.003] [0.001] [0.002] [0.007] ocean 0.048*** 0.006*** 0.013*** 0.119*** [0.004] [0.002] [0.002] [0.008] Constant 12.759*** 13.363*** 13.542*** 13.261*** [0.038] [0.008] [0.028] [0.027] Transformed PV 8.3% 1.2% 1.9% 1.4% Time Dummy No No No No Zip Dummy No No No No Zip-Time Dummy Yes Yes Yes Yes Observations 22,704 7,896 9,044 8,052 Sales with PV 65 65 64 65 AIC -17,723 -24,723 -20,780 1,538 BIC -8,576 -18,642 -14,473 6,343 Adj R-squared 0.70 0.12 0.22 0.51 *, **, and *** indicate statistical significance at the 10%, 5%, and 1% level respectively. Robust standard errors in brackets.