THE EFFECT OF QUESTION ORDER ON STUDENT …web.phys.ksu.edu/dissertations/msthesis-karagray.pdf ·...
79
THE EFFECT OF QUESTION ORDER ON STUDENT RESPONSES TO MULTIPLE CHOICE PHYSICS QUESTIONS by KARA E. GRAY B.S., Kansas State University, 2003 --------------------------------- A THESIS submitted in partial fulfillment of the requirements for the degree MASTER OF SCIENCE Department of Physics College of Arts and Sciences KANSAS STATE UNIVERSITY Manhattan, Kansas 2004 Approved by: Major Professor N. Sanjay Rebello
Transcript of THE EFFECT OF QUESTION ORDER ON STUDENT …web.phys.ksu.edu/dissertations/msthesis-karagray.pdf ·...

THE EFFECT OF QUESTION ORDER ON STUDENT RESPONSES TO MULTIPLE CHOICE PHYSICS QUESTIONS
by
KARA E. GRAY
B.S., Kansas State University, 2003
---------------------------------
A THESIS
submitted in partial fulfillment of the
requirements for the degree
MASTER OF SCIENCE
Department of Physics
College of Arts and Sciences
KANSAS STATE UNIVERSITY
Manhattan, Kansas
2004
Approved by:
Major Professor N. Sanjay Rebello

ABSTRACT
Previous research has shown that the order of questions can affect students’
responses in some testing situations. However, little research has been done to address
this issue in conceptual physics surveys or to associate question order effects with the
content of the question. This research addresses these deficiencies and increases our
understanding of question order effects. This increased understanding will assist both
researchers and instructors in developing more accurate assessment tools that are critical
if researchers are to continue to expand their knowledge of student understanding.
Test development often relies on the assumption that student knowledge is
unaffected by the test or by the order of questions on the test. The results of this study
call into question this assumption. This study used multiple choice mechanics questions
taken from the Force Concept Inventory in both large class survey and interview
situations with introductory physics students. The analysis shows that question order can
have a statistically significant effect on student responses to survey questions. These
effects are present both before and after instruction, and may influence student scores.
During the interviews, question order again appeared to have an effect as students were
more likely to change their answers when questions were in a particular order. Some
current perspectives on transfer will be used to explain why question order has an effect
on student responses.

i
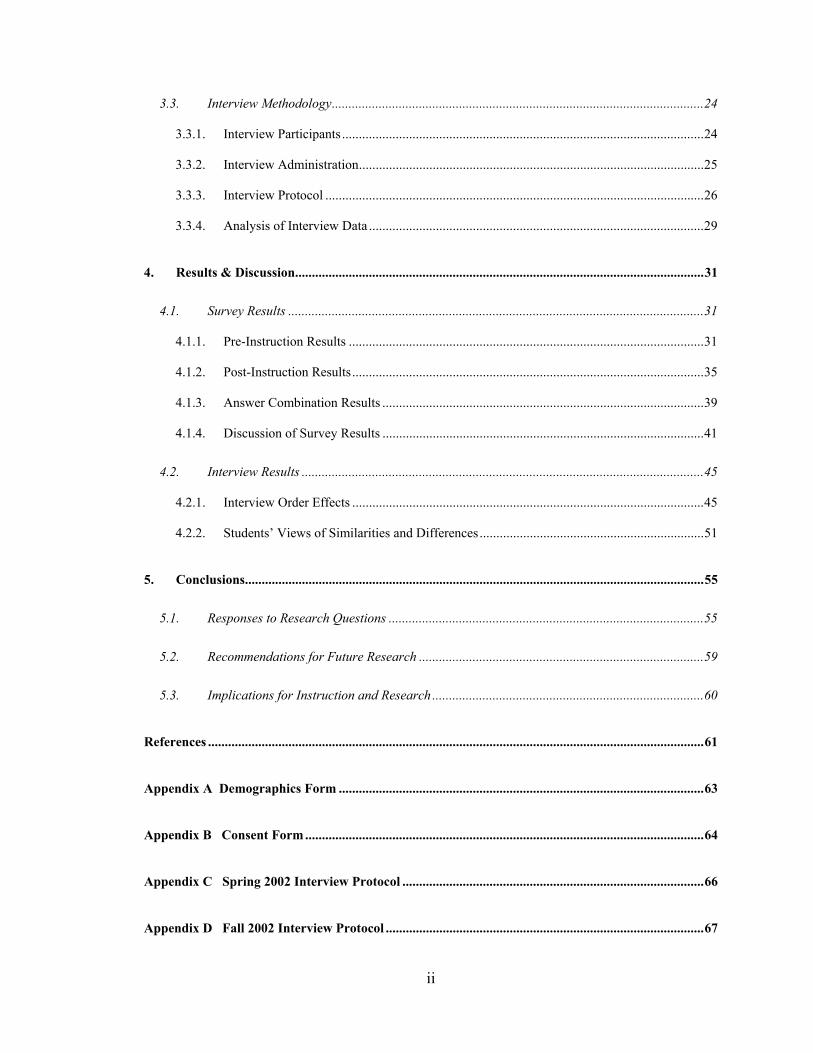
TABLE OF CONTENTS
TABLE OF CONTENTS...............................................................................................................................i
LIST OF FIGURES .....................................................................................................................................iv
LIST OF TABLES ........................................................................................................................................v
ACKNOWLEDGMENTS ...........................................................................................................................vi
1. Introduction .........................................................................................................................................1
1.1. Assessment Issues.........................................................................................................................1
1.2. Technology & Model-Based Conceptual Assessment ..................................................................2
1.3. Research Questions ......................................................................................................................5
2. Literature Review ................................................................................................................................8
2.1. Question Order Effects.................................................................................................................8
2.2. Question Location Effects ..........................................................................................................12
2.3. Transfer of Learning ..................................................................................................................13
2.4. Implications for the Current Study.............................................................................................14
3. Methodology.......................................................................................................................................16
3.1. Overview ....................................................................................................................................16
3.2. Survey Methodology...................................................................................................................17
3.2.1. Survey Questions...................................................................................................................17
3.2.2. Survey Administration...........................................................................................................20
3.2.3. Survey Demographics ...........................................................................................................21
3.2.4. Analysis of Survey Data ........................................................................................................23
ii
3.3. Interview Methodology...............................................................................................................24
3.3.1. Interview Participants ............................................................................................................24
3.3.2. Interview Administration.......................................................................................................25
3.3.3. Interview Protocol .................................................................................................................26
3.3.4. Analysis of Interview Data ....................................................................................................29
4. Results & Discussion..........................................................................................................................31
4.1. Survey Results ............................................................................................................................31
4.1.1. Pre-Instruction Results ..........................................................................................................31
4.1.2. Post-Instruction Results.........................................................................................................35
4.1.3. Answer Combination Results ................................................................................................39
4.1.4. Discussion of Survey Results ................................................................................................41
4.2. Interview Results ........................................................................................................................45
4.2.1. Interview Order Effects .........................................................................................................45
4.2.2. Students’ Views of Similarities and Differences...................................................................51
5. Conclusions.........................................................................................................................................55
5.1. Responses to Research Questions ..............................................................................................55
5.2. Recommendations for Future Research .....................................................................................59
5.3. Implications for Instruction and Research .................................................................................60
References ....................................................................................................................................................61
Appendix A Demographics Form .............................................................................................................63
Appendix B Consent Form .......................................................................................................................64
Appendix C Spring 2002 Interview Protocol ..........................................................................................66
Appendix D Fall 2002 Interview Protocol ...............................................................................................67

iii
Appendix E: Survey Results.......................................................................................................................68

iv
LIST OF FIGURES
Figure 3.1 Accelerating Question: Question #13 on the FCI............................................ 18
Figure 3.2 Non-accelerating Question: Question #14 on the FCI .................................... 18
Figure 3.3 Airplane Question: Question #23 of the FCI................................................... 19
Figure 3.4 Cannon Question ............................................................................................. 27
Figure 3.5 Hockey puck Question .................................................................................... 27
Figure 3.6 Space ship Question ........................................................................................ 28
Figure 4.1 Graph of Accelerating Question Pre-Instruction Results ................................ 32
Figure 4.2 Graph of Non-accelerating Pre-Instruction Results ........................................ 34
Figure 4.3 Graph of Airplane Question Pre-Instruction Results....................................... 35
Figure 4.4 Graph of Accelerating Question Post-Instruction Results............................... 36
Figure 4.5 Graph of Non-accelerating Question Post-Instruction Results ....................... 37
Figure 4.6 Graph of Airplane Question Post-Instruction Results ..................................... 38
v
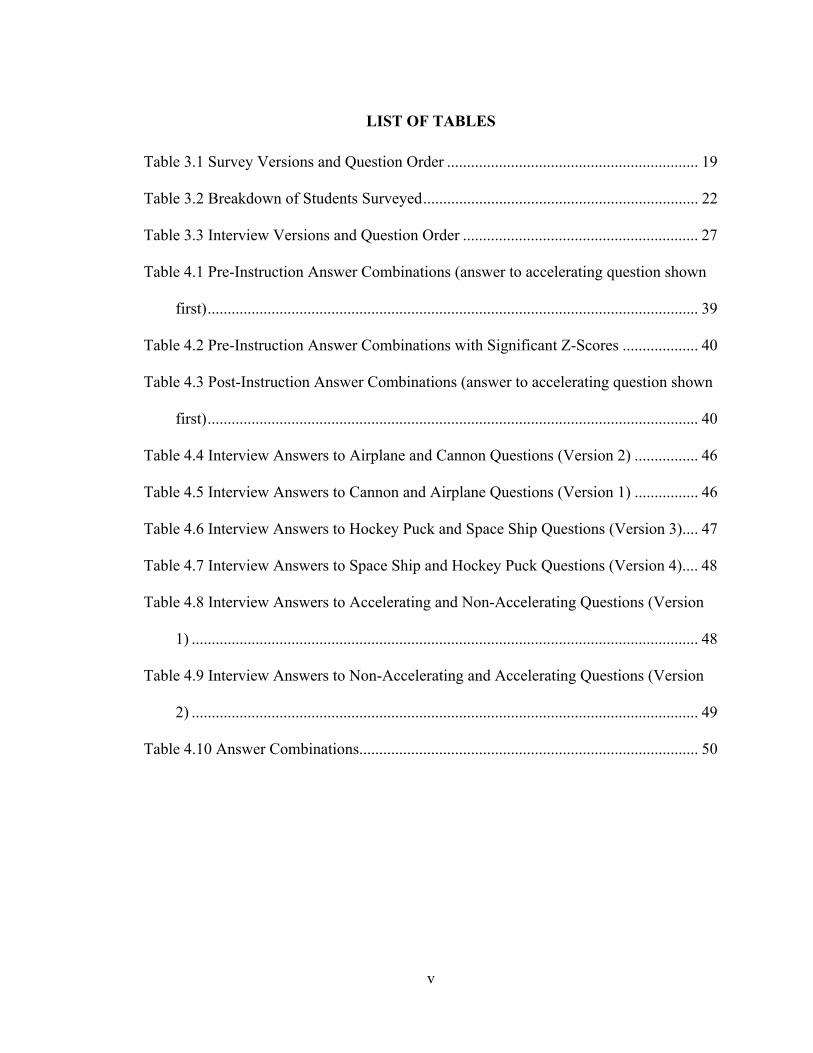
LIST OF TABLES
Table 3.1 Survey Versions and Question Order ............................................................... 19
Table 3.2 Breakdown of Students Surveyed..................................................................... 22
Table 3.3 Interview Versions and Question Order ........................................................... 27
Table 4.1 Pre-Instruction Answer Combinations (answer to accelerating question shown
first)........................................................................................................................... 39
Table 4.2 Pre-Instruction Answer Combinations with Significant Z-Scores ................... 40
Table 4.3 Post-Instruction Answer Combinations (answer to accelerating question shown
first)........................................................................................................................... 40
Table 4.4 Interview Answers to Airplane and Cannon Questions (Version 2) ................ 46
Table 4.5 Interview Answers to Cannon and Airplane Questions (Version 1) ................ 46
Table 4.6 Interview Answers to Hockey Puck and Space Ship Questions (Version 3).... 47
Table 4.7 Interview Answers to Space Ship and Hockey Puck Questions (Version 4).... 48
Table 4.8 Interview Answers to Accelerating and Non-Accelerating Questions (Version
1) ............................................................................................................................... 48
Table 4.9 Interview Answers to Non-Accelerating and Accelerating Questions (Version
2) ............................................................................................................................... 49
Table 4.10 Answer Combinations..................................................................................... 50

vi
ACKNOWLEDGMENTS
I would like to acknowledge and thank
• my advisor, Sanjay Rebello, for his infinite hours of help and patience
• Dean Zollman, who originally presented me with this challenge
• Past and current members of the Physics Education Research Group for the long
discussions, wisdom, and encouragement.
• A special thanks to my friends and family, both current and future. I could not
have survived this year without your support.
• The National Science Foundation for their funding of ROLE Grant #0087788 and
CAREER Grant #0133621

1
1. Introduction
1.1. Assessment Issues
For the past several decades physicists have been researching the way they teach
physics. Previous research has shown a gap between what is taught and what students
learn. (McDermott, 2001) Understanding what students know and how instructional
methods influence that knowledge requires well designed assessment tools. Because
researchers often want to study the understanding of large groups of students, surveys or
tests are the most efficient form of assessment. Researchers must be sure that their
assessment tools accurately measure student knowledge and understanding.
Accurate assessment is also important for instructors. If an instructor’s focus is
on helping students gain mastery of a subject, then accurate assessments are vital. After
all it is impossible to assess mastery of a subject when a test does not actually measure
understanding of the subject. As mastery, and not good grades, has become more
important, it is critical that course exams test actual subject understanding.
As long as instructors have been giving tests, students have been finding ways to
do better on the exams without studying more. While some test taking strategies are
considered cheating, most are legal methods that are even taught in high school and
college study skills classes. These strategies include looking for answers or hints to
difficult problems in other exam questions. Even though the purpose of these methods is
to improve student scores, there is no reason to believe that students stop using these
techniques on un-graded surveys. These strategies can therefore influence research
results. This fact is especially true on multiple-choice surveys if the answer options are
not based on prior misconception research (Redish, 2003).

2
Several test administration practices also jeopardize the accuracy of assessment
tools. To combat cheating in large, crowded classes, instructors often create multiple
versions of an exam. Research has not conclusively shown that this common practice
does not affect student scores. Some researchers have also begun to use this practice to
prevent students from copying each others’ answers on individual surveys. The effects, if
any, this practice has on research results needs to be understood. Researchers (e.g.
Churukian, 2002; Itza-Ortiz, Rebello, & Zollman, 2004) have also begun to take
previously designed assessment tools and edit, combine, or truncate them for new
research projects. Most of these research based assessment tools have been tested for
reliability and validity only in their complete, final form. It is unclear what effects
editing or changing these surveys will have on their effectiveness.
The purpose of this research is not to design a new assessment tool, but to provide
insights into the effects of changing question order -- a practice commonly used while
administering multiple versions of an assessment tool. By better understanding how
research results can be influenced by this practice it is hoped that better tools and better
administration practices will be developed. Improved tools will eventually lead to a
better understanding of students’ knowledge and ultimately better physics instruction.
1.2. Technology & Model-Based Conceptual Assessment
Assessment can fall into two categories – summative and formative. Summative
assessment occurs after a student is expected to know the material and just before
students move onto a new topic. Most assessment falls into this category. (Bransford,
Brown, & Cocking, 2000) Formative assessment occurs while a student is learning and
provides the student and the instructor with feedback on how a student’s understanding is

3
progressing. The National Research Council’s Committee on the Developments in the
Science of Learning recommends that instructors provide their students with more
formative assessment. (Bransford et al., 2000) Unfortunately traditional methods of
assessment are not practical for formative assessment and many instructors do not know
how to use the information gathered in formative assessments to alter their teaching.
Using recent advances in classroom technology and data analysis, Kansas State
University and The Ohio State University have been working collaboratively on an NSF-
funded Research on Learning and Education (ROLE) project titled “Technology and
Model-based Conceptual Assessment” to develop better forms of formative assessment
and ways of analyzing formative assessment results. (Zollman, 1999)
The ROLE project has created several short multiple choice surveys that
investigate students’ models of various physics concepts. The surveys investigate not
only what models a student uses, but in what context that model is applied. The surveys
can be administered to almost any size class using electronic response systems.
Electronic response systems, which are becoming very popular in many classrooms
(Judson & Sawada, 2002), allow students to submit answers to multiple-choice questions
using an infrared transmitter (similar to a TV remote-control). Once the survey has been
administered via the classroom response system, the instructor will be able to view a
report that displays information on the students’ mental models and the context those
models were applied in (Hrepic, 2004). Using this information the instructor can then
tailor his or her instruction to fit the current state of student understanding. Changes to
instruction may include moving on to a new topic, reviewing the current topic, or going
into more depth on a topic and addressing the misconceptions. (Zollman, 1999)

4
The ROLE project requires investigation of four major issues- 1) what models do
students use, 2) what defines a context, 3) how are good surveys created, and 4) how can
these data be displayed in real time to the instructor. The research presented in this thesis
addresses the issues of context and survey creation.
Past research has shown the importance of context. Redish (1999) points out that
“what people construct depends on the context- including their mental states.” He defines
this as the context principle. Being aware of the context in which a student displays his
or her knowledge is therefore important both in understanding that knowledge and in
changing and expanding that knowledge. Researchers have found that students and
experts do not agree on what constitutes a new context in a physics problem. What are
often irrelevant surface features to an expert can be extremely important to students (e.g.
Pellegrino, Chudowsky, & Glaser, 2001). Previous research has investigated the effects
of the context described in the question. This study investigates the effect of the context
as defined by the order of the question within the survey itself. The study also probes
students for their opinions on context changes by asking them to compare and contrast
sets of physics questions.
Closely linked to the idea of context is transfer which is the application of
knowledge from one context to another. Previous research has shown that all new
learning involves transfer of previous knowledge (Bransford et al., 2000). Previous
knowledge can either be a help or a hindrance to the understanding of the new material.
Two factors appear to influence the ease of transfer. The first factor in transfer is the
mastery of the concept in the original context. If a concept was never understood in the
original context, it cannot be transferred. The amount of transfer that occurs is based on

5
the similarities, as perceived by the student, between the cognitive elements in the two
contexts. It is much easier to transfer knowledge between two closely related contexts.
(Bransford et al., 2000) Because context is learner-defined, so is transfer. This idea is
consistent with the contemporary notions of transfer (Lobato, 2003). This study will
consider transfer as an explanation for the variations in responses that students give when
question order is changed and look for examples of transfer in student reasoning during
interviews.
1.3. Research Questions
The purpose of this study is to investigate how students’ responses are affected by
the practice of rearranging survey and exam questions and if the effects of this practice
can be described in terms of transfer of learning. This purpose leads to the main research
question addressed in this thesis:
• What is the effect of question order on student responses to multiple choice
questions?
Before this question could be studied, several terms needed to be defined.
Question order was defined by the location of the question on the survey and its
relationship to the other questions on the survey. This definition created three ordering
options, i.e. locations of a question on a survey: 1) first question on the survey, 2) second
question on the survey following a related question, and 3) second question on the survey
following an unrelated question.
Two different settings were studied – written in-class surveys and one-on-one
interviews. On the surveys, responses were defined as the choice students circle on their
paper and an effect was defined as a statistically significant difference in the frequency of

6
a response for different orders. During the interviews a response was defined as both the
answer and reasoning a student provides. In this setting two types of order effects were
considered. The first order effect was in the number of students choosing each option.
This is similar to the effect considered on the surveys. The second order effect was a
student asking to change an answer to a previous problem.
Asking this question leads to three related research questions.
• Does the order of questions affect student scores?
A student’s score is defined as the percentage of correct responses on a survey or
test. If the order effect on student responses is large enough, then it could possibly
influence student scores on the survey and the class average. For the class average score
to be affected by question order it would require that the order of the questions causes
students to move toward or away from the correct answer rather than moving among the
incorrect responses. An order effect on student scores is not only important in research
on students’ understanding, but also on any dichotomously scored instructional
assessment.
• Do students transfer knowledge created in one question to the next question?
• Can this transfer be detected during the interviews or can be interpreted based on
survey responses?
Some current research on transfer suggests something will always be transferred
(Lobato, 2003). Therefore, the relevant question is whether transfer can be observed. If
transfer is taking place and is responsible for changes in student responses, then this
challenges the old belief that student knowledge is relatively stable, and is not changed
during the process of its measurement. Instead, student knowledge should be considered

7
unstable and easily influenced. The idea that taking a survey can change the “state of a
student” whereby a student learns through taking the survey has already been suggested
by Redish (2003), though not studied. The research described in this thesis is an
important step toward studying these issues.
8
2. Literature Review
2.1. Question Order Effects
The consequences of question order are important to researchers and instructors
because of the effect they may have on student grades or standardized test scores when
multiple versions of an exam are used. The effects and consequences of changing the
order of test items has been the focus of much research since the 1950’s (Leary &
Dorans, 1985). Researchers have studied the effects of randomly ordering questions,
organizing questions from easiest to hardest or hardest to easiest, arranging questions by
topic, and listing questions in the order covered in class. Researchers have also
investigated the interaction of question order with student confidence, student ability,
item statistics, exam style, and question type. Traditionally, research has suggested that
students do better on an exam when the questions are organized from easiest to hardest
(Jordan, 1953; Leary & Dorans, 1985); though research does not consistently support this
conclusion.
At first glance, prior research into the effects of question order does not reach any
type of consensus. In some studies the order appeared to have an effect on student
responses while other studies showed no effects. The research is especially inconclusive
since the studies do not use the same types of statistical tests. On deeper examination, a
few trends do appear. The order of questions is most likely to have an effect on student
scores when the exam is given under speed conditions i.e. when students are expected to
finish the exam under a set amount of time, not necessarily sufficient to attempt all of the
questions. Under these conditions, students score higher on the exam when the questions
are organized from easiest to hardest than from hardest to easiest (Kleinke, 1980; Leary

9
& Dorans, 1985). The fact that the order of questions would have an effect under speed
conditions is not surprising; it is hypothesized that when the questions are ordered from
hardest to easiest, students simply do not have time to reach the easy questions at the end
of the exam and their scores reflect this fact. Order is not as likely to have an effect on
power exams (Leary & Dorans, 1985). These are exams that are given to students with
plenty of time to finish all questions. The surveys discussed in this thesis were given
under power conditions since all students were allowed to finish the survey.
Order is also more likely to have an impact on student scores when the exam
studied is an aptitude test as opposed to an achievement test (Leary & Dorans, 1985). An
aptitude test measures skills that have been developed over an extended period of time.
The range of topics covered by the test is very broad, and therefore it is usually
impractical for students to study for aptitude tests. Achievement tests measure
understanding or mastery of a specific topic. Since the content of the test is well defined,
students usually study for an achievement test. When a student has studied for the exam,
it is assumed that all of the material is equally familiar and stored in more recent memory
where it is easily accessible. Material not recently studied is less easily accessible from
the memory and therefore more susceptible to memory cueing effects. The surveys
discussed in this thesis most closely resemble aptitude tests since students had not studied
for the survey.
A common statistic used to study the effect of question location or order is the
item difficulty. Item difficulty, or p-value, is the percentage of students who correctly
answered a question. As per this definition a question with a high item difficulty or p-
value was answered correctly by most students and is therefore an easy question. A hard

10
question would have a low p-value. A few studies show that the order of questions can
have an effect on item difficulty. Mollenkopf’s (1950) study involved both verbal and
mathematics aptitude tests. Questions from the first third of each test were switched with
the questions in the last third; to create two versions of each test. These two versions
were then given under speed and power conditions. Under power conditions, a verbal
question had a higher p-value (i.e. an easier question) when it was asked in the first third
of the test than when it was asked in the last third. Under speed conditions, verbal
questions had a higher p-value when they appeared later in the test. In other words, in the
speeded verbal aptitude test, the later a question was asked, the easier it appeared to the
students. At first glance this result may appear surprising, but Mollenkopf’s exams were
given under extreme speed conditions; according to his data less than twenty percent of
the students reached the last third of the questions for any of the speeded tests. Thus only
the fastest, and “most able”, students ever reached the last third of the questions. When
only the fastest and “most able” students are tested, it is expected that the ratio of
students who got the question correct to the number that attempted the problem is greater
than when all students are allowed to attempt a problem. The mathematics tests showed
no effects on item difficulty due to the placement of questions for either power or speed
conditions. Based on correlations between the number of mathematics problems
answered and the number correct, Mollenkopf suggests that this lack of dependence of
item difficulty on question placement is because there is no strong correlation between
mathematical ability and speed. There does appear to be a strong correlation between
verbal ability and speed, however.

11
Numerous studies on question order effects have been done for achievement tests
on various subjects. These tests are usually given under mostly power conditions. A
wide variety of statistical comparisons are used to investigate the effects of item order.
Hodson (1984) found that the item difficulty ranking of Chemistry questions was affected
by location of the question. When an easy question (high p-value) was at the beginning of
the exam, it became easier; when placed at the end of the exam it became harder. When
the most difficult questions (low p-value) were placed at the beginning of the exam, they
became slightly more difficult; when they were placed at the end of the exam, they
became slightly easier.
On the other hand, Monk and Stallings (1970) compared eleven geography
midterms and finals in which the questions had been organized into two sets of randomly
ordered items to prevent cheating. Only two of the eleven pairs showed a significant
change in average score between versions, and one of these two exams was questionably
graded. Fifty questions from these pairs of exams were studied for effects of the location
of the questions on their item difficulty. They found that the item difficulty varied very
little between the different versions of the exams. For 29 of the 50 pairs, the change in
item difficulty was less than five percent. The authors cautioned against applying their
results to large-scale testing situations though, since there were small effects due to
question order in most tests and questions. While the effects were not statistically
significant in their populations, in large-scale testing situations the small effects could
influence the scores for a large number of students.
Huck and Bowers (1972) studied the effect of a question’s item difficulty on the
item difficulty of the following question in a general psychology course. Two similar

12
experiments found no sequence effects. The authors felt that these results did not
disprove previous claims of a sequence effect on item difficulty, but that the results did
cast serious doubt on those claims. As this sample of studies on achievement tests
suggests there is no clear consensus on the effects of question order for this type of test.
2.2. Question Location Effects
In addition to research on the effect of altering the order of all of the questions on
an exam, researchers have also studied the effect of changing the location of one or a few
of the questions. Several researchers (e.g. Eignor & Cook, 1983; Kingston & Dorans,
1984) have claimed that the location of a question or location of a subset of questions
within a larger test can lead to “within-test practice” effects. “Within-test practice” can
result when students answer an un-scored section of the test before answering the scored
section. This format is common in national standardized tests (e.g. SAT and GRE) where
the un-scored questions are used to develop future tests. When a student’s score is
improved by answering the scored section after the un-scored section, the effect is called
a practice effect. It is hypothesized that in this situation the students became familiar or
comfortable with the question format or gained information from previous questions, and
their scores consequently improved. When a student’s score decreases by answering the
scored section after the un-scored section, the effect is called a fatigue effect. It is
hypothesized that in these situations the student became tired or bored after answering so
many questions, and their score consequently decreased. “Within-test” practice effects
are measured by comparing the scores of students who answered the scored section first
to those who answered the un-scored section first. Kingston and Doran’s (1984) study of
the GRE general test showed that analysis of explanations, logical diagrams, and reading

13
comprehension questions all showed “within-test practice” effects. Both the analysis of
explanations and the logical diagrams items showed significant practice effects. The
reading comprehension items showed slightly less significant fatigue effects. Kingston
and Doran hypothesized that the analysis of explanation and logical diagram questions
were easier after completing the un-scored section because they are both uncommon
question styles and the un-scored section allowed students to become more familiar with
the directions and question style before answering the scored questions. On the other
hand, reading comprehension questions require a lot of reading and attention to detail
which may tire some students before they have finished both sections. Eignor and Cook
(1983) performed a similar study using the SAT test. This study found evidence of a
fatigue effect on reading comprehension questions, which made later reading
comprehension questions harder. Within test practice effects are a focus of this thesis
while fatigue effects are unlikely but possible.
2.3. Transfer of Learning
Traditionally transfer has been defined as applying the knowledge gained in one
context to the next context. (Bransford et al., 2000) Transfer has then been studied by
giving students a learning task followed by an application task (e.g. Bransford et al.,
2000).The application tasks were graded to provide data on how well students transferred
knowledge. These studies showed transfer to be fairly rare. A new perspective on
transfer (Lobato, 1996), referred to as actor-oriented transfer, defines transfer as any
previous knowledge a student applies to a given situation. Using this perspective,
transfer is studied by asking students to work through a learning experience and an
application experience and observing any information that a student applies from the

14
learning experience to the application experience. A key to this analysis is understanding
what relations of similarity between two contexts are constructed by the student (Lobato,
2003). As per this new perspective the knowledge that transfers is defined by the learner
and not by the researcher. The data in this thesis were analyzed using this new
perspective on transfer.
2.4. Implications for the Current Study
Prior research on question order has focused on the effects to student scores.
These studies have scored questions dichotomously; only two options were recorded –
correct and incorrect. The study discussed in this thesis considers all five responses
students could give, since the focus is not on the effects to student scores but the effects
in student reasoning. Because this study included a two-question survey, average student
score is not a particularly insightful measurement since there are only three possible
scores – 100%, 50%, 0%. Instead a statistic similar to item difficulty will be used.
The survey administered in this study does not fall neatly into any of the test types
described in the previous section. The survey was given under mostly power conditions,
since no time limits were set. However, as in most in-class situations, students may have
felt pressure from other students to finish the survey (and start the laboratory activity for
the day), adding an element of speed to the survey. Students were not informed of the
survey beforehand and were therefore unable to study for it - suggesting the survey
qualifies as an aptitude test. This attribute is further justified by the fact that the
questions on the survey were slightly different than those asked in the other course
assessments (e.g. homework and exams), since the survey was focused on conceptual
understanding and other course assessments focused on problem solving. However, the
15
post-instruction survey was given less than a week after the class exam covering similar
material. Therefore, it can be assumed that most students studied for this exam and that
the material was still somewhat fresh in their memories. This aspect gives the survey
some qualities of an achievement test. Despite the post-instruction survey’s achievement
test qualities, the study is most closely aligned to the previous studies on aptitude tests.
Since the questions on the survey were conceptual and not problem solving questions, the
survey was more similar a verbal test than a quantitative test. As with many verbal
questions, the physics questions were such that most students would either know or not
know the answer after thinking for a little while about the questions. Quantitative
questions typically contain a second step to solving them – performing the necessary
calculations – that allows for the possibility of error. Since the survey most closely aligns
with verbal aptitude tests, based on prior studies a question order effect is likely.
For all of the aforementioned reasons, existing literature does little to predict the
effect of question order on student responses to multiple-choice conceptual surveys
typically used in physics. Previous research also ignores the content of previous
questions when investigating the effects of question order. Research described in this
thesis addresses these deficiencies in our existing knowledge of question order effects on
conceptual assessments in physics.

16
3. Methodology
3.1. Overview
This study used both written surveys and interviews to investigate whether or not
the order of multiple choice questions influenced the answer to these questions and to
explain the order effect, if any occurred. The survey used three questions taken from the
Force Concept Inventory (FCI) (Hestenes, Wells, & Swackhamer, 1992). The FCI was
chosen because it is one of the most widely used instruments to study introductory
physics. The questions were organized into a pair of mutually related questions and two
pairs of unrelated questions. Four versions of the survey were designed. The first two
versions studied the effect of the mutually related pair by reversing the order of questions
between the two versions. The third and fourth versions investigated the effect of the
unrelated pairs of questions.
The survey was administered to students in introductory physics classes at Kansas
State University. Over a three-semester period (spring 2002 – spring 2003) 918 students
enrolled in algebra-based and conceptual physics classes took the survey. About half of
the students took the survey twice, once before instruction and again after instruction.
The rest of the students only took the survey before instruction. Post instruction surveys
were not administered during the third semester due to time constraints and discrepancies
in the depth of material covered.
After analyzing the survey data from the first semester of the study, it became
apparent that the surveys alone would not answer the research questions. While the
survey data would help determine if and how the order of questions influenced student
responses, interviews would be needed to answer why the order mattered. Interviews

17
also allowed us to glean insight into student reasoning as they worked through the
questions.
In the interviews students first answered a pair of Force Concept Inventory
questions. They were then asked to compare the two questions, including how the first
question affected their response to the second question and how the two questions were
related. They repeated the process for a second pair of FCI questions. Seventeen post
instruction and fifteen pre-instruction interviews were completed for the study. The
volunteers were drawn from the pool of survey participants. No effort was made to make
the interview sample representative of the survey sample.
3.2. Survey Methodology
3.2.1. Survey Questions
The surveys used three questions from the FCI (Hestenes et al., 1992). The
survey did not use the original distracters (incorrect choices) for these questions. Instead
we used new distracters developed in an earlier study using student answers to open-
ended versions of the questions. (Rebello & Zollman, 2004)
The first question used in the survey, question # 13 (see Figure 3.1) on the
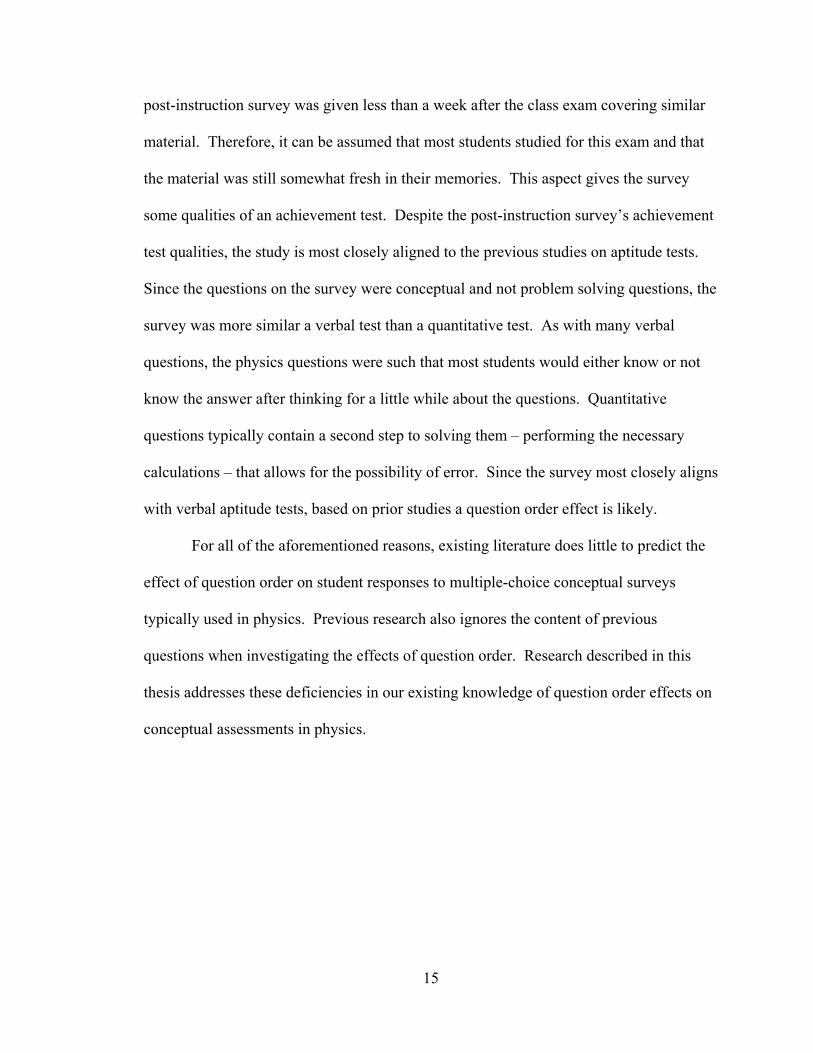
original FCI, will be referred to as the “accelerating” (accel.) question. The second
question, question #14 (see Figure 3.2) on the original FCI and will be referred to as the
“non-accelerating” (nonaccel.) question. These two questions served as the mutually
related pair of questions for the survey, since both involve Newton’s third law. On the
FCI these questions occur consecutively and refer to the same figure. The decision to use
the accelerating and non-accelerating questions as the mutually related pair of questions
was in part based on a personal communication with David Hestenes regarding the paper
18
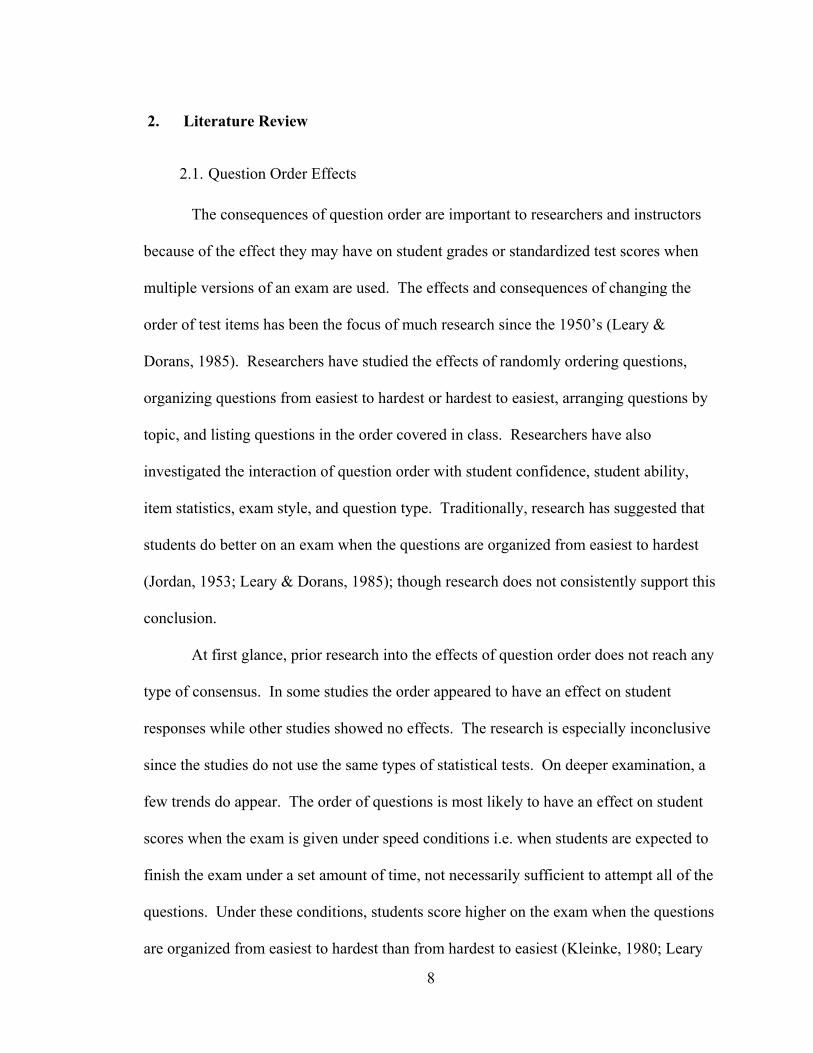
describing new distracters for FCI questions. (Rebello & Zollman, 2004) Hestenes had
found that student responses to one question were significantly influenced by the other
question (Hestenes, 2001). This research was in part an attempt to study this effect.
While the car, still pushing the truck, is speeding up to get up to cruising speed: (A) The force with which the car pushes on the truck is equal to that which the truck pushes back
on the car. (B) The force with which the car pushes on the truck is smaller than that which the truck pushes
back on the car. (C) The force with which the car pushes on the truck is greater than that which the truck pushes
back on the car. (D) The car’s engine is running so the car pushes against the truck, but the truck’s engine is not
running, so the truck does not push against the car. (E) Neither the car nor the truck exerts any force on each other.
A large truck breaks down out on the road and receives a push back into town by a small compact car as shown in the figure below.
Figure 3.1 Accelerating Question: Question #13 on the FCI
After the car reaches a constant cruising speed at which the driver wishes to push the truck: (A) The force with which the car pushes on the truck is equal to that which the truck pushes
back on the car. (B) The force with which the car pushes on the truck is smaller than that which the truck pushes
back on the car. (C) The force with which the car pushes on the truck is greater than that which the truck pushes
back on the car. (D) The car’s engine is running so the car pushes against the truck, but the truck’s engine is not
running, so the truck does not push against the car. (E) Neither the car nor the truck exerts any force on each other.
A large truck breaks down out on the road and receives a push back into town by a small compact car as shown in the figure below.
Figure 3.2 Non-accelerating Question: Question #14 on the FCI

19
To examine the effect of a question on student responses to an unrelated question
we used a projectile motion problem as the unrelated question. We felt this would be
considered an unrelated question since it covered a different topic, projectile motion, than
the previous two force questions. Question 23 (see Figure 3.3) from the original FCI will
be referred to as the airplane question.
A bowling ball accidentally falls out of the cargo bay of an airliner as it flies along in a horizontal direction. As observed by a person standing on the ground and viewing the plane as in the figure below, which path would the bowling ball most closely follow after leaving the airplane?
Figure 3.3 Airplane Question: Question #23 of the FCI
The survey used in this study contained only two questions so that factors, such as
fatigue and the effect of surrounding questions, could be eliminated or minimized. Using
the three questions described above, four versions of the survey were created (see Table
3.1). Version 1 and 2 of the survey were intended to study the effects of mutually related
questions on student answers. Version 3 and version 4 were used to study the effect of an
unrelated question on student answers.
Version 1st Question
2nd Question
1 Accel. Non-accel. 2 Non-accel. Accel. 3 Airplane Accel. 4 Airplane Non-Accel.
Table 3.1 Survey Versions and Question Order
20
3.2.2. Survey Administration
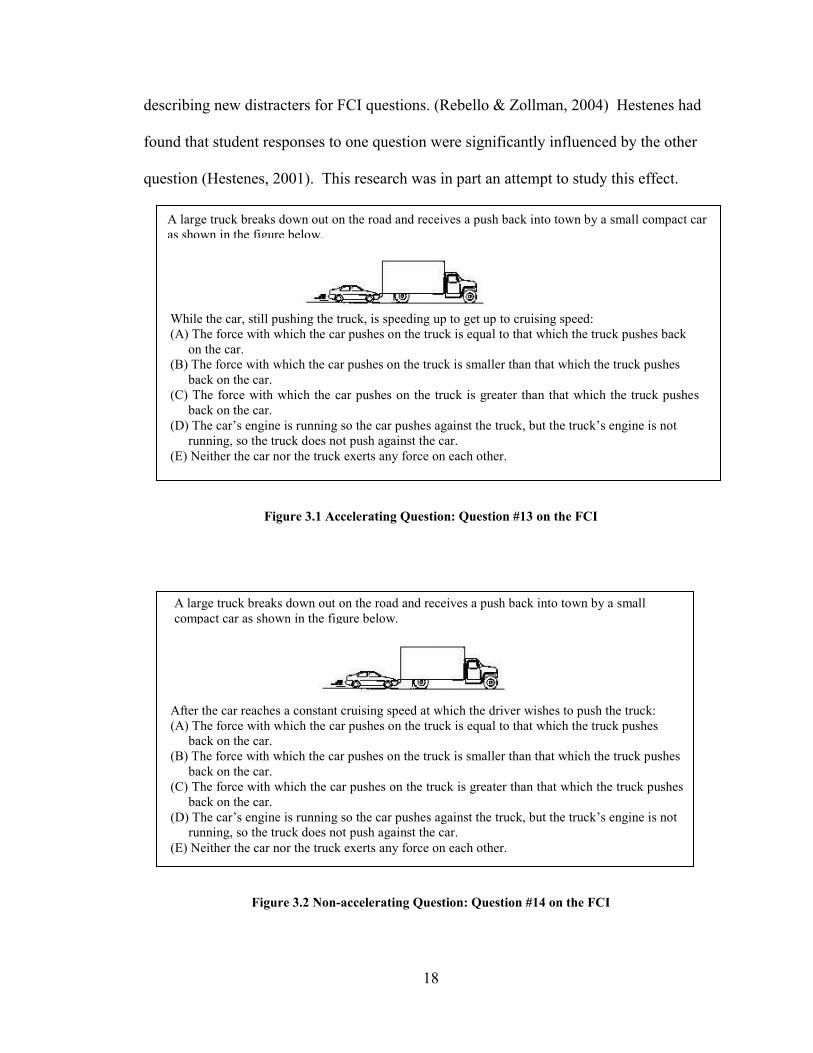
The survey was administered twice in each of the first two semesters (spring and
fall 2002) of the study as a pre-instruction survey at the beginning of the first laboratory
class. Students had been attending lecture for over a week but had not yet discussed
projectile motion or forces in class. During the laboratory, the survey was presented to
the students as a series of questions which addressed physics in everyday situations.
Students were told that the survey would not be graded and that their responses would not
be shown to their instructors. After the second exam of the semester, which covered
forces, the survey was administered again as a post-instruction survey. Projectile motion
had been covered previously in the class. Every student in each of the laboratory sections
received the same version of the survey. Since there were eight sections of laboratory for
each course, each of the four versions was administered in two laboratory sections. Only
pre-instruction data were gathered during the third semester of the study due to time
constraints and the discrepancies in the depth of the material covered in the two courses
surveyed and student populations. Combining post-instruction data from the Physical
World-I (conceptually-based) course with data from the General Physics-I (algebra-
based) course could possibly lead to effects that were not due to question order but rather
due to differences in content knowledge or other confounding variables. On the other
hand, students in the Physical World and those in General Physics begin the semester
with very similar backgrounds. For this reason pre-instruction data from both courses
were combined
Since the purpose of this study was to investigate the effect the order of the
questions had on students’ answers, it was very important that the students answered the

21
questions in the order intended for that version. For this reason a special protocol was
used to administer the surveys. Each question was printed on a different sheet, and
colored paper was used to distinguish between the first and second question. After
verbally providing the aforementioned general directions to the students, the survey
proctor and the laboratory TA passed the first question of the survey out to the students.
Students had been asked to circle their answers and turn the sheet of paper over once they
were finished with a question. The TA and proctor collected each student’s first question
as he or she completed it and handed them the second question. After a student
completed the second question, it was collected as well. This protocol prevented students
from answering questions out of order or changing their answer to the first question after
seeing the second question. This method took approximately 15 minutes from the time
the proctor began describing the survey to the time the last student completed the second
question.
3.2.3. Survey Demographics
Students from two different types of physics classes were involved in this study.
General Physics I (GPI) is the algebra-based physics class at Kansas State University (K-
State), which is part of a two semester series covering classical physics. GPI focuses
mostly on mechanics and uses Giancoli’s Physics textbook (Giancoli, 1997). This class
is taken mainly by life science, agriculture, and secondary education majors. The
Physical World-I (P-World) is a conceptually based physics class taught at K-State. In
one semester the course introduces students to most topics in classical physics. The text
for this class is Hewitt’s Conceptual Physics (Hewitt, 2002). Most of the students in this
class are business, social science, or humanities majors. P-World students were only

22
given the pre-instruction survey because the lack of depth in their coverage of mechanics
would have made their results incomparable to GPI student’s results.
The survey was distributed to 918 students enrolled in two types of introductory
physics classes at Kansas State University over three semesters. The breakdown of
students per class is shown in Table 3.2.
Course Semester # of students Surveys Received General Phys. I Spring 2002 243 Pre/Post General Phys. I Fall 2002 197 Pre/Post General Phys. I Spring 2003 260 Pre
Physical World I Spring 2003 218 Pre Total 918
Table 3.2 Breakdown of Students Surveyed
Forty-seven percent of the students were female. Thirty percent of the students had no
prior physics background. Having a physics background was defined as completing a
physics class in high school or college with a final grade of C or better. Descriptive
Astronomy (another class taught at K-State) was not counted as a physics class. Since the
survey was short, a large number of students were surveyed in order to increase the
statistical power of the analysis tools used. Surveying students over a one and a half year
period allowed any effects from uncontrolled variables, such as instructor differences, to
be averaged out in the analysis.
During the first semester students were asked to fill out a demographics form (see
Appendix A) before beginning the pre-instruction survey. Claude Steele proposes that a
stereotype threat exists “when one is in a situation or doing something for which a
negative stereotype about one’s group applies. The predicament threatens one with being
negatively stereotyped, with being judged or treated stereotypically, or with the prospect
of conforming to the stereotype” (Steele, 1997). Steele found that the stereotype threat
23
could be invoked by asking students to record their race before taking an exam. This
threat tended to lower their scores on the exam. In light of this research, in subsequent
semesters we decided to ask students to fill out the demographics form after completing
the survey. Thus, in the following semester students completed the form after finishing
the post-instruction survey, and the final semester students completed the form after the
pre-instruction survey was collected. This administration protocol was followed even
though race was not a question on the demographics form and the data collected were not
compared based on gender. After comparing the first two semesters of survey data, we
decided that the stereotype threat did not play a significant role in the study and data
collected in all semesters were combined.
3.2.4. Analysis of Survey Data
The survey data were analyzed using a z-test of proportions. The following
formula for the “un-pooled” z-score of proportions of was used to calculate z-scores
(Yang, 2004).
2
22
1
11
21
)1()1()(
npp
npp
ppz−
+−
−=
The variables p1 and p2 are used to represent the percentages of students that chose the
answer or answer combination under consideration. The variables n1 and n2 represent the
number of students taking that particular version of the survey. A z-score was considered
significant if it was equal or greater than 1.96, which corresponds to a “p” of less than
0.05. This means that for all results labeled statistically significant, there is less than a
5% chance that the results quoted occurred because of random chance.

24
The survey results were analyzed by comparing the percentage of students that
chose each possible answer for each version. Answer combinations were formed by
computing the percentage of students that gave a particular response to the accelerating
question and a particular response to the non-accelerating question. For instance the
percentage of students that selected choice C for the accelerating question (see Figure
3.1) and then choice A for the non-accelerating question (see Figure 3.2) on version 1
was compared the percentage of students who chose choice A for the non-accelerating
question and then choice C for the accelerating question on version 2. This situation
would correspond to the answer combination CA, since the answer to the accelerating
question will always be listed first even though students taking version two answered the
questions in the opposite order. Student scores were also calculated. The percentage of
students selecting answer combination AA corresponds to the percentage of students
scoring a 100% on the survey. The answer combinations CA or AC correspond to a
score of 50%. Any other answer combination corresponds to a score of 0% on the
survey.
3.3. Interview Methodology
3.3.1. Interview Participants
Thirty-two students were interviewed over two semesters to understand how the
order of questions affected student answers and how students perceived the questions to
be similar or different. No attempt was made to ensure that these students were a
representative sample of the entire class.
Seventeen GPI students were interviewed in the spring of 2003, more than a
month after they completed the post-instruction survey. The students were asked to

25
volunteer for the interviews after completing the post-instruction survey in laboratory.
Each student was asked to answer the same survey version as they took in laboratory.
These students’ survey responses were included in the survey data.
In the fall of 2003, 15 GPI students were interviewed in pre-instruction
interviews. These students were asked to volunteer for the interview during a lecture
class. They were interviewed the same week the pre-instruction surveys were distributed
in their laboratory classes. If their interview took place after their first laboratory class,
the students were removed from laboratory during the survey. If a student was
interviewed before his or her laboratory class, she/he was allowed to take the survey, but
their pre-instruction and post-instruction survey data was not used in the survey analysis.
3.3.2. Interview Administration
All interviews were audio taped for future reference. The interviewer also took
notes during the interview which were used in combination with the tapes in the analysis
process. A typical interview lasted about 20 minutes, though some ran as long as 30
minutes or as short as 15 minutes. During the first several interviews another researcher
observed the interviews to provide feedback on interview protocol and technique.
All students participating in interviews were asked to sign consent forms. The
consent form (see Appendix B) included pages from the Institutional Review Board
(IRB) for research on human subjects and an addendum form specific to this research
study. Some students signed this form during their laboratory class while they were
waiting for their fellow classmates to finish taking the pre-instruction survey. These
students were asked if they had any questions before signing the form. Once they came
to the interview, the interviewer again reviewed the consent issue with them and asked if

26
they had any more questions. Most students signed this form at the beginning of the
interview and were asked to read the form first and ask any questions before signing.
The interviewer also verbally explained the issues covered in the form. All interviewees
were paid $10 for their participation.
3.3.3. Interview Protocol
The interviewer followed a predetermined protocol and did not digress to probe
student comments. However the interviewer deviated from the protocol for the following
reasons: to ask a student to clarify an unclear response, to remind a student to describe
their reasoning for an answer, and to allow a student to return to a preceding question to
change his/her answer.
The first two students interviewed during the post-instruction interviews were
only asked about the pair of questions they answered on the survey. After this interview
it became apparent there was sufficient time to ask about a second pair of questions.
Therefore three new questions from the FCI were added to the pool of interview
questions. The first new question was FCI question # 12 (see Figure 3.4) and will be
referred to as the cannon question. This question was grouped with the airplane question
on the survey to form a mutually related pair, since both discuss the path of a projectile.
Question #8 (see Figure 3.5) and question #21 (see Figure 3.6) were also grouped to form
a mutually related pair, since both discuss the path of an object after a force has been
exerted. These questions will be referred to as the hockey puck question and the
spaceship question respectively. The students were asked two pairs of questions based on
the version they were assigned (see Table 3.3). The same pairs of questions were used
for the pre-instruction interviews as well.
27
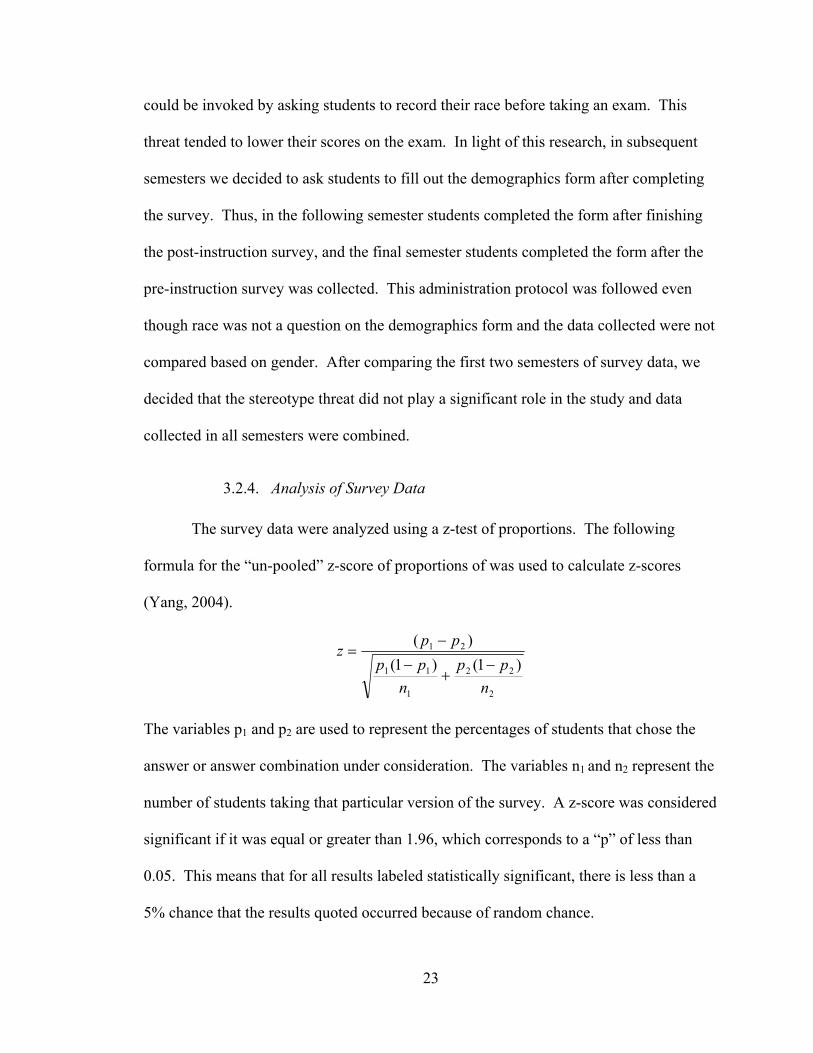
1st Pair 2nd Pair Version 1st Question 2nd Question 3rd Question 4th Question
1 Accel. Non-accel. Cannon Airplane 2 Non-accel. Accel. Airplane Cannon 3 Airplane Accel. Hockey puck Space ship 4 Airplane Accel. Space ship Hockey puck
Table 3.3 Interview Versions and Question Order
Figure 3.4 Cannon Question
The figure depicts a hockey puck sliding with constant speed v0 in a straight line from point P to point Q on a frictionless horizontal surface. Forces exerted by air are negligible. You are looking down on the puck. When the puck reaches point Q, it receives a swift horizontal kick in the direction of the heavy print arrow.
Which of the paths 1-5 would the puck most closely follow after receiving the kick?
Figure 3.5 Hockey puck Question
A ball is fired by a cannon from the top of a cliff as shown below. Which of the paths 1-5 would the cannon ball most closely follow?
28
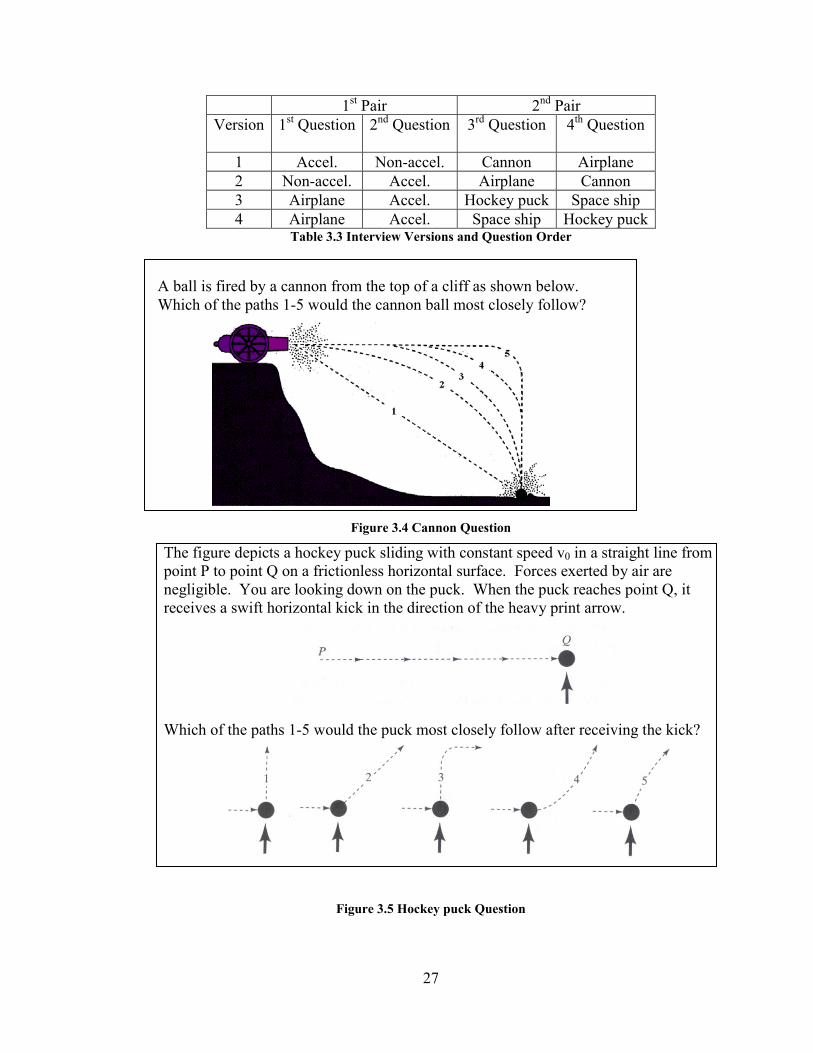
A spaceship drifts sideways in outer space from point P to point Q as shown below. The spaceship is subject to no outside forces. Starting at position Q, the spaceship’s engine is turned on and produces a constant thrust (force on the spaceship) at right angles to the line PQ. The constant thrust is maintained until the spaceship reaches point R in outer space.
Which of the paths 1-5 below best represents the path of the spaceship between points Q and R?
Figure 3.6 Space ship Question
Students were shown the first question on a sheet of paper and asked to walk the
interviewer through how they would answer the question. Then the first question was
removed from the student’s view and she/he was asked to repeat the process for a second
question. After answering both questions, the student was asked if she/he saw the two
questions as being similar or different and why. The interviewer repeated this process
with the second pair of questions. At the end of the pre-instruction interviews, the
interviewer asked the student to compare and contrast all four problems. The protocols
for Spring 2002 and Fall 2002 are shown in Appendices C and D respectively. Following
the post-instruction interviews, the protocol was reworded to clarify the questions.
The fall 2002 protocol included an addition to the airplane question. This
addition was included to investigate student difficulties with the question that became
apparent in the post-instruction interviews and in the literature. If students did not state
the perspective from which they were answering the question or if it was clear they were

29
not answering the question from the perspective of a stationary observer on the ground,
the student was verbally asked to answer the question from this perspective.
3.3.4. Analysis of Interview Data
Since only three to six students participated in each version of the interview, the
effect of the order of questions on students’ answers could not be studied using statistical
tests. Instead, a question was determined to have influenced a student’s answer to a
previous question when the student asked to return to the previous question. Usually
students asked to return to a question because they wanted to change their answer. This
meant the interview allowed us to study something slightly different than the survey – the
effect of a subsequent question on student answers to a previous question. The surveys
allowed us to study the effect of a previous question on student responses to a subsequent
question. Data about student answers to the questions in the interview were analyzed by
comparing the number of students that gave each answer and the order of questions
which resulted in students changing their answers.
After answering each pair of questions, students were asked to point out
similarities and differences between the two problems. At the end of the interview they
were also asked to comment on any similarities or differences between all four of the
questions they had answered. Based on our experience with the post-instruction
interview in fall 2002, before the pre-instruction interviews in spring 2003, a change was
made to the interview protocol so that students were asked to point out any similarities
they saw and then in a separate question to point out any differences between the two
questions.

30
Student comments were divided into pre- and post-instruction comparisons and
separated based on which questions the students were comparing. For each question pair,
the comments were categorized based on the content of the comment. For each question
pair, the categories were then grouped based on the emergent themes. The different
themes were then compared. Comments were also compared on the basis of whether
they focused on the physics concept underlying the question (e.g. the use of Newton’s
third law in the problem) or a surface feature of the question (e.g. the difference in the
velocity of the two objects discussed in the two problems). All of these interview
analysis techniques enabled us to glean useful insights into the reasons underlying the
question order effects that we had observed on the surveys.

31
4. Results & Discussion
4.1. Survey Results
4.1.1. Pre-Instruction Results
After collecting the surveys, the data from all 918 students over three semesters,
were combined and analyzed. All statistics calculated in the analysis process are shown
in Appendix E. The results for each question are shown in Figure 4.1, Figure 4.2, and
Figure 4.3. These graphs show the frequency of each response based on the order the
question was asked.
Accelerating Question
For the accelerating question (see Figure 4.1) the most common response for all
versions was answer C (the car exerted a greater force than the truck). The percentage of
correct responses ranged from 27% to 35% depending upon the version. Another
interesting result is the lack of students selecting choice E (there are no forces present)
for the accelerating question. This result indicates that students are aware of the fact that
there is at least some force present in an accelerating situation. The effects of the
placement of this question were apparent in the frequency of choice D (that the car exerts
a force on the truck while the truck exerts no force). When the acceleration question was
asked first or after the airplane question, 3% and 2%, of students respectively selected
answer D. These percentages can then be compared to the situation in which the
accelerating question was asked after the non-accelerating question. When asked after
the non-accelerating question, none of the students responded with choice D. The z-
scores show that this discrepancy is statistically significant both when the frequency of

32
response D is compared for students answering the accelerating question first versus
those answering it second (z= 2.88) and those answering the accelerating question after
the airplane question versus those answering it after the non-accelerating question
(z=2.48).
Figure 4.1 Graph of Accelerating Question Pre-Instruction Results
Non-Accelerating Question
A larger percentage of students answered the non-accelerating question (53% vs.
41%) correctly than they did the accelerating question. The results for the non-
accelerating question are shown in Figure 4.2. Unlike the accelerating question, the most
common answer to the non-accelerating question depended on the version of the survey.
When the non-accelerating question was asked first (version 2) an almost equal number
of students selected choice A (the forces are equal) and choice C (the car exerts the
greater force). When the accelerating question was asked after the airplane question
(version 3), a slightly larger group of students selected answer C (the car exerts the
greater force) over choice A (the forces are equal), yet this was not a statistically
0% 10% 20% 30% 40% 50% 60% 70% 80% 90%
100%
A B C D E
Asked 1st (v1)
Asked 2nd (v2)
After control (v3)

33
significant difference. On the other hand, when the non-accelerating question was asked
after the accelerating question (version 1) a much larger percentage of students selected
the correct response, choice A (53%), to the non-accelerating question compared to those
who chose the next most common response, choice C (33%). This difference in the
frequency of choice A and choice C for the non-accelerating question is statistically
significant (z = 4.56). This result suggests that students are more likely to perform better
on the non-accelerating question when it is asked after the accelerating question.
Analysis of the data showed that students were statistically less likely to choose
answer C (the car exerts the greater force) when the non-accelerating question was asked
after the accelerating question (version 1) than when it was the first question involving
Newton’s third law, as in version 2 (z = 2.66) and version 4 (z = 3.08). Asking the non-
accelerating question after the accelerating question (version 1) also increased the
number of students choosing answer E (there are no forces present). The z-scores proved
this increase to be significant when compared to version 1 (z = 2.70) and version 4 (z =
3.07). These results suggest that students are less likely to believe that forces are present
between two objects in a non-accelerating question after they have considered a similar
situation in which acceleration is present.
In two instances, asking the non-accelerating question after the airplane question
produced a statistically significant difference in the frequency of specific responses when
compared to situations in which the non-accelerating question was asked after the
accelerating question. While a similar difference in frequency appeared for situations in
which the accelerating question was asked first, the difference was not statistically
significant according to the z-test performed. Students were more likely to select answer

34
A, (the forces are equal), when they were asked the non-accelerating question after the
accelerating question than when they were asked the non-accelerating question after the
airplane question (z = 2.59). Students were less likely to select answer B (the truck exerts
the greater force) when they were asked the non-accelerating question after the
accelerating question than when they answered the accelerating question after answering
the airplane question (z = 2.01).
Figure 4.2 Graph of Non-accelerating Pre-Instruction Results
Airplane Question
The airplane question was asked twice -- in version three and version four of the
survey. In both situations the question was the first question on the survey and students
had no knowledge of what the second question would be. Because of this design, the
versions should have produced similar results. Figure 4.3 shows that there were minor
differences between student responses to the question in the two versions, however these
differences were not statistically significant. It is also interesting to note that the five
0% 10% 20% 30% 40% 50% 60% 70% 80% 90%
100%
A B C D E
Asked 1st (v2)
Asked 2nd (v1)
After control (v4)

35
possible choices for the airplane question were almost equally popular. There is no clear
preference for any particular choice.
0%
20%
40%
60%
80%
100%
1 2 3 4 5
Version 3 Version 4
Figure 4.3 Graph of Airplane Question Pre-Instruction Results
4.1.2. Post-Instruction Results
The results from the post-instruction surveys are shown in Figure 4.4, Figure 4.5,
and Figure 4.6. The data from all 412 students who answered the post-instruction survey
were combined and then analyzed using a z-test of proportions. All statistics calculated
in the analysis are shown in Appendix E.
Accelerating Question
Student performance improved on the accelerating question after instruction (see
Figure 4.4). When the accelerating question was the first Newton’s third law question
asked (versions 1 and 3), the correct answer (choice A) was the most common response.
Unfortunately, when the accelerating question was asked after the non-accelerating
question (version 2), choice C (the car exerts the greater force), was still the most

36
common response. The z-test results showed a statistically significant difference (z =
2.24 and z = 2.23) in the percentage of students choosing the correct answer, A, when the
accelerating question was the first Newton’s third law question (versions 1 and 3)
compared to the situation when the accelerating question was asked after the non-
accelerating question (version 2). This difference also resulted in students receiving
higher scores on the entire survey when they responded to version 1 (accelerating
question first) than version 2 (non-accelerating question first). Forty-three percent of
students answering version 1 received a score of 100% on the post-instruction survey,
while only 30% of students received a score of 100% on version 2. This difference
between the percentage of students who scored 100% on version 1 and version 2 is
statistically significant (z= 1.96), albeit barely.
0%
10%
20%
30%
40%
50%
60%
70%
80%
90%
100%
A B C D E
Asked 1st(v1)
Asked 2nd(v2)
Aftercontrol (v3)
Figure 4.4 Graph of Accelerating Question Post-Instruction Results
The analysis also showed that students were more likely to choose choice B (the
truck exerts the greater force) when they answered the accelerating question after the
non-accelerating question (version 2) as compared to those students who answered the

37
accelerating question after the airplane question (version 3) (z = 2.16). While students
were less likely to select choice B when the accelerating question was asked first (version
1), as compared to when it was asked after the non-accelerating question (version 2), the
difference was not statistically different. The number of students choosing answer D (the
car exerts the only force) decreased to zero after instruction.. As in the pre-instruction
survey, no student chose answer E, (there are no forces present), for the accelerating
question. These results suggest that after instruction students appear to know that there
must be two forces present in an accelerating scenario.
Non-Accelerating Question Students showed clear improvement with respect to their
pre-instruction performance on the non-accelerating question (see Figure 4.5). The
frequency of the correct response (choice A -- the forces are equal) rose to a value
ranging from 73% to 80%, depending upon the version. The frequency of the most
common distracter (choice C -- the car exerts the greater force) decreased to a value
ranging from 18% to14% depending upon the version. Unlike the accelerating question,
0%
10%
20%
30%
40%
50%
60%
70%
80%
90%
100%
A B C D E
Asked 1st(v2)
Asked 2nd(v1)
Aftercontrol (v4)
Figure 4.5 Graph of Non-accelerating Question Post-Instruction Results

38
some students continued to select choice D (the car exerts the only force), and choice E
(there are no forces present) in the post-instruction survey. The analysis showed no
effects due to the placement of this question.
Airplane Question
As in the pre-instruction survey, the airplane question was included on two
versions. The placement of the question on both versions was identical. For this reason,
it was not surprising to find that once again the two versions produced a similar
distribution of responses (see Figure 4.6). Z-scores showed that the small differences
visible on the graph are not statistically significant. After instruction more students
selected the correct answer (choice 5). As in the pre-instruction survey, all four distracter
options were chosen with about the same frequency.
0%
20%
40%
60%
80%
100%
1 2 3 4 5
Version 3 Version 4
Figure 4.6 Graph of Airplane Question Post-Instruction Results

39
4.1.3. Answer Combination Results
Analyzing the answer combinations provided some interesting and useful insights.
The answer combinations compared students’ answers to the accelerating and non-
accelerating questions on version 1 to their answers to the same questions on version 2.
This method allowed us to study the interaction between the questions. For both versions
of the survey, the four most popular answer combinations were the same. Yet, the order
of the questions affected the ranking of those four answer combinations. Table 4.1 shows
the four most popular answer combinations for version 1 and version 2. For version 1,
the combination AA was the second most popular answer combination. For version 2,
this combination (AA) was the third most popular.
Ranking Version 1 Version 2 1st CA 26% CC 33% 2nd AA 25% CA 23% 3rd CC 22% AA 21% 4th AC 5% AC 6%
Table 4.1 Pre-Instruction Answer Combinations (answer to accelerating question shown first)
The pre-instruction data showed three answer combinations that were affected by
the order of the questions, these combinations are shown in Table 4.2. As with previous
answer combination tables, students’ response to the accelerating question is listed first,
even though students taking version 2 were not asked this question first. Four percent of
the students chose answer combination AE. No students used this answer combination
for version 2. The z-test showed that this difference was significant with z = 3.23. Two
percent of the students answering version 1 chose answer combination DC , while no
students answering version 2 chose this answer combination – a significant difference (z

40
= 2.23). There was also a significant difference (z = 2.71) between the percentage of
students selecting answer combination CC on version 1 (22%) and version 2 (33%).
Answers Version 1 Version 2 z-scoreAE 4% 0% 3.23 DC 2% 0% 2.23 CC 22% 33% 2.71
Table 4.2 Pre-Instruction Answer Combinations with Significant Z-Scores
For version 1 of the post-instruction survey, the most popular answer combination
was AA. For version 2, this was only the second most popular combination. The top four
answer combinations for the post-instruction survey are shown in Table 4.3. Similar to
the pre-instruction survey, the same answer combinations rank in the top four for both
versions, but the order of the questions affect the ranking of each combination.
Ranking Version 1 Version 2 1st AA 43% CA 37% 2nd CA 34% AA 30% 3rd CC 11% CC 12% 4th BA 3% BA 6%
Table 4.3 Post-Instruction Answer Combinations (answer to accelerating question shown first)
Question order also affected the answer combinations for the post-instruction
survey. The rankings for the post-instruction answer combinations are shown in Table
4.3. There was a significant difference between the two versions (z = 1.963) in the
number of students who answered both questions correctly on the post-test. Forty-three
percent of the students taking version 1, chose the correct answer A (the forces are equal)
for both questions. Only thirty percent of students taking version 2 correctly answered
both questions. This result is also discussed above in section 4.1.2. In version 2, five
percent of the students answered that the truck exerted the greater force (answer B) in the
non-accelerating question and the car exerted the greater force (answer C) in the

41
accelerating question. None of the students gave this answer combination in version 1.
This difference was statistically significant with a z-score of z = 2.29.
4.1.4. Discussion of Survey Results
The overall result of this study is the realization that students’ knowledge and
answers can be influenced by previous questions. The proof for this claim has been
shown in the above discussion on the effects of the order of questions. We have found 11
types of situations in which students were more or less likely to choose a particular
answer based on the order of the questions. The z-tests also revealed five situations in
which the order of the two related questions influenced the answer combinations students
gave. On the post-instruction survey students performed better on the survey if the
accelerating question was asked first. Although this higher performance is statistically
significant, it is barely over the “cut-off” for statistical significance (z = 196). Therefore,
no firm conclusions should be drawn from this result.
For the pre-instruction survey students were less likely to choose answer C (the
car exerts the greater force) for the non-accelerating question if they were asked this
question second. It appears that the removal of the acceleration prompted students to
either correctly apply Newton’s third law and choose answer A or to incorrectly apply
Newton’s second law and conclude that since the acceleration was zero, the forces must
be zero as well (answer E).
For the post-instruction survey students performed much better on the
accelerating question if it was the first question related to Newton’s third law on the
survey (versions 1 and 3). Students who answered the accelerating question after the
non-accelerating question (version 2) were apparently confused by the addition of

42
acceleration to the scenario. This addition of acceleration likely triggered a focus on the
acceleration feature of the question and in turn Newton’s second law. This focus on
acceleration and in turn cued students to apply Newton’s second law lead many students
to choose answer B (the truck exerts the greater force) or answer C (the car exerts the
greater force). Using Newton’s second law, answer B can be justified by arguing that
since both the truck and car are traveling with the same acceleration, the force depends on
the mass, F=ma. Since the truck has the greater mass, it exerts the greater force: Ft(=mta)
> Fc(=mca), since mt > mc. Using Newton’s second law, answer C can be justified by
arguing that since the acceleration is to the right of the page, the greatest force must be in
this direction as well. Since the car is pushing in that direction, it must be exerting the
greater force.
Many of the effects of the order of the questions can be explained in terms of
students focusing on Newton’s second law instead of his third. Most physics courses
cover Newton’s third law, but only briefly in comparison to the time spent on Newton’s
second law. This focus on Newton’s second law is understandable since it is the law that
provides a mathematical formula that can be used to solve numerical homework problems
and used to derive many more complicated physics concepts. Incorrect applications of
Newton’s second law lead to many of the distracters in the accelerating and non-
accelerating questions. For instance, when answering the non-accelerating problem, if
one takes from the wording of the problem (“reaches a constant cruising speed”) that
there is no acceleration and applies this fact to F=ma, one can arrive at answer E (there
are no forces present) since if “a” equals zero, “F” must equal zero. This idea is
supported by the fact that no students ever chose answer E to the accelerating question,

43
suggesting that students realize when there is an acceleration there is at least some force
present; a fact derived from Newton’s second law. Those students who choose answer E
(no forces present) to the non-accelerating question when it is the first question (version
2) always choose answer C (the car exerts the greater force) for the accelerating question
both before and after instruction. Students likely arrived at this answer by the following
thought process: they first applied Newton’s second law and realized that since the
acceleration is to the right of the page therefore the greatest force must be in that
direction as well. Based on this idea they then argued that the car must exert a greater
force than the truck since the car is pushing to the right of the page. This idea is a more
sophisticated version of “force in the direction of motion” conception.
On the pre-instruction survey, when students answering the non-accelerating
question second (version 2) answered E (no forces present), they had always answered A
(the forces are equal) for the accelerating question first. This suggests that these students
were most likely using Newton’s third law to answer the accelerating question, but when
they were answering the non-accelerating question they focused on the difference
between the two problems, the inclusion of acceleration in one and not in the other, and
then used the logic described above to decide there were no forces present in the problem
with no acceleration.
On the post-instruction survey, students who answered E (no forces present) on
the non-accelerating question when it was asked second, answered either A (the forces
are equal) or C (the car exerts the greater force) to the accelerating question. These
students either correctly applied Newton’s third law, chose answer A, and then used the
logic described above to arrive at E for the non-accelerating question or they incorrectly

44
applied Newton’s second law, as described above, arrived at answer C for the
accelerating question and then used the same incorrect application of Newton’s second
law to arrive at answer E to the non-accelerating question.
Answer C (the car exerts the greater force) can be seen as the result of one of
three possible thought processes. First, students can arrive at answer C using an incorrect
application of Newton’s second law - since the acceleration is toward the right side of the
page, the force must also be in the same direction according to F=ma; since the car is
pushing in this direction, it must be the object exerting the greater force. Second, answer
C can also be a result of the “force in the direction of motion” conception (McCloskey,
1983), which is a less sophisticated version of the conception described above. Finally,
another conception used to describe students’ justification for answer C is the pushing
dominance model (Bao, Zollman, Hogg, & Redish, 2002). This model states that the
object doing the pushing must exert the greater force. Though not mentioned in the paper
cited above, answer D (the car exerts the only force) can also be seen as the result of a
less sophisticated, and thus more extreme application of the pushing dominance theory.
Answer B (the truck exerts the greater force) can also be the result of one of two
possible reasoning paths. First, students may choose answer B due to an incorrect
application of Newton’s second law. Since both the truck and car are traveling with the
same acceleration, the force depends on the mass, F=ma. Since the truck has the greater
mass, the truck has the greater force: Ft(=mta) > Fc(=mca), since mt > mc. Second, answer
B can also be seen as the result of the mass dominance model (Bao et al., 2002), which is
the idea that the larger object exerts the greater force. The mass dominance theory is in a
sense a less sophisticated version of the justification described above.

45
It is also worth noting that both before and after instruction students performed
better on the non-accelerating question than on the accelerating question. This
observation is consistent with the focus on Newton’s second law. When acceleration is
removed, as it is in the non-accelerating question, the focus on the relationship between
force and acceleration (i.e. Newton’s second law) is also removed. Students are thus
more likely to apply Newton’s third law.
4.2. Interview Results
4.2.1. Interview Order Effects
The purpose of the survey was to observe students changing their answers
to questions because of preceding questions. The purpose of the interviews, unlike the
surveys, was to investiage the dynamics of student reasoning underlying this process to
be observed. Of the 32 students who were interviewed five students asked to change
their answer to an earlier problem after being asked a related problem. One student
realized her earlier answer was incorrect but did not volunteer to correct it. The majority
of these instances occurred in the pre-instruction interviews.
Airplane and Cannon Questions
The four students taking version 2 before instruction were asked the airplane
question (see Figure 3.3) followed by the cannon question (see Figure 3.4). Of these four
students, two correctly answered (choice 5) the airplane question when they were asked
to answer the question from the perspective of an observer standing on the ground. Two
of the four students correctly answered the cannon question (choice 2). The two students
who had incorrectly answered the airplane question then asked to return to the airplane
question and changed their answers to the correct answer. This process is described in

46
Table 4.4. The arrows indicate a student who changed his/her answer. The answer to the
left of the arrow is the original answer, and the answer to the right is the final answer.
Notice that only one of the two students who correctly answered the airplane question on
the first attempt also answered the cannon question correctly. The most important fact in
these data is that all of the students eventually chose the correct response to the airplane
question, even without correctly answering the cannon question.
Student Airplane Cannon1 3 z 5 2 2 5 2 3 1 z 5 3 4 5 3
Table 4.4 Interview Answers to Airplane and Cannon Questions (Version 2)
Version 1, which asked students to answer the cannon question first, was not as
effective in influencing student answers. Table 4.5 shows student answers for the cannon
and airplane questions on version 1. None of the students taking version 1 asked to
return to a previous problem. Only one of the students answered the cannon question
correctly, and another student was the only one to correctly answer the airplane question.
While students who took version 1 gave similar answers to the cannon question as those
students who took version 2, they did not perform as well on the airplane question. This
Student Cannon Airplane1 3 3 2 2 3 3 3 5 4 3 3
Table 4.5 Interview Answers to Cannon and Airplane Questions (Version 1)
suggests that the advantage of version 2 was not the combination of questions asked, but
the order of the questions. The ability to have the airplane question in their recent

47
memory as they worked the cannon question allowed them to realize an inconsistency in
their answers and correct the answer to the airplane question.
Seven students answered the airplane and cannon question in the post-instruction
interview. Of these students, only one incorrectly answered the cannon problem. Three
students correctly answered the airplane question. Two of the four students answering
the airplane question before the cannon question correctly answered the airplane question
and one of three students correctly answered the airplane question when it was asked
after the cannon question. None of the students in the post-instruction interviews asked
to return to and change their answers to the cannon or airplane questions.
Hockey Puck and Space Ship Questions
Four students responded to version 3 of the pre-instruction interviews in which
the hockey puck question (see Figure 3.5) was asked before the space ship question (see
Figure 3.6). Of these four students, one correctly answered (choice 2) the hockey puck
question. None of these students correctly answered (choice 5) the spaceship question.
After answering the spaceship question, two students asked to return to the hockey puck
question to change their answers. One student changed her answer to the correct choice.
The other student switched from one incorrect answer to another. All answers to version
3 are shown in Table 4.6. The arrows indicate a student who changed his/her answer.
The answer to the left of the arrow is the original answer, and the answer to the right is
the final answer.
Student Hockey Space1 4 2 2 2 2 3 4 z 1 4 4 5 z 2 3
Table 4.6 Interview Answers to Hockey Puck and Space Ship Questions (Version 3)

48
Three of the students interviewed used version 4. These students’ responses are
shown in Table 4.7. One of the three students answered the spaceship question correctly
and another student answered the hockey puck question correctly. None of the students
answering version 4 of the interview asked to return to a previous question.
Student Space Hockey1 4 1 2 5 1 3 3 2
Table 4.7 Interview Answers to Space Ship and Hockey Puck Questions (Version 4)
Accelerating and Non-Accelerating Questions
Eight students answered the accelerating and non-accelerating questions during
the post-instruction interviews. Of these, only two students changed their answers to the
questions. One student changed her answer to the accelerating question after answering
the non-accelerating question (version 1). She changed from the correct choice (answer
A) to an incorrect choice so that her answers to both questions were the same. Another
student taking version 2 of the survey (non-accelerating question first) decided that she
did not know the answer to the non-accelerating question after answering the accelerating
question. She did not offer an alternative answer, though. The answers provided by each
of the students for the accelerating and non-accelerating questions can be seen in Table
4.8 and Table 4.9.
Student Accel Non-Accel1 A A 2 C A 3 C C 4 A z B B
Table 4.8 Interview Answers to Accelerating and Non-Accelerating Questions (Version 1)

49
Student Non-Accel Accel1 C C 2 A C 3 C C 4 C z ? C
Table 4.9 Interview Answers to Non-Accelerating and Accelerating Questions (Version 2)
No students changed their answers to the accelerating and non-accelerating
questions during the pre-instruction interviews.
Answer Consistency
During the course of the interviews, it became apparent that students were striving
for some type of consistency in answers when they felt the questions were related.
Therefore a list of consistent answers was compiled, and the number of students giving
each pair of responses is shown in Table 4.10. The left hand side of the table lists these
answer combinations while the right hand side of the table lists the number of students
who chose this combination grouped according to version. For instance, as per the first
row in the table, one student each in versions 1 and 2 selected A on both the accelerating
and non-accelerating questions. Answers to the accelerating and non-accelerating
questions were considered consistent if students chose the same answer for both
questions. Answers for the cannon and airplane questions were considered consistent if
the path of the projectile had the same shape. The forward and backward direction the
ball fell in the airplane question were considered equivalent. Answers for the hockey
puck and space ship problem were considered consistent if students chose paths of the
same shape for both questions. Since many students did not notice the fact that answer 4
for the spaceship problem continued traveling to the left for a while or that the path was
different than the path 4 in the hockey puck problem, this answer was grouped with
answer 5 for the problem and was considered to be consistent with answer 4 for the

50
hockey puck question. It should be noted that consistent answers for the hockey puck
and space ship questions do not result in correct answers. Since the spaceship has a
constant force exerted on it, it will follow a different path than the hockey puck.
Consistency between the chosen path for the airplane, spaceship, and hockey puck
problem was also checked. The correct responses are bolded in Table 4.10. The only
combinations of consistent answers that are shown in the table are those that were chosen
by students. There are many other possible combinations of consistent answers that were
not chosen by students, and these are not mentioned in the table. A dash (-) indicates that
the pair of questions did not appear on that particular version. Table 4.10 only shows
consistent answer combinations; it does not show answers that resulted from consistent
reasoning. Consistent answers do not necessarily imply consistent reasoning. It is
possible that students used reasoning they felt was consistent to arrive at answers that
were inconsistent.
Questions Versions Pre-Instruction Post-Instruction
Accel Non-Accel Airplane Cannon Hockey Space v1 v2 v3 v4 v1 v2 v3 v4
A A 1 1 - - 1 0 - - B B 0 0 - - 1 0 - - C C 0 2 - - 1 2 - - D D 2 0 - - 0 0 - - 1 2 0 0 - - 0 1 - - 1 3 0 1 - - 0 0 - - 5 2 0 2 - - 0 2 - - 5 3 1 2 - - 1 0 - - 1 2 - - 0 0 - - 1 0 2 3 - - 0 1 - - 1 0 4 2 3 - - 1 0 - - 0 0 3 1 2 - - 0 0 - - 0 1
Table 4.10 Answer Combinations

51
Overall, eight out of fifteen students in the pre-instruction interviews and eight
out of seventeen students in the post-instruction interview (different from the pre-
instruction interview students) gave consistent, but incorrect answers. In the pre-
instruction interviews three students gave consistent, correct answers and in the post-
instruction interviews four students gave consistent correct answers. During both sets of
interviews, two students gave consistent answers to both sets of question they were
asked. Five students changed their answer to a question during the course of the
interview. Of these five, four students changed to an answer that was consistent with
their answer to the other related question. These results suggest that students are
interested in giving consistent answers and use consistency to check their work and logic.
The fact that a larger percentage of students were consistent in the pre-instruction
interview suggests that students tend to rely on consistency when they believe that they
have less experience or knowledge about a particular question.
4.2.2. Students’ Views of Similarities and Differences
Pre and post instruction students appeared to share more commonalities than
discrepancies in their views toward the similarities and differences in the pairs of physics
questions. This result could be due to the fact that dividing students into pre and post
instruction interviews was not the same as dividing students based on their exposure to
physics topics. Many of the pre-instruction students had studied physics in high school
and were therefore familiar with the concepts and terminology used. However, dividing
the students based on high school physics experience would have resulted in unequal
numbers in each group since almost all students had physics in high school. Despite the
overall parallels between pre-instruction and post-instruction comments, there were

52
several distinctions. Post- instruction students focused equally on comparisons of
physics concepts (e.g. projectile motion) and surface features (e.g. speed of object), while
pre-instruction students focused on surface features, though they were able to point out
many similar or different physics concepts between problems. When asked to compare
all four problems the best that could be expected from students was for them to point to a
common physics concept shared by all questions. Several students were able to describe
this similarity. Other students simply commented that all of the questions were related to
physics. Pre-instruction students had an even greater difficulty with this question than
the post-instruction students. They tended to point toward surface features (e.g. all
problems involve motion to the right). Some of these students did reach the same
conclusion as some pre-instruction students – all questions are related to physics.
Answers to the interview question asking students about the similarities and differences
of all questions were very difficult to categorize. Since students pointed to so many
diverse types of differences, themes did not readily appear from the analysis. Overall
most students appeared to feel this exercise was as fruitless as comparing apples to
oranges.
The car and truck questions (Accelerating and Non-Accelerating)
When comparing the two car and truck questions, post-instruction students tended
to focus on three themes – the problems were different because one involved constant
speed while the other involved acceleration, the problems were similar because they
involved a similar situation, and the problems were similar because they used a common
concept (e.g. forces). Each theme was equally prevalent. While pre-instruction
comments showed the same themes, they were not equally common. Several students did

53
point to the difference between constant speed and constant acceleration, usually not
using these precise terms. Most comments were focused on similar surface features.
The Airplane problem and a Car and Truck problem
For the purpose of this analysis, the accelerating and non-accelerating questions
were combined, since the specific question did not appear to greatly influence student
responses. Interestingly, very few post-instruction comments pointed to the difference
that one problem was about forces, while the other was a projectile motion problem.
Many of the pre-instruction students hinted at this idea, though none referred to the
airplane problem as a projectile motion problem. The post-instruction comments were
focused on the physics concepts common to or differing in the two problems, though
several comments were made about the surface features. Pre-instruction students usually
just restated the two problems as a way to point to the differences. Many of them
claimed that the two problems had no similarities
The Cannon and the Airplane problems
Pre-instruction students were extremely focused on the fact that the bowling ball
was dropped while the cannon ball was shot and other differences related to this fact.
Only one post-instruction student hinted at this idea. Most of the post-instruction
students pointed to similarities either in the physics concepts or the surface features.
They were still slightly more focused on surface features (e.g. both problems are about a
falling object), in the sense they discussed them more often, but were able to look past the
minor differences (e.g. one ball was dropped, while the other was shot) to see the broader
similarities.
The Hockey Puck and Space Ship problems

54
The key difference between the hockey puck and space ship problem, from an
experts point of view, would be the fact that the space ship experiences a constant force,
while the hockey pucks experiences an instantaneous force. Only one post-instruction
student even alluded to this idea, while none of the pre-instruction students appeared to
notice it. Pre-instruction students were instead more focused on the idea that the space-
ship’s force was internal, and therefore the ship had control of its direction. The hockey
puck on the other hand was at the mercy of an external force. Many students, both pre
and post instruction, felt the two problems were basically the same.
Overall, pre-instruction students were very focused on the surface features of all
the problems. This does not mean that they did not recognize differences or similarities
in the physics concepts used; they simply did not point to these concepts as often. Post-
instruction students did comment on underlying physics concepts more often, but still
pointed out surface features frequently. The post-instruction students did not notice
several of the key differences that would have been important to an expert understanding
of the problem.

55
5. Conclusions
5.1. Responses to Research Questions
Previous research has not reached a consensus about the effects of question order
on students’ responses, especially pertaining to conceptual physics tests. Yet,
understanding the effect of question order is important in light of current test
administration practices. The research described in this thesis has implications for
assessments ranging from in-class exams in individual courses to large-scale standardized
tests (e.g. GRE). As research into student understanding of physics concepts begins to
focus on students’ incorrect reasoning as well as correct reasoning, it becomes even more
important to have appropriate assessment tools. The present study which addresses this
need leads to the following conclusions.
• What is the effect of question order on student responses to multiple choice
questions?
This research has shown several instances in which the order of questions
influenced the frequency of students’ responses on multiple-choice surveys. This result
appeared in both the pre- and post-instruction surveys. For instance, during the pre-
instruction surveys, students were more likely to choose the correct response to the non-
accelerating question (see Figure 3.2) when it was asked after the accelerating question
(see Figure 3.1) than when it was asked after a control (airplane) question (see Figure
3.3), or when it was asked first. Question order also affected the combination of answers
provided by students to the accelerating and non-accelerating questions.
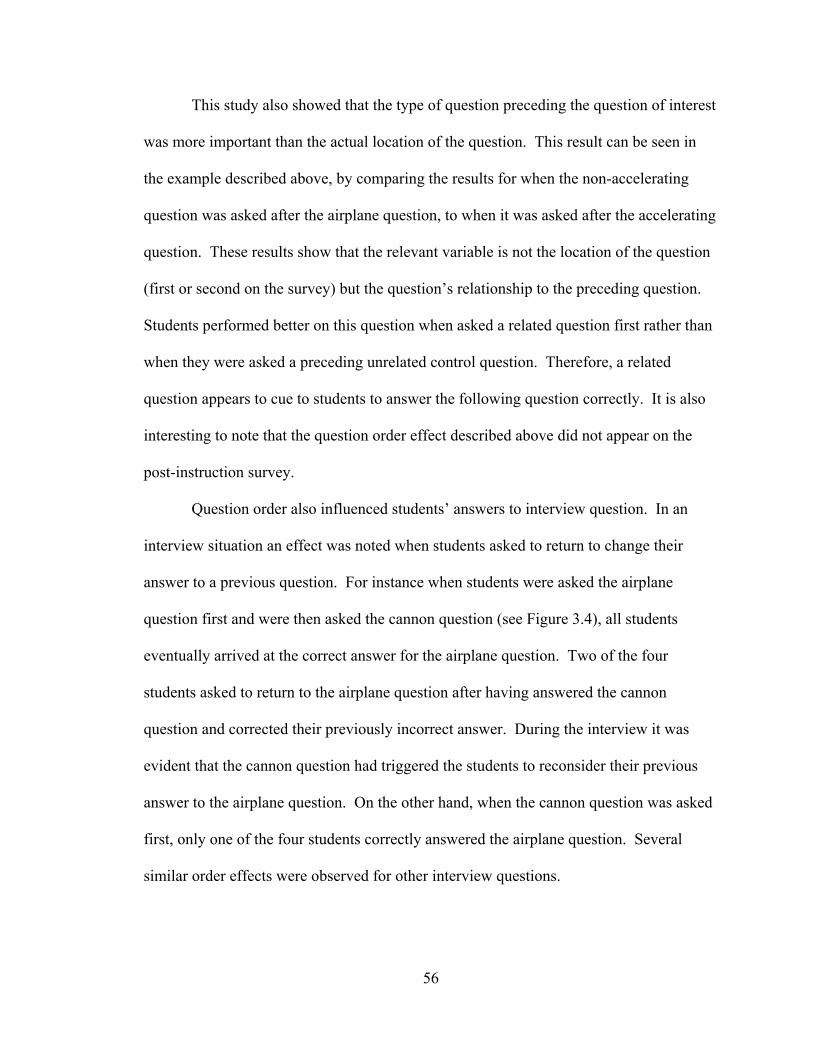
56
This study also showed that the type of question preceding the question of interest
was more important than the actual location of the question. This result can be seen in
the example described above, by comparing the results for when the non-accelerating
question was asked after the airplane question, to when it was asked after the accelerating
question. These results show that the relevant variable is not the location of the question
(first or second on the survey) but the question’s relationship to the preceding question.
Students performed better on this question when asked a related question first rather than
when they were asked a preceding unrelated control question. Therefore, a related
question appears to cue to students to answer the following question correctly. It is also
interesting to note that the question order effect described above did not appear on the
post-instruction survey.
Question order also influenced students’ answers to interview question. In an
interview situation an effect was noted when students asked to return to change their
answer to a previous question. For instance when students were asked the airplane
question first and were then asked the cannon question (see Figure 3.4), all students
eventually arrived at the correct answer for the airplane question. Two of the four
students asked to return to the airplane question after having answered the cannon
question and corrected their previously incorrect answer. During the interview it was
evident that the cannon question had triggered the students to reconsider their previous
answer to the airplane question. On the other hand, when the cannon question was asked
first, only one of the four students correctly answered the airplane question. Several
similar order effects were observed for other interview questions.

57
Based on the results presented in this thesis, question order appears to have an
effect on student responses to multiple choice questions. In some situations a previous
question can steer students toward the correct answer. In other situations a previous
question appeared to lead students toward one of the incorrect answers. During the
interviews it became apparent that student responses can also be influenced by
subsequent questions. In an exam situation this effect would result in students going
back through the test to change previous answers.
• Will the order of questions affect student scores?
On the pre-instruction survey the order of questions affected the ranking of the
four most popular answer combinations (see Table 4.1). Yet, the order of the questions
did not affect students’ scores on the survey.
On the post-instruction survey student scores were affected by the order of the
questions. Students who answered the accelerating question before answering the non-
accelerating question were more likely to score a 100% on the two question survey than
those answering the non-accelerating question first. This order effect was the result of
increased student performance on the accelerating question when it was asked first during
the post-instruction survey. It is interesting to note that this is the order in which the
accelerating and non-accelerating questions appear on the Force Concept Inventory.
• Can transfer be detected during the interviews or can it be interpreted based on
survey responses?
Some current perspectives of transfer (Lobato, 2003) suggest that transfer occurs
in all situations. The main issues to consider, then are what is being transferred and
whether that transfer can be observed. Transfer during the survey could not be directly
58
observed, though the question order effects described above do suggest that some type of
transfer is occurring. Inferences about what is transferring have been proposed
previously in this thesis (see Section 4.1.4). Notes taken during the interviews provide
data on student answers as well as student reasoning; therefore instances of transfer are
more transparent during this phase of the study. During several interviews, students
referred to comments made by their professors, things they had read in the textbook and
previous life experiences. While these were interesting examples of transfer, they do not
shed light on why question order has an effect on student responses. However, during
interviews students did indicate that they were transferring the reasoning developed or the
answer chosen in one question to help them answer a different question. This was most
apparent when students would return to a previous question after having answered a new
question.
Some current perspectives on transfer suggest that for students to transfer
knowledge from one context to the next, they must intuitively “see” there is some
connection between the two contexts. This helps explain why more students did not
return to previous answers or why all students were not consistent in their answers.
When students were asked to comment on the similarities and differences between pairs
of questions they often focused on the surface features of the problem. Because these
surface features did not influence a student’s answer to the question, she did not feel the
need to be consistent in her answers even if she thought the two problems were similar.
For instance, while a student thought the accelerating and non-accelerating questions
were similar since both problems were about a truck, the type of object didn’t affect how
the student answered the problem, so she saw no need to be consistent between the two

59
problems. Overall, this study shows that transfer can be observed and can be used to
explain why question order affected student responses.
5.2. Recommendations for Future Research
The purpose of this study was to investigate the effect of question order and
understand whether this effect could be explained in light of transfer of learning. As with
most research, this study not only answered the questions it posed but also raised several
new questions. Future possibilities include looking at order effect on surveys with more
than two questions, using questions from other physics topics, and using different
question formats including open-ended. While this research has shown that order effects
do exist, much more research is needed before these effects can be completely
understood.
Student explanations often hold a wealth of information, and the responses
recorded in this study during the interviews were no exception. There was far more
information than could be studied during the course of this research. Future areas of
analysis could include looking for consistency in student reasoning and not just student
answers, comparing similarities and differences based on the order in which the questions
were asked and comparing the similarities cited by students who changed their answers
after seeing the second question with those that did not. In general, more research could
be done in understanding the underlying cognitive mechanism that triggers students to
transfer what they have learned in one question to another question.
After gathering more data from students without previous physics experience, the
data could also be analyzed for differences between students with and without prior
physics experience. Beyond the purpose of this study, the interview data also appeared to

60
have information that would shed light on student epistemologies and difficulties with the
airplane question.
5.3. Implications for Instruction and Research
The order of multiple-choice questions on a survey or in an interview may affect
student responses. This means that researchers and instructors must be careful when
developing, administering, and analyzing assessments. While this study did not attempt
to show that previous research results are suspect, it does suggest that future research
should take into account the effects of question order. The results of this study should
also be interpreted as a warning against the practice of creating multiple versions of
exams and surveys by rearranging questions.
This study has also shown that students’ knowledge may be even less stable than
previously thought. It is therefore important to consider student responses to questions in
the context of the other questions on a survey. The results do suggest more than just
warnings, though. This inherent instability in student knowledge and the influence of
previous or subsequent questions on student reasoning can be used as a teaching tool to
guide students to greater understanding. For instance, the cannon question was able to
encourage students to correct their answers to the airplane question. In a teaching setting
these two questions could be used to start a very productive discussion on projectile
motion or vector addition. Some research is already being done on the effectiveness of
using paired questions. These question pairs are referred to as Elby pairs (Redish, 2003)
Overall, this study has pointed to several pitfalls as well as opened up several possibilities
for instruction and educational research.

61
References
Bao, L., Zollman, D., Hogg, K., & Redish, E. F. (2002). Model Analysis of Fine Structures of Student Models: An Example with Newton's Third Law. American Journal of Physics, 70(7), 766-778.
Bransford, J. D., Brown, A. L., & Cocking, R. R. (Eds.). (2000). How People Learn: Brain, Mind, Experience, and School (Expanded Edition ed.). Washington DC: National Academy Press.
Churukian, A. D. (2002). Interactive Engagement in an Introductory University Physics Course: Learning Gains and Perceptions. Unpublished Doctoral Disseration, Kansas State University, Manhattan, KS.
Eignor, D. R., & Cook, L. L. (1983). "An Investigation of the Feasibility of Using Item Response Theory in Pre-Equating of Aptitude Tests". A paper presented at the annual meeting of AERA, Montreal, 1983.
Giancoli, D. C. (1997). Physics: Principles with Application (5th Edition). Englewood Cliffs, New Jersey: Prentice Hall.
Hestenes, D. (2001). Personal Communication. In N. S. Rebello & D. A. Zollman (Eds.). Hestenes, D., Wells, M., & Swackhamer, G. (1992). Force Concept Inventory. The
Physics Teacher, 30, 141-157. Hewitt, P. G. (2002). Conceptual Physics (9th Edition) (9 ed.). Boston: Addison Wesley. Hodson, D. (1984). The Effect of Changes in Item Sequence on Student Performance in a
Multiple-Choice Chemistry Test. Journal of Research in Science Teaching, 21(5), 489-495.
Hrepic, Z. (2004, January 24-28, 2004). A Real-Time Assessment of Students' Mental Models of Sound Propagation. Paper presented at the AAPT Winter Meeting, Miami, FL.
Huck, S. W., & Bowers, N. D. (1972). Item Difficulty Level and Sequence Effects in Multiple Choice Achievement Tests. Journal of Educational Measurement, 9(2), 105-111.
Itza-Ortiz, S. F., Rebello, N. S., & Zollman, D. A. (2004). Students’ models of Newton’s second law in mechanics and electromagnetism. European Journal of Physics, 25, 81-89.
Jordan, A. M. (1953). Measurement in Education: An Introduction. Toronto: McGraw-Hill Book Company, Inc.
Judson, E., & Sawada, D. (2002). Learning from Past and Present: Electronic Response Systems in College Lecture Halls. Journal of Computers in Mathematics and Science Teaching, 21(2), 167-181.
Kingston, N. M., & Dorans, N. J. (1984). Item Location Effects and Their Implications. Applied Psychological Measurement, 8(2), 147-154.
Kleinke, D. J. (1980). Item Order, Response Location and Examinee Sex and Handedness and Performance on a Multiple-Choice Test. Journal of Educational Research, 73(4), 225-229.
Leary, L. F., & Dorans, N. J. (1985). Implications for Altering the Context in Which Test Items Appear: A Historical Perspective on an Immediate Concern. Review of Educational Research, 55(3), 387-413.
62
Lobato, J. (2003). How Design Experiments Can Inform a Rethinking of Transfer and Vice Versa. Eucational Researcher, 23(1), 17-20.
Lobato, J. E. (1996). Transfer Reconceived: How "sameness" is produced in mathematical activity. University of California, Berkeley, Derkeley, CA.
McCloskey, M. (1983). Naive theories about motion. In D. Gentner & A. Stevens (Eds.), Mental Models. Hillsdale, New York: Lawrence Elbraum.
McDermott, L. C. (2001). Oested Medal Lecture 2001: Physics Education Research - The Key to Student Learning. American Journal of Physics, 69(11), 1127-1137.
Mollenkopf, W. G. (1950). An Experimental Study of the Effects of Item Analysis Data of Changing Item Placement and Test Time Limit. Psychometrika, 15(3), 291-315.
Monk, J. J., & Stallings, W. M. (1970). Effects of Item Order on Test Scores. The Journal of Educational Research, 63(10), 463-465.
Pellegrino, J. W., Chudowsky, N., & Glaser, R. (Eds.). (2001). Knowing what Students Know: The Science and Design of Educational Assessment. Washington, DC: National Academy Press.
Rebello, N. S., & Zollman, D. A. (2004). The Effect of Distracters on Student Performance on the Force Concept Inventory. American Journal of Physics, 72(1).
Redish, E. F. (1999). Milikan Lecture 1998: Building a Science of Teaching Physics. American Journal of Physics, 67(7).
Redish, E. F. (2003). Teaching Physics: With the Physics Suite. Hoboken, NJ: Jonh Wiley and Sons, Inc.
Redish, E. F. (2003, July 15-25, 2004). A Theoretical Framework for Physics Education Research: Modeling Student Thinking. Paper presented at the International School of Physics, "Enrico Fermi", Course CLVI, Varenna, Italy.
Steele, C. (1997). A Threat in the Air: How Stereotypes Shape the Identities of Women and African Americans. American Psychologists, 53(6), 613-629.
Yang, S.-S. (2004). Re: Z-test of Proportions (e-mail). Manhattan, KS. Zollman, D. (1999). Technology & Model-Based Conceptual Assessment: Research in
Students' Applications of Models in Physics & Mathematics. Abstract for ROLE Grant #0087788. http://www.ehr.nsf.gov/rec/ROLE-RoundIAwardListWithCPOsAndAbstracts.htm#_Toc503156384. Retrieved, from the World Wide Web:

63
Appendix A Demographics Form LAST NAME (PRINT ALL CAPS) FIRST NAME (PRINT ALL CAPS)
Age: _________Years
Gender (circle one): Female Male
Status (circle one): Returning Adult Traditional Student
Year in College (circle one): 1st 2nd 3rd 4th 5th 6th or above
Major:__________________________________________________
Did you take any physics class in high school? YES NO
If you answered “YES” above, then please answer the two questions below:
What physics class did you take (e.g. AP etc)? _________________
What grade did you earn in your high school physics class? _____
Did you take any physics class in college? YES NO
If you answered “YES” above, then please answer the two questions below:
What physics class did you take (e.g. P. World)? _______________
What grade did you earn in your college physics class? _________

64
Appendix B Consent Form
KANSAS STATE UNIVERSITY
INFORMED CONSENT TEMPLATE PROJECT TITLE: PRINCIPAL INVESTIGATOR: CO-INVESTIGATOR(S): CONTACT AND PHONE FOR ANY PROBLEMS/QUESTIONS: IRB CHAIR CONTACT/PHONE INFORMATION: SPONSOR OF PROJECT: PURPOSE OF THE RESEARCH: PROCEDURES OR METHODS TO BE USED: ALTERNATIVE PROCEDURES OR TREATMENTS, IF ANY, THAT MIGHT BE ADVANTAGEOUS TO SUBJECT: LENGTH OF STUDY: RISKS ANTICIPATED: BENEFITS ANTICIPATED: CONFIDENTIALITY: PARENTAL APPROVAL FOR MINORS: PARTICIPATION: I understand this project is for research and that my participation is completely voluntary, and that if I decide to participate in this study, I may withdraw my consent at any time, and stop participating at any time without explanation, penalty, or loss of benefits, or academic standing to which I may otherwise be entitled. I also understand that my signature below indicates that I have read this consent form and willingly agree to participate in this study under the terms described, and that my signature acknowledges that I have received a signed and dated copy of this consent form. Participant Name: _____________________________
Participant Signature: _____________________________
Date:
__________
Witness to Signature: (project staff)
_____________________________
Date:
__________

65
ADDENDUM TO INFORMED CONSENT FORM
I hereby state that:
• I have read, understood and signed the Kansas State University, Informed Consent (Template) Form.
• I have agreed to be interviewed once in Spring 2002, for a total duration of up to 30 minutes, in connection with the study described in the Kansas State University, Informed Consent (Template) Form.
• I understand that information collected from me during this interview process, including any demographic information will be kept strictly confidential by the Project Staff. Audiotapes of the interview, and their transcripts will be stored in a secure place, and will be destroyed after the publication of the research resulting from this study.
• I understand that I will not be identified either by name or by any other identifying feature in any communication, written or oral, pertaining to this research.
• I understand that if I wish to withdraw from the study at any time, either before a scheduled interview, during an interview or after an interview I can do so without explanation, penalty, or loss of benefits, or academic standing that I may otherwise be entitled.
• I understand that by signing this form, I have consented to have information learned from me during the process to be used by the Project Staff in their research and any resulting publications.
• I understand that if I agree to the 30 minute interview in Spring 2002 pertaining to this project and if I allow my data to be used in the research (by signing this form) then I will be compensated for my participation for a total sum of $10 after the completion of this interview.
Participant Name: ____________________________________________________
Participant Signature _________________________ Date: _________________
Witness to Signature __________________________ Date: __________________
(Project Staff)

66
Appendix C Spring 2002 Interview Protocol
(Hand out first question)
1. Walk me through how you would solve this problem
(Remove first question/Hand out second question)
2. Walk me through how you would solve this problem
3. After solving this question do you still agree with you answer to the first question or would you like to change the way you answered it?
4. How are these questions similar or different?
5. When you were answering the second question, did you refer to the first question? (How?)
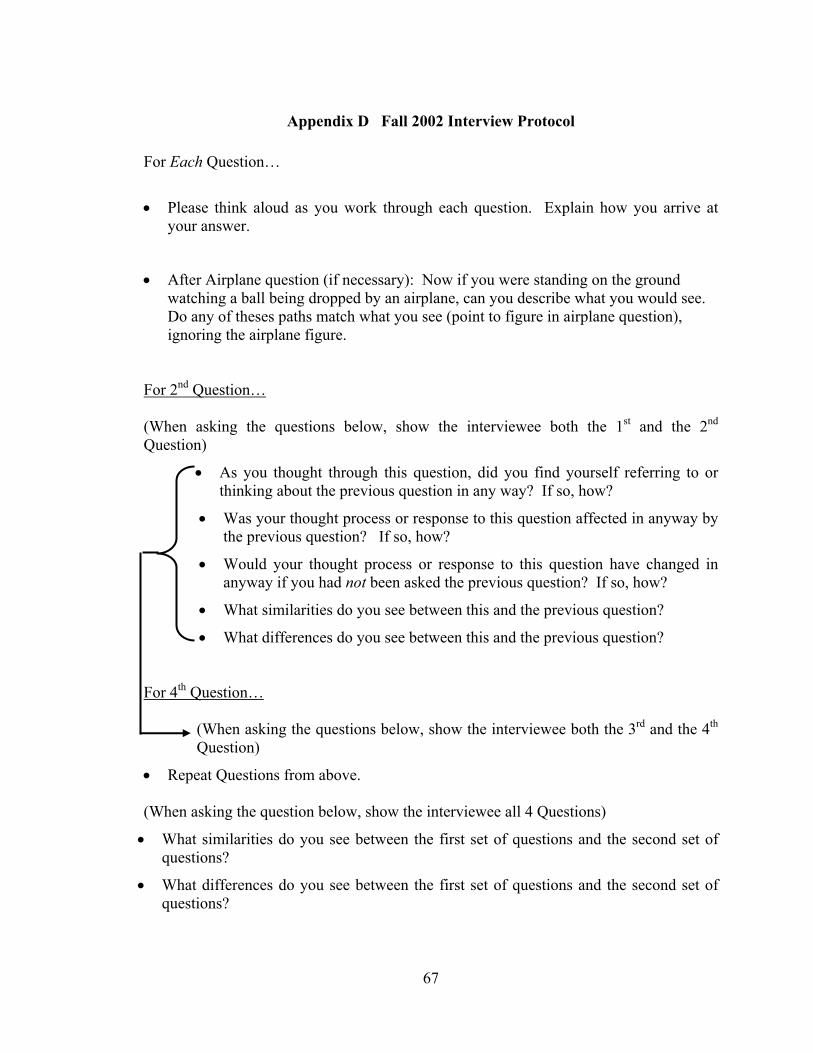
67
Appendix D Fall 2002 Interview Protocol
For Each Question…
• Please think aloud as you work through each question. Explain how you arrive at your answer.
• After Airplane question (if necessary): Now if you were standing on the ground watching a ball being dropped by an airplane, can you describe what you would see. Do any of theses paths match what you see (point to figure in airplane question), ignoring the airplane figure.
For 2nd Question…
(When asking the questions below, show the interviewee both the 1st and the 2nd Question)
• As you thought through this question, did you find yourself referring to or thinking about the previous question in any way? If so, how?
• Was your thought process or response to this question affected in anyway by the previous question? If so, how?
• Would your thought process or response to this question have changed in anyway if you had not been asked the previous question? If so, how?
• What similarities do you see between this and the previous question?
• What differences do you see between this and the previous question?
For 4th Question…
(When asking the questions below, show the interviewee both the 3rd and the 4th Question)
• Repeat Questions from above. (When asking the question below, show the interviewee all 4 Questions)
• What similarities do you see between the first set of questions and the second set of questions?
• What differences do you see between the first set of questions and the second set of questions?
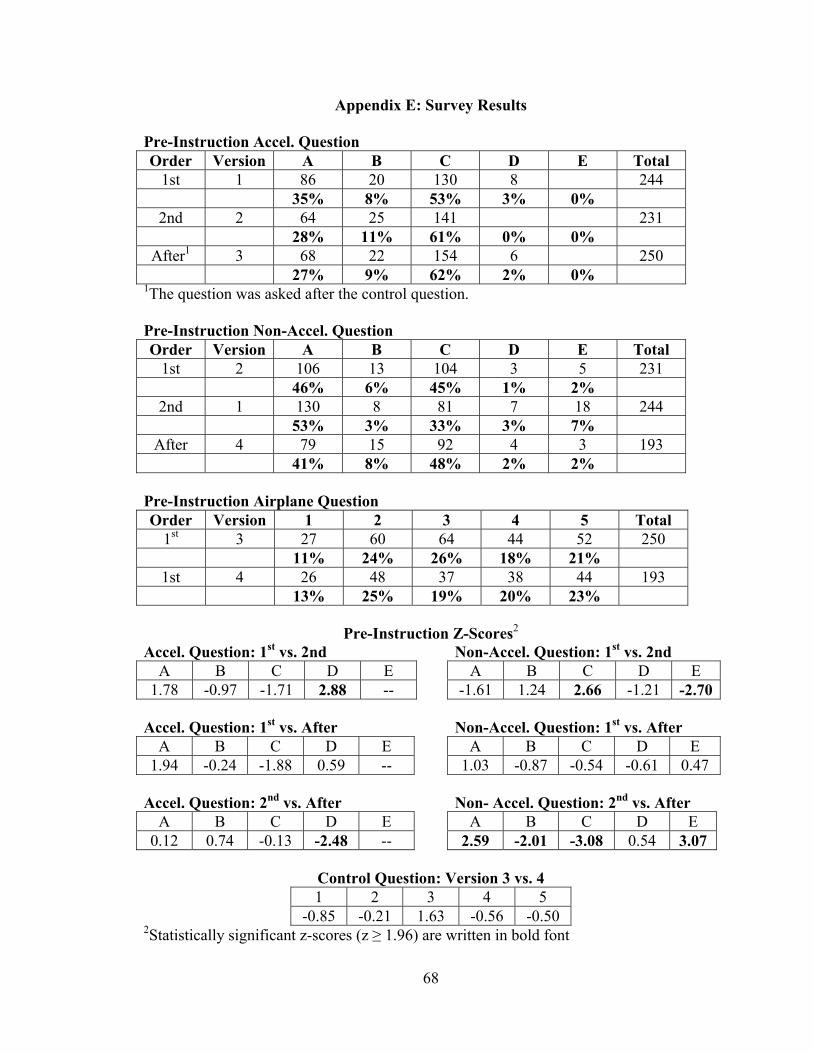
68
Appendix E: Survey Results
Pre-Instruction Accel. Question Order Version A B C D E Total
1st 1 86 20 130 8 244 35% 8% 53% 3% 0%
2nd 2 64 25 141 231 28% 11% 61% 0% 0%
After1 3 68 22 154 6 250 27% 9% 62% 2% 0%
1The question was asked after the control question. Pre-Instruction Non-Accel. Question Order Version A B C D E Total
1st 2 106 13 104 3 5 231 46% 6% 45% 1% 2%
2nd 1 130 8 81 7 18 244 53% 3% 33% 3% 7%
After 4 79 15 92 4 3 193 41% 8% 48% 2% 2%
Pre-Instruction Airplane Question Order Version 1 2 3 4 5 Total
1st 3 27 60 64 44 52 250 11% 24% 26% 18% 21%
1st 4 26 48 37 38 44 193 13% 25% 19% 20% 23%
Pre-Instruction Z-Scores2
Accel. Question: 1st vs. 2nd A B C D E
1.78 -0.97 -1.71 2.88 -- Accel. Question: 1st vs. After
A B C D E 1.94 -0.24 -1.88 0.59 --
Accel. Question: 2nd vs. After
A B C D E 0.12 0.74 -0.13 -2.48 --
Non-Accel. Question: 1st vs. 2nd A B C D E
-1.61 1.24 2.66 -1.21 -2.70 Non-Accel. Question: 1st vs. After
A B C D E 1.03 -0.87 -0.54 -0.61 0.47
Non- Accel. Question: 2nd vs. After
A B C D E 2.59 -2.01 -3.08 0.54 3.07
Control Question: Version 3 vs. 4 1 2 3 4 5
-0.85 -0.21 1.63 -0.56 -0.50 2Statistically significant z-scores (z ≥ 1.96) are written in bold font

69
Post-Instruction Accel. Question Order Version A B C D E Total
1st 1 55 7 50 0 0 112 49% 6% 45% 0% 0% 100%
2nd 2 36 11 58 0 0 105 34% 10% 55% 0% 0% 100%
After1 3 49 3 47 0 0 99 49% 3% 47% 0% 0% 100%
Post-Instruction Non-Accel. Question Order Version A B C D E Total
1st 2 77 8 19 0 1 105 73% 8% 18% 0% 1% 100%
2nd 1 89 4 16 0 2 111 80% 4% 14% 0% 2% 100%
After 4 74 5 15 2 0 96 77% 5% 16% 2% 0% 100%
Post-Instruction Airplane Question Order Version 1 2 3 4 5 Total
1st 3 9 18 16 15 41 99 9% 18% 16% 15% 41% 100%
1st 4 15 10 15 13 45 98 15% 10% 15% 13% 46% 100%
Post Instruction Z-Scores
Accel. Question: 1st vs. 2nd
A B C D E 2.240 -1.123 -1.569 -- -- Accel. Question: 1st vs. After
A B C D E -0.056 1.124 -0.412 -- -- Accel. Question: 2nd vs. After
A B C D E -2.225 2.158 1.112 -- --
Non-Accel. Question: 1st vs. 2nd A B C D E
-1.193 1.281 0.733 -- -- Non-Accel. Question: 1st vs. After
A B C D E -0.616 0.700 0.468 -- -- Non- Accel. Question: 2nd vs. After
A B C D E 0.541 -0.558 -0.243 -- --
Control Question: Version 3 vs. 4 1 2 3 4 5
-1.338 1.616 0.165 0.379 -0.638

70
Pre-Instruction Answer Combination Results Verion 1 Verion 2 z-score
AA 25% 21% 0.97 AB 1% 1% -0.06 AC 5% 6% -0.36 AD 0% 0% 1 AE 4% 0% 3.23 BA 3% 3% 0.26 BB 1% 2% -1.02 BC 4% 6% -0.84 BD 0% 0% 0 BE 0% 0% -1 CA 26% 23% 0.86 CB 1% 3% -1.31 CC 22% 33% -2.7 CD 2% 1% 0.6 CE 3% 2% 0.91 DA 0% 0% 0 DB 0% 0% 0 DC 2% 0% 2.23 DD 1% 0% 1.57 DE 0% 0% 0
Pre-Instruction Answer Combination Rankings
Ranking Version 1 Version 2 z-score 1 CA 26% CC 33% -1.68 2 AA 25% CA 23% 0.51 3 CC 22% AA 21% 0.3 4 AC 5% AC 6% -0.36 5 AE 4% BC 6% -0.78 6 BC 4% BA 3% 0.85 7 BA 3% CB 3% 0.26 8 CE 3% BB 2% 0.57 9 CD 2% CE 2% 0.21 10 DC 2% CD 1% 0.6 11 BB 1% AB 1% 0.15 12 CB 1% 13 DD 1% 14 AB 1%
Pre-Instruction Scores
Version 1 Version 2 z-score 100% 25% 21% 0.97 50% 31% 29% 0.63 0% 44% 50% -1.39

71
Post-Instruction Answer Combination Results Version 1 Version 2 z-score
AA 48 43% 32 30% 1.96 AB 2 2% 1 1% 0.54 AC 2 2% 3 3% -0.51 AD 0 0% 0 0% AE 2 2% 0 0% 1.43 BA 3 3% 6 6% -1.10 BB 2 2% 2 2% -0.06 BC 2 2% 3 3% -0.51 BD 0 0% 0 0% BE 0 0% 0 0% CA 38 34% 39 37% -0.45 CB 0 0% 5 5% -2.29 CC 12 11% 13 12% -0.36 CD 0 0% 0 0% CE 0 0% 1 1% -1.00
Post-Instruction Answer Combination Rankings
Ranking Version 1 Version 2 z-score 1 AA 43% CA 37% 0.92 2 CA 34% AA 30% 0.59 3 CC 11% CC 12% -0.36 4 BA 3% BA 6% -1.10 5 AB 2% CB 5% -1.22 6 AC 2% AC 3% -0.51 7 AE 2% BC 3% -0.51 8 BB 2% BB 2% -0.06 9 BC 2% AB 1% 0.54 10 CE 1% 0.00
Post-Instruction Scores
Version1 Version 2 z-score 100% 43% 30% 1.963 50% 36% 40% -0.600 0% 21% 30% -1.496