The effect of packing phase and mold temperature on the ...
11
Vol.:(0123456789) SN Applied Sciences (2019) 1:598 | https://doi.org/10.1007/s42452-019-0615-0 Research Article The effect of packing phase and mold temperature on the directional warpage of spherical lenses using the injection molding process H. Barghikar 1 · P. Mosaddegh 1 · M. Masoumi 2 · M. Ranjbar 3 © Springer Nature Switzerland AG 2019 Abstract This study investigated the directional warpage on bi-convex and bi-concave spherical lenses by experimentally moni- toring the changes in the pressure and temperature of mold cavity and comparing them with the simulation results. Warpage was investigated in the direction of the introduction of molten materials into the cavity of the mold, and when it was perpendicular to the direction of the fluid wave front. Packing conditions, including packing time and packing pressure, and mold temperatures are among the important factors influencing lens warpage and their geometric qual- ity. In this research, these factors were investigated in a full factorial design of experiment. Also, simulation results are in good agreement with the experimental results obtained by the vision measuring machine apparatus. According to the results of this study, the least warpage values in bi-convex and bi-concave lenses in the direction of the fluid wave front were 180 and 200 microns, respectively; while these values were 172 and 198 microns when the lenses were per- pendicular to the fluid wave front. The experimental values of these in the direction of the melt in the entrance of the mold for bi-convex and bi-concave lenses were 149 and 186 microns, respectively, while these values were 143 and 180 microns when the lenses were perpendicular to the flow front direction. In addition, the results of the pressure diagram inside the mold cavities indicated the correlation with the warpage, such that when the slope of the pressure graph was lower, the lens warpage was less too. Keywords Warpage · Polymeric lens · Injection molding · Packing pressure · Mold cavity 1 Introduction The injection molding process is very important for the mass production of polymeric lenses due to the high pro- duction rate and the low cost of the final products. The application of these lenses is obvious in optoelectronic devices such as mobile phones, tablets, and so on. There is, however, a complex relationship between the injection parameters and the quality of molded plastic spherical lenses in the injection molding process [1–3]. So, charac- teristics such as warpage, shrinkage, residual stress and birefringence need to be addressed. So far, various factors influencing injection molding parameters have been con- sidered, such as injection velocity, melt temperature, mold temperature, packing pressure and cooling time, to get the optimum geometric quality of polymeric lenses [2, 4–6]. Lu and Khim [7], studied the warpage of meniscus concave lens, finding an optimal level of injection param- eters to improve the geometric quality with 3 factors of injection parameters; these included injection velocity, packing pressure and mold temperature at 2 different levels, according to the research carried out in this field. According to the results, the mold temperature could be regarded as the most important parameter affecting the Received: 1 January 2019 / Accepted: 14 May 2019 * P. Mosaddegh, [email protected]; H. Barghikar, [email protected]; M. Masoumi, [email protected]; M. Ranjbar, ranjbar@ cc.iut.ac.ir | 1 Department of Mechanical Engineering, Isfahan University of Technology, Isfahan 8415683111, Iran. 2 Department of Chemical Engineering, Isfahan University of Technology, Isfahan 8415683111, Iran. 3 Department of Physics, Isfahan University of Technology, Isfahan 8415683111, Iran.
Transcript of The effect of packing phase and mold temperature on the ...

Vol.:(0123456789)
SN Applied Sciences (2019) 1:598 | https://doi.org/10.1007/s42452-019-0615-0
Research Article
The effect of packing phase and mold temperature on the directional warpage of spherical lenses using the injection molding process
H. Barghikar1 · P. Mosaddegh1 · M. Masoumi2 · M. Ranjbar3
© Springer Nature Switzerland AG 2019
AbstractThis study investigated the directional warpage on bi-convex and bi-concave spherical lenses by experimentally moni-toring the changes in the pressure and temperature of mold cavity and comparing them with the simulation results. Warpage was investigated in the direction of the introduction of molten materials into the cavity of the mold, and when it was perpendicular to the direction of the fluid wave front. Packing conditions, including packing time and packing pressure, and mold temperatures are among the important factors influencing lens warpage and their geometric qual-ity. In this research, these factors were investigated in a full factorial design of experiment. Also, simulation results are in good agreement with the experimental results obtained by the vision measuring machine apparatus. According to the results of this study, the least warpage values in bi-convex and bi-concave lenses in the direction of the fluid wave front were 180 and 200 microns, respectively; while these values were 172 and 198 microns when the lenses were per-pendicular to the fluid wave front. The experimental values of these in the direction of the melt in the entrance of the mold for bi-convex and bi-concave lenses were 149 and 186 microns, respectively, while these values were 143 and 180 microns when the lenses were perpendicular to the flow front direction. In addition, the results of the pressure diagram inside the mold cavities indicated the correlation with the warpage, such that when the slope of the pressure graph was lower, the lens warpage was less too.
Keywords Warpage · Polymeric lens · Injection molding · Packing pressure · Mold cavity
1 Introduction
The injection molding process is very important for the mass production of polymeric lenses due to the high pro-duction rate and the low cost of the final products. The application of these lenses is obvious in optoelectronic devices such as mobile phones, tablets, and so on. There is, however, a complex relationship between the injection parameters and the quality of molded plastic spherical lenses in the injection molding process [1–3]. So, charac-teristics such as warpage, shrinkage, residual stress and birefringence need to be addressed. So far, various factors
influencing injection molding parameters have been con-sidered, such as injection velocity, melt temperature, mold temperature, packing pressure and cooling time, to get the optimum geometric quality of polymeric lenses [2, 4–6]. Lu and Khim [7], studied the warpage of meniscus concave lens, finding an optimal level of injection param-eters to improve the geometric quality with 3 factors of injection parameters; these included injection velocity, packing pressure and mold temperature at 2 different levels, according to the research carried out in this field. According to the results, the mold temperature could be regarded as the most important parameter affecting the
Received: 1 January 2019 / Accepted: 14 May 2019
* P. Mosaddegh, [email protected]; H. Barghikar, [email protected]; M. Masoumi, [email protected]; M. Ranjbar, [email protected] | 1Department of Mechanical Engineering, Isfahan University of Technology, Isfahan 8415683111, Iran. 2Department of Chemical Engineering, Isfahan University of Technology, Isfahan 8415683111, Iran. 3Department of Physics, Isfahan University of Technology, Isfahan 8415683111, Iran.

Vol:.(1234567890)
Research Article SN Applied Sciences (2019) 1:598 | https://doi.org/10.1007/s42452-019-0615-0
contour error (warpage) of the molded lens. Tsai et al. [8] studied the geometric quality and warpage of a plano-convex lens in order to find the optimal level of parameters with 8 factors in 3 different levels. The results of this study indicated that the most important factor in the warpage of the lenses was packing pressure. Spain et al. [9] also investigated the warpage of a plano-convex lens and a bi-convex lens with the changes in the injection param-eters, and the peak to valley (PV) level was measured; finally, a model for improving the quality of lens produc-tion was presented. The results of this research showed that the most important factors affecting the total war-page were packing pressure and packing time. Tsai et al. [10] also studied the warpage of a plano-convex lens and investigated the pressure profile in the mold cavity. The results of this study showed that the melt and mold temperature and packing time were the most important parameters influencing the warpage and the accuracy of lenses. Mosaddegh et al. investigated the geometric and optical quality of a bi-convex lens produced by the injec-tion molding process. According to their results, the fac-tors simultaneously affecting the geometric quality and the optical quality of these types of lenses were the melt temperature, packing time, injection pressure and pack-ing pressure, respectively. These factors indicated that the simultaneous control of the pressure, in the mold cavity, both during the injection and at the packing stage, could be the solution for suitable injection with the minimal optical errors [11].
Warpage is due to the different volumetric shrinkage along the piece. In fact, the warpage in the piece can be due to the differential effects or area shrinkage and directional effects. Shrinkage changes from one region to another, which is because of the difference in the cooling rate of the piece, refer to the differential shrinkage. Differ-ential shrinkage arises from the calculation of volumetric shrinkage in the entire lens, resulting in the total warpage [12–15].
As it is known, several parameters play a role in deter-mining the geometric quality of the lenses, especially their warpage. Among them, the packing phase has the great-est effect. The mold temperature is also considered a pri-ority due to the direct impact of the polymer melt. There-fore, this research focused on these factors. The directional effects are due to the variations in the volumetric shrink-age along the molten flow and in a direction perpendicu-lar to it, which can be parallel or perpendicular to the flow of materials. What has been studied in this research is the existence of these directional effects on the lens warpage; in fact, the less the directional warpage and the closer its magnitudes to each other, the better the geometric qual-ity of the lens; also, the dimensional tolerances for install-ing in the optic systems are better. A careful study of the
directional effects of warpage can improve the geometric quality of polymer lenses and dimensional tolerances, especially in the injection molding process.
2 Methodology
Various factors contribute to the formation of warpage in the polymer lenses. 2 factors of packing (holding) pressure, including packing time (packing conditions in the injec-tion molding) and mold temperatures have the greatest impact on the overall complexity of the lenses. Of course, parameters such as the melting temperature of the poly-mer also play a role in this regard. The main focus of this study was, therefore, to examine the injection conditions in the packing phase. With several experiments, a 2 level process window was developed for these 3 factors, based on Table 1. Other injection parameters including the injec-tion pressure, the injection time and the constant cooling time were fixed and considered based on Table 2. To inves-tigate the effect of these three parameters, the full factorial method with 8 (2 ^ 3) tests was designed.
The basis for selecting levels was a large number of experiments. The filling of the cavities should be con-sonant, without any air trap or weld lines in the molded lenses. For example, the packing time was chosen in such a way that, firstly, the cavities would be 100% filled; second, the molten gate of the polymer could be blocked to the mold cavity. Also, according to the initial analysis results, it took about 100 s for 100% of the layers to freeze and reach the glass transition temperature, which was the basis for choosing the cooling level. The temperature range of the mold was chosen in such a way to show an interferometry pattern of lenses surface with a minimum peak to valley (PV) value less than 10 microns. This means that selecting temperatures below 80 °C and more than 90 °C, according to the injection conditions and the experimental results,
Table 1 Factors and levels used in the experiments
Factors Level 1 Level 2
Mold temperature (°C) 80 90Packing pressure (MPa) 90 100Packing time (s) 8 12
Table 2 Values for other injection parameters
Melt temperature(°C) 230
Injection pressure (MPa) 90Injection time (s) 6.5Cooling time (s) 100

Vol.:(0123456789)
SN Applied Sciences (2019) 1:598 | https://doi.org/10.1007/s42452-019-0615-0 Research Article
will not lead to the desired surface quality of spherical lenses.
The material used in this study was PMMA (Sumipex HT55X) amorphous polymer [16]. Also, the Kistler 6189A temperature–pressure sensor was located in the mold cav-ity of both lenses. The main application of this sensor was to record the pressure changes during the injection up to the end of the packing time.
Finally, the main objective of this study is to investi-gate irregular surface by measuring directional warpage, focusing on three main parameters of injection molding for spherical lenses. The lowest directional warpage and its maximum value are discussed with the trend analysis of the pressure diagram inside the mold cavity. Using this method to prevent the high cost of measuring lenses indi-vidually can be reliable, From the study of the trend of the molding cavity pressure variations, details of the injection conditions can be found [10]. Figure 1 shows a schematic diagram of the mold cavity pressure.
The molded lenses from the experiments were accu-rately measured with the vision measuring machine (pro-file projector); the results were compared with the simula-tions obtained from the Moldflow Insight software. Then, the least warpage in the direction of flow and that perpen-dicular to it has been discussed.
3 Experiments
These experiments were performed with a 4-cavity mold, as shown in Fig. 2. The pressure sensor was installed in the middle of the lenses, as illustrated in Fig. 3. The cavities of this mold were two by two geometrically identical and opposite of each other. The main parameters of the lenses geometry are presented in Table 3 and Fig. 4.
The injection process parameters were obtained according to the conditions of the tests in Table 4. Figure 5
shows bi-convex and bi-concave molded lenses as well as the desired direction of measurement. The lenses were measured twice, once parallel to the melted polymer flow, and once in a vertical position, by the vision measuring machine. The results of these measurements are presented in Table 5.
Due to the shape of the holes in the mold, the Y axis for the bi-convex lenses was parallel to the material flow and the X axis was perpendicular to it, while it was oppo-site for the bi-concave lenses. It is clear from Table 5 that for both lenses, the experiment no. 2 had the highest
Fig. 1 Determining different injection phases based on a schematic of the trend of mold cavity pressure
Fig. 2 The 4-cavity mold for injecting bi-convex and bi-concave spherical lenses
Fig. 3 The position of the sensor in the lens mold cavity
Table 3 The main values of the lens geometry designed for this research
Radius curvature (mm)
Lens thickness (mm)
Lens diameter (mm)
Bi-convex 220 4.22 36.5Bi-concave 220 3.98 36.5

Vol:.(1234567890)
Research Article SN Applied Sciences (2019) 1:598 | https://doi.org/10.1007/s42452-019-0615-0
directional deviation, while the experiment no. 5 showed the lowest one. The difference between the minimum and maximum dimensional deviation was 26 and 33 microns, respectively, in the bi-convex lens. The difference was between 27 and 30 microns for the bi-concave lens too. This difference in the lens layout in an optical system cre-ated the optical aberrations. Comparing the results of the experiment no. 5, with a mold temperature of 80 °C and a packing pressure of 100 MPa over a period of 8 s, with the experiment no. 2, with a mold temperature of 90 °C and a packing pressure of 90 MPa for 12 s, indicated that an increase in packing time could not necessarily trigger the reduced warpage. Also, the high mold temperature could not help this procedure. Instead, the temperature of the mold should be determined according to the polymer conditions and its properties. It could also be observed that in the case of the least deviations, the values of both directional warpages were close together and the lens had a better fit in line with direction. The difference in this value was 8 microns in the bi-convex lens and 2 microns in the bi-concave one.
Due to the fact that the minimum warpage value is specified in bi-convex and bi-concave lenses, and the
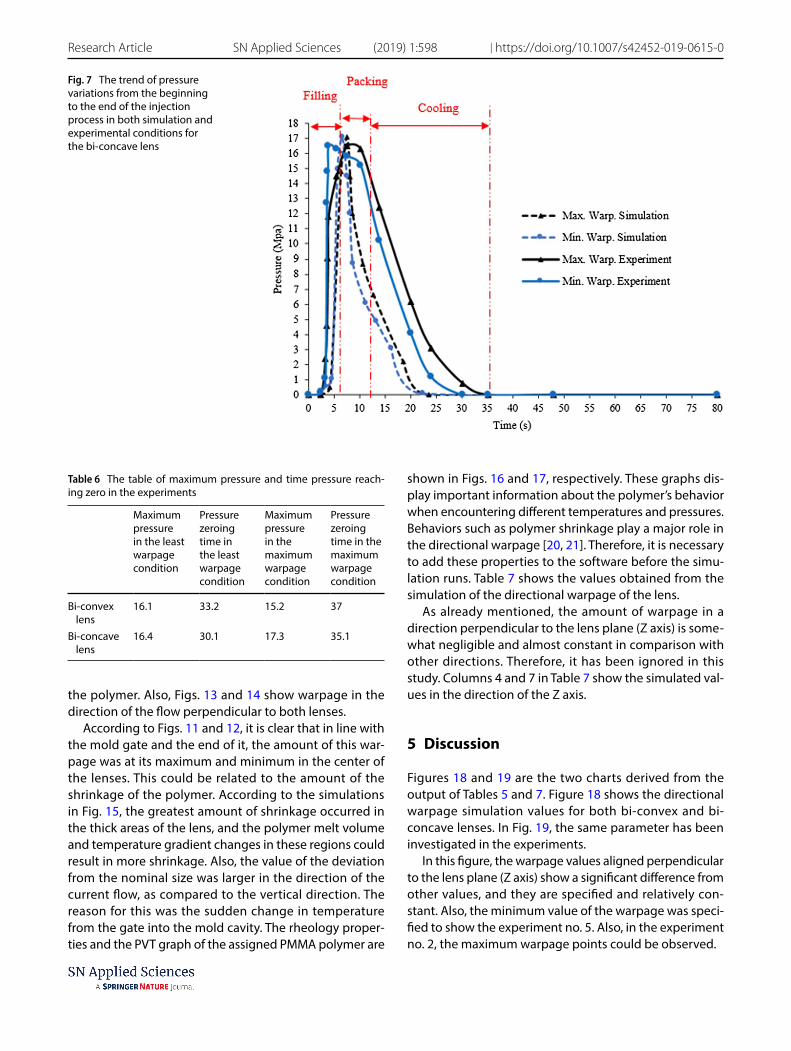
test conditions creating it are also specified, tracing the trend of pressure variations in the mold cavity could greatly help the production process [17–19]. Therefore, by placing the piezoelectric pressure sensor (the shape and method of installation can be seen in the experi-ments section) in the mold cavity, the output values could be recorded. Figures 6 and 7 show two trends in the pressure variations in the mold cavity from the start to the end of injection in both simulation and experi-mental states. Further, the range of injection phases included filling, packing and cooling stages, as shown in the pressure graphs.
The path that had the circle mark in both simulation and experimental modes represented the minimum warpage. As previously noted, longer packing times could not reduce warpage. In other words, it could be determined that if the pressure in each injection fol-lows the trend of the above diagrams, the lenses may have the least directional warpage. A difference of 5 and 7 s could be seen in the experimental and simulation trend, depending on the sensor conditions. However, the methods of slope reduction and the maximum pressure
Fig. 4 Geometric dimensions of bi-convex and bi-concave spheri-cal Lenses
Table 4 Number and conditions of experiments
Melt tempera-ture
Packing pressure
Packing time Mold tempera-ture
Injection pressure
Injection time Cooling time
Exp. No-1 230 90 8 80 90 6.5 100Exp. No-2 230 90 12 80 90 6.5 100Exp. No-3 230 90 8 90 90 6.5 100Exp. No-4 230 90 12 90 90 6.5 100Exp. No-5 230 100 8 80 90 6.5 100Exp. No-6 230 100 12 80 90 6.5 100Exp. No-7 230 100 8 90 90 6.5 100Exp. No-8 230 100 12 90 90 6.5 100
Fig. 5 Injected lenses designed by the 4-cavity mold

Vol.:(0123456789)
SN Applied Sciences (2019) 1:598 | https://doi.org/10.1007/s42452-019-0615-0 Research Article
points were consistent with each other. Table 6 shows the important numerical values in tracing the mold cav-ity pressure.
According to the data in Table 6, the amount of pressure in the mold cavity with the least directional warpage for both lenses was close to each other and is approximately 16 MPa. For the bi-convex lens, this pressure was 33 s until closing the gate and 30 s for the bi-concave lens.
In this research, the focus was to study the pressure conditions inside the mold cavity and its role in warpage. The simulations also showed the pressure drop in the run-ner system and the mold cavity. For example, Figs. 8 and 9 show the pressure variations in the bi-concave lens from the runners to the mold cavity. According to the Figs. 8 and 9, the amount of pressure drop from the first runner to the final gate was such that in the mold cavity, the 65–70% pressure drop occurred. Changes in packing conditions
also cause changes in the pressure diagrams. In other words, changes in the low range during packing pressure will have a huge impact on the directional warpage.
4 Simulations
Simulation of the injection molding process was per-formed using the Moldflow Insight 2016 software. The simulation considered runners, gates, and sprues with a total of 1602279 meshes and a size of 0.75 mm, as shown in Fig. 10.
The directional warpage varied, as depicted in Figs. 11 and 12, which are related to the test no. 2,with the high-est deviation for bi-convex and bi-concave lenses, thereby showing the contour of warpage along the melt flow of
Table 5 The results of the dimension measurement of lenses
Bi-convex Bi-concave
Dimensional variation in the per-pendicular material flow (X)
Dimensional variation in the material flow (Y)
Dimensional variation in the material flow (X)
Dimensional variation in the perpendicular material flow (Y)
1 182 195 198 1922 198 213 230 2253 174 198 217 2204 175 205 224 2005 172 180 200 1986 172 208 221 1957 182 195 218 2168 162 195 221 215
Fig. 6 The trend of pressure variations from the beginning to the end of the injection process in both simulation and experimental conditions for the bi-convex lens
Vol:.(1234567890)
Research Article SN Applied Sciences (2019) 1:598 | https://doi.org/10.1007/s42452-019-0615-0
the polymer. Also, Figs. 13 and 14 show warpage in the direction of the flow perpendicular to both lenses.
According to Figs. 11 and 12, it is clear that in line with the mold gate and the end of it, the amount of this war-page was at its maximum and minimum in the center of the lenses. This could be related to the amount of the shrinkage of the polymer. According to the simulations in Fig. 15, the greatest amount of shrinkage occurred in the thick areas of the lens, and the polymer melt volume and temperature gradient changes in these regions could result in more shrinkage. Also, the value of the deviation from the nominal size was larger in the direction of the current flow, as compared to the vertical direction. The reason for this was the sudden change in temperature from the gate into the mold cavity. The rheology proper-ties and the PVT graph of the assigned PMMA polymer are
shown in Figs. 16 and 17, respectively. These graphs dis-play important information about the polymer’s behavior when encountering different temperatures and pressures. Behaviors such as polymer shrinkage play a major role in the directional warpage [20, 21]. Therefore, it is necessary to add these properties to the software before the simu-lation runs. Table 7 shows the values obtained from the simulation of the directional warpage of the lens.
As already mentioned, the amount of warpage in a direction perpendicular to the lens plane (Z axis) is some-what negligible and almost constant in comparison with other directions. Therefore, it has been ignored in this study. Columns 4 and 7 in Table 7 show the simulated val-ues in the direction of the Z axis.
5 Discussion
Figures 18 and 19 are the two charts derived from the output of Tables 5 and 7. Figure 18 shows the directional warpage simulation values for both bi-convex and bi-concave lenses. In Fig. 19, the same parameter has been investigated in the experiments.
In this figure, the warpage values aligned perpendicular to the lens plane (Z axis) show a significant difference from other values, and they are specified and relatively con-stant. Also, the minimum value of the warpage was speci-fied to show the experiment no. 5. Also, in the experiment no. 2, the maximum warpage points could be observed.
Fig. 7 The trend of pressure variations from the beginning to the end of the injection process in both simulation and experimental conditions for the bi-concave lens
Table 6 The table of maximum pressure and time pressure reach-ing zero in the experiments
Maximum pressure in the least warpage condition
Pressure zeroing time in the least warpage condition
Maximum pressure in the maximum warpage condition
Pressure zeroing time in the maximum warpage condition
Bi-convex lens
16.1 33.2 15.2 37
Bi-concave lens
16.4 30.1 17.3 35.1

Vol.:(0123456789)
SN Applied Sciences (2019) 1:598 | https://doi.org/10.1007/s42452-019-0615-0 Research Article
Comparing the 2 charts of Figs. 18 and 19 reveals that the trends of the experiments and simulations diagrams were the same, both confirming each other. This means that experiment no. 5 conditions led to the minimum warpage. It is also clear that the warpage values did not fluctuate in the vertical direction of the flow in the bi-concave lens, because the rate of temperature variation in the vertical direction of the flow in the bi-concave lens was not high. Also, the numerical values in the experi-ment no. 5 conditions for both lenses, in both directions, were close to each other and close to the simulation.
Fig. 8 The trend of pressure in the feeding system and mold cavity for bi-concave lenses at maximum warpage
Fig. 9 Investigating the trend of pressure in the feeding system and mold cavity for bi-concave lenses at minimum warpage
Fig. 10 Meshing the mold cavity and the 4-cavity-mold feeding system

Vol:.(1234567890)
Research Article SN Applied Sciences (2019) 1:598 | https://doi.org/10.1007/s42452-019-0615-0
6 Conclusions
1. The conditions in which the lenses exhibited the least warpage, according to the results, consisted of a melting temperature of 230 °C, a mold temperature of 80 °C, and a 90 MPa injection pressure in 6.5 s, with a packing pressure of 100 MPa in 8 s. These data were, therefore, in a good agreement with the simulation results, proving that this methodology could be a good tool to predict the lens warpage. The high tem-perature of the mold and the increase in the packing
time may not reduce the directional warpage and the minimum level could be limited. In the mentioned conditions, the directional warpage of the lens was minimum and in both directions, parallel to the flow direction and perpendicular to it, the values were close to each other. The directional warpage difference was 8 μm for the bi-convex lens and 2 μm for the bi-con-cave lens. Due to the important role of the directional warpage in the installation of the continuous optic sys-tems, the pressure has been traced within the mold cavity.
Fig. 11 Warpage of the bi-convex lens in the direction of melt flow—the total deviation of 194 microns
Fig. 12 Warpage of the bi-concave lens in the direction of the melt flow—the total deviation of 213 microns
Fig. 13 Warpage of the bi-convex lens perpendicular to the melt flow-the total deviation of 187 microns
Fig. 14 Warpage of the bi-concave lens perpendicular to the melt flow—the total deviation of 207 microns

Vol.:(0123456789)
SN Applied Sciences (2019) 1:598 | https://doi.org/10.1007/s42452-019-0615-0 Research Article
2. The trend diagram of the pressure showed that the increase in the time required to make the pressure caused by packing time reach zero was directly related to the directional warpage. In other words, the direc-tion of diagram in the X axis (the time axis) could be important, such that in the experiments, this differ-ence for the maximum and minimum warpage in the bi-convex lens was 4 s, while for the bi-concave lens, this was 5 s (lower values could result in the minimal directional warpage).
3. The packing condition, despite the low 10 MPa range, had an intensive effect on the reduction of directional
warpage, so that with a 10% change in these condi-tions, the warpage improved approximately 30% in the experiments along the X and Y directions for the bi-convex and bi-concave lenses.
4. Injection pressure was different from the mold cavity pressure. The difference between the maximum mold cavity pressure for the most and least amounts of directional warpage in both lenses was about 1 MPa. However, for the bi-convex lens, the minimum war-page was 1.1 MPa greater than its maximum, and for the bi-concave lens, it was opposite. So, the minimum amount of warpage was 0.9 MPa less than its maxi-
Fig. 15 Lens shrinkage volume after the end of the cooling phase
Fig. 16 Viscosity graph versus shear rate at different temperaturesFig. 17 Polymer behavior properties at different pressures of PVT

Vol:.(1234567890)
Research Article SN Applied Sciences (2019) 1:598 | https://doi.org/10.1007/s42452-019-0615-0
Table 7 The warpage values obtained from the simulation of the lenses
Convex Concave
Dimensional variation in the perpendicular material flow (X)
Dimensional varia-tion in the material flow (Y)
Dimensional variation in the Z direction
Dimensional varia-tion in the material flow (X)
Dimensional varia-tion in the perpen-dicular material flow (Y)
Dimensional variation in the Z direction
X Y Z X Y Z
1 170 177 24 198 198 262 187 194 24 213 207 313 169 176 24 197 193 284 163 175 22 203 198 295 143 149 20 186 180 266 145 150 21 196 192 287 168 165 22 205 199 308 145 150 20 190 185 26
Fig. 18 Simulated directional warpage values
Fig. 19 Measured warpage values in the experiments
Vol.:(0123456789)
SN Applied Sciences (2019) 1:598 | https://doi.org/10.1007/s42452-019-0615-0 Research Article
mum. This difference was related to the geometry of the lenses, as the surface curvature was changed in the position of the sensor.
5. The optimum level with the minimum directional war-page consisted of a melting temperature of 230 °C, a mold temperature of 80 °C, and a 90 MPa injection pressure in 6.5 s, with a packing pressure of 100 MPa in 8 s.
Compliance with ethical standards
Conflict of interest The authors declare that they have no conflict of interest.
References
1. Sortino M, Totis G, Kuljanic E (2014) Comparison of injection molding technologies for the production of micro-optical devices. Procedia Eng 69:1296–1305. https ://doi.org/10.1016/j.proen g.2014.03.122
2. Young W-B (2005) Effect of process parameters on injec-tion compression molding of pickup lens. Appl Math Model 29(10):955–971. https ://doi.org/10.1016/j.apm.2005.02.004
3. J-q Li, D-q Li, Z-y Guo, H-y Lv (2007) Single gate optimization for plastic injection mold. J Zhejiang Univ-Sci A 8(7):1077–1083. https ://doi.org/10.1631/jzus.2007.A1077
4. Lee YB, Kwon TH (2001) Modeling and numerical simulation of residual stresses and birefringence in injection molded center-gated disks. J Mater Process Technol 111(1):214–218. https ://doi.org/10.1016/S0924 -0136(01)00524 -6
5. Tsai K-M (2013) Runner design to improve quality of plastic optical lens. Int J Adv Manuf Technol 66(1):523–536. https ://doi.org/10.1007/s0017 0-012-4346-2
6. Barghikar H, Mosaddegh P (2018) Experimental and simulation study on the optimum of the geometrical quality of bi-convex and bi-concave lenses produced by injection molding process. J Braz Soc Mech Sci Eng 41(1):24. https ://doi.org/10.1007/s4043 0-018-1530-9
7. Lu X, Khim Lau Soo (2001) A statistical experimental study of the injection molding of optical lenses. J Mater Process Technol 113(1):189–195. https ://doi.org/10.1016/S0924 -0136(01)00606 -9
8. Tsai K-M, Hsieh C-Y, Lo W-C (2009) A study of the effects of pro-cess parameters for injection molding on surface quality of
optical lenses. J Mater Process Technol 209(7):3469–3477. https ://doi.org/10.1016/j.jmatp rotec .2008.08.006
9. Spina R, Walach P, Schild J, Hopmann C (2012) Analysis of lens manufacturing with injection molding. Int J Precis Eng Manuf 13(11):2087–2095. https ://doi.org/10.1007/s1254 1-012-0276-z
10. Tsai K-M, Lan J-K (2015) Correlation between runner pressure and cavity pressure within injection mold. Int J Adv Manuf Tech-nol 79(1):273–284. https ://doi.org/10.1007/s0017 0-014-6776-5
11. Barghikar H, Mosadegh P, Ranjbar M, Masoumi M (2017) Inves-tigation and simulation of geometric and optical quality for bi-convex lens produced by injection molding process. Modares Mech Eng 17(12):21–32
12. © 2015 Autodesk I (2016) Autodesk Moldflow Insight/Synergy 2016
13. Bäumer S (2010) Handbook of plastic optics. WILEY-VCH Verlag GmbH & Co. KGaA, Weinheim, Federal Republic of Germany
14. Cellere A, Lucchetta G (2010) Identification of crims model parameters for warpage prediction in injection moulding sim-ulation. IntJ Mater Form 3(1):37–40. https ://doi.org/10.1007/s1228 9-010-0701-8
15. Namdari N, Mosaddegh P (2019) Experimental and simulation studies on the mold replicability in the thermoforming process. Journal of Polymer Engineering, vol 0. https ://doi.org/10.1515/polye ng-2018-0016
16. Singapore SC (2007) Sumipex (Acrilic Molding Resin). Singapore 17. Kazmer DO, Velusamy S, Westerdale S, Johnston S, Gao RX (2010)
A comparison of seven filling to packing switchover methods for injection molding. Polym Eng Sci 50(10):2031–2043. https ://doi.org/10.1002/pen.21731
18. Pramujati B, Dubay R, Samaan C (2006) Cavity pressure control during cooling in plastic injection molding. Adv Polym Technol 25(3):170–181. https ://doi.org/10.1002/adv.20068
19. Zhou X, Zhang Y, Mao T, Zhou H (2017) Monitoring and dynamic control of quality stability for injection molding process. J Mater Process Technol 249:358–366. https ://doi.org/10.1016/j.jmatp rotec .2017.05.038
20. Osswald TA, Menges G (2012) Material science of polymers for engineers. In: Material science of polymers for engineers (third edition). Hanser, pp I–XIX. https ://doi.org/10.3139/97815 69905 241.fm
21. Farotti E, Natalini M (2018) Influence of process parameters on mechanical properties of polypropylene polymer: a first study. Procedia Struct Integr 8:256–264. https ://doi.org/10.1016/j.prost r.2017.12.027
Publisher’s Note Springer Nature remains neutral with regard to jurisdictional claims in published maps and institutional affiliations.