Catalytic Steam Reforming of Methanol to Produce Hydrogen on Supported Metal Catalysts
Journal of Engineering and Sustainable Development Vol. 21, No. 04, July 2017 www.jeasd.org (ISSN 2520-0917)
147
THE EFFECT OF METHANOL BLENDED WITH GASOLINE ON
THE PERFORMANCE AND VIBRATION OF SPARK IGNITION
ENGINE
Dr. Fouad Alwan Saleh
1,* Dr. Fadhel Abbass Abdulah
2, Hajir Haitham Labeeb
3
1) Assist Prof., Mechanical Engineering Department, Al-Mustansiriyah University, Baghdad, Iraq.
2) Assist Prof., Mechanical Engineering Department, Al-Mustansiriyah University, Baghdad, Iraq.
3) Mechanical Engineering Department, Al-Mustansiriyah University, Baghdad, Iraq
Abstract: This study is an experimental investigation of the effects of methanol addition to gasoline on
the performance (brake power, brake specific fuel consumption), and emissions (carbon monoxide CO,
hydrocarbons HC) of a spark ignition engine, engine vibration was also measured (Acceleration) .The
tests were carried out at constant throttle variable speed condition operating with standard and advanced
spark timing (10˚ and 11˚ BTDC respectively) over the range of speed from 1500 to 2250 rpm and
compression ratios CR=8 and 9 using various blends of methanol/gasoline 0% (M0), 5% (M5), 10%
(M10), 15% (M15) and 20% (M20) methanol by volume .The experimental results showed that for
standard spark timing, maximum power was obtained at M10 CR9 by increase of (18.29%) from M0.
While for advanced spark timing, maximum power was obtained at M20 CR9 by an increase (18.27%)
from M0. Advancing spark timing resulted in power increase by (13.4%) from standard spark timing.
Optimum compression ratio for gasoline fuel was 8 while for methanol-gasoline blends was 9 .Emissions
of CO and HC were decreased significantly by using methanol as fuel additive and increasing methanol
content in the fuel. M0 exhibited the lowest and most stable acceleration level at higher engine speed at
CR8 (2000-2250 rpm). While for CR9, M5 generally showed the lowest acceleration values for lower and
higher engine speeds. M15 fuel blend, showed maximum acceleration level compared to other fuel
blends.
Keywords: methanol, performance, vibration, acceleration.
أداء واهتزازات محرك االشتعال بالشرارةتأثير خلط الميثانول مع وقود البنزين على
الحالية هي دراسة عملية لتأثير اضافة )كحول الميثانول الى وقود البنزين( على اداء المحرك )القدرة المكبحية، صرف الدراسة الخالصة:
كذلك قياس االهتزازات )التعجيل(. تم الوقود(، واالنبعاثات )احادي اوكسيد الكربون، دقائق الهيدروكربون( لمحرك االشتعال بالشرارة وتم
ان الهدف االساسي هو اختبار .اجراء التجارب العملية على محرك احادي االسطوانة، رباعي االشواط متغير نسبة االنضغاط موديل
الميثانول والبنزين. المحرك بنسب انضغاط متغيرة وتقديم توقيت الشرارة إليجاد االداء االمثل للمحرك بعد استخدام وقود جديد يتكون من
باستخدام عدة خلطات وقود من الميثانول و البنزين 9و 8دورة/دقيقة بنسب انضغاط 5501-0011تم اجراء االختبارات لمدى سرعة من
%( بينما عند 08.59بزيادة ) M10 CR9 %(. عند توقيت الشرارة القياسي تم الحصول على اعلى قدرة عند51% و %00، %01، 0)
ان تقديم توقيت الشرارة قد ادى الى .M0 %( عن08.51بزيادة ) M20 CR9 توقيت الشرارة تم الحصول على اعلى قدرة عند تقديم
البنزين -بينما خليط الميثانول 8%( عن توقيت الشرارة القياسي. ان نسبة االنضغاط المثلى للبنزين هي 1..0زيادة قدرة المحرك بنسبة )
اظهر ادنى مستوى M0قد انخفضت بصورة كبيرة بإضافة الميثانول الى البنزين وزيادة نسبته. ان HCو COان انبعاثات .9هي
اظهر ادنى مستوى اهتزازات عند سرع M5فإنه بصورة عامة CR9. بينما عند CR8اهتزازات واكثر استقرار عند السرع العالية عند
ة اهتزازات مقارنة بخلطات الوقود االخرى.فقد اظهر اعلى نسب M15المحرك العالية والواطئة. اما
*Corresponding Author [email protected]
www.jeasd.org
Vol. 21, No.04, July 2017
ISSN 2520-0917
Journal of Engineering and Sustainable Development Vol. 21, No. 04, July 2017 www.jeasd.org (ISSN 2520-0917)
148
1. Introduction
Even though fossil fuels are the primary energy source for most of the combustion
engines, there have been concerns about the future availability and environmental
impact of such fuels. For a long-term sustainability, the application of renewable fuels
in traditional combustion devices needs to be investigated to replace fossil fuels. In
engines, renewable fuels such as Methanol, Ethanol have been demonstrated as the
promising replacements of the nonrenewable petroleum fuels. Due to their good
characteristics, Methanol and Ethanol have been used to replace gasoline fuel in SI
engines[1]. In practice, to achieve the optimum emission level and performance,
renewable fuels are blended with petroleum fuels at different ratios in engine
applications [2]. The role of existing internal combustion engines needs to be reviewed
now in the context of these two major crises in present (future availability and
environmental impact of fossil fuels). In view of the versatility of internal combustion
engines, they will continue to dominate the existing transportation sector [3]. Over the
past decade, alternative fuels have been studied for the possibility of lower emission,
economy, better fuel availability and lower dependence on crude oil generated fuels.
Before any alternative fuels could be used as an alternative to petrol or diesel, it has to
full fill some criteria [4].Oxygenated fuels contain oxygen-bearing compounds
(alcohol). Ethanol, Methanol, is oxygenated fuels. Since these compounds add oxygen
to the air/fuel mixture, they artificially lean the air/fuel mixture, resulting in more
complete combustion and lower hydrocarbons [5].
Alcohol is an alternative transportation fuel since it has properties, which would
allow its use in existing engines with minor hardware modifications. Alcohols have
higher octane number than gasoline. A fuel with a higher octane number can endure
higher compression ratios before engine starts knocking, thus giving engine an ability to
deliver more power efficiently and economically [6]. Alcohol burns cleaner than regular
gasoline and produce lesser carbon monoxide, HC and oxides of nitrogen. Alcohol has
higher heat of vaporization; therefore, it reduces the peak temperature inside the
combustion chamber leading to lower NOx emissions and increased engine power. [7]
Methanol has many fuel properties that make it cleaner burning in gasoline engines.
Besides containing oxygen for cleaner fuel combustion, the methanol also has a high
blending octane for smoother burning, a lower boiling temperature for better fuel
vaporization in cold engine operation, the highest hydrogen to carbon ratio for lower
carbon intensity fuel, and no sulphur contamination which can poison the vehicle’s
catalytic converter. [8]
In this work, an investigation will be done to study the effect of blending methanol
on both engine vibration and performance by taking the effect of advancing the spark
timing and varying the compression ratio together, using new fuel consisting of gasoline
and methanol instead of only gasoline fuel.
Journal of Engineering and Sustainable Development Vol. 21, No. 04, July 2017 www.jeasd.org (ISSN 2520-0917)
149
2. Experimental Work
The objective of the experimental work is to study the effect of variable compression
ratio and spark timing for methanol blending with gasoline on the optimum
performance, emissions and vibration of single cylinder, 4 stroke SI engine. This will be
done by a series of experimental tests with varying of the engine parameters to find the
optimum and useful data.
The variables that could be changed were (compression ratio, spark timing, fuel
composition) for the range of engine velocity 1500-2250 with 250 rpm increment.
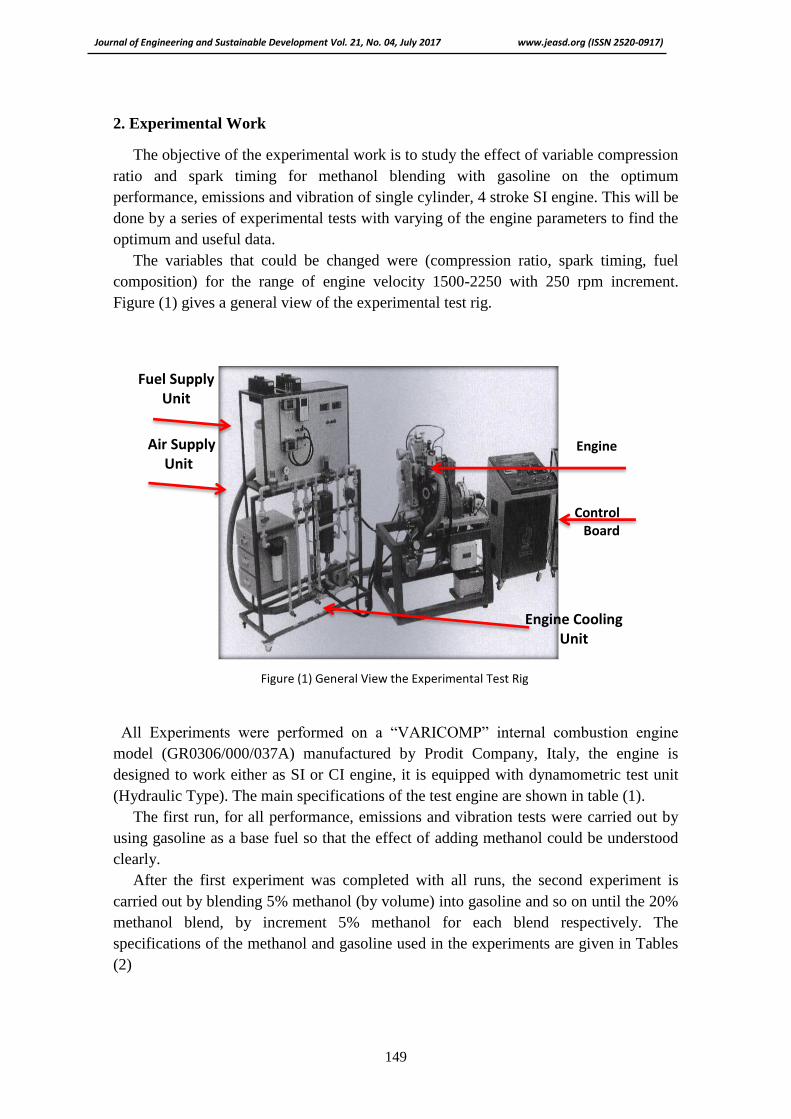
Figure (1) gives a general view of the experimental test rig.
All Experiments were performed on a “VARICOMP” internal combustion engine
model (GR0306/000/037A) manufactured by Prodit Company, Italy, the engine is
designed to work either as SI or CI engine, it is equipped with dynamometric test unit
(Hydraulic Type). The main specifications of the test engine are shown in table (1).
The first run, for all performance, emissions and vibration tests were carried out by
using gasoline as a base fuel so that the effect of adding methanol could be understood
clearly.
After the first experiment was completed with all runs, the second experiment is
carried out by blending 5% methanol (by volume) into gasoline and so on until the 20%
methanol blend, by increment 5% methanol for each blend respectively. The
specifications of the methanol and gasoline used in the experiments are given in Tables
(2)
Fuel Supply Unit
Air Supply Unit
Engine
Control Board
Engine Cooling Unit
Figure (1) General View the Experimental Test Rig
Journal of Engineering and Sustainable Development Vol. 21, No. 04, July 2017 www.jeasd.org (ISSN 2520-0917)
150
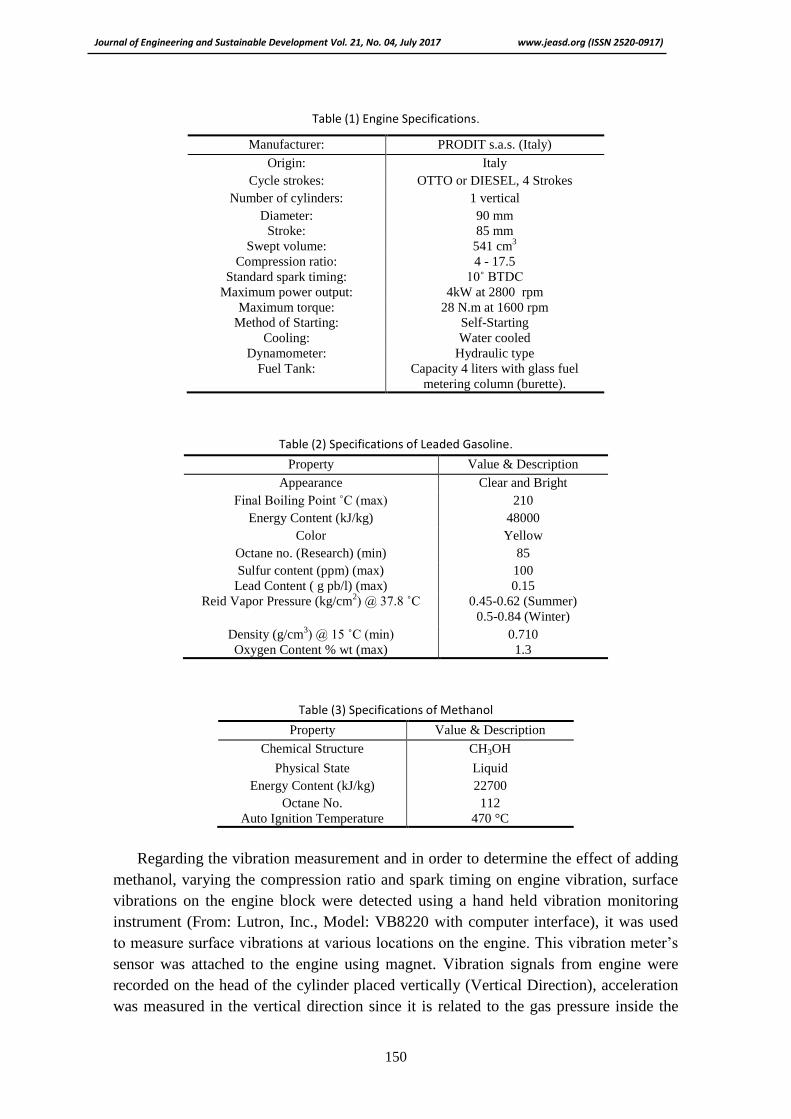
Table (1) Engine Specifications.
Manufacturer: PRODIT s.a.s. (Italy)
Origin: Italy
Cycle strokes: OTTO or DIESEL, 4 Strokes
Number of cylinders: 1 vertical
Diameter: 90 mm
Stroke: 85 mm
Swept volume: 541 cm3
Compression ratio: 4 - 17.5
Standard spark timing: 10˚ BTDC
Maximum power output: 4kW at 2800 rpm
Maximum torque: 28 N.m at 1600 rpm
Method of Starting: Self-Starting
Cooling: Water cooled
Dynamometer: Hydraulic type
Fuel Tank: Capacity 4 liters with glass fuel
metering column (burette).
Table (2) Specifications of Leaded Gasoline.
Property Value & Description
Appearance Clear and Bright
Final Boiling Point ˚C (max) 210
Energy Content (kJ/kg) 48000
Color Yellow
Octane no. (Research) (min) 85
Sulfur content (ppm) (max) 100
Lead Content ( g pb/l) (max) 0.15
Reid Vapor Pressure (kg/cm2) @ 37.8 ˚C 0.45-0.62 (Summer)
0.5-0.84 (Winter)
Density (g/cm3) @ 15 ˚C (min) 0.710
Oxygen Content % wt (max) 1.3
Table (3) Specifications of Methanol
Property Value & Description
Chemical Structure CH3OH
Physical State Liquid
Energy Content (kJ/kg) 22700
Octane No. 112
Auto Ignition Temperature 470 °C
Regarding the vibration measurement and in order to determine the effect of adding
methanol, varying the compression ratio and spark timing on engine vibration, surface
vibrations on the engine block were detected using a hand held vibration monitoring
instrument (From: Lutron, Inc., Model: VB8220 with computer interface), it was used
to measure surface vibrations at various locations on the engine. This vibration meter’s
sensor was attached to the engine using magnet. Vibration signals from engine were
recorded on the head of the cylinder placed vertically (Vertical Direction), acceleration
was measured in the vertical direction since it is related to the gas pressure inside the
Journal of Engineering and Sustainable Development Vol. 21, No. 04, July 2017 www.jeasd.org (ISSN 2520-0917)
151
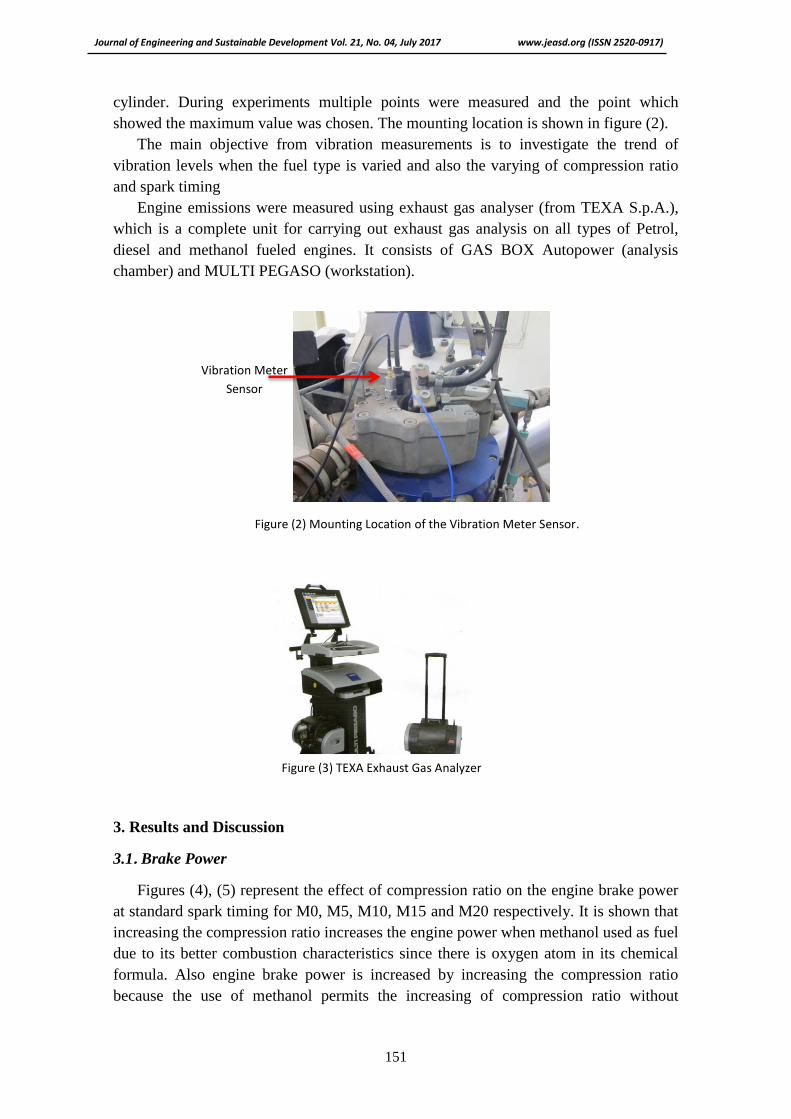
cylinder. During experiments multiple points were measured and the point which
showed the maximum value was chosen. The mounting location is shown in figure (2).
The main objective from vibration measurements is to investigate the trend of
vibration levels when the fuel type is varied and also the varying of compression ratio
and spark timing
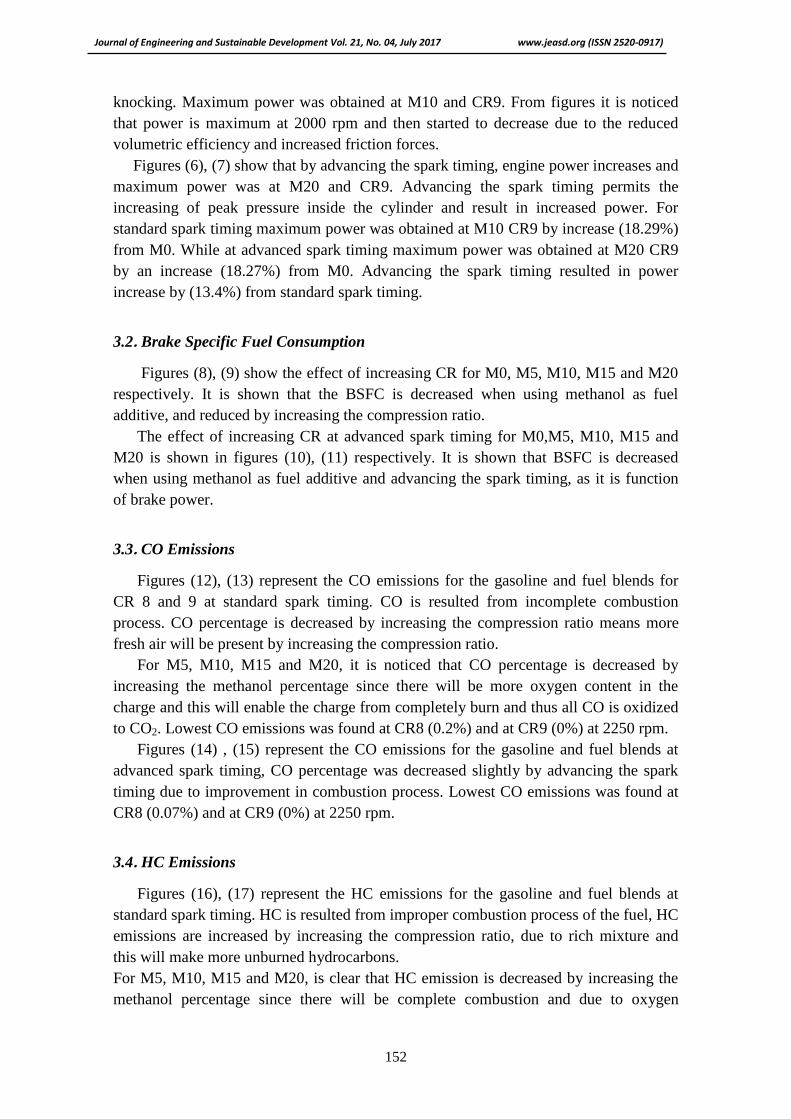
Engine emissions were measured using exhaust gas analyser (from TEXA S.p.A.),
which is a complete unit for carrying out exhaust gas analysis on all types of Petrol,
diesel and methanol fueled engines. It consists of GAS BOX Autopower (analysis
chamber) and MULTI PEGASO (workstation).
3. Results and Discussion
3.1. Brake Power
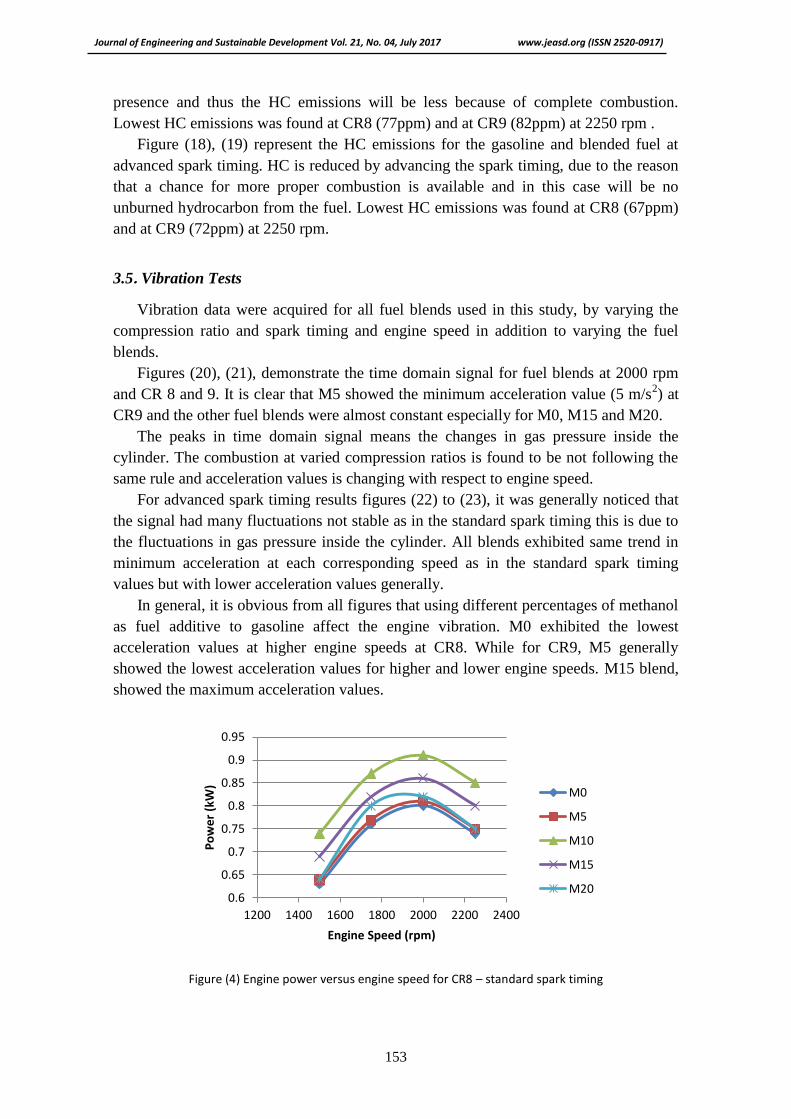
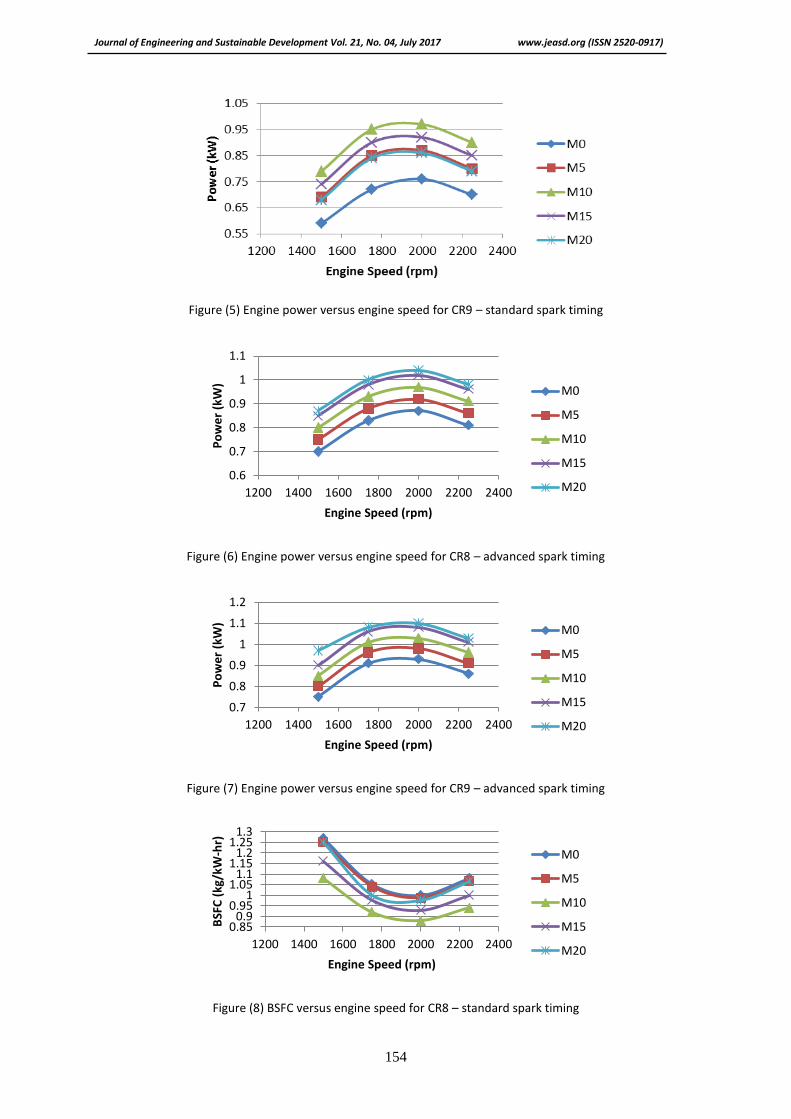
Figures (4), (5) represent the effect of compression ratio on the engine brake power
at standard spark timing for M0, M5, M10, M15 and M20 respectively. It is shown that
increasing the compression ratio increases the engine power when methanol used as fuel
due to its better combustion characteristics since there is oxygen atom in its chemical
formula. Also engine brake power is increased by increasing the compression ratio
because the use of methanol permits the increasing of compression ratio without
Figure (2) Mounting Location of the Vibration Meter Sensor.
Vibration Meter
Sensor
Figure (3) TEXA Exhaust Gas Analyzer
Journal of Engineering and Sustainable Development Vol. 21, No. 04, July 2017 www.jeasd.org (ISSN 2520-0917)
152
knocking. Maximum power was obtained at M10 and CR9. From figures it is noticed
that power is maximum at 2000 rpm and then started to decrease due to the reduced
volumetric efficiency and increased friction forces.
Figures (6), (7) show that by advancing the spark timing, engine power increases and
maximum power was at M20 and CR9. Advancing the spark timing permits the
increasing of peak pressure inside the cylinder and result in increased power. For
standard spark timing maximum power was obtained at M10 CR9 by increase (18.29%)
from M0. While at advanced spark timing maximum power was obtained at M20 CR9
by an increase (18.27%) from M0. Advancing the spark timing resulted in power
increase by (13.4%) from standard spark timing.
3.2. Brake Specific Fuel Consumption
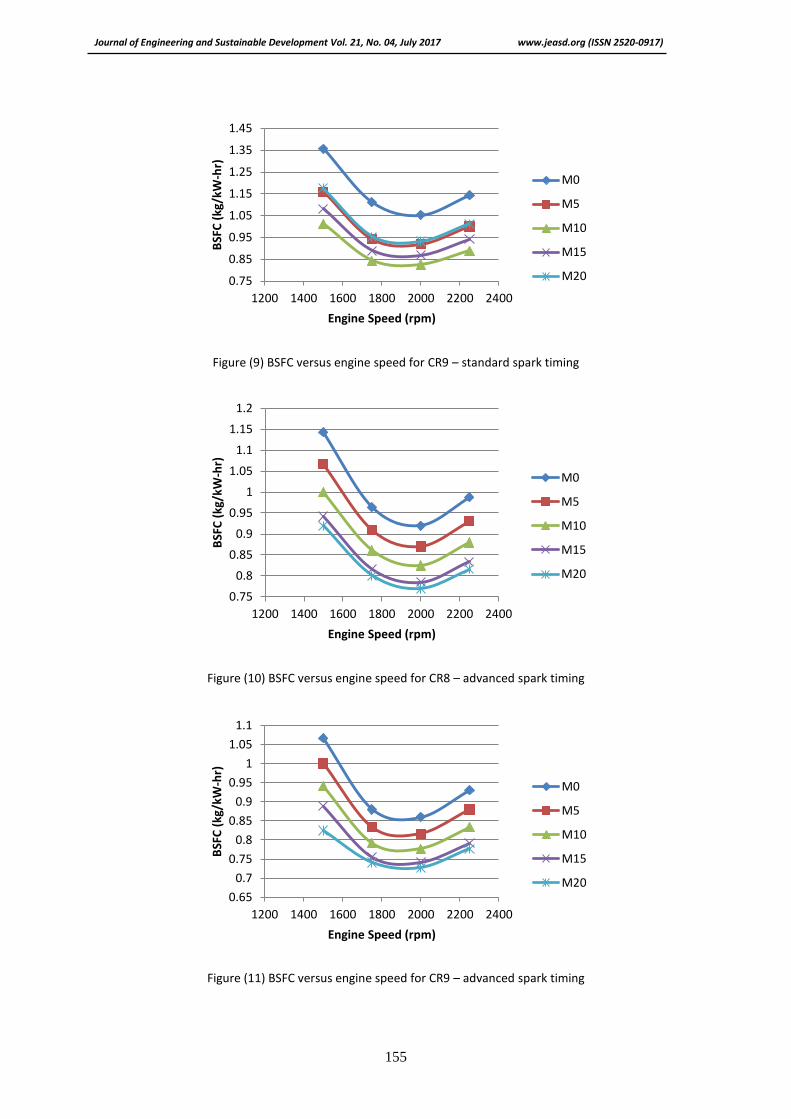
Figures (8), (9) show the effect of increasing CR for M0, M5, M10, M15 and M20
respectively. It is shown that the BSFC is decreased when using methanol as fuel
additive, and reduced by increasing the compression ratio.
The effect of increasing CR at advanced spark timing for M0,M5, M10, M15 and
M20 is shown in figures (10), (11) respectively. It is shown that BSFC is decreased
when using methanol as fuel additive and advancing the spark timing, as it is function
of brake power.
3.3. CO Emissions
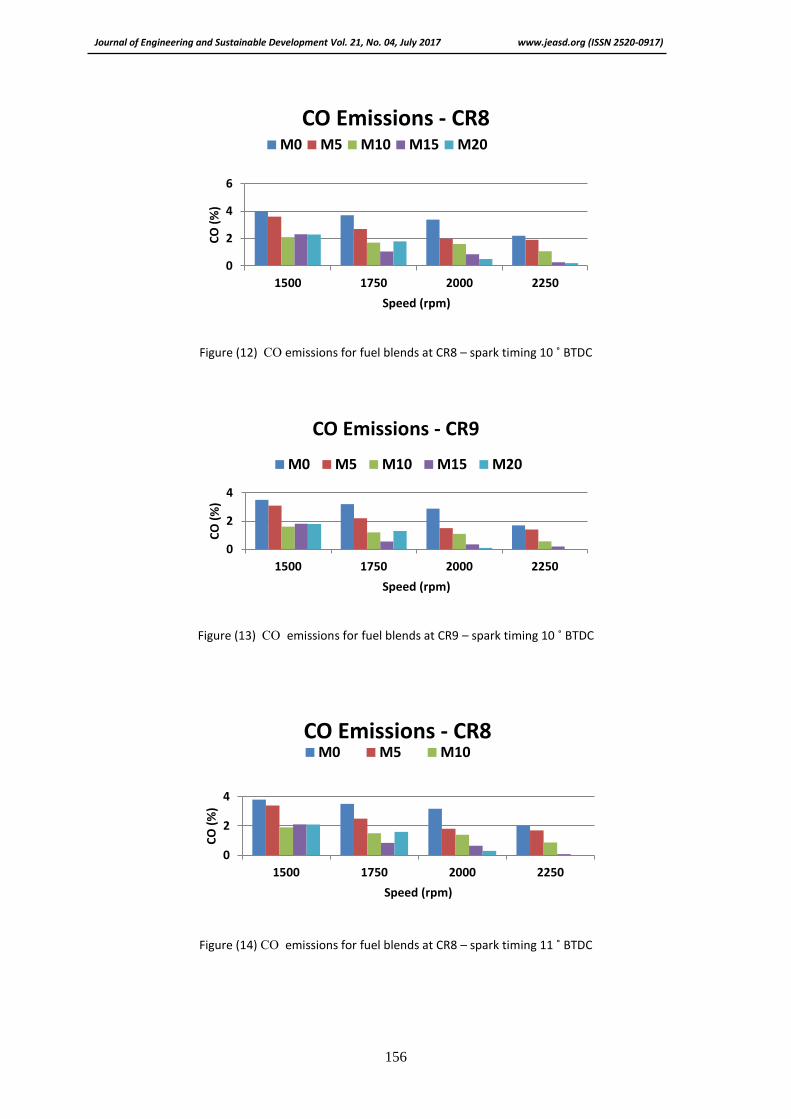
Figures (12), (13) represent the CO emissions for the gasoline and fuel blends for
CR 8 and 9 at standard spark timing. CO is resulted from incomplete combustion
process. CO percentage is decreased by increasing the compression ratio means more
fresh air will be present by increasing the compression ratio.
For M5, M10, M15 and M20, it is noticed that CO percentage is decreased by
increasing the methanol percentage since there will be more oxygen content in the
charge and this will enable the charge from completely burn and thus all CO is oxidized
to CO2. Lowest CO emissions was found at CR8 (0.2%) and at CR9 (0%) at 2250 rpm.
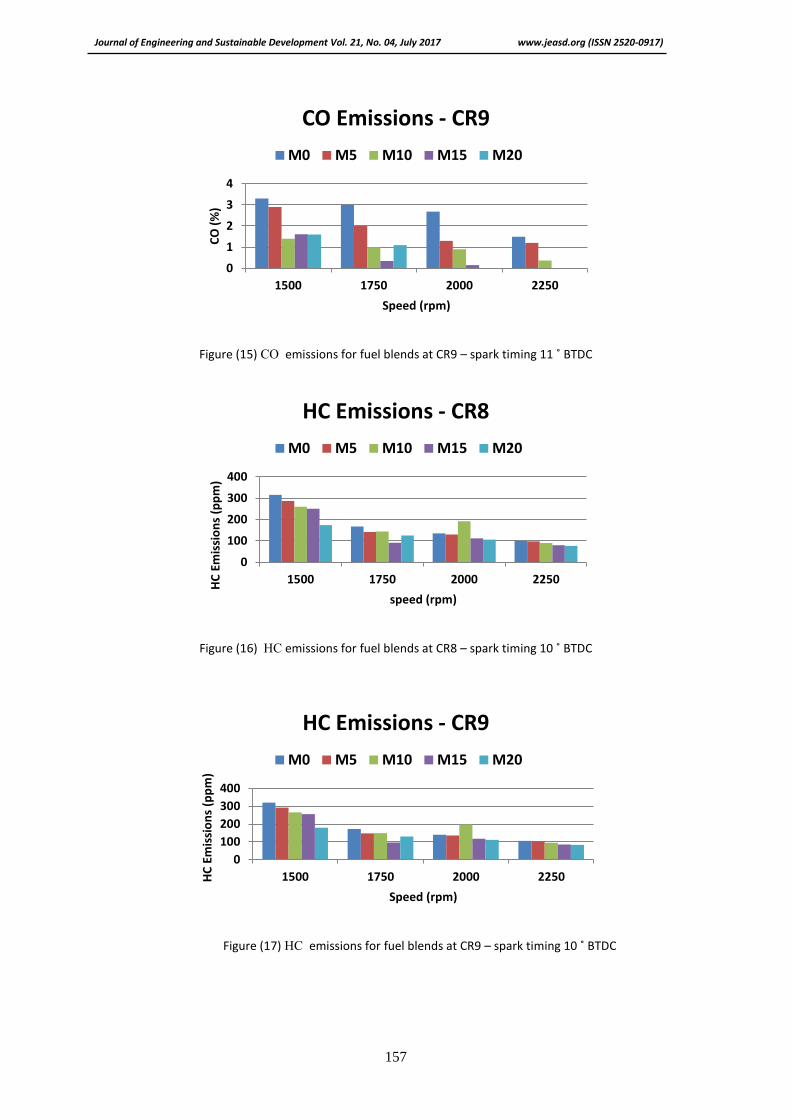
Figures (14) , (15) represent the CO emissions for the gasoline and fuel blends at
advanced spark timing, CO percentage was decreased slightly by advancing the spark
timing due to improvement in combustion process. Lowest CO emissions was found at
CR8 (0.07%) and at CR9 (0%) at 2250 rpm.
3.4. HC Emissions
Figures (16), (17) represent the HC emissions for the gasoline and fuel blends at
standard spark timing. HC is resulted from improper combustion process of the fuel, HC
emissions are increased by increasing the compression ratio, due to rich mixture and
this will make more unburned hydrocarbons.
For M5, M10, M15 and M20, is clear that HC emission is decreased by increasing the
methanol percentage since there will be complete combustion and due to oxygen
Journal of Engineering and Sustainable Development Vol. 21, No. 04, July 2017 www.jeasd.org (ISSN 2520-0917)
153
presence and thus the HC emissions will be less because of complete combustion.
Lowest HC emissions was found at CR8 (77ppm) and at CR9 (82ppm) at 2250 rpm .
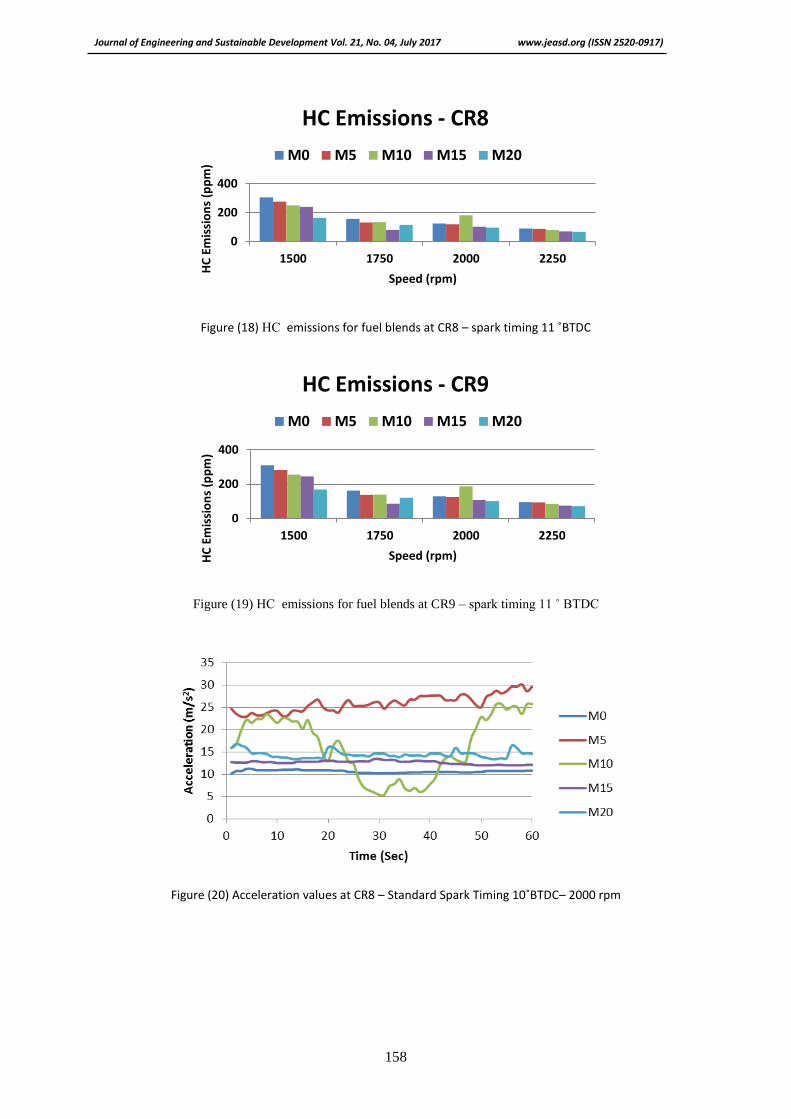
Figure (18), (19) represent the HC emissions for the gasoline and blended fuel at
advanced spark timing. HC is reduced by advancing the spark timing, due to the reason
that a chance for more proper combustion is available and in this case will be no
unburned hydrocarbon from the fuel. Lowest HC emissions was found at CR8 (67ppm)
and at CR9 (72ppm) at 2250 rpm.
3.5. Vibration Tests
Vibration data were acquired for all fuel blends used in this study, by varying the
compression ratio and spark timing and engine speed in addition to varying the fuel
blends.
Figures (20), (21), demonstrate the time domain signal for fuel blends at 2000 rpm
and CR 8 and 9. It is clear that M5 showed the minimum acceleration value (5 m/s2) at
CR9 and the other fuel blends were almost constant especially for M0, M15 and M20.
The peaks in time domain signal means the changes in gas pressure inside the
cylinder. The combustion at varied compression ratios is found to be not following the
same rule and acceleration values is changing with respect to engine speed.
For advanced spark timing results figures (22) to (23), it was generally noticed that
the signal had many fluctuations not stable as in the standard spark timing this is due to
the fluctuations in gas pressure inside the cylinder. All blends exhibited same trend in
minimum acceleration at each corresponding speed as in the standard spark timing
values but with lower acceleration values generally.
In general, it is obvious from all figures that using different percentages of methanol
as fuel additive to gasoline affect the engine vibration. M0 exhibited the lowest
acceleration values at higher engine speeds at CR8. While for CR9, M5 generally
showed the lowest acceleration values for higher and lower engine speeds. M15 blend,
showed the maximum acceleration values.
Figure (4) Engine power versus engine speed for CR8 – standard spark timing
0.6
0.65
0.7
0.75
0.8
0.85
0.9
0.95
1200 1400 1600 1800 2000 2200 2400
Po
we
r (k
W)
Engine Speed (rpm)
M0
M5
M10
M15
M20
Journal of Engineering and Sustainable Development Vol. 21, No. 04, July 2017 www.jeasd.org (ISSN 2520-0917)
154
Figure (5) Engine power versus engine speed for CR9 – standard spark timing
Figure (6) Engine power versus engine speed for CR8 – advanced spark timing
Figure (7) Engine power versus engine speed for CR9 – advanced spark timing
Figure (8) BSFC versus engine speed for CR8 – standard spark timing
0.6
0.7
0.8
0.9
1
1.1
1200 1400 1600 1800 2000 2200 2400
Po
we
r (k
W)
Engine Speed (rpm)
M0
M5
M10
M15
M20
0.7
0.8
0.9
1
1.1
1.2
1200 1400 1600 1800 2000 2200 2400
Po
we
r (k
W)
Engine Speed (rpm)
M0
M5
M10
M15
M20
0.850.9
0.951
1.051.1
1.151.2
1.251.3
1200 1400 1600 1800 2000 2200 2400
BSF
C (
kg/k
W-h
r)
Engine Speed (rpm)
M0
M5
M10
M15
M20
Journal of Engineering and Sustainable Development Vol. 21, No. 04, July 2017 www.jeasd.org (ISSN 2520-0917)
155
Figure (9) BSFC versus engine speed for CR9 – standard spark timing
Figure (10) BSFC versus engine speed for CR8 – advanced spark timing
Figure (11) BSFC versus engine speed for CR9 – advanced spark timing
0.75
0.85
0.95
1.05
1.15
1.25
1.35
1.45
1200 1400 1600 1800 2000 2200 2400
BSF
C (
kg/k
W-h
r)
Engine Speed (rpm)
M0
M5
M10
M15
M20
0.75
0.8
0.85
0.9
0.95
1
1.05
1.1
1.15
1.2
1200 1400 1600 1800 2000 2200 2400
BSF
C (
kg/k
W-h
r)
Engine Speed (rpm)
M0
M5
M10
M15
M20
0.65
0.7
0.75
0.8
0.85
0.9
0.95
1
1.05
1.1
1200 1400 1600 1800 2000 2200 2400
BSF
C (
kg/k
W-h
r)
Engine Speed (rpm)
M0
M5
M10
M15
M20
Journal of Engineering and Sustainable Development Vol. 21, No. 04, July 2017 www.jeasd.org (ISSN 2520-0917)
156
Figure (12) CO emissions for fuel blends at CR8 – spark timing 10 ˚ BTDC
Figure (13) CO emissions for fuel blends at CR9 – spark timing 10 ˚ BTDC
Figure (14) CO emissions for fuel blends at CR8 – spark timing 11 ˚ BTDC
0
2
4
6
1500 1750 2000 2250
CO
(%
)
Speed (rpm)
CO Emissions - CR8 M0 M5 M10 M15 M20
0
2
4
1500 1750 2000 2250
CO
(%
)
Speed (rpm)
CO Emissions - CR9
M0 M5 M10 M15 M20
0
2
4
1500 1750 2000 2250
CO
(%
)
Speed (rpm)
CO Emissions - CR8 M0 M5 M10
Journal of Engineering and Sustainable Development Vol. 21, No. 04, July 2017 www.jeasd.org (ISSN 2520-0917)
157
Figure (15) CO emissions for fuel blends at CR9 – spark timing 11 ˚ BTDC
Figure (16) CC emissions for fuel blends at CR8 – spark timing 10 ˚ BTDC
Figure (17) CC emissions for fuel blends at CR9 – spark timing 10 ˚ BTDC
0
1
2
3
4
1500 1750 2000 2250
CO
(%
)
Speed (rpm)
CO Emissions - CR9
M0 M5 M10 M15 M20
0
100
200
300
400
1500 1750 2000 2250HC
Em
issi
on
s (p
pm
)
speed (rpm)
HC Emissions - CR8
M0 M5 M10 M15 M20
0
100
200
300
400
1500 1750 2000 2250HC
Em
issi
on
s (p
pm
)
Speed (rpm)
HC Emissions - CR9
M0 M5 M10 M15 M20
Journal of Engineering and Sustainable Development Vol. 21, No. 04, July 2017 www.jeasd.org (ISSN 2520-0917)
158
Figure (18) CC emissions for fuel blends at CR8 – spark timing 11 ˚BTDC
Figure (19) CC emissions for fuel blends at CR9 – spark timing 11 ˚ BTDC
Figure (20) Acceleration values at CR8 – Standard Spark Timing 10˚BTDC– 2000 rpm
0
200
400
1500 1750 2000 2250
HC
Em
issi
on
s (p
pm
)
Speed (rpm)
HC Emissions - CR8
M0 M5 M10 M15 M20
0
200
400
1500 1750 2000 2250
HC
Em
issi
on
s (p
pm
)
Speed (rpm)
HC Emissions - CR9
M0 M5 M10 M15 M20

Journal of Engineering and Sustainable Development Vol. 21, No. 04, July 2017 www.jeasd.org (ISSN 2520-0917)
159
Figure (21) Acceleration values at CR9 – Standard Spark Timing 10˚BTDC– 2000 rpm
Figure (22) Acceleration values at CR 8 – Advanced Spark Timing 11 ˚ BTDC – 2000 rpm.
Figure (23) Acceleration values at CR9 – Advanced Spark Timing 11˚BTDC–2000 rpm
4. Conclusions
1. Adding methanol to gasoline fuel at standard spark timing (10˚ BTDC) , increase the
power, the maximum power obtained at M10CR9 by an increase of (18.29%) from M0.
2. Advancing the spark timing (11˚ BTDC) increased engine power for all M5, M10,
M15 and M20. Max power was obtained at M20CR9 by an increase of (18.27%) from
M0.
Journal of Engineering and Sustainable Development Vol. 21, No. 04, July 2017 www.jeasd.org (ISSN 2520-0917)
160
3. Increasing compression ratio for gasoline fuel from 8 to 9 didn’t increase the power,
the knock characteristics increased by increasing compression ratio for pure gasoline.
4. Increasing compression ratio for methanol blends from 8 to 9 increased the power.
5. Adding methanol reduces CO and HC emissions efficiently for all cases.
6. For gasoline, increasing the compression ratio didn’t increase power, because of
knocking. While for methanol, increasing the compression ratio increases the engine
power for all fuel blends. Increasing the compression ratio and advancing the spark
timing, decreased the vibration.
7. Vibration signal didn’t follow a specific rule, but for engine working at advanced
spark timing many fluctuations.
6. References
1. Mehdi et al., (2008) “Effect of ignition timing, equivalence ratio and
compression ratio on the performance and emission characteristic of
variable compression ratio SI engine using ethanol unleaded gasoline blends”,
IJE Transactions B: Applications Vol. 21, No. 1, April.
2. Zhang, Lei, (2011) “Multicomponent drop vaporization modeling of petroleum and
biofuel mixtures”, Ph.D thesis, Iowa state university,.
3. www.obitet.gazi.edu.tr.
4. Bairwa, Rajnish, (2011) “Experimental analysis of gasoline and CNG in a SI engine
for performance and emissions”, Master thesis, University of Delhi, Delhi college of
engineering,.
5. www.stjoesauto.com
6. Charalampos, (2003)”Behavior of a Small Four-Stroke Engine Using as
Fuel Methanol-Gasoline Mixtures” SAE, September, Paper No. 2003-32- 0024.
7. Agarwal, Avinash Kumar, (2007) “Biofuels (alcohols and biodiesel) applications
as fuels for internal combustion engines”, Progress in Energy and
Combustion Science 33,.
8. www.methanol.org on (2013). .“Methanol use in Gasoline Bulletin, blending, storage
and handling of Gasoline containing Methanol”, Methanol institute, retrieved from