The effect of melt composition on trace element...
31
The effect of melt composition on trace element partitioning: an experimental investigation of the activity coefficients of FeO, NiO, CoO, MoO 2 and MoO 3 in silicate melts Hugh St.C. O’Neill * , Stephen M. Eggins Research School of Earth Sciences, Australian National University, Canberra 0200, ACT, Australia Received 29 May 2001; accepted 26 November 2001 Abstract The thermodynamic theory describing the partitioning of trace elements between crystals and silicate melt implies that partition coefficients should depend on the major-element composition of the melt from two different causes, namely (1) the activity coefficient of the trace-element oxide component in the melt, and (2) the activities of all the major-element components needed to balance the trace-element substitution in the crystal (the ‘‘stoichiometric control’’). Partition coefficients are also expected to vary with the composition of the crystal, and temperature and pressure. Because these variables cannot be controlled independently in direct crystal/melt partitioning studies, it has not been possible to disentangle their effects, or to determine their relative importance. In order to explore the effects of melt composition on activity coefficients of trace-element oxide components, the activity coefficients of five such components, MoO 2 , MoO 3 , FeO, NiO and CoO, were measured in 18 different melt compositions in the system CaO – MgO – Al 2 O 3 – SiO 2 plus one composition in CaO – MgO – Al 2 O 3 –SiO 2 – TiO 2 at 1400 jC, by equilibration with the metal under controlled oxygen fugacity. MoO 2 and MoO 3 are expected to have geochemical properties similar to the High Field Strength Elements (HFSEs). The activity coefficients of MoO 2 and MoO 3 vary by factors of 20 and 60, respectively, over the range of compositions investigated. Their variation is highly correlated, and mainly depends on the amount of CaO in the melt, suggesting the influence of CaMoO 3 and CaMoO 4 complexes. The analogy between Mo and HFSEs implies that melt composition can be expected to have an important influence on HFSE partition coefficients. The activity coefficients of FeO, NiO and CoO vary by a factor of two over the same range of melt compositions, but show no simple dependence on any particular major-element oxide component. However, the activity coefficients of all three components are very highly correlated with each other. This means that the effect of melt composition can be largely eliminated if the ratios of two activity coefficients are taken, as, for example, when two-element distribution coefficients are used. D 2002 Elsevier Science B.V. All rights reserved. Keywords: Partition coefficients; Silicate melts; Thermodynamics; Mo; Fe; Ni; Co 1. Introduction In the study of igneous rocks, trace element con- centrations have long been used to constrain factors in their petrogenesis such as source enrichment, the style 0009-2541/02/$ - see front matter D 2002 Elsevier Science B.V. All rights reserved. PII:S0009-2541(01)00414-4 * Corresponding author. Tel.: +61-2-6125-5159; fax: +61-2- 6125-5989. E-mail address: [email protected] (H.St.C. O’Neill). www.elsevier.com/locate/chemgeo Chemical Geology 186 (2002) 151 – 181
Transcript of The effect of melt composition on trace element...

The effect of melt composition on trace element partitioning:
an experimental investigation of the activity coefficients of FeO,
NiO, CoO, MoO2 and MoO3 in silicate melts
Hugh St.C. O’Neill*, Stephen M. Eggins
Research School of Earth Sciences, Australian National University, Canberra 0200, ACT, Australia
Received 29 May 2001; accepted 26 November 2001
Abstract
The thermodynamic theory describing the partitioning of trace elements between crystals and silicate melt implies that
partition coefficients should depend on the major-element composition of the melt from two different causes, namely (1) the
activity coefficient of the trace-element oxide component in the melt, and (2) the activities of all the major-element components
needed to balance the trace-element substitution in the crystal (the ‘‘stoichiometric control’’). Partition coefficients are also
expected to vary with the composition of the crystal, and temperature and pressure. Because these variables cannot be controlled
independently in direct crystal/melt partitioning studies, it has not been possible to disentangle their effects, or to determine their
relative importance. In order to explore the effects of melt composition on activity coefficients of trace-element oxide
components, the activity coefficients of five such components, MoO2, MoO3, FeO, NiO and CoO, were measured in 18
different melt compositions in the system CaO–MgO–Al2O3–SiO2 plus one composition in CaO–MgO–Al2O3–SiO2–TiO2
at 1400 jC, by equilibration with the metal under controlled oxygen fugacity. MoO2 and MoO3 are expected to have
geochemical properties similar to the High Field Strength Elements (HFSEs). The activity coefficients of MoO2 and MoO3 vary
by factors of 20 and 60, respectively, over the range of compositions investigated. Their variation is highly correlated, and
mainly depends on the amount of CaO in the melt, suggesting the influence of CaMoO3 and CaMoO4 complexes. The analogy
between Mo and HFSEs implies that melt composition can be expected to have an important influence on HFSE partition
coefficients. The activity coefficients of FeO, NiO and CoO vary by a factor of two over the same range of melt compositions,
but show no simple dependence on any particular major-element oxide component. However, the activity coefficients of all
three components are very highly correlated with each other. This means that the effect of melt composition can be largely
eliminated if the ratios of two activity coefficients are taken, as, for example, when two-element distribution coefficients are
used. D 2002 Elsevier Science B.V. All rights reserved.
Keywords: Partition coefficients; Silicate melts; Thermodynamics; Mo; Fe; Ni; Co
1. Introduction
In the study of igneous rocks, trace element con-
centrations have long been used to constrain factors in
their petrogenesis such as source enrichment, the style
0009-2541/02/$ - see front matter D 2002 Elsevier Science B.V. All rights reserved.
PII: S0009 -2541 (01 )00414 -4
* Corresponding author. Tel.: +61-2-6125-5159; fax: +61-2-
6125-5989.
E-mail address: [email protected] (H.St.C. O’Neill).
www.elsevier.com/locate/chemgeo
Chemical Geology 186 (2002) 151–181

of melting (e.g., batch or fractional), the degree of
melting, and the nature and extent of any subsequent
fractional crystallization. Well-known equations exist
relating the concentrations of a trace element M in
melt and residue to the crystal/melt partition coeffi-
cients, DMmelt/crystal, and the degree of melting, F, both
for batch melting and fractional melting (e.g., Gast,
1968; Wood and Fraser, 1977). Increasingly, mathe-
matical models for more complicated scenarios are
being developed (e.g., DePaolo, 1981; Navon and
Stolper, 1987; Spiegelman and Elliott, 1993; Richard-
son and McKenzie, 1994; O’Hara, 1995; Shaw, 2000).
In all this modelling, the assumption has been made
that values of DMmelt/crystal can be treated as constants.
The same assumption has also made in Rare Earth
Element (REE) inversion modelling (McKenzie and
O’Nions, 1991). To what extent this assumption is
reasonable, or whether it is wishful thinking, is
difficult to judge, for there has been little in the way
of empirical evidence as to how values of DMmelt/crystal
might vary.
The factors causing values of DMmelt/crystal to vary
can be appreciated if the thermodynamic theory
describing crystal-melt equilibrium is used to provide
the conceptual framework. The initial step is to
describe the partitioning reaction using a balanced
chemical reaction between thermodynamically valid
components (Banno and Matsui, 1973). Such a reac-
tion can be written generally as:
MOx=2 �XZ
ncrystal
ZOy=2 ¼ MOx=2melt
þXZ
nmelt
ZOy=2 ð1Þ
where MOx/2 is the oxide component of M in the
silicate melt, x is the valence state of M, and ZOy/2 are
the major-element oxide components (such as SiO2,
AlO1.5, etc.) that are needed to make up the compo-
nent MOx=2 �P
Z n ZOy=2, which has the appropriate
stoichiometry necessary to substitute into the crystal.
Hence, at equilibrium:
ln
ameltMOx=2
,acrystal
MOx=2�XZ
n ZOy=2
!
¼ �DmGo=RT �
XZ
n ln ameltZOy=2
ð2Þ
whereDmGo is the fictive free energy of melting of pure
MOx=2 �P
Z n ZOy=2 relative to the sum of its pure
liquid oxide components (i.e., its actual free energy of
melting less the free energy of mixing of the liquid
oxide components). This convention permits the activ-
ity of a component in the melt (aMOx/2
melt ) to be defined
conveniently with respect to a standard state of pureliquidMOx/2 at the temperature and pressure of interest.The activity of the trace-element component in the
crystal
�acrystal
MOx=2�P
Zn ZOy=2
�is similarly defined with
respect to pure solid MOx=2 �P
Z n ZOy=2 (which may
be a hypothetical substance) at the temperature and
pressure of interest. Activities are then related to con-
centrations in the usual way, through the use of activity
coefficients:
ameltMOx=2
¼ XmeltMOx=2
� cmeltMOx=2
ð3Þ
acrystal
MOx=2�XZ
n ZOy=2
¼ Xcrystal
MOx=2�XZ
n ZOy=2
� ccrystalMOx=2�
XZ
n ZOy=2
ð4Þ
The partition coefficient is defined as:
Dmelt=crystalM ¼ k � Xmelt
MOx=2=X crystal
MOx=2�XZ
n ZOy=2
ð5Þ
where k is a constant to convert from mole fractions to
the more customarily used concentrations by weight.
Therefore:
ln Dmelt=crystalM
¼ �DrGo=RT �
XZ
n ln ameltZOy=2
� ln cmeltMOx=2
þ ln ccrystalMOx=2�
XZ
n ZOy=2
þ ln k ð6Þ
It is evident that values of DMmelt/crystal should
depend on:
(1) T (and probably P). The terms on the RHS of
Eq. (6) can be divided up into enthalpy and entropy
terms, where the entropy terms (mainly the entropy of
melting) are likely to be small relative to enthal-
py terms (particularly those associated with activity
coefficients). Hence, to a first approximation, ln
DMmelt/crystal =Dh/RT, where Dh represents these en-
thalpy terms. Thus, d(ln DMmelt/crystal)/dT=Dh/R. The
H.St.C. O’Neill, S.M. Eggins / Chemical Geology 186 (2002) 151–181152

importance of this approximation is that it indicates
that the change of DMmelt/crystal with temperature is
related to its magnitude, tending towards unity at
infinite temperature. Igneous processes generally
operate over a restricted range of inverse temper-
ature, so that temperature is not likely to have much
of a direct effect on trace-element partition coeffi-
cients. An anomalously large change of DMmelt/crystal
with temperature (or pressure) is likely to be a
secondary effect of the other factors listed below.
(2) The major-element composition of the crystal,
through cMOx=2�
PZn ZOy=2
crystal.
(3) The major-element composition of the melt,
through two quite distinct factors:
a)P
Z n � ln aZOy=2, the activities of the major-
element components in the melt required by crystal
stoichiometry. Here, we call these the ‘‘structural
components’’. Takahashi and Irvine (1981) have
also referred to this as the ‘‘stoichiometric control’’.
b) cMOx/2
melt , the activity coefficient of the oxide
component of M in the silicate melt.
The question of which of these variables are of
practical importance has been much debated in the
literature. Recently, the importance of the composi-
tion of the crystalline phase has been the subject of a
vigorous burst of attention due to the development of
lattice strain theory (e.g., Blundy and Wood, 1991,
1994). Other authors, however, continue to promote
the role of silicate melt composition as a key
variable (e.g., Nielsen, 1988; Kohn and Schofield,
1994).
The main reason why this important issue remains
controversial is that, in direct studies of crystal/melt
partitioning, it is difficult to vary independently melt
composition, crystal composition, temperature or
pressure, so as to disentangle the effects of each of
these variables. This is simply but unavoidably
because crystals of a given composition are only in
equilibrium with a very limited range of melt compo-
sitions, for any given temperature and pressure. The
range over which temperature and pressure can be
varied while still maintaining equilibrium between
melt and crystals is of course also very limited.
Apparent changes of DMmelt/crystal with temperature or
pressure may be due to the changing major-element
composition of the crystal or the melt. Moreover, it is
usually not possible to disentangle the two kinds of
effects that melt composition may have.
However, from thermodynamic modelling of phase
equilibria, there is now a fair amount of independent
evidence on how the activities of the major-element
components that comprise theP
Z n � ln aZOy=2term
may vary; but little is known for any trace element on
how cMOx/2
melt may depend on melt composition. This is
particularly true for incompatible trace elements,
although it is these elements that are of interest in
much of trace-element modelling.
For elements whose oxide components are easily
reduced to the metal (i.e., siderophile elements), it is
possible to construct experiments that measure the
effect of melt composition on cMOx/2
melt directly, while
keeping all the other relevant variables constant. This
is done by measuring the oxygen fugacity of the
oxidation–reduction reaction:
Mmetal
þx=4 O2 ¼ MOsilicate melt
x=2 ð7Þ
Hence, at equilibrium:
ln csil meltMOx=2
¼�DfG
oðMOx=2Þ
RT� ln X sil melt
MOx=2
þ x
4ln fO2 þ ln ametal
M ð8Þ
If the metal M is pure, ln aMmetal = 0, while
DfG(MOx/2)o is a constant at constant T and P. Hence,
the activity coefficient is directly related to the metal’s
apparent solubility (given byX MOx/2
sil melt ), if fO2 is known.
Themethodworks because the solubility of elements in
their zero valence (i.e., metallic) state in silicate melts is
negligibly small, hence only the oxidized components
MOx/2 are present. By varying oxygen fugacity, this
may be verified and also the valence state x determined.
Many elements occur in more than one valence state in
silicate melts, but this too can be resolved since for
appropriate elements f O2 can be varied experimentally
over several orders of magnitude.
Recent results of this type of experiment for the
trace element Ni, which dissolves in silicate melts as
the divalent cation Ni2+ (hence the oxide component
NiO) have suggested that the compositional depend-
ence of cNiOsil melt is small (e.g., Holzheid et al., 1997;
H.St.C. O’Neill, S.M. Eggins / Chemical Geology 186 (2002) 151–181 153
Ertel et al., 1997). However, earlier studies generally
reported significant compositional dependence (Camp-
bell et al., 1979; Dudson and Fraser, 1981; Pretorius
andMuan, 1992). Ni2+ behaves geochemically like the
major-element cations Mg and Fe2+ , for which it
substitutes readily in most crystalline phases. Its
behaviour in silicate melts might therefore be antici-
pated to follow the behaviour of Mg and Fe2+ , an idea
that has been explored in the model of Doyle (e.g.,
Doyle and Naldrett, 1987).
But what about other trace elements that have
chemical properties unlike any of the major elements
in silicate melts? As examples, consider the so-called
‘‘High Field Strength Elements’’ (HFSEs). These are
elements with high formal valence and relatively
small ionic radii, such as the refractory lithophile
elements Zr, Hf, Nb, and Ta. Perhaps U and Th,
which are of particular interest in trace-element stud-
ies because of U-series disequilibrium modelling, and
have high valence albeit somewhat larger ionic radii,
could be included in this group. All these elements
are now almost routinely determined in a trace
element analysis of an igneous rock. The siderophile
element Mo, which is less routinely determined, also
has high formal valence and smallish ionic radius in
both its common oxidation states, Mo4+ and Mo6+,
and is known empirically to behave like the HFSE Nb
during mantle melting (Fitton, 1995). Thus, Mo of
either valency could also be classified as a HFSE.
This element lends itself well to study via equilibrium
(1), as shown by Holzheid et al. (1994). However,
Holzheid et al. (1994) investigated only one silicate
melt composition, namely the diopside–anorthite
eutectic composition in the simple system CaO–
MgO–Al2O3–SiO2. Walter and Thibault (1995) then
reported that the metal/silicate melt partition coeffi-
cients of Mo (and also W) increase dramatically (by
more than two orders of magnitude) at constant T, P
and fO2 as the composition of the silicate melt was
changed from basaltic to komatiitic. If this were
correct, it would imply that a modest amount of
olivine fractionation could change a melt composition
sufficiently to have an enormous effect on the parti-
tion coefficients of any elements with similar sensi-
tivity to melt composition (i.e., HFSEs and U and Th,
perhaps). In turn, this might put in doubt all infer-
ences from U-disequilibrium series modelling, for
example.
Here, we report an investigation of the effects of
melt composition on the solubility of Mo in a wide
variety of silicate melts in the systems CaO–Al2O3–
SiO2, MgO–Al2O3–SiO2, and CaO–MgO–Al2O3–
SiO2 plus one composition in the quinary CaO–
MgO–Al2O3–SiO2–TiO2 with 20 wt.% TiO2). In
order to facilitate comparison with the compatible
elements Fe, Ni and Co, we also investigated the
solubilities of these elements in the same melts. Since
two oxidation states of Mo (Mo4+ and Mo6+ ) occur in
silicate melts in the range of oxygen fugacity that is
accessible in these type of experiments (Holzheid et
al., 1994), we have studied the effect of melt compo-
sition on both oxidation states. Effectively, we there-
fore obtain data on two HFSE analogues (i.e., Mo4+
and Mo6+).
The partitioning of Fe, Ni, Co and Mo between the
silicates of the Earth’s mantle and the Earth’s metallic
core is potentially useful in constraining models for
the accretion and primary differentiation of the Earth
(e.g., O’Neill and Palme, 1998). Obviously, metal/
silicate-melt partition coefficients may also be sensi-
tive to silicate melt composition, and recently Righter
and Drake (1997) have suggested a simple parameter-
ization for this compositional dependence. The
present data should be useful in testing their sugges-
tion, and also addressing the general question of
whether activity coefficients of trace elements in
silicate melts can be usefully approximated by this
kind of generalized approach.
For elements M that are solid metals at the chosen
experimental temperature, a simple experimental
method can be used to study their solubility in silicate
melts according to reaction (7). A drop of the silicate
melt is suspended from a wire loop of M in a
conventional muffle furnace, under a suitable gas
mixture to control oxygen fugacity (e.g., Holzheid et
al., 1994, 1997). This tried and proven experimental
technique has been used here.
1.1. Silicate melt compositions
Nineteen silicate melt compositions were studied,
four in the ternary CAS, two in the ternary MAS, 12
in the quaternary CMAS, and one in the system
CMAS–TiO2. Compositions were selected so as to
be liquid at our chosen experimental temperature of
1400 jC. This criterion limits the composition space
H.St.C. O’Neill, S.M. Eggins / Chemical Geology 186 (2002) 151–181154

available in the ternary CAS and MAS systems to
small areas near eutectics; compositions were chosen
using the phase diagrams (Figs. 630 and 712 in
Levin et al., 1964). For the CMAS system, compo-
sitions were selected using two complimentary
approaches. In one approach, six low-melting-point
(eutectic or peritectic) compositions were chosen,
guided by the work of Longhi (1987). In the other
approach, compositions are based on the anorthite–
diopside eutectic composition (42% An, 58% Di,
by weight, previously studied by Holzheid et al.,
1994), to which were added the maximum amounts
of the four components SiO2, Mg2SiO4, MgSiO3 and
CaSiO3 soluble in this composition at 1400 jC. TheCMAS compositions covered thus include some near
their liquidus as well as some that are as far below
the liquidus as it is possible to go in this simple
system. The composition in the CMAS–TiO2 system
was obtained by adding 20% TiO2 to the An–Di
eutectic.
In order to achieve maximum accuracy in this
study, we did not attempt to investigate melt compo-
sitions containing other siderophile-element compo-
nents, notably FeO, an important component in
natural silicate magmas. The reason for this is that
activity-composition relations in alloys often show
large and complex deviations from ideality, poten-
tially causing the uncertainties attendant in calculating
aMmetal to obscure the effects in cMOx/2
sil melt. Nor can
compositions containing volatile elements such as
Na or K be investigated easily using the present
experimental method since these elements would be
lost by volatilization during the experiments because
of the low fO2s involved.
2. Experimental
2.1. Sample equilibration
Compositions were prepared from reagent grade
MgO, Al2O3 and TiO2, all dried before weighing at
1100 jC, fine-grained SiO2 prepared from SiO2�nH2O
(‘‘silicic acid’’) by dehydrating at 1100 jC, and
CaCO3, dried at f 300 jC. Mixtures were homogen-
ized by grinding under acetone in an agate mortar,
pressed into pellets and decarbonated by heating
slowly to f 1100 jC, followed by regrinding.
Samples were equilibrated using the wire-loop
method in a conventional vertical tube furnace equip-
ped for gas mixing, using CO–CO2 mixtures to
control fO2. To prepare the loops, powdered melt
compositions were rendered into a slurry using poly-
ethylene oxide. Loops made from pure metal in the
form of wire or strips cut from foil were dipped into
the slurry, which was then allowed to dry. The loop
plus its load of dried slurry were then, one at a time,
lowered into a furnace at 1400 jC under flowing Ar–
H2 mixture, to melt the composition and drive off any
remaining polyethylene oxide. If needs be, the process
was repeated until enough sample adhered to the loop.
Six or seven wire loops of different silicate melt
composition were suspended from a circular cage
made from 0.5 mm Pt wire, braided double for
strength, attached to a small alumina ring. We call
this arrangement a ‘‘chandelier’’. The ‘‘chandelier’’
was hung by its alumina ring onto a hook, bent into
the end of a strong 0.5 mm diameter Pt–Rh wire
recycled from an ancient furnace. The Pt–Rh wire had
been threaded through one bore of an 8 mm OD four-
bore alumina tube, two other bores of which housed
the wires for a type B Pt–Rh thermocouple. The
samples were loaded into the tube furnace at 600 jC.This temperature is sufficiently low that if the loops
swing into each other or onto the wall of the furnace
tube, they do not stick. The appropriate CO–CO2 gas
mixture is then turned on, and the furnace heated to
1400 jC at 6 jC/min. Samples are drop-quenched by
opening the furnace at the bottom and pulling the Pt–
Rh wire from which the ‘‘chandelier’’ is suspended,
which straightens the hook, causing the ‘‘chandelier’’
to drop into a beaker of water. Quoted run times are
taken from when the furnace reaches 1400 jC to the
time of quenching.
Occasionally, some samples fall prematurely, stick
together, or stick to the side of the furnace during
quenching. Such failures explain some of the apparent
gaps in the data.
The composition of the CO–CO2 gas mixture was
set using Tylan FC2800 mass flow controllers. For
this study, all experiments were done using the same
two mass flow controllers; that for CO had a max-
imum flow rate of 400 SCCM (standard cubic centi-
meters per minute), that for CO2 20 SCCM. Gas flows
from the controllers were checked from time to time
using a bubble flow meter. Agreement between nom-
H.St.C. O’Neill, S.M. Eggins / Chemical Geology 186 (2002) 151–181 155

inal and measured flow rates was within 2% within
most of the range of the mass flow controllers. The
operation of the controllers was further tested three
times during the series of experiments reported here,
by means of a SIRO2 yttria-stabilized zirconia oxygen
sensor, with flowing air as the reference electrode.
The performance of zirconia-based oxygen sensors
degrades noticeably at 1400 jC after only a few hours
in the low fO2 regime of the present experiments, and
hence the oxygen sensor was not used during the
actual equilibration experiments. The tests with the
YSZ sensor were carried out at 1120 jC, with no
samples in the furnace. For gas mixtures between 20%
and 90% CO, the difference between log fO2 as
measured by the sensor and that calculated from the
gas mix was 0.05F 0.01, the sensor systematically
recording the more oxidizing conditions. There are
numerous factors that can affect both ways of meas-
uring fO2, and it is not possible to decide unequiv-
ocally which method is more likely to be correct. We
have chosen to report fO2 as calculated from the gas
mix, without further correction. We assume that the
nonsystematic error (i.e., between different runs) is
expected to be about F 0.02 log fO2, based on
experience. Any systematic error is not included in
the statistical analysis of the results. The gas flow was
fed into the furnace at the bottom and exited from the
top, whence it bubbled through a small oil trap. A
constant bubble rate through the oil trap is a sensitive
check that there are no leaks in the furnace (e.g., from
a cracked muffle tube). Mo solubility was studied as a
function of fO2 from 10� 11.63 to 10� 9.6 bars (corre-
sponding to gas mixtures from 97% to 75.8% CO),
while Fe, Ni and Co solubilities were studied at one
fO2 condition each. For Ni and Co, the fO2 conditions
of 10 � 9.60 and 10 � 11.63 bars, respectively, were
selected to give optimum amounts of Ni and Co
dissolved in the melt, which, from analytical and
theoretical considerations, is about 2000–3000 ppm.
The Fe experiments were conducted at fO2 of
10� 12.61 bars (99% CO), which is approximately
the lowest fO2 achievable in the Fe–C–O system in
equilibrium with pure Fe metal, since carbon starts to
dissolve significantly into Fe metal at lower fO2,
inducing melting. Because of the extreme CO/CO2
ratio, the absolute accuracy of this fO2 must be lower
than for the other experiments, although we are
satisfied from replicate experiments that the mass
flow controllers still give good precision even at this
ratio. However, precision would also be expected to
drop off were an even more extreme ratio used. The
Fe experiments contain about 3 wt.% Fe in the melt.
For comparison, the Fe–‘‘FeO’’, Co–CoO, Ni–NiO
and Mo–MoO2 solid state univariant equilibria lie at
10� 9.71, 10� 7.23, 10� 5.77 and 10� 9.23 bars, respec-
tively, at 1400 jC (O’Neill and Pownceby, 1993;
O’Neill, 1986).
Temperatures were controlled to F 1 jC, using a
type B thermocouple external to the furnace tube, and
were measured using a second type B thermocouple,
held in the alumina tube from which the ‘‘chandelier’’
is suspended. Type B thermocouples show a slight
drift at the lowest fO2s of the experiments reported
here, presumably due to poisoning by carbon. The
drift was typically f 1 jC/day, and is thus observ-
able, but not experimentally significant in the present
context. All runs are believed to be within F 2 jC of
the nominal temperature of 1400 jC.After the quench, the loops with their attached
beads of silicate glass were unhooked from the
‘‘chandelier’’, mounted in 1-in. epoxy discs, and
polished for analysis by electron microprobe and
laser-ablation ICP-MS.
2.2. Analytical methods
The major element compositions of all samples
were checked by electron microprobe analysis, using
a CAMECA Camebax in the EDS mode. Standard-
ization and ZAF correction procedures are described
in Ware (1981). Ni, Co and Mo metal wires were used
as the standards for these elements, and the calibration
for Fe was also checked against Fe wire. Operating
conditions were 15 kV and 6 nA. Mean compositions
of all samples are given in Table 1. When composi-
tions are normalized to 100% in the CMAS system
(i.e., ignoring the amount of the dissolved siderophile
element), there is no evidence for statistically signifi-
cant changes in composition between samples run at
different fO2s. The most likely change in composition
would be some loss of Si at the lowest fO2, because of
volatility of SiO(g), but there is no evidence of this.
Concentrations of Fe, Ni, Co and, in a few runs,
Mo, were determined by electron microprobe analysis
using WDS. The pure metals were used as standards.
Counting times were 100 s on peak, 10 s on back-
H.St.C. O’Neill, S.M. Eggins / Chemical Geology 186 (2002) 151–181156
ground. Beam size was 2 Am. Counts were converted
to concentrations using the ZAF correction procedure,
with compositional factors determined from the EDS
analyses. Results are reported as the mean and stand-
ard deviation of at least 10 spot analyses on each
sample.
Concentrations of Mo, Ni and Co were also deter-
mined by laser-ablation ICP-MS, using an ArF (193
nm) excimer laser coupled to an Agilent 7500S quad-
rupole mass spectrometer via a custom-built ablation
cell and aerosol transfer system. The spatial resolution
and analytical capabilities of this instrumentation have
been outlined elsewhere (Eggins et al., 1997, 1998),
and have proved ideally suited for this study. In
particular, the Mo metal nuggets present in many
Mo samples present a problem that can only be
overcome (or reduced to a tractable level) by sampling
at high spatial resolution. To maximize the spatial
resolution, we used a relatively small beam diameter
( < 30 Am). It is also necessary to maximize instrument
response times to enable analysis of nugget-free glass
between encountering successive nuggets. This is
achieved with an ablation cell design that incorporates
a very small active volume (f 1 cm3), with the
transfer of ablated materials directly to the ICP-MS
torch via narrow bore (2 mm ID) FEP tubing. In the
absence of a post-ablation signal smoothing device, a
laser repetition rate of 20 pulses/s has been necessary
to obtain a stable sample feed to the ICP-MS and to
avoid laser sampling noise that otherwise would
compromise analysis quality due to the sequential
nature of ICP-MS analysis. To avoid inter-element
fractionation effects arising from the preferential con-
densation of more refractory components during sam-
pling from high aspect ratio ablation pits (z 1),
samples were rastered in the plane of the focused
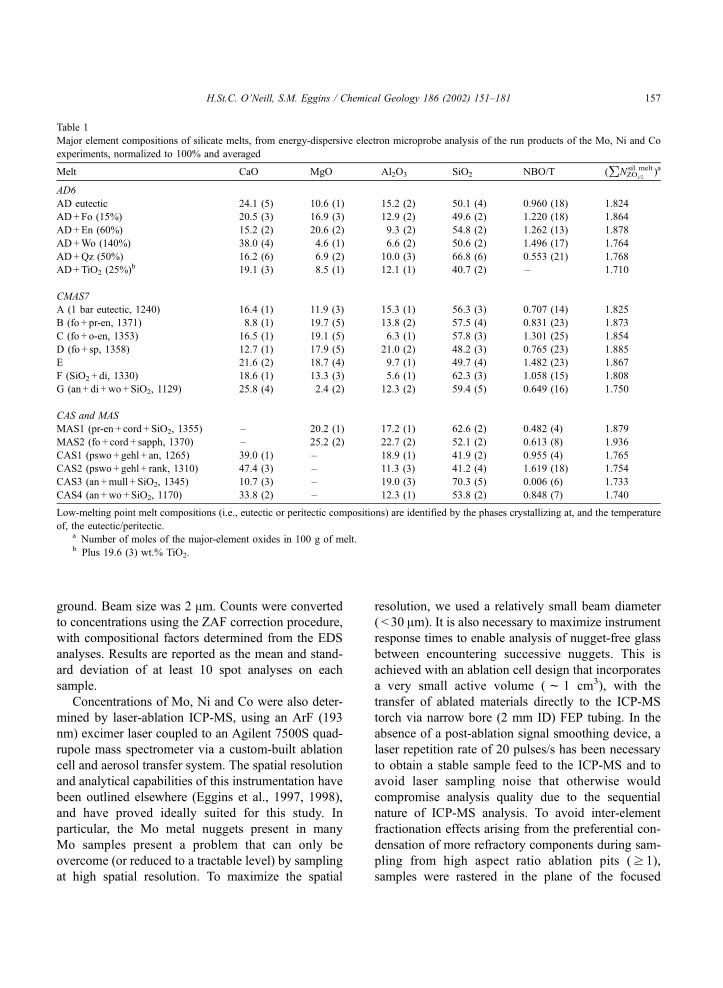
Table 1
Major element compositions of silicate melts, from energy-dispersive electron microprobe analysis of the run products of the Mo, Ni and Co
experiments, normalized to 100% and averaged
Melt CaO MgO Al2O3 SiO2 NBO/T (SNZOy/2
sil melt )a
AD6
AD eutectic 24.1 (5) 10.6 (1) 15.2 (2) 50.1 (4) 0.960 (18) 1.824
AD+Fo (15%) 20.5 (3) 16.9 (3) 12.9 (2) 49.6 (2) 1.220 (18) 1.864
AD+En (60%) 15.2 (2) 20.6 (2) 9.3 (2) 54.8 (2) 1.262 (13) 1.878
AD+Wo (140%) 38.0 (4) 4.6 (1) 6.6 (2) 50.6 (2) 1.496 (17) 1.764
AD+Qz (50%) 16.2 (6) 6.9 (2) 10.0 (3) 66.8 (6) 0.553 (21) 1.768
AD+TiO2 (25%)b 19.1 (3) 8.5 (1) 12.1 (1) 40.7 (2) – 1.710
CMAS7
A (1 bar eutectic, 1240) 16.4 (1) 11.9 (3) 15.3 (1) 56.3 (3) 0.707 (14) 1.825
B (fo + pr-en, 1371) 8.8 (1) 19.7 (5) 13.8 (2) 57.5 (4) 0.831 (23) 1.873
C (fo + o-en, 1353) 16.5 (1) 19.1 (5) 6.3 (1) 57.8 (3) 1.301 (25) 1.854
D (fo + sp, 1358) 12.7 (1) 17.9 (5) 21.0 (2) 48.2 (3) 0.765 (23) 1.885
E 21.6 (2) 18.7 (4) 9.7 (1) 49.7 (4) 1.482 (23) 1.867
F (SiO2 + di, 1330) 18.6 (1) 13.3 (3) 5.6 (1) 62.3 (3) 1.058 (15) 1.808
G (an + di +wo+ SiO2, 1129) 25.8 (4) 2.4 (2) 12.3 (2) 59.4 (5) 0.649 (16) 1.750
CAS and MAS
MAS1 (pr-en + cord + SiO2, 1355) – 20.2 (1) 17.2 (1) 62.6 (2) 0.482 (4) 1.879
MAS2 (fo + cord + sapph, 1370) – 25.2 (2) 22.7 (2) 52.1 (2) 0.613 (8) 1.936
CAS1 (pswo+ gehl + an, 1265) 39.0 (1) – 18.9 (1) 41.9 (2) 0.955 (4) 1.765
CAS2 (pswo+ gehl + rank, 1310) 47.4 (3) – 11.3 (3) 41.2 (4) 1.619 (18) 1.754
CAS3 (an +mull + SiO2, 1345) 10.7 (3) – 19.0 (3) 70.3 (5) 0.006 (6) 1.733
CAS4 (an +wo +SiO2, 1170) 33.8 (2) – 12.3 (1) 53.8 (2) 0.848 (7) 1.740
Low-melting point melt compositions (i.e., eutectic or peritectic compositions) are identified by the phases crystallizing at, and the temperature
of, the eutectic/peritectic.a Number of moles of the major-element oxides in 100 g of melt.b Plus 19.6 (3) wt.% TiO2.
H.St.C. O’Neill, S.M. Eggins / Chemical Geology 186 (2002) 151–181 157

laser beam (30 Am/diameter) at f 0.5 mm/min. This
enabled compositional profiling along precisely cut
low-aspect ratio trenches (30 Am wide�f 10 Amdeep). About 0.1–0.2 Am of material is removed from
the sample by each laser pulse.
LA-ICP-MS data collection was performed by peak
hopping (1 point/peak) employing 20 ms dwell times
on selected isotopes of the bulk matrix glass (25Mg,27Al, 29Si, 43Ca, 49Ti) and of the metal of interest (59Co
or 60Ni and 61Ni or 95Mo and 98Mo). The instrument
was calibrated using NIST610 (synthetic soda-lime
glass comprising 70.0 wt.% SiO2, 2.0 wt.% Al2O3,
11.45 wt.% CaO, 460 Ag/g Mg, 437 Ag/g Ti, 459 Ag/gNi, 400 Ag/g Co, 440 Ag/g Mo; Pearce et al., 1997,
NIST certified values, and Sylvester and Eggins, 1997)
as the primary reference material. USGS BCR2g glass
was employed as a secondary reference material (54.6
wt.% SiO2, 10.50 wt.% Al2O3, 6.95 wt.% CaO, 3.40
wt.% MgO, 2.35 wt.% TiO2, 12.5 Ag/g Ni, 15.5 Ag/gCo, 262 Ag/g Mo) to check data quality. Data reduction
was performed following removal where present of
anomalous time slices containing ablated metal nugget
material by standard laser ablation ICP-MS procedures
(see Longerich et al., 1996) using 43Ca (or 29Si in Ca-
absent experiments) as an internal standard (derived
from electron microprobe measurements).
The other major elements (i.e., Si, Al, Mg, and Ti)
were also checked by laser ablation to confirm the
Fig. 1. Examples of 95Mo, 97Mo and 98Mo time-resolved spectra for glasses containing differing Mo nugget number densities ranging from (a)
completely homogeneous without nuggets, through (b) sporadic (f 106 – 7/cm3), to (c) common (f 107 – 8/cm3), and (d) overwhelmingly
abundant nuggets ( > 108/cm3). Note that observed count rate variation between nuggets is consistent with counting statistic variability. The
resolution of glass Mo contents from nugget contributions is enabled by the rapid washout characteristics of the ANU laser ablation ICP-MS
(i.e., >3 orders of magnitude intensity reduction in 2 s). A comparison of Mo concentrations calculated by excluding and including nuggets
(latter in brackets) is given on each panel.
H.St.C. O’Neill, S.M. Eggins / Chemical Geology 186 (2002) 151–181158

identity of each glass analysed. Virtually all analyses
were performed in duplicate or triplicate, and the
analytical reproducibility was typically better than
2–3% relative. Examples of spectra obtained in four
samples representative of different levels of nugget
contamination are illustrated in Fig. 1.
Many of the Mo samples contained nuggets of Mo
metal. The maximum size of the nuggets is far greater
than in stirred-crucible experiments on Highly Side-
rophile Element solubilities (Ertel et al., 1999, 2001),
and in many samples, the nuggets are large enough to
be visible with an optical microscope. The problem is
most severe in compositions with high silica, hence
high viscosity. In a few cases, the density of the
nuggets was so great as to preclude analysis even
using the microanalytical techniques of this study, and
for the composition CAS3, the nugget problem was so
severe that no Mo solubilities could be obtained at any
fO2. However, in most cases, the micronuggets could
easily be identified by the LA-ICP-MS analytical
method in time-resolved spectra, as shown in Fig. 1,
and hence filtered out from reported results. We have
interpreted occasional abnormally high spot analyses
as also due to nuggets, and such analyses were not
included in the reported results. Nuggets were not a
problem in experiments with the other metals.
2.3. Equilibration times
The time needed to reach steady state Mo solubil-
ities, which is necessary but alas not sufficient to
prove or even to infer equilibrium because of the
nugget problem (see Ertel et al., 2001), was inves-
tigated at one fO2 (10 � 10.60 bars) for one set of
Table 2
Results of Mo solubilities (in ppm) from LA-ICP-MS analysis
Melt log fO2/time
AD6 � 11.63 � 11.27 � 11.00 � 10.80 � 10.60 � 10.60 � 10.60 � 10.20 � 9.80
44 h 88.5 h 64.5 h 48 h 45 h 13.8 h 4 h 45.2 h 47.3 h
AD 21.9 60.2 201 395 405 420 1329 4693
AD+Fo 22.9 65.5 139 200 408 417 412 1486
AD+En 17.4 50.0 99 148 286 306 304 991 3682
AD+Wo 52.8 134 310 501 1007 1097 3602 14159
AD+Qz 13.1 27.0 61.6 87.5 163 320 636 2042
AD+TiO2 35.6 92.0 184 269 492 503 508 1606 5350
Melt log fO2/time
CMAS7 � 11.63 � 11.27 � 11.00 � 10.80 � 10.60 � 10.40 � 10.20 � 10.00 � 9.80 � 9.60
69 h 64 h 68 h 92 h 48 h 63 h 69 h 67 h 90 h 93 h
A 16.1 34.5 71 116 219 402 843 1377 2164 4657
B 13.9 33 61 101.5 188 382 724 1152 2063 3884
C 18.4 51 97 161 299 548 1203 1784 3547 6104
D 16.0 38 83 127 247 448 968 1605 2453 5582
E 27.4 71.5 162 246 495 925 2039 3484 5743 10608
F 19.0 45 87 150 277 515 1159 1826 3210 5490
Melt log fO2/time
MAS and CAS � 11.63 � 11.27 � 11.00 � 10.60 � 10.20 � 9.80
65 h 45 h 44 h 60 h 44.5 h 68 h
MAS1 103 340 1134
MAS2 12.4 27.2 52 148 440 1472
CAS1 68.7 405 (1452) 4200 16665
CAS2 171.5 507 1105 3550 12760 46020
CAS3
CAS4 33.8 185 559 1952 6892
H.St.C. O’Neill, S.M. Eggins / Chemical Geology 186 (2002) 151–181 159
compositions by performing replicate experiments for
4, 13.8 and 45 h (Table 2). No systematic difference is
detectable between the 13.8 and 45 h experiments,
indicating that a steady state is reached in the shorter
time, at least. The experiment at 4 h has slightly
higher levels of Mo in the most silica-rich sample,
although the steady state value is achieved in the
others. However, the concentration of suspended
particles of metallic Mo is higher in these short-
duration samples. All other runs were of greater than
44 h duration. The metal-loop experiments of Holz-
heid et al. (1994, 1997) were of comparable duration
(f 50 h).
Analogous metal solubility experiments on several
highly siderophile elements have repeatedly shown
that the apparent steady state values sometimes may
not correspond to true chemical equilibrium, due to
the persistence of tiny particles of metal (‘‘micro-
nuggets’’) suspended in the melt (e.g., Ertel et al.,
1999, 2001). To make the inference that equilibrium is
attained also requires other factors to be considered, in
particular, homogeneity on a suitable microanalytical
scale, and the change of solubility with fO2.
3. Results
3.1. Experimental results, accuracy and precision
Electron microprobe analyses of silicate melt ma-
jor-element compositions are summarized in Table 1,
in the form of the mean and standard deviations of
analyses of all Mo, Ni and Co experiments, normal-
ized to 100%. Mo solubilities are reported in Table 2,
Ni and Co and solubilities in Table 3, and composi-
tions of the Fe-bearing experiments in Table 4.
All the Ni and Co samples and 25 of the Mo
samples with relatively high Mo concentrations
(>1000 ppm) were also determined by electron
microprobe analysis, and these results are compared
with the LA-ICP-MS analyses in Fig. 2a–c. For the
Mo samples, regression of the two data sets, weighted
assuming an uncertainty of 3% for the LA-ICP-MS
analyses and the observed standard deviations of the
electron microprobe analyses, which are mostly in the
range 1–4%, gives:
½MoEMP ¼ 0:985ðF0:009Þ ½MoLA�ICP�MS
The reduced chi-squared (vm2) for the regression is
1.84, indicating that the weighting of the data is
realistic. Since the concentration of the NIST 610
standard is only known to f 5% (Pearce et al., 1997),
the level of agreement is something of a fluke, but it
does lend confidence to the absolute accuracy of the
measurements.
A similar comparison between electron microprobe
and LA-ICP-MS results for Ni and Co are shown in
Fig. 2b,c. Regressions for these data give:
½NiEMP ¼ 0:970ðF0:010Þ ½NiLA�ICP�MS v2m ¼ 0:47
½CoEMP ¼ 1:010ðF0:010Þ ½CoLA�ICP�MS v2m ¼ 1:59
assuming an uncertainty of 3% in the LA-ICP-MS
analyses.
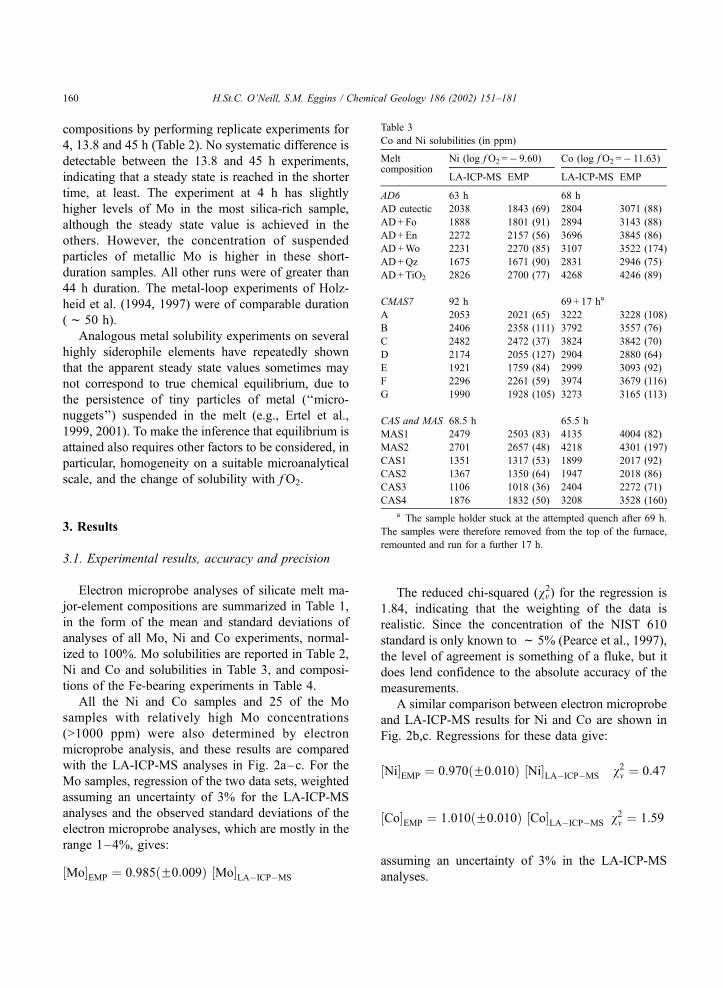
Table 3
Co and Ni solubilities (in ppm)
Melt Ni (log fO2 =� 9.60) Co (log fO2=� 11.63)composition
LA-ICP-MS EMP LA-ICP-MS EMP
AD6 63 h 68 h
AD eutectic 2038 1843 (69) 2804 3071 (88)
AD+Fo 1888 1801 (91) 2894 3143 (88)
AD+En 2272 2157 (56) 3696 3845 (86)
AD+Wo 2231 2270 (85) 3107 3522 (174)
AD+Qz 1675 1671 (90) 2831 2946 (75)
AD+TiO2 2826 2700 (77) 4268 4246 (89)
CMAS7 92 h 69 + 17 ha
A 2053 2021 (65) 3222 3228 (108)
B 2406 2358 (111) 3792 3557 (76)
C 2482 2472 (37) 3824 3842 (70)
D 2174 2055 (127) 2904 2880 (64)
E 1921 1759 (84) 2999 3093 (92)
F 2296 2261 (59) 3974 3679 (116)
G 1990 1928 (105) 3273 3165 (113)
CAS and MAS 68.5 h 65.5 h
MAS1 2479 2503 (83) 4135 4004 (82)
MAS2 2701 2657 (48) 4218 4301 (197)
CAS1 1351 1317 (53) 1899 2017 (92)
CAS2 1367 1350 (64) 1947 2018 (86)
CAS3 1106 1018 (36) 2404 2272 (71)
CAS4 1876 1832 (50) 3208 3528 (160)
a The sample holder stuck at the attempted quench after 69 h.
The samples were therefore removed from the top of the furnace,
remounted and run for a further 17 h.
H.St.C. O’Neill, S.M. Eggins / Chemical Geology 186 (2002) 151–181160

3.2. Mo4+ and Mo6+ solubilities and activity coeffi-
cients
The Mo solubilities for a representative composi-
tion (CMAS7-E) are plotted as a function of fO2 in
Fig. 3. The data do not plot on a straight line, but
show distinct curvature in log [Mo] versus log fO2
space, caused by a change in the oxidation state of Mo
from Mo4+ at low fO2 to Mo6+ at high fO2. This
change in valence state was previously observed by
Holzheid et al. (1994), and occurs in all compositions,
albeit over slightly different fO2s.
For each composition, the Mo concentrations were
converted to mole fractions according to the relation-
ship:
ðX sil meltMoO2
þ X sil meltMoO3
Þ
¼ ½Mo � 10�4=95:94
½Mo � 10�4=95:94þP
N sil meltZOy=2
ð9ÞFig. 2. Comparison between electron microprobe and laser-ablation
ICP-MS analyses for (a) Mo (logarithmic scale), (b) Ni and (c) Co.
Error bars are one standard deviation, assuming F 3% for the LA-
ICP-MS analyses.
Table 4
Compositions of silicate melts in equilibrium with metallic Fe at log
fO2 =� 12.61, from EDS electron microprobe analysis
Melt composition CaO MgO Al2O3 SiO2 FeO XFeO
AD6 (44.5 h)
AD eutectic 22.3 9.8 14.8 49.6 3.49 (3) 0.0269 (2)
AD+Fo 19.8 16.2 12.6 48.1 3.33 (6) 0.0251 (4)
AD+En 14.1 20.0 9.3 52.4 4.22 (3) 0.0315 (3)
AD+Wo 36.9 3.77 5.8 49.7 3.75 (2) 0.0299 (5)
AD+Qz 15.9 6.9 10.4 62.7 4.15 (7) 0.0328 (6)
AD+TiO2 18.0 7.8 11.7 38.7 4.79 (9)a 0.0394 (7)
CMAS7 (68 h)
A 15.3 11.7 15.1 54.3 3.53 (6) 0.0271 (4)
B 8.2 19.3 13.6 54.8 4.12 (9) 0.0308 (7)
C 15.3 18.7 6.3 55.3 4.47 (6) 0.0337 (4)
D 12.1 17.4 20.7 46.7 2.82 (16) 0.0210 (12)
E 20.2 18.2 9.9 48.3 3.39 (6) 0.0254 (4)
F 17.2 13.0 5.7 58.6 5.42 (5) 0.0420 (4)
G 24.4 2.2 11.8 57.3 4.22 (4) 0.0339 (3)
CAS and MAS (50 h)
MAS1 – 19.3 17.2 58.7 4.76 (8) 0.0356 (6)
MAS2 – 24.0 22.4 48.7 4.81 (7) 0.0350 (5)
CAS1 36.8 – 18.7 42.0 2.49 (6) 0.0198 (4)
CAS2 45.3 – 11.1 41.0 2.53 (16) 0.0202 (12)
CAS3 10.4 – 19.6 67.9 2.02 (6) 0.0163 (4)
CAS4 31.5 – 12.0 52.6 3.91 (4) 0.0315 (4)
a Plus 19.0 wt.% TiO2.
H.St.C. O’Neill, S.M. Eggins / Chemical Geology 186 (2002) 151–181 161

where [Mo] is the concentration of Mo in ppm, 95.94
is the atomic weight of Mo, andP
N sil meltZOy=2
is the
total number of moles of the major-element oxides on
a single cation basis (i.e., NSiO2
sil melt +NAlO1.5
sil melt +
NCaOsil melt +NMgO
sil melt ) in 100 g of Mo-free melt. The
values ofP
N sil meltZOy=2
for all melts are given in Table 1.
They do not vary much.
The data for each melt composition were then
fitted by nonlinear least squares regression to the
equation:
ðX sil meltMoO2
þ X sil meltMoO3
Þ¼ QMoO2ð fO2Þ þ QMoO3ð fO2Þ1:5 ð10Þ
using a weighting of F 3% for (XMoO2
sil melt +XMoO3
sil melt)
and F 0.02 in log fO2. The parameters QMoOx/2 are
solubility constants for each valence state, to be
determined for each melt composition by the regres-
sion. Results are summarized in Table 5. During the
fitting procedure, it was found that all the samples
from one run, namely CMAS7 at log fO2 =� 10.20,
plotted significantly off the curves established by the
other nine runs for this set of compositions (e.g., see
Fig. 3), indicating a systematic experimental error of
about 0.06 in log fO2 for this run. Such an error could
arise, for example, if the auto-zeroing on the mass
flow controllers failed to operate correctly. The sam-
ples from this run were eliminated from the regression
analysis.
The individual solubilities of the MoO2 and MoO3
components (i.e., Mo4+ and Mo6+ , respectively)
obtained from the regression analysis are shown in
Fig. 3 for the representative composition CMAS7-E.
Activity coefficients may be calculated from the
values of QMOx/2 by combining Eqs. (1) and (3) to
obtain:
lncsil meltMoOx=2
¼�DfG
oðT,1 barÞðMoOx=2Þ
RT� ln QMOx=2
ð11ÞFor comparison with the behaviour of other oxide
components, it is helpful to define the standard state
as the pure solid metal but pure liquid MoOx/2, both at
the temperature of interest. In general, if the pure solid
were chosen as the standard state for the oxide
component, the resulting activity coefficients would
include the entropy of melting, and thus change
greatly with temperature. This gives a misleading
impression of the complexity of the thermodynamics
(e.g., see discussion in Holzheid et al., 1997). For
Table 5
Results of nonlinear regression analysis of the Mo solubility data as
a function of oxygen fugacity
Melt Number
of data
QMoO2
(� 10� 6)
QMoO3
(� 10� 11)
vm2
AD6
AD eutectic 6 3.79 (34) 10.20 (84) 0.49
AD+Fo 6 3.94 (41) 10.64 (120) 1.93
AD+En 7 3.07 (25) 7.12 (62) 1.57
AD+Wo 7 7.56 (86) 32.86 (239) 0.83
AD+Qz 7 2.28 (16) 3.89 (38) 3.78
AD+TiO2 7 7.74 (47) 9.50 (106) 1.02
CMAS7
A 9 2.82 (17) 4.46 (33) 1.57
B 9 2.47 (14) 3.79 (28) 1.35
C 9 3.44 (22) 6.66 (46) 0.49
D 9 2.75 (18) 5.42 (37) 1.27
E 9 4.52 (35) 12.86 (78) 0.98
F 9 3.39 (21) 6.22 (44) 0.99
CAS and MAS
MAS1 3 1.16 (31) 2.25 (40) 0.06
MAS2 6 2.34 (13) 1.88 (26) 1.14
CAS1 5 11.61 (126) 39.07 (309) 1.11
CAS2 6 27.67 (302) 114.21 (846) 0.25
CAS4 5 6.20 (58) 15.31 (133) 0.16
Uncertainties of 3% in Mo concentration and 0.02 in log fO2 were
assumed.
Fig. 3. Example of the solubility of Mo in one CMASmelt (CMAS7-
E, see Table 1) at 1400 jC as a function of oxygen fugacity. One-
standard deviation errors are about the size of the symbols. The best
fit to the data from the regression analysis is shown as the smooth
curve, with the calculated individual contributions from Mo4+ and
Mo6+ given by the dashed lines.
H.St.C. O’Neill, S.M. Eggins / Chemical Geology 186 (2002) 151–181162
MoO3, the thermodynamic data for the liquid standard
state are well known, but MoO2 decomposes (to Mo
metal plus MoO3 gas) before it melts, and nothing
is known about its thermodynamic properties in the
liquid state. Here, we have made a rough estimate
based on a hypothetical melting point of 2200 K
(similar to TiO2) and an entropy of melting of
31.4 J K� 1 mol� 1, as suggested by Chase (1998)
for the entropy of melting of TiO2. The adopted
thermodynamic data and their sources are given in
Table 6. Since only one temperature was investigated,
the values of DfG(T, 1 bar)o (MoO2) and DfG(T, 1 bar)
o
(MoO3) are constants, and any errors in the adopted
values has no bearing on the discussion that follows,
which centres on relative changes in the activity
coefficients with melt composition. Activity coeffi-
cients calculated from Eq. (11) are reported in Table 7.
There is evidently a large change in the solubilities,
hence activity coefficients, of both Mo4+ and Mo6+
with silicate melt composition. In the CMAS system,
values of QMoO2and QMoO3
, hence cMoO2
silmelt and cMoO3
sil melt,
change by factors of three and nine, respectively (Table
4, see also Fig. 4). Include the MAS and CAS compo-
sitions and the range increases to well over an order of
magnitude—a factor of 20 for QMoO2and of 60 for
QMoO3.
There is an excellent correlation between cMoO2
sil melt
and cMoO3
sil melt (Fig. 4). Intriguingly, the TiO2-rich com-
position falls off this correlation line, due to an
enhanced solubility of Mo4+ over Mo6+ . Leaving this
composition out, regression of the remaining 16 data
pairs gives:
log csil meltMoO2
¼ 1:49ðF0:06Þlog csil meltMoO3
� 3:59ðF0:14Þ ð12Þ
with vm2 = 2.9, using the uncertainties in Table 7. Much
of the misfit is due to one composition, MAS2, with
no CaO and relatively low levels of dissolved Mo.
Without this composition, the value of vm2 would be
1.6. Although the relationship between cMoO2
sil melt and
cMoO3
sil melt is just an empirical one, the low value of vm2
indicates that the uncertainties in activity coefficients
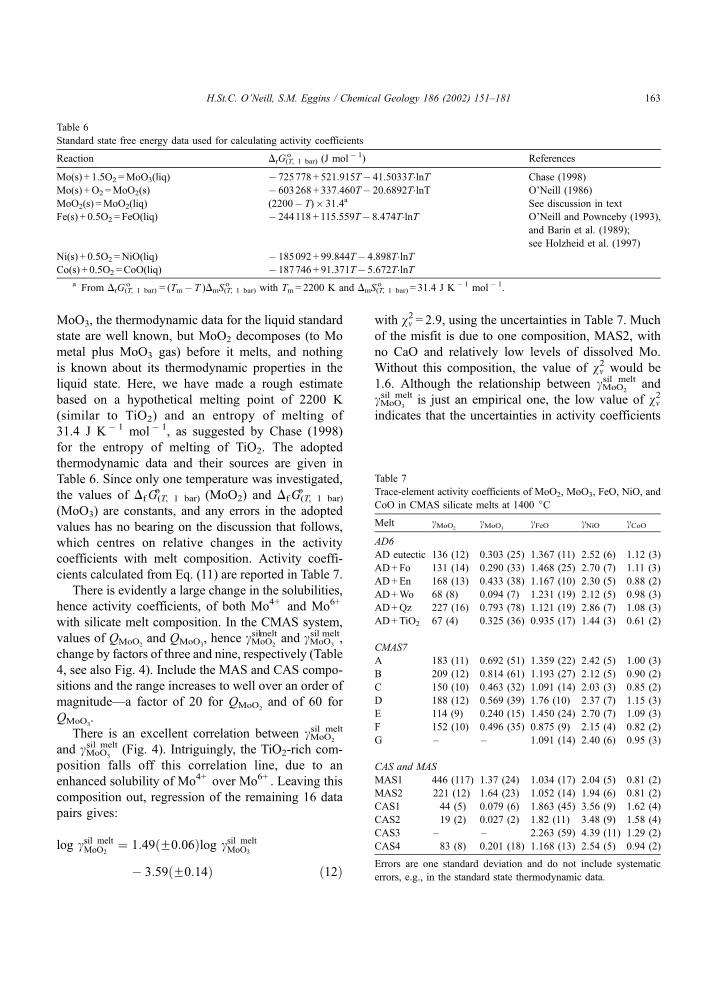
Table 6
Standard state free energy data used for calculating activity coefficients
Reaction DrG(T, 1 bar)o (J mol� 1) References
Mo(s) + 1.5O2 =MoO3(liq) � 725778 + 521.915T� 41.5033T�lnT Chase (1998)
Mo(s) +O2 =MoO2(s) � 603268 + 337.460T� 20.6892T�lnT O’Neill (1986)
MoO2(s) =MoO2(liq) (2200� T)� 31.4a See discussion in text
Fe(s) + 0.5O2 = FeO(liq) � 244118 + 115.559T� 8.474T�lnT O’Neill and Pownceby (1993),
and Barin et al. (1989);
see Holzheid et al. (1997)
Ni(s) + 0.5O2 =NiO(liq) � 185092 + 99.844T� 4.898T�lnTCo(s) + 0.5O2 =CoO(liq) � 187746 + 91.371T� 5.672T�lnT
a From DrG(T, 1 bar)o = (Tm� T )DmS(T, 1 bar)
o with Tm= 2200 K and DmS(T, 1 bar)o = 31.4 J K� 1 mol� 1.
Table 7
Trace-element activity coefficients of MoO2, MoO3, FeO, NiO, and
CoO in CMAS silicate melts at 1400 jC
Melt cMoO2cMoO3
cFeO cNiO cCoO
AD6
AD eutectic 136 (12) 0.303 (25) 1.367 (11) 2.52 (6) 1.12 (3)
AD+Fo 131 (14) 0.290 (33) 1.468 (25) 2.70 (7) 1.11 (3)
AD+En 168 (13) 0.433 (38) 1.167 (10) 2.30 (5) 0.88 (2)
AD+Wo 68 (8) 0.094 (7) 1.231 (19) 2.12 (5) 0.98 (3)
AD+Qz 227 (16) 0.793 (78) 1.121 (19) 2.86 (7) 1.08 (3)
AD+TiO2 67 (4) 0.325 (36) 0.935 (17) 1.44 (3) 0.61 (2)
CMAS7
A 183 (11) 0.692 (51) 1.359 (22) 2.42 (5) 1.00 (3)
B 209 (12) 0.814 (61) 1.193 (27) 2.12 (5) 0.90 (2)
C 150 (10) 0.463 (32) 1.091 (14) 2.03 (3) 0.85 (2)
D 188 (12) 0.569 (39) 1.76 (10) 2.37 (7) 1.15 (3)
E 114 (9) 0.240 (15) 1.450 (24) 2.70 (7) 1.09 (3)
F 152 (10) 0.496 (35) 0.875 (9) 2.15 (4) 0.82 (2)
G – – 1.091 (14) 2.40 (6) 0.95 (3)
CAS and MAS
MAS1 446 (117) 1.37 (24) 1.034 (17) 2.04 (5) 0.81 (2)
MAS2 221 (12) 1.64 (23) 1.052 (14) 1.94 (6) 0.81 (2)
CAS1 44 (5) 0.079 (6) 1.863 (45) 3.56 (9) 1.62 (4)
CAS2 19 (2) 0.027 (2) 1.82 (11) 3.48 (9) 1.58 (4)
CAS3 – – 2.263 (59) 4.39 (11) 1.29 (2)
CAS4 83 (8) 0.201 (18) 1.168 (13) 2.54 (5) 0.94 (2)
Errors are one standard deviation and do not include systematic
errors, e.g., in the standard state thermodynamic data.
H.St.C. O’Neill, S.M. Eggins / Chemical Geology 186 (2002) 151–181 163

(Table 7) are reasonable. This latter point is important
when attempting to determine the factors controlling
the values of cMoO2
sil melt and cMoO3
sil melt as a function of melt
composition since it means that a satisfactory model
must explain the data to the level of these uncertain-
ties.
The main influence on the variation in cMoO2
sil melt
and cMoO3
sil melt is the amount of CaO in the melt, as
shown in Fig. 5a,b, where log cMoO2
sil melt and log cMoO3
sil melt
are plotted against XCaO. These plots also show that
the anomaly in the TiO2-rich composition is due to a
lower value of cMoO2
sil melt rather than anything in the
cMoO3
sil melt datum.
However, even omitting the TiO2-rich composi-
tion, a simple model relating log cMoO2
sil melt and log
cMoO3
sil melt to XCaO is not sufficient to account for all the
variation. For example, a linear relationship yields
values of vm2 of 9.7 and 11.3 for the MoO2 and the
MoO3 data, respectively. Including a term in (XCaO)2
brings down the value of vm2 for the MoO2 data to 3.9,
but hardly affects the quality of the fit to the MoO3
data. Nevertheless, it is clear that the functional form
of the relationship between the activity coefficients
and XCaO needs to use the logarithm of the activity
coefficients.
This logarithmic nature of the functional relation-
ship suggests that a regular or subregular (Margules)
type of solution model might be appropriate. The
activity coefficient of a trace-element component
(i.e., the activity coefficient of a component at infinite
dilution) in the multicomponent subregular solution
formalism has the algebraic form (cf. Helffrich and
Wood, 1989):
ln cli ¼Xnj¼1
Xjk¼1
ajkXjXk ð13Þ
For a system containing n major-element components,
there are thus 1/2n(n+ 1) terms in this equation (thus,
10 in CMAS). Here, we used the following simplified
equation:
log csil meltMoOx=2
¼ a1ðXCaOÞ2 þ a2ðXMgOÞ2
þ a3ðXCaOXMgOÞ þ a0 ð14ÞFig. 4. Empirical correlation between cMoO2
sil melt and cMoO3
sil melt. Error bars
are one standard deviation. Note that the TiO2-rich composition
(AD+TiO2) falls well off the best-fit line.
Fig. 5. log cMoO2
sil melt and log cMoO3
sil melt versus XCaO. Although the
correlations are good, this simple relationship does not fit the data
within the estimated uncertainties (error bars are two standard
deviations). Comparison of the trends of these two figures indicates
that the anomalous result for the TiO2-rich composition (shown as a
triangle symbol) implied in Fig. 4 is due to the effect of TiO2 on
cMoO2
sil melt and not cMoO3
sil melt.
H.St.C. O’Neill, S.M. Eggins / Chemical Geology 186 (2002) 151–181164

where, with reference to the usual notation (e.g.,
Helffrich and Wood, 1989):
a1uWMoxþ�Ca
2:303RTð15Þ
a2uWMoxþ�Mg
2:303RTð16Þ
a3
uðW
Moxþ�CaþW
Ca�Moxþ þWMoxþ�Mg
þWMg�Moxþ �WCa�Mg �WMg�CaÞ
2� 2:303RT
ð17Þ
and all the possible W parameters involving Al and Si
are zero. The inclusion of the constant term a0 is an ad
hoc device to compensate for these neglected terms in
Al and Si. It may also serve to account for any
systematic errors in the standard state data.
The equation provides an excellent fit to both
cMoO2
sil melt and cMoO3
sil melt, with values of vm2 of 1.6 and 2.7,
respectively (see Table 8). It is notable that the values
of a1 and a2, corresponding to WMox+ –Ca and
WMox+ –Mg, are both negative. This contrasts with
the positive values of W parameters generally encoun-
tered in solid solutions, at least in the absence of
order–disorder effects. These positive deviations from
ideality are related to size mismatch between the
substituting species (e.g., Davies and Navrotsky,
1983). It is this size-mismatch effect in crystals that
underlies the lattice-strain theory of trace-element
partition coefficients (e.g., Brice, 1975; Blundy and
Wood, 1991, 1994). The negative values of the W
parameters found here point rather to a different
phenomenon to that operating in melts, more akin to
complex formation. This and its implications will be
discussed further below.
The anomalous TiO2-rich datum could be inter-
preted as indicating a Mo4+ –Ti complex, but we can
think of no chemical justification for the existence of
such a complex. Rather, it seems that a different
mechanism must be operating here. The Ti in the
silicate melt has the same charge (4+) and ionic radius
as Mo4+, and therefore the presence of Ti as a major
constituent of the melt should define locations in the
melt structure, analogous to crystallographic sites,
with the appropriate chemical environment for Mo4+.
To put these results in perspective, natural basaltic
magmas (sensu lato) have XCaO ranging from f 0.05
(peridotitic komatiites, some lamproites) to f 0.20
(melilitites, ankaramites). This is rather less than the
range of XCaO used in our experiments, but is still
sufficient to cause cMoO3
sil melt to vary by nearly an order
of magnitude, for example. Our results qualitatively
show a similar trend to that found by Walter and
Thibault (1995) from their metal/silicate-melt parti-
tioning experiments for Mo, but quantitatively, we
cannot account for the two orders-of-magnitude var-
iation in partition coefficients that they observed.
Moreover, their melt compositions varied mainly in
MgO content, not CaO, and from our results, this
should have a much less dramatic effect.
3.3. Fe, Ni and Co activity coefficients
Activity coefficients for Fe, Ni and Co were
calculated via Eq. (8) and using the analytical data
in Tables 1, 3 and 4) are given in Table 5. For Ni and
Co, the weighted means of the LA-ICP-MS and
electron microprobe analyses were used, assuming a
weight of F 3%, one standard deviation, for the LA-
ICP-MS results, and the empirically observed stand-
ard deviation of the electron microprobe analyses
(Table 3). The standard deviations of cNiOsil melt and
cCoOsilmelt quoted in Table 5 are the standard errors of
these weighted means, and are about 2.5%, and are
entirely from propagation of the analytical errors.
They do not include systematic errors (e.g., in the
standard state thermochemical data) or the uncertain-
ties in measured fO2.
The values of cFeOsil melt, cNiO
sil melt, and cCoOsil melt vary
by about a factor of two as a function of melt
composition, much less than the variation in cMoO2
sil melt
and cMoO3
sil melt. For most compositions, the values of
cFeOsil melt cluster around 1.3, that is, tending towards
Table 8
Results of fitting the activity coefficients of MoO2 and MoO3 as a
function of composition to the equation:
log csil meltMoOx=2
¼ a1ðXCaOÞ2 þ a2ðXMgOÞ2 þ a3ðXCaOXMgOÞ þ a0
Parameter MoO2 MoO3
a1 � 5.24 (24) � 7.93 (25)
a2 � 1.73 (38) � 1.33 (53)
a3 � 2.51 (58) � 8.07 (73)
a0 2.53 (3) 0.24 (4)
vm2 1.59 2.75
H.St.C. O’Neill, S.M. Eggins / Chemical Geology 186 (2002) 151–181 165

small positive deviations from ideality; values of
cCoOsil melt are around 1.0, or approximately ideal; and
values of cNiOsil melt are around 2.5.
The remarkable feature of the results is that all
three activity coefficients depend on melt composition
in more or less the same way, which can be illustrated
by plotting one against another, as in Fig. 6a,b. These
correlations indicate that there is some fundamental
chemical property of the melts that controls the value
of the activity coefficients of these compatible ele-
ments. Unfortunately, it is not clear what this property
is. There is no obvious correlation with any simple
compositional variable such as XCaO or XMgO, in
contrast to the behaviour of cMoO2
sil melt and cMoO3
silmelt; there-
fore, the four-parameter fit used successfully to
describe the compositional dependence of cMoO2
sil melt
and cMoO3
sil melt does not describe the variation in cFeOsil melt,
cNiOsil melt or cCoO
sil melt adequately. It is possible to fit the
data for all three oxides quite well using a full
subregular solution model (Eq. (13)), but this has 10
terms, and to use a 10-term model to fit 18 data is not
very satisfying intellectually. The fits to the Ni and Co
data are good, with vm2 of 3.1 and 1.3, respectively.
The parameters for these fits are given in Table 9, not
because we believe they have much general signifi-
cance, but because they provide a way to compare our
results with previous work. For the Fe data, the value
of vm2 is 17.7, which may reflect an over-optimistic
assessment of the analytical errors, or perhaps some-
what greater complexity in the solution properties of
FeO in silicate melts.
It would be interesting to know if the variation in
cFeOsil melt, cNiO
sil melt, and cCoOsil melt with melt composition
correlated with the variation in the activity coefficient
of the major component MgO. Although, as yet,
neither direct measurement nor thermodynamic mod-
elling of phase equilibrium data can yield values of
cMgOsil melt with the required accuracy for the range of
melt compositions used in this study, the well-known
lack of a significant compositional dependence for the
distribution of Fe2+ and Mg between olivine and melt
(KDFe–Mgol/melt ) shows that cMgO
sil melt is indeed well corre-
lated with cFeOsil melt for that subset of melt compositions
Fig. 6. Correlation of (a) cFeOsil melt with cNiO
sil melt, and (b) cCoOsil melt with
cNiOsil melt.
Table 9
Coefficients from the fitting of cMsil melt to the polynomial expression:
ln csil meltM ¼ R4
j¼1 Rjk¼1 ajkXjXk
XCa XMg XAl XSi
Ni (vm2 = 3.1)
XCa 6.26 14.97 18.77 � 10.23
XMg 7.92 11.68 � 10.47
XAl � 5.74 � 2.46
XSi 5.19
Co (vm2 = 1.34)
XCa 5.99 13.21 16.62 � 11.43
XMg 2.59 12.27 � 9.37
XAl � 1.62 � 6.59
XSi 3.67
Fe (vm2 = 17.7)
XCa 6.62 16.30 3.74 � 8.50
XMg 6.09 � 3.21 � 7.34
XAl � 2.61 6.08
XSi 1.16
H.St.C. O’Neill, S.M. Eggins / Chemical Geology 186 (2002) 151–181166
that are in equilibrium with olivine. This point was
made previously by Roeder (1974).
There are also some real anomalies that fall off the
correlations shown in Fig. 6a,b. For the CAS3 com-
position, which stands out from the other composi-
tions on account of its very high silica and high
alumina, the values of both cFeOsil melt and cNiO
sil melt stand
out as the highest of any composition studied, whereas
cCoOsil melt for this composition appears average. The
CAS3 composition is the nearest thing to a granitic
type of composition used in this study. Among the Fe
data, cFeOsil melt for the composition CMAS-D seems
unusually high, for no obvious reason. This result has
been checked in the course of a parallel study
(O’Neill, unpublished data) and appears real. These
exceptions suggest that further complexity would
emerge if the compositional range studied were to
be enlarged. Such a study would seem worthwhile in
that more data may yet reveal a pattern that is not
presently apparent.
4. Comparison with previous experimental studies
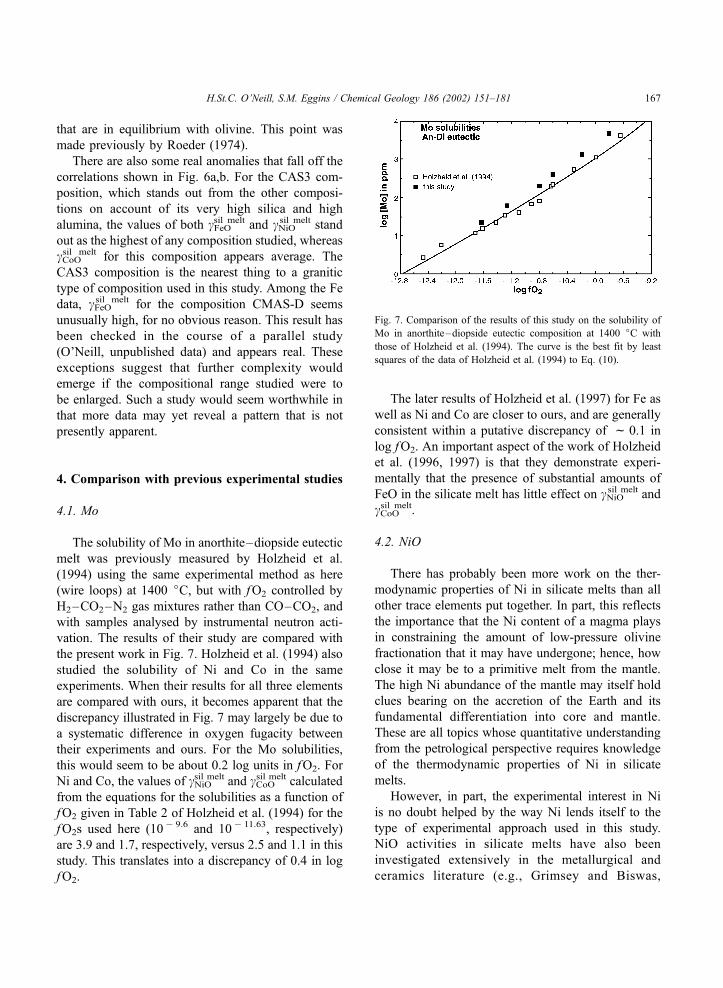
4.1. Mo
The solubility of Mo in anorthite–diopside eutectic
melt was previously measured by Holzheid et al.
(1994) using the same experimental method as here
(wire loops) at 1400 jC, but with fO2 controlled by
H2–CO2–N2 gas mixtures rather than CO–CO2, and
with samples analysed by instrumental neutron acti-
vation. The results of their study are compared with
the present work in Fig. 7. Holzheid et al. (1994) also
studied the solubility of Ni and Co in the same
experiments. When their results for all three elements
are compared with ours, it becomes apparent that the
discrepancy illustrated in Fig. 7 may largely be due to
a systematic difference in oxygen fugacity between
their experiments and ours. For the Mo solubilities,
this would seem to be about 0.2 log units in fO2. For
Ni and Co, the values of cNiOsil melt and cCoO
sil melt calculated
from the equations for the solubilities as a function of
fO2 given in Table 2 of Holzheid et al. (1994) for the
fO2s used here (10 � 9.6 and 10� 11.63, respectively)
are 3.9 and 1.7, respectively, versus 2.5 and 1.1 in this
study. This translates into a discrepancy of 0.4 in log
fO2.
The later results of Holzheid et al. (1997) for Fe as
well as Ni and Co are closer to ours, and are generally
consistent within a putative discrepancy of f 0.1 in
log fO2. An important aspect of the work of Holzheid
et al. (1996, 1997) is that they demonstrate experi-
mentally that the presence of substantial amounts of
FeO in the silicate melt has little effect on cNiOsil melt and
cCoOsil melt.
4.2. NiO
There has probably been more work on the ther-
modynamic properties of Ni in silicate melts than all
other trace elements put together. In part, this reflects
the importance that the Ni content of a magma plays
in constraining the amount of low-pressure olivine
fractionation that it may have undergone; hence, how
close it may be to a primitive melt from the mantle.
The high Ni abundance of the mantle may itself hold
clues bearing on the accretion of the Earth and its
fundamental differentiation into core and mantle.
These are all topics whose quantitative understanding
from the petrological perspective requires knowledge
of the thermodynamic properties of Ni in silicate
melts.
However, in part, the experimental interest in Ni
is no doubt helped by the way Ni lends itself to the
type of experimental approach used in this study.
NiO activities in silicate melts have also been
investigated extensively in the metallurgical and
ceramics literature (e.g., Grimsey and Biswas,
Fig. 7. Comparison of the results of this study on the solubility of
Mo in anorthite–diopside eutectic composition at 1400 jC with
those of Holzheid et al. (1994). The curve is the best fit by least
squares of the data of Holzheid et al. (1994) to Eq. (10).
H.St.C. O’Neill, S.M. Eggins / Chemical Geology 186 (2002) 151–181 167

1976, 1977; Lacy and Pask, 1970), but on melt
compositions so far removed from either natural
magmas or the synthetic compositions used here as
to prevent meaningful comparison. We therefore
discuss only that part of the literature bearing on
geologically relevant melt compositions. We will not
discuss the large literature on various crystal/melt
partition coefficients of Ni, as it is not possible to
disentangle the effects of melt composition on
cNiOsil melt from other variables. Nor do we discuss
experiments on metal/melt partition coefficients in
which the composition of the metal is not Ni-rich, as
in these experiments, the effect of melt composition
is usually obscured by the uncertainties in calculating
the activity of Ni in the metal. This still leaves a fair
number of studies (Campbell et al., 1979; Doyle and
Naldrett, 1987; Dudson and Fraser, 1981; Pretorius
and Muan, 1992; Snyder and Carmichael, 1992;
Holzheid et al., 1994, 1997; Dingwell et al., 1994;
Ertel et al., 1997).
At first sight, most of these studies appear to
report values of cNiOsil melt much greater than those
found in this study (i.e., 2>cNiOsil melt < 5). This is due
to a choice of solid NiO as the standard state,
compounded by the use of older thermodynamic data
for the Ni–NiO(s) equilibrium. We have therefore
converted all quoted results to the standard state of
liquid NiO used here, using the thermodynamic data
in Table 6. From Eq. (8), it can be seen that changing
the standard state requires only that the reported
value of cNiOsil melt be multiplied by a factor that depends
on temperature. A systematic error in oxygen fugac-
ity, which is the most likely error experimentally, also
results in changing cNiOsil melt by a constant factor at
constant temperature. Many of the studies have much
higher levels of NiO in the melt than used here, but
this does not seem to be an issue as cNiOsil melt remains
constant within the accuracy of these studies to
surprisingly high values (at least 10 wt.% NiO—
e.g., Lacy and Pask, 1970; Doyle and Naldrett,
1987).
Campbell et al. (1979) studied Ni solubilities in a
range of melt compositions from basalt to dacite,
using essentially the same wire loop techniques as
used here, at 1200–1400 jC. Because their melt
compositions were based on natural melts, they
contained FeO as a significant component. This
introduces the additional experimental complexity
that Fe partitions into the Ni metal. However, the
amount of Fe in the metal is small (f 2%), and
Campbell et al. demonstrated that local equilibrium at
the wire’s interface with the melt was reached by
calculating values of cFeOsil melt that appear reasonable
(and in good agreement with the range of values
found in this study). Alkali loss from the starting
compositions was another problem, and this resulted
in the final compositions of the melts being more
siliceous than intended: for example, the dacite ended
up more akin to a peraluminous rhyolite. The values
of cNiOsil melt reported by Campbell et al. need to be
multiplied by factors of 0.23 at 1200 jC, 0.31 at
1300 jC and 0.41 at 1400 jC to adjust them to the
standard state of this study. This removes the large
temperature dependence shown by Campbell et al.
(Note that the simplest behaviour of an activity
coefficient with temperature that is expected from
basic thermochemical principles is for the quantity
RT log c to be independent of temperature, rather
than c itself. This is because constant RT log cimplies a constant excess enthalpy of mixing and
zero excess entropy of mixing, whereas a constant cwould require a nonzero excess entropy of mixing.)
For the basaltic compositions studied, the recalcu-
lated values of cNiOsil melt are quite similar to the range
found here (i.e., about 2.5—see Fig. 6a,b). However,
the recalculated value for the extreme ‘‘dacite’’ com-
position is f 9 at 1400 jC, substantially higher than
even the most silica-rich composition in this study
(CAS3). Snyder and Carmichael (1992) also inves-
tigated seven FeO-containing natural basaltic compo-
sitions in equilibrium with Ni–Fe metal wire between
1395 and 1562 K, but their reported values of
cNiOsil melt are much greater than those of other studies
for basaltic or near-basaltic compositions, being in
the range 6.7–18.3 when corrected to our standard
state.
Dingwell et al. (1994) used a variation on the
experimental approach of this study, namely the
stirred crucible method. They investigated a silicate
melt composition consisting of the anorthite–diop-
side eutectic plus 10% CaO. Later, Ertel et al. (1997)
used the same method to study the effect of changing
the melt composition. They investigated three joins,
each starting with the anorthite–diopside eutectic
composition, to which progressive amounts of
Mg2SiO4, SiO2 and Na2SiO3 were added to the
H.St.C. O’Neill, S.M. Eggins / Chemical Geology 186 (2002) 151–181168

stirred crucible. They found little change of solubility
along the first two joins, in good agreement with the
results of this study for the compositions AD eutectic,
AD+ Fo, and AD+Qz (Table 3). Values of cNiOsil melt
derived from their experiments are about 3.2, versus
2.8 in this study. In contrast, they observed quite
marked changes in Ni solubility along the join AD
eutectic–Na2SiO3, with the solubility of Ni first
decreasing then increasing as Na2SiO3 was added.
This suggests that further investigation of the effect
of alkalis would uncover some interesting behaviour.
The stirred crucible method, although tedious com-
pared to the wire-loop technique used in this paper,
has the advantage that alkali loss by evaporation is
kept to reasonable levels, although it is not entirely
negligible.
The closest of the previous Ni studies in aims to
this one are those of Dudson and Fraser (1981) and
Pretorius and Muan (1992). Dudson and Fraser
investigated a wide range of compositions in the
CMAS system, including some in the CaO–MgO–
SiO2 (CMS) ternary subsystem. They too used the
wire loop method, but with CO2–H2 gas mixtures at
1445 jC. Dudson and Fraser report their results
relative to a standard state of solid NiO; to convert
their reported values of cNiOsil melt at 1445 jC to the
standard state used here, multiply by 0.57. Their
corrected results for cNiOsil melt range from 1.3 for
CaMgSi2O6 (diopside melt) to 2.6 for a couple of
high Ca, high Al compositions. Dudson and Fraser
found that their Al-free compositions (like CaMg-
Si2O6) consistently gave lower values of cNiOsil melt, but
beyond this were unable to discern any consistent
pattern in their data—which must unfortunately also
be the conclusion of this study.
To compare quantitatively the data of Dudson and
Fraser (1981) with the results of this study, we have
calculated values of cNiOsil melt for the compositions used
by Dudson and Fraser at 1445 jC using the fit of our
data at 1400 jC to the subregular formalism (Eq. (13);
parameters in Table 9). The resulting calculated values
are compared to the observed values (corrected to the
same standard state of liquid NiO) in Fig. 8a. There is
a fair correlation, although clearly the calculated
values are systematically higher. The small temper-
ature difference between the two sets of data is not
sufficient to account for this; rather, the discrepancy is
probably due to a systematic difference in the meas-
urement of oxygen fugacity between our experiments
and those of Dudson and Fraser. Least squares regres-
sion of the calculated versus the observed values gives
Fig. 8. Comparison of previous measurements of cNiOsil melt in CMAS
melts with cNiOsil melt predicted from the results of the present study,
using the fit to Eq. (13) given in Table 9. (a) Dudson and Fraser
(1981) at 1445 jC; (b) Pretorius and Muan (1992) at 1400 jC.
H.St.C. O’Neill, S.M. Eggins / Chemical Geology 186 (2002) 151–181 169

a factor of 1.36, which corresponds to an average
discrepancy of 0.27 in log fO2.
The relatively low values of cNiOsil melt in Al-free
systems found by Dudson and Fraser were confirmed
by Pretorius and Muan (1992), who studied compo-
sitions in the Al-free CMS ternary, and with 10% and
20% Al2O3 added, at 1400 jC (the same temperature
as this study). These authors also report their results
relative to a standard state of solid NiO, using an even
older calibration of the Ni–NiO(s) equilibrium, which
requires a correction factor at 1400 jC of 0.39. The
comparison between their corrected observed values
and those calculated from Eq. (13) (Table 9) is shown
in Fig. 8b. Two points need to be made. Firstly, the
observed values are displaced relative to the calcu-
lated values in the opposite sense to those of Dudson
and Fraser (1981); the best-fit correction factor, con-
sidering only the 10% and 20% Al2O3 data, is 0.78,
implying a discrepancy of 0.21 in fO2. In addition to
this, there is an obvious systematic discrepancy
depending on the Al2O3 content, implying that our
empirical fit to our 18 compositions cannot even
provide a satisfactory general description of the
CMAS system.
Pretorius and Muan (1992) also investigated the
effect of adding 5–7.5 wt.% K2O to their CMS
compositions. The resulting values of cNiOsil melt are
indistinguishable from those in the CMS system,
indicating a negligible effect of K2O, at least in the
absence of any Al2O3 in the system. This is in contrast
to the results of Ertel et al. (1997) on the effect of
adding Na2SiO3 to AD eutectic, but at present, there
are insufficient data on the effects of the alkalis to
warrant any general conclusions.
Doyle and Naldrett (1987) investigated a quasi-
ternary system that they described as ‘‘Matrix–NiO–
MgO’’ where ‘‘Matrix’’ is a cNiOsil melt composition in the
CAS–TiO2–K2O system with about 1% TiO2 and 2–
4% K2O. They employed three fO2 conditions, cor-
responding to values of the activity of NiO (aNiO) of
0.096, 0.196 and 0.297, respectively (recalculated to
our standard state), at 1400 jC. There is no discern-
ible difference in values of cNiOsil melt calculated from the
different fO2s; thus, their results can be projected onto
a quasi-binary between ‘‘Matrix’’ and MgO. Their
results are summarized in this way in Fig. 9. Adding
MgO to the ‘‘Matrix’’ composition does not seem to
have any effect either; hence, in the absence of any
systematic compositional trends, the scatter in their
data must be ascribed to experimental noise. The
mean of all their data is 2.78, with an uncertainty of
F 0.25. To put this uncertainty into an experimental
context cNiOsil melt, it corresponds to an uncertainty in log
fO2 of F 0.05, coupled with an analytical uncertainty
for Ni in the melt of F 5%. From our experience,
these are quite reasonable experimental uncertainties,
and this makes the point that a high degree of
experimental precision is needed for studying the
‘‘fine structure’’ of the variation of cNiOsil melt with melt
composition.
To compare further the results of Doyle and Nal-
drett (1987) with ours, we have projected their com-
positions onto the CMAS system by subtracting TiO2
and K2O and recalculating to 100%. The comparison
is given in Fig. 9. The fit to our results predicts that
adding MgO should cause a decrease of cNiOsil melt, but,
as noted above, this is not evident in the results of
Doyle and Naldrett. Perhaps, it is lost in the exper-
imental noise. Nevertheless, the mean value of cNiOsil melt
from the results of Doyle and Naldrett agrees quite
well with the average of our predicted values.
In conclusion, there is good agreement that values
of cNiOsil melt in basaltic melts fall in the range 2.5–3.5 at
Fig. 9. Comparison of measurements of cNiOsil melt of Doyle and
Naldrett (1987) at three different values of aNiO as a function of
XMgO in the quasi-ternary system ‘‘Matrix’’–MgO–NiO, with the
predicted dependence of cNiOsil melt on melt composition from the
present study (shown as the dashed curve). The present results
predict that cNiOsil melt should decrease with XMgO at least to
XMgO = 0.15, which is not seen in the results of Doyle and Naldrett.
In fact, the data of Doyle and Naldrett show no discernible
dependence on composition. The observed scatter is equivalent to
experimental uncertainties of F 0.05 in log fO2 combined with
F 5% in Ni analyses, shown as the error bar.
H.St.C. O’Neill, S.M. Eggins / Chemical Geology 186 (2002) 151–181170

1400 jC when normalized to a standard state of liquid
NiO. Only the study of Snyder and Carmichael (1992)
disagrees with this generalization. As shown by Holz-
heid et al. (1997), any temperature dependence is
modest when cNiOsil melt is calculated relative to the liquid
standard state. However, variations of cNiOsil melt within
the observed range are real and not just from exper-
imental noise, as demonstrated in this study by the
correlations between cNiOsil melt and cFeO
sil melt or cCoOsil melt.
Hence, modelling of cNiOsil melt as a function of melt
composition may be required for some quantitative
petrological applications. There is evidence suggest-
ing that extremely siliceous melts may have larger
values of cNiOsil melt (e.g., Campbell et al., 1979), but this
requires further work. It is also unfortunately apparent
that systematic inter-laboratory differences in the
measurement of oxygen fugacity are of the order of
0.2 in log fO2, and in many previous studies precision
was not much better. This introduces uncertainties that
are large enough to frustrate the idea of pooling the
results of all the different studies to provide an
expanded range of melt compositions on which a
general model might be based.
4.3. FeO
Surprisingly, given its importance as a major com-
ponent in natural magmas, there has been less work on
the thermodynamic properties of FeO than NiO in
silicate melts in the geological literature. This imbal-
ance is somewhat rectified by the wealth of informa-
tion on the activities of FeO in slags in the metal-
lurgical literature, but this work has concentrated on
simple systems generally without Al2O3 or MgO as
major components. Recent results on CMAS–FeO
slags (see, for example, Liu et al., 2001) cover
compositions much poorer in silica than those of
geological interest or used in this study. In the geo-
logical literature, we are aware only of the studies of
Roeder (1974), Doyle and Naldrett (1986), Doyle
(1988, 1989), and Holzheid and Palme (1996) and
Holzheid et al. (1997) as providing suitable compar-
isons with our data.
Roeder (1974) reported 47 results on natural basal-
tic compositions between 1150 and 1306 jC using the
‘‘stirred crucible’’ method. Roeder reported his results
relative to a standard state of liquid FeO, using
thermodynamic data so close to those used here that
no correction is needed. His reported values of cFeOsil melt
range from 0.79 to 2.00, virtually identical to the
range found here.
The series of studies by Doyle and Naldrett (1986)
and Doyle (1988, 1989) using the wire-loop method
contains a wealth of data at one temperature (1327 jC),on relatively simple systems quite closely comparable
in composition to those investigated here. One val-
uable difference is that the Doyle experiments inves-
tigated several different values of aFeOsil melt rather than
just the single value of aFeOsil melt of this study, and thus
cover a large range of FeO concentrations. They
show unequivocally that the relationship between
FeO concentration and cFeOsil melt is very simple, with
cFeOsil melt! 1 perfectly smoothly as XFeO! 1. In what
follows, we have converted results from all three of
the Doyle studies to our choice of standard state
(Table 9). Also, Doyle and Naldrett (1986) report
mole factions using moles of Al2O3, K2O and Na2O
rather than the single-cation convention we use here
(i.e., AlO1.5, KO0.5, NaO0.5), and we have accordingly
converted their reported mole fractions to our con-
vention. This increases cFeOsil melt by nearly 10% for their
compositions.
Doyle and Naldrett (1986) studied three systems
of the type ‘‘Matrix–MgO–FeO’’ in which the
‘‘Matrix’’ is composed of a CASFTiO2FK2OFNa2O composition based on a standard diabase, an
average mid-ocean ridge basalt (MORB), and a high-
Ti lunar mare basalt, respectively. Much of the Na2O
and some of the K2O were lost by volatilization
during the experiments; hence, these components are
of minor importance in the final compositions and the
systems are similar to the CMAS–FeO (FTiO2)
systems of this study, except, as mentioned above,
that their study extends to far higher FeO contents
(f 60 wt.% FeO). The main difference between the
first two systems is that the ‘‘diabase’’ is slightly
higher in silica content than the ‘‘MORB’’. Because
the systems have only two degrees of compositional
freedom (since Matrix +MgO+FeO must add up to
100%), it is easy to check the data for any systematic
variations of cFeOsil melt with composition (e.g., XMgO or
XFeO or the product of both). When the ‘‘diabase’’ and
the ‘‘MORB’’ systems are considered together, no
consistent pattern of compositional variation is dis-
cernible, and each quasi-ternary systems can be fitted
to a single value of cFeOsil melt; for the ‘‘diabase’’ system,
H.St.C. O’Neill, S.M. Eggins / Chemical Geology 186 (2002) 151–181 171
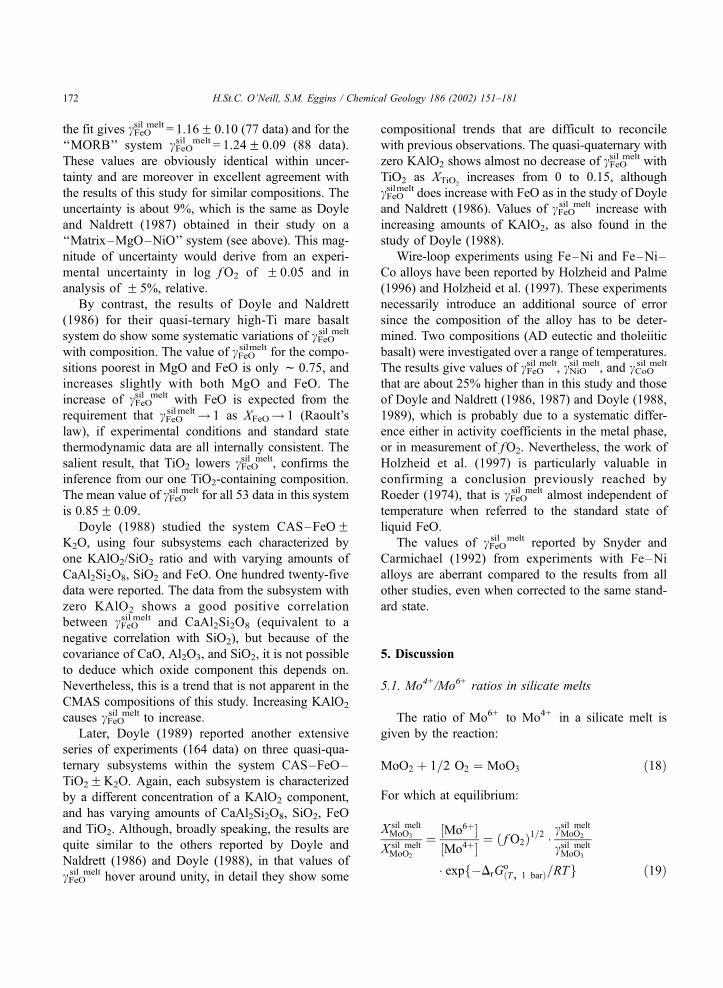
the fit gives cFeOsil melt = 1.16F 0.10 (77 data) and for the
‘‘MORB’’ system cFeOsil melt = 1.24F 0.09 (88 data).
These values are obviously identical within uncer-
tainty and are moreover in excellent agreement with
the results of this study for similar compositions. The
uncertainty is about 9%, which is the same as Doyle
and Naldrett (1987) obtained in their study on a
‘‘Matrix–MgO–NiO’’ system (see above). This mag-
nitude of uncertainty would derive from an experi-
mental uncertainty in log fO2 of F 0.05 and in
analysis of F 5%, relative.
By contrast, the results of Doyle and Naldrett
(1986) for their quasi-ternary high-Ti mare basalt
system do show some systematic variations of cFeOsil melt
with composition. The value of cFeOsilmelt for the compo-
sitions poorest in MgO and FeO is only f 0.75, and
increases slightly with both MgO and FeO. The
increase of cFeOsil melt with FeO is expected from the
requirement that cFeOsilmelt! 1 as XFeO! 1 (Raoult’s
law), if experimental conditions and standard state
thermodynamic data are all internally consistent. The
salient result, that TiO2 lowers cFeOsil melt, confirms the
inference from our one TiO2-containing composition.
The mean value of cFeOsil melt for all 53 data in this system
is 0.85F 0.09.
Doyle (1988) studied the system CAS–FeOFK2O, using four subsystems each characterized by
one KAlO2/SiO2 ratio and with varying amounts of
CaAl2Si2O8, SiO2 and FeO. One hundred twenty-five
data were reported. The data from the subsystem with
zero KAlO2 shows a good positive correlation
between cFeOsil melt and CaAl2Si2O8 (equivalent to a
negative correlation with SiO2), but because of the
covariance of CaO, Al2O3, and SiO2, it is not possible
to deduce which oxide component this depends on.
Nevertheless, this is a trend that is not apparent in the
CMAS compositions of this study. Increasing KAlO2
causes cFeOsil melt to increase.
Later, Doyle (1989) reported another extensive
series of experiments (164 data) on three quasi-qua-
ternary subsystems within the system CAS–FeO–
TiO2FK2O. Again, each subsystem is characterized
by a different concentration of a KAlO2 component,
and has varying amounts of CaAl2Si2O8, SiO2, FeO
and TiO2. Although, broadly speaking, the results are
quite similar to the others reported by Doyle and
Naldrett (1986) and Doyle (1988), in that values of
cFeOsil melt hover around unity, in detail they show some
compositional trends that are difficult to reconcile
with previous observations. The quasi-quaternary with
zero KAlO2 shows almost no decrease of cFeOsil melt with
TiO2 as XTiO2increases from 0 to 0.15, although
cFeOsilmelt does increase with FeO as in the study of Doyle
and Naldrett (1986). Values of cFeOsil melt increase with
increasing amounts of KAlO2, as also found in the
study of Doyle (1988).
Wire-loop experiments using Fe–Ni and Fe–Ni–
Co alloys have been reported by Holzheid and Palme
(1996) and Holzheid et al. (1997). These experiments
necessarily introduce an additional source of error
since the composition of the alloy has to be deter-
mined. Two compositions (AD eutectic and tholeiitic
basalt) were investigated over a range of temperatures.
The results give values of cFeOsil melt, cNiO
sil melt, and cCoOsil melt
that are about 25% higher than in this study and those
of Doyle and Naldrett (1986, 1987) and Doyle (1988,
1989), which is probably due to a systematic differ-
ence either in activity coefficients in the metal phase,
or in measurement of fO2. Nevertheless, the work of
Holzheid et al. (1997) is particularly valuable in
confirming a conclusion previously reached by
Roeder (1974), that is cFeOsil melt almost independent of
temperature when referred to the standard state of
liquid FeO.
The values of cFeOsil melt reported by Snyder and
Carmichael (1992) from experiments with Fe–Ni
alloys are aberrant compared to the results from all
other studies, even when corrected to the same stand-
ard state.
5. Discussion
5.1. Mo4+/Mo6+ ratios in silicate melts
The ratio of Mo6+ to Mo4+ in a silicate melt is
given by the reaction:
MoO2 þ 1=2 O2 ¼ MoO3 ð18Þ
For which at equilibrium:
X sil meltMoO3
X sil meltMoO2
¼ ½Mo6þ½Mo4þ
¼ ð fO2Þ1=2 �csil meltMoO2
csil meltMoO3
� expf�DrGoðT, 1 barÞ=RTg ð19Þ
H.St.C. O’Neill, S.M. Eggins / Chemical Geology 186 (2002) 151–181172

where:
DrGoðT, 1 barÞ ¼ DfG
oðT, 1 barÞðMoO3Þ
� DfGoðT, 1 barÞðMoO2Þ ð20Þ
The ratio may also be calculated from the exper-
imental results (Table 5) using:
½Mo6þ½Mo4þ
¼ ðfO2Þ1=2 �QMoO3
QMoO2ð21Þ
For many purposes, it is enlightening to know the
fraction of total Mo that is Mo4+ , defined as [Mo4+ ]/
[Mo4+ +Mo6+ ] or [Mo4+ ]/½PMo , as a function of
log fO2. Rearrangement of Eq. (19) gives:
½Mo4þ½P
Mo
¼ 1
1þ exp � 1
2log fO2þDrG
oðT , 1 barÞ=2:303RT þ log
csil meltMoO3
csil meltMoO2
( )
ð22Þ
As an illustration, the fraction of Mo4+ is plotted as
a function of log fO2 for two compositions in Fig. 10,
relative to some common oxygen buffers. The shape of
the curves is completely specified by the stoichiometry
of the reaction (i.e., the difference in the valence states
of Mo4+ and Mo6+ ) as long as the concentrations of
both MoO2 and MoO3 are in the Henry’s law region;
however, the position of the curves relative to the
log fO2 axis depends on DrG(T, 1 bar)o , which is a
constant for all compositions at constant T and P, and
the ratio cMoO2
sil melt/cMoO3
sil melt, which may vary with the
major-element composition of the melt. Since the
shape of the curves is fixed, an entire curve may be
specified using just one parameter. A convenient
parameter is the oxygen fugacity at which the con-
centrations of Mo6+ and Mo4+ are equal, called here
( fO2)eq, where, from Eqs. (19) or (22):
ðfO2Þeq ¼ 2csil meltMoO3
csil meltMoO2
� expfDrGoðT ; 1 barÞ=RTg ð23Þ
Because the compositional dependence of cMoO2
sil melt
and cMoO3
sil melt are so similar, most of the effects of
composition cancel out when their ratios are taken,
although there is a small residual effect of composi-
tion, which can, within experimental error, be repre-
sented as a linear relation between log ( fO2)eq and
XCaO, as shown in Fig. 11.
The valence state of an element can have a
profound effect on its crystal/melt partition coeffi-
cients. A well-known example is the way that low
fO2 causes reduction of the Rare Earth Element Eu
from the typical REE valence state of Eu3+ to Eu2+,
enabling Eu to substitute readily for Ca in plagio-
clase. The extent to which the geochemical properties
of Mo depend on oxidation state are not known. An
important application may be in its effect on the
fractionation of Mo from W during metal/silicate
partitioning accompanying core formation in plane-
tary bodies. The importance of Mo and W in this
context is due to their identity as the only two
moderately siderophile elements that are also cosmo-
chemically refractory. This eliminates volatility as a
possible cause for their observed depletion in the
Earth’s mantle, which is therefore presumably due to
core formation only (see O’Neill and Palme, 1998,
p. 98). Generally, Mo and W share very similar
chemical properties, but one difference is that WO2
Fig. 10. Proportion of Mo as Mo4+ as a function of log fO2 for two
compositions (CAS2 and MAS2, see Table 1), chosen to represent
the extremes from the present study. These results indicate that Mo
dissolves almost entirely as Mo6+in silicate melts at typical terrestrial
oxygen fugacities (log fO2 >QFM-2), but should be present as both
Mo4+ and Mo6+ in roughly equal amounts in equilibrium with
metallic Fe; for example, during core formation in the Earth, or in the
lunar environment.
H.St.C. O’Neill, S.M. Eggins / Chemical Geology 186 (2002) 151–181 173

does not have the high activity coefficients of MoO2
(Ertel et al., 1996). Hence, at the low fO2s, appro-
priate for equilibrium with Fe-rich metal, W occurs in
silicate melts almost entirely as W4+ whereas, as
shown here, Mo is a mixture of Mo4+ and Mo6+
(Fig. 10). In this regard, the properties of Mo are
similar to Re, in which the Re6+ oxidation state in
silicate melts is also stabilized relative to Re4+ by
virtue of a much lower value of cReO3
sil melt compared to
cReO2
sil melt (Ertel et al., 2001).
5.2. The effect of melt composition on Mo partitioning
between clinopyroxene and melt
Hill et al. (2000) measured the part of a large
number of trace elements, including Mo, between
clinopyroxene and silicate melt at 1218 jC, for fourcompositions close to the system CMAS. The fO2 of
the experiments is not known exactly, but must be
very high, and the oxidation sate of Mo in the
silicate melt was probably all 6+. Hill et al. inter-
preted the variation of DMomelt/cpx that they observed as
due to changing tetrahedrally coordinated Al
(ivAlcpx) in the clinopyroxene (or Ca-Tschermaks
component). But ivAlcpx is almost perfectly nega-
tively correlated with CaO in the melt in these
experiments, and measured values of DMomelt/cpx there-
fore also show an excellent negative correlation with
CaO, as expected from our experimental results. This
illustrates well the difficulty in disentangling the
different influences on trace-element partition coef-
ficients, discussed in the Introduction. Here, we have
a good opportunity to discriminate between the
effects of melt composition and crystal composition
since we have independently measured the effect of
melt composition on cMoO3
sil melt (albeit at a slightly
different temperature).
Accordingly, we have calculated values of cMoO3
sil melt
for their reported glass compositions from our fit to
our data at 1400 jC given in Table 8 (i.e., the
temperature difference has been ignored). The corre-
lation between DMomelt/cpx and cMoO3
sil melt is shown in Fig.
12. It appears that the variation in DMomelt/cpx is entirely
accounted for by the effect of melt composition on
cMoO3
sil melt.
Unfortunately, this minor triumph is a short-lived
one, as the experiments of Hill et al. (2000) show that
the true HFSE (Zr, Hf, Nb and Ta) in their experi-
ments show the opposite correlation of DMmelt/cpx
with ivAlcpx or CaO to Mo (and W), showing
that Mo is not a good proxy for the HFSEs in this
instance.
5.3. Two-element distribution coefficients
For most applications of partition coefficients to
petrological problems, the variation of activity coef-
ficients with melt composition is a nuisance that
obscures the information being sought. One way to
minimize the effect of melt composition is to use
two-element distribution coefficients. For an element
Fig. 11. The fO2 at which the concentrations of Mo4+ and Mo6+ are
equal, ( fO2)eq, as a function of XCaO in the melt.
Fig. 12. Correlation between observed partition coefficient for Mo
between clinopyroxene and melt from the experiments of Hill et al.
(2000), and values of cMoO3
sil melt calculated from the results of this
study. The slope is unity within error (shown as the 1:1 line): all the
variation in DMomelt/cpx is accounted for by the effect of melt
composition.
H.St.C. O’Neill, S.M. Eggins / Chemical Geology 186 (2002) 151–181174

MA, the generalized melt/crystal partitioning reac-
tion is:
MAOx=2 �XZ
crystal
n ZOy=2
¼ MAOx=2
melt
þXZ
n ZOy=2
melt
ð24Þ
hence
ln Dmelt=crystalMA
¼ �DmGoðMAÞ=RT
�XZ
n ln ameltZOy=2
� ln cmeltMAOx=2
þ ln ccrystalMAO�
XZ
n ZOy=2
þ ln k ð25Þ
If an element MB of the same valence and with
similar crystal-chemical properties such as ionic
radius can be identified, then a corresponding reac-
tion can be written for this element. Subtraction of
the two reactions eliminates the effect of the ‘‘struc-
tural components’’ (i.e., theP
Z n � ln aZOy=2terms)
and also the term in ln k, leaving a rather simple
expression for the two-element distribution coeffi-
cient, KdMA–MB
crystal/melt:
ln Kdcrystal=meltMA�MB
¼ lnD
melt=crystalMA
.D
melt=crystalMB
�¼ �DrG
o MA �MB
�=RT � ln
cmeltMAOx=2
.cmeltMBOx=2
�
þln
ccrystalMAO�
XZ
n ZOy=2
,ccrystalMBO�
XZ
n ZOy=2
!
ð26Þ
where DrGo (MA–MB) is the free energy of the
exchange reaction:
MAOx=2
melt
þMBOx=2
crystal
�XZ
n ZOy=2
¼ MBOx=2
melt
þMAOx=2 �XZ
n ZOy=2
crystal
ð27Þ
Most of the effect of melt composition also drops
out of ratios taken between any two of cFeOsil melt,
cNiOsil melt, and cCoO
sil melt, as implied by the good positive
correlations shown in Fig. 6a,b. This is illustrated in
Fig. 12a,b. Thus, two-element distribution coeffi-
cients, as well as eliminating the effect of melt
composition due to the structural components (the
‘‘stoichiometric control’’), may also greatly reduce the
other effect of melt composition on trace-element
partition coefficients, that coming from the activity
coefficients. The efficacy of the two-element approach
in the former context has long been appreciated (e.g.,
Takahashi and Irvine, 1981); but its almost equal
usefulness as regards the activity coefficients has gone
unappreciated since so little was known about activity
coefficients of trace elements in silicate melts anyway.
The ratios cFeOsil melt/cNiO
sil melt and cCoOsil melt/cNiO
sil melt, like
cMoO2
sil melt/cMoO3
sil melt, are not completely constant, but
whereas the latter depends on XCaO, cFeOsil melt/cNiO
sil melt
and cCoOsil melt/cNiO
sil melt depend on XSiO2, albeit but slightly,
as shown in Fig. 13a,b. The variation in cNiOsil melt/
cFeOsil melt is not inconsistent with the correlation between
cFeOsil melt and cNiO
sil melt, shown in Fig. 6a, since the slope
of the correlation is not unity; the two-element dis-
tribution coefficient does not quite eliminate all the
effects of melt composition. A similar subtle variation
of cMgOsil melt/cFeO
sil melt with XSiO2can also be observed in
the experimental data on KdFe–Mgol/melt , the Fe2+ –Mg
distribution between olivine and melt (O’Neill,
unpublished data). The ratio cCoOsil melt/cFeO
sil melt also
shows a correlation with XSiO2, but with the datum
for the CAS3 composition as a significant anomaly.
Two-element distribution coefficients have been
used explicitly, for example, when dealing with the
partitioning of Fe2+ and Mg between olivine and melt
(e.g., Roeder and Emslie, 1970). However, the two-
element approach is often used implicitly in the way
that trace-element data are interpreted. This happens
when the shape of an REE pattern is considered, rather
than the absolute abundance of a particular REE.
Effectively, this normalizes the REE to one value,
and the effects of melt composition, which should be
similar for all REEs, cancel. Thus, the shape of an REE
pattern should be largely independent of melt compo-
sition, whereas absolute abundances will reflect the
influence on DREEmelt/crystal of the activities of the struc-
tural components as well as cREE2O3
melt . Almost nothing is
yet known about the latter. This means that although
the shape of REE patterns should provide robust
evidence on the identities of crystalline phases in the
H.St.C. O’Neill, S.M. Eggins / Chemical Geology 186 (2002) 151–181 175
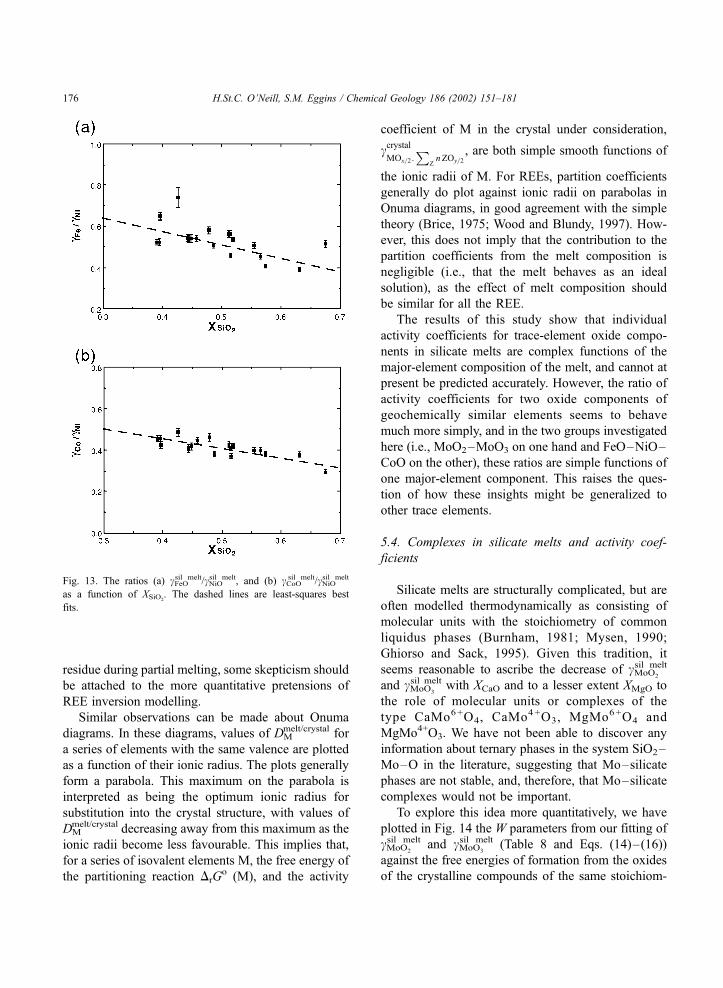
residue during partial melting, some skepticism should
be attached to the more quantitative pretensions of
REE inversion modelling.
Similar observations can be made about Onuma
diagrams. In these diagrams, values of DMmelt/crystal for
a series of elements with the same valence are plotted
as a function of their ionic radius. The plots generally
form a parabola. This maximum on the parabola is
interpreted as being the optimum ionic radius for
substitution into the crystal structure, with values of
DMmelt/crystal decreasing away from this maximum as the
ionic radii become less favourable. This implies that,
for a series of isovalent elements M, the free energy of
the partitioning reaction DrGo (M), and the activity
coefficient of M in the crystal under consideration,
ccrystalMOx=2:
PZnZOy=2
, are both simple smooth functions of
the ionic radii of M. For REEs, partition coefficients
generally do plot against ionic radii on parabolas in
Onuma diagrams, in good agreement with the simple
theory (Brice, 1975; Wood and Blundy, 1997). How-
ever, this does not imply that the contribution to the
partition coefficients from the melt composition is
negligible (i.e., that the melt behaves as an ideal
solution), as the effect of melt composition should
be similar for all the REE.
The results of this study show that individual
activity coefficients for trace-element oxide compo-
nents in silicate melts are complex functions of the
major-element composition of the melt, and cannot at
present be predicted accurately. However, the ratio of
activity coefficients for two oxide components of
geochemically similar elements seems to behave
much more simply, and in the two groups investigated
here (i.e., MoO2–MoO3 on one hand and FeO–NiO–
CoO on the other), these ratios are simple functions of
one major-element component. This raises the ques-
tion of how these insights might be generalized to
other trace elements.
5.4. Complexes in silicate melts and activity coef-
ficients
Silicate melts are structurally complicated, but are
often modelled thermodynamically as consisting of
molecular units with the stoichiometry of common
liquidus phases (Burnham, 1981; Mysen, 1990;
Ghiorso and Sack, 1995). Given this tradition, it
seems reasonable to ascribe the decrease of cMoO2
sil melt
and cMoO3
sil melt with XCaO and to a lesser extent XMgO to
the role of molecular units or complexes of the
type CaMo6+O4, CaMo4+O3, MgMo6+O4 and
MgMo4+O3. We have not been able to discover any
information about ternary phases in the system SiO2–
Mo–O in the literature, suggesting that Mo–silicate
phases are not stable, and, therefore, that Mo–silicate
complexes would not be important.
To explore this idea more quantitatively, we have
plotted in Fig. 14 the W parameters from our fitting of
cMoO2
sil melt and cMoO3
sil melt (Table 8 and Eqs. (14)–(16))
against the free energies of formation from the oxides
of the crystalline compounds of the same stoichiom-
Fig. 13. The ratios (a) cFeOsil melt/cNiO
sil melt, and (b) cCoOsil melt/cNiO
sil melt
as a function of XSiO2. The dashed lines are least-squares best
fits.
H.St.C. O’Neill, S.M. Eggins / Chemical Geology 186 (2002) 151–181176

etry as the hypothetical complexes (data from Kuba-
schewski, 1972). In assessing Fig 14, it needs to be
remembered that the free energy data are not always
well known and in some cases are little more than
guesses (e.g., for MgMoO3). Also, the free energies of
formation of ternary oxides are the sum of many types
of chemical energies including the purely geometrical
contributions imposed by the crystal structure, which
would not be expected to be reflected in the energies
of formation of the hypothetical melt complexes.
Nevertheless, there is indeed the hint of a correla-
tion, and the magnitude of the W parameters is similar
to the free energies of formation. Obviously, more
data are needed, but in the interim, this approach
looks more promising than one based simply on an
electronegativity scale, and may be used to make
some general predictions about trace element activity
coefficients in silicate melts.
Other HFSE oxides such as ZrO2, HfO2, Nb2O5,
and Ta2O5, also form stable ternary oxide compounds
with CaO with large negative free energies of for-
mation (e.g., Kubaschewski, 1972; Barin et al., 1989;
Levin et al., 1964), and their activity coefficients in
silicate melts may be expected to show a similar
sensitivity to the CaO-content of the melt as cMoO2
sil melt
and cMoO3
sil melt. However, ZrO2 and HfO2, unlike Nb2O5,
and Ta2O5, do not form stable compounds with MgO,
leading to a prediction that the behaviour of Zr and Hf
may be less sensitive than Nb and Ta to the MgO
content of the melt. UO2 and ThO2 do not form
particularly stable compounds with CaO or MgO
and their activity coefficients may therefore be
expected to also be less sensitive to melt composition.
UO3 does form a stable ternary oxide with CaO,
which may be important in stabilizing U6 + over U4+.
The oxidation state of U in magmas may have
implications for the fractionation of U from Th.
In general, the oxides of less electronegative ele-
ments form even more stable ternary compounds with
HFSE oxides, the geologically important example
being Na2O. For example, the free energy of forma-
tion of Na2MoO4 from the oxides is over twice that of
CaMoO4 at the same temperature, leading to an
expectation that Na2O in silicate melts would greatly
lower cMoO3
sil melt. The relative effect on cMoO2
sil melt cannot be
predicted, as we could find no data for Na2MoO3.
Quantification of the effect of Na2O on cMoO2
sil melt and
cMoO3
sil melt is a point of some importance not addressed in
this study because of the experimental difficulties
associated with Na volatilization.
The Rare Earth Element oxides REE2O3 do not
form stable ternary compounds with CaO or MgO
(Levin et al., 1964) and probably not with Na2O (no
information on Na2O–REE2O3 compounds was found
in the literature, circumstantial evidence that they are
not particularly stable). This implies that REE activity
coefficients (cREE2O3
melt ) would be much less sensitive to
melt composition than HFSE activity coefficients. On
the other hand, the REEs do form very stable perov-
skite and garnet phases with Al2O3 (REEAlO3 and
REE3Al5O12; also with other trivalent oxides such as
Fe2O3), which may indicate cREE2O3
melt in silicate melts
might depend on Al2O3. Theoretical modelling of this
possibility by Van Westrenen et al. (2000) has indi-
cated otherwise, and it may be that the great stability of
the REE2O3–Al2O3 ternary oxides is simply due to the
particularly favorable geometry of the perovskite and
garnet structures. As pointed out earlier, there are as
yet no measurements of the activities of REEs in
silicate melts to test this supposition directly.
Of course, REE crystal/melt partition coefficients
must also depend on melt composition through the
effects of the activities of the structural components
associated with the way the REE substitutes into the
crystal (the stoichiometry constraint). This is likely to
confound any attempt to extract activity coefficients
from crystal/melt partition coefficients directly.
Fig. 14. Inferred interaction parameters (W parameters) for Mox + –
Ca and Mox + –Mg interactions (from Table 8) versus the free
energy of formation from the oxides at 1400 jC of the solids with
the same stoichiometry.
H.St.C. O’Neill, S.M. Eggins / Chemical Geology 186 (2002) 151–181 177
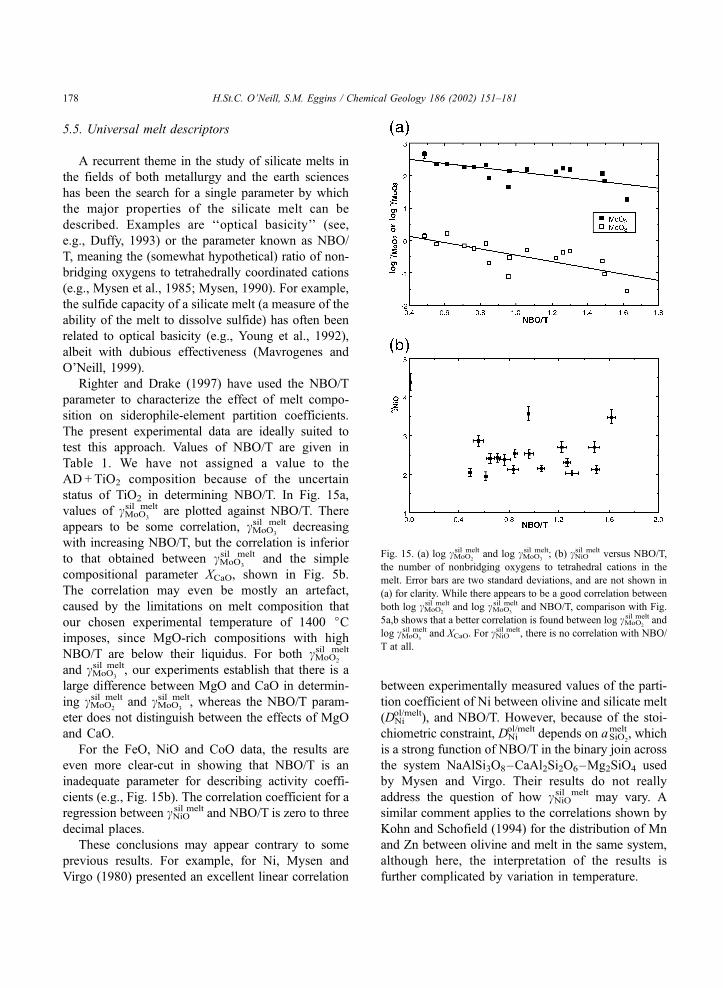
5.5. Universal melt descriptors
A recurrent theme in the study of silicate melts in
the fields of both metallurgy and the earth sciences
has been the search for a single parameter by which
the major properties of the silicate melt can be
described. Examples are ‘‘optical basicity’’ (see,
e.g., Duffy, 1993) or the parameter known as NBO/
T, meaning the (somewhat hypothetical) ratio of non-
bridging oxygens to tetrahedrally coordinated cations
(e.g., Mysen et al., 1985; Mysen, 1990). For example,
the sulfide capacity of a silicate melt (a measure of the
ability of the melt to dissolve sulfide) has often been
related to optical basicity (e.g., Young et al., 1992),
albeit with dubious effectiveness (Mavrogenes and
O’Neill, 1999).
Righter and Drake (1997) have used the NBO/T
parameter to characterize the effect of melt compo-
sition on siderophile-element partition coefficients.
The present experimental data are ideally suited to
test this approach. Values of NBO/T are given in
Table 1. We have not assigned a value to the
AD + TiO2 composition because of the uncertain
status of TiO2 in determining NBO/T. In Fig. 15a,
values of cMoO3
sil melt are plotted against NBO/T. There
appears to be some correlation, cMoO3
sil melt decreasing
with increasing NBO/T, but the correlation is inferior
to that obtained between cMoO3
sil melt and the simple
compositional parameter XCaO, shown in Fig. 5b.
The correlation may even be mostly an artefact,
caused by the limitations on melt composition that
our chosen experimental temperature of 1400 jCimposes, since MgO-rich compositions with high
NBO/T are below their liquidus. For both cMoO2
sil melt
and cMoO3
sil melt, our experiments establish that there is a
large difference between MgO and CaO in determin-
ing cMoO2
sil melt and cMoO3
sil melt, whereas the NBO/T param-
eter does not distinguish between the effects of MgO
and CaO.
For the FeO, NiO and CoO data, the results are
even more clear-cut in showing that NBO/T is an
inadequate parameter for describing activity coeffi-
cients (e.g., Fig. 15b). The correlation coefficient for a
regression between cNiOsil melt and NBO/T is zero to three
decimal places.
These conclusions may appear contrary to some
previous results. For example, for Ni, Mysen and
Virgo (1980) presented an excellent linear correlation
between experimentally measured values of the parti-
tion coefficient of Ni between olivine and silicate melt
(DNiol/melt), and NBO/T. However, because of the stoi-
chiometric constraint, DNiol/melt depends on aSiO2
melt , which
is a strong function of NBO/T in the binary join across
the system NaAlSi3O8–CaAl2Si2O6–Mg2SiO4 used
by Mysen and Virgo. Their results do not really
address the question of how cNiOsil melt may vary. A
similar comment applies to the correlations shown by
Kohn and Schofield (1994) for the distribution of Mn
and Zn between olivine and melt in the same system,
although here, the interpretation of the results is
further complicated by variation in temperature.
Fig. 15. (a) log cMoO2
sil melt and log cMoO3
sil melt; (b) cNiOsil melt versus NBO/T,
the number of nonbridging oxygens to tetrahedral cations in the
melt. Error bars are two standard deviations, and are not shown in
(a) for clarity. While there appears to be a good correlation between
both log cMoO2
sil melt and log cMoO3
sil melt and NBO/T, comparison with Fig.
5a,b shows that a better correlation is found between log cMoO2
sil melt and
log cMoO3
sil melt and XCaO. For cNiOsil melt, there is no correlation with NBO/
T at all.
H.St.C. O’Neill, S.M. Eggins / Chemical Geology 186 (2002) 151–181178

Recently, Jaeger and Drake (2000) have measured
activity coefficients of Co, W (presumably similar in
behaviour to Mo4+ ) and Ga in a series of silicate
melt compositions in the system CMAS–TiO2 and
presented the results as functions of NBO/T. Whereas
cCoOsil melt does not vary with composition, the activity
coefficients for WO2 were claimed to show an
excellent correlation with NBO/T. However, the melt
compositions used by Jaeger and Drake are linear
combinations obtained by mixing different propor-
tions of just two end-member compositions. The
apparent correlation with NBO/T is an artefact of
this.
Any general correlation between activity coeffi-
cients and NBO/T would seem to be ruled out by
some basic definitions. Raoult’s law requires always
that cMOx/2
sil melt! 1 as XMOx/2! 1 regardless of the value
of cMOx/2
sil melt at infinite dilution (XMOx/2! 0). However,
NBO/T must change by different rules, depending on
whether MOx/2 is regarded as a network former or
modifier. This is demonstrated by the results of
Doyle and Naldrett (1986) and Doyle (1988, 1989) on
cFeOsil melt. The value of NBO/T for a pure FeO melt is
infinity; hence, cFeOsil melt! 1 as NBO/T!l with
increasing XFeO. Yet, the slope of this trend can be
either positive or negative, depending on whether the
value of cFeOsil melt at infinite dilution is less than or
greater than 1. The same sort of argument can be
made for trying to relate activity coefficients to optical
basicity.
In conclusion, we suggest that attempts to relate
activity coefficients and hence trace-element partition
coefficients to universal melt descriptors are mis-
guided and doomed to failure.
Acknowledgements
We thank Astrid Holzheid and Jon Blundy for
helpful reviews, especially the latter for pointing out
the Hill et al. (2000) results, and Roberta Rudnick for
her editorial handling. [RR]
References
Banno, S., Matsui, Y., 1973. On the formulation of partition coef-
ficients for trace elements distribution between minerals and
magma. Chem. Geol. 11, 1–15.
Barin, I., Sauert, F., Schultze-Rhonhof, E., Sheng, W.S., 1989. Ther-
mochemical Data of Pure Substances, Part I and Part II. VCH
Verlagsgesellschaft, Weinheim, Germany, pp. 1–1739.
Blundy, J.D., Wood, B.J., 1991. Crystal-chemical controls on the
partitioning of Sr and Ba between plagioclase feldspar, silicate
melts and hydrothermal solutions. Geochim. Cosmochim. Acta
55, 193–209.
Blundy, J.D., Wood, B.J., 1994. Prediction of crystal-melt partition
coefficients from elastic moduli. Nature 372, 452–454.
Brice, J.C., 1975. Some thermodynamic aspects of the growth of
strained crystals. J. Cryst. Growth 28, 249–253.
Burnham, C.W., 1981. The nature of multicomponent aluminosili-
cate melts. Phys. Chem. Earth 13, 197–229.
Campbell, I.H., Naldrett, A.J., Roeder, P.L., 1979. Nickel activity in
silicate liquids: some preliminary results. Can. Mineral. 17,
495–505.
Chase, M.W., 1998. NIST-JANAF thermochemical tables. J. Phys.
Chem. Ref. Data. American Chemical Society, Washington, DC,
USA. Part 1: 1–958, Part 2: 959–1952.
Davies, P.K., Navrotsky, A., 1983. Quantitative correlations of de-
viations from ideality in binary and pseudo-binary solid solu-
tions. J. Solid State Chem. 46, 1–22.
DePaolo, D.J., 1981. Trace-element and isotopic effects of com-
bined wallrock assimilation and fractional crystallization. Earth
Planet. Sci. Lett. 53, 189–202.
Dingwell, D.B., Ertel, W., O’Neill, H.S.C., Spettel, B., 1994. The
solubility and oxidation state of nickel in silicate melt at low
oxygen fugacities: results using a mechanically assisted equili-
brium technique. Geochim. Cosmochim. Acta 58, 1967–1974.
Doyle, C.D., 1988. Prediction of the activity of FeO in multicompo-
nent magma from known values in [SiO2 –KAlO2 –CaAl2Si2O8]–FeO liquids. Geochim. Cosmochim. Acta 52, 1827–
1834.
Doyle, C.D., 1989. The effect of substitution of TiO2 for SiO2 on
aFeO in magma. Geochim. Cosmochim. Acta 53, 2631–2638.
Doyle, C.D., Naldrett, A.J., 1986. Ideal mixing of divalent cations
in mafic magma and its effect on the solution of ferrous oxide.
Geochim. Cosmochim. Acta 50, 435–443.
Doyle, C.D., Naldrett, A.J., 1987. Ideal mixing of divalent cations
in mafic magma: II. The solution of NiO and the partitioning of
nickel between coexisting olivine and liquid. Geochim. Cosmo-
chim. Acta 51, 213–219.
Dudson, P.J., Fraser, D.G., 1981. Nickel oxide activities in silicate
melts in the system CaO–MgO–Al2O3–SiO2–NiO, Progress
in Experimental Petrology, The Natural Environmental Research
Council Publications Series D 18, 247–251.
Duffy, J.A., 1993. A review of optical basicity and its applications
to oxidic systems. Geochim. Cosmochim. Acta 57, 3961–3970.
Eggins, S.M., Woodhead, J.D., Kinsley, L.P.J., 1997. A simple
method for the precise determination of > = 40 trace elements
in geological samples by ICPMS using enriched isotope internal
standardisation. Chem. Geol. 134 (4), 311–326.
Eggins, S.M., Rudnick, R.L., McDonough, W.F., 1998. The com-
position of peridotites and their minerals: a laser-ablation ICP-
MS study. Earth Planet. Sci. Lett. 154 (1–4), 53–71.
Ertel, W., O’Neill, H.S.C., Dingwell, D.B., Spettel, B., 1996. Sol-
ubility of tungsten in a haplobasaltic melt as a function of tem-
H.St.C. O’Neill, S.M. Eggins / Chemical Geology 186 (2002) 151–181 179

perature and oxygen fugacity. Geochim. Cosmochim. Acta 60
(7), 1171–1180.
Ertel, W., Dingwell, D.B., O’Neill, H.S.C., 1997. Compositional
dependence of the activity of nickel in silicate melts. Geochim.
Cosmochim. Acta 61 (22), 4707–4721.
Ertel, W., O’Neill, H.S.C., Sylvester, P.J., Dingwell, D.B., 1999.
Solubilities of Pt and Rh in a haplobasaltic silicate melt at
1300 jC. Geochim. Cosmochim. Acta 63 (16), 2439–2449.
Ertel, W., O’Neill, H.S.C., Sylvester, P.J., Dingwell, D.B., Spettel,
B., 2001. The solubility of rhenium in silicate melts: implica-
tions for the geochemical properties of rhenium at high temper-
atures. Geochim. Cosmochim. Acta 65, 2161–2170.
Fitton, J.G., 1995. Coupled molybdenum and niobium depletion in
continental basalts. Earth Planet. Sci. Lett. 136, 715–721.
Gast, P.W., 1968. Trace element fractionation and the origin of
tholeiitic and alkaline magma types. Geochim. Cosmochim. Ac-
ta 32, 1057–1086.
Ghiorso, M.S., Sack, R.O., 1995. Chemical mass transfer in mag-
matic processes IV. A revised and internally consistent thermo-
dynamic model for the interpolation and extrapolation of
liquid–solid equilibria in magmatic systems at elevated temper-
atures and pressures. Contrib. Mineral. Petrol. 119, 197–212.
Grimsey, E.J., Biswas, A.K., 1976. Solubility of nickel in silica-
saturated iron silicate slags at 1573 K. Inst. Min. Metall., Trans.
C 85, 200–207.
Grimsey, E.J., Biswas, A.K., 1977. Solubility of nickel in iron-
silicate slags both lime-free and with lime at 1573 K. Inst.
Min. Metall., Trans., Sect. C 86, 1–8.
Helffrich, G., Wood, B., 1989. Subregular model for multicompo-
nent solutions. Am. Mineral. 74, 1016–1022.
Hill, E., Wood, B.J., Blundy, J.D., 2000. The effect of Ca-Tscher-
maks component on trace element partitioning between clino-
pyroxene and silicate melt. Lithos 53, 203–215.
Holzheid, A., Palme, H., 1996. The influence of FeO on the solu-
bility of Co and Ni in silicate melts. Geochim. Cosmochim.
Acta 60, 1181–1193.
Holzheid, A., Borisov, A., Palme, H., 1994. The effect of oxygen
fugacity and temperature on solubilities of nickel, cobalt, and
molybdenum in silicate melts. Geochim. Cosmochim. Acta 58
(8), 1975–1981.
Holzheid, A., Palme, H., Chakraborty, S., 1997. The activities of
NiO, CoO and FeO in silicate melts. Chem. Geol. 139, 21–38.
Jaeger, W.L., Drake, M.J., 2000. Metal–silicate partitioning of Co,
Ga, and W: dependence on silicate melt composition. Geochim.
Cosmochim. Acta 64 (22), 3887–3895.
Kohn, S.C., Schofield, P.F., 1994. The importance of melt compo-
sition in controlling trace-element behaviour: an experimental
study of Mn and Zn partitioning between forsterite and silicate
melts. Chem. Geol. 117, 73–87.
Kubaschewski, O., 1972. The thermodynamic properties of double
oxides (a review). High Temp. High Pressure 4, 1–12.
Lacy, A.M., Pask, J.A., 1970. Electrochemical studies in glass: I.
The system NiO–Na2Si2O5. J. Am. Ceram. Soc. 53 (10), 559–
562.
Levin, E.M., Robbins, C.R., McMurdie, H.F., 1964. Phase diagrams
for ceramists. Am. Ceram. Soc., 1–601.
Liu, S.-H., Fruehan, R.J., Morales, A., Ozturk, B., 2001. Measure-
ment of FeO activity and solubility of MgO in smelting slags.
Metall. Mater., Trans. B 32B, 31–36.
Longerich, H.P., Jackson, S.E., Gunther, D., 1996. Laser ablation
inductively coupled plasma mass spectrometric transient signal
data acquisition and analyte concentration calculation. J. Anal.
At. Spectrom. 11 (9), 899–904.
Longhi, J., 1987. Liquidus equilibria and solid solution in the sys-
tem CaAl2Si2O8 –Mg2SiO4–CaSiO3–SiO2 at low pressure.
Am. J. Sci. 287, 265–331.
Mavrogenes, J.A., O’Neill, H.S.C., 1999. The relative effects of
pressure, temperature and oxygen fugacity on the solubility of
sulfide in mafic magmas. Geochim. Cosmochim. Acta 63,
1173–1180.
McKenzie, D., O’Nions, R.K., 1991. Partial melt distributions from
inversion of REE concentrations. J. Petrol. 32, 1021–1091.
Mysen, B.O., 1990. Relationships between silicate melt structure
and petrologic processes. Earth-Sci. Rev. 27, 281–365.
Mysen, B.O., Virgo, D., 1980. Trace element partitioning and melt
structure: an experimental study at 1 atm pressure. Geochim.
Cosmochim. Acta 44, 1917–1930.
Mysen, B.O., Virgo, D., Seifert, F., 1985. Relationships between
properties and structure of aluminosilicate melts. Am. Mineral.
70, 88–105.
Navon, O., Stolper, E.M., 1987. Geochemical consequences of melt
percolation: the upper mantle as a chromatographic column. J.
Geol. 95, 285–307.
Nielsen, R.L., 1988. A model for the simulation of the combined
major and trace element liquid lines of descent. Geochim. Cos-
mochim. Acta 52, 27–38.
O’Hara, M.J., 1995. Trace element geochemical effects of integrated
melt extraction and ‘shaped’ melting regimes. J. Petrol. 36,
1111–1132.
O’Neill, H.S.C., 1986. The Mo–MoO2 (MOM) oxygen buffer and
the free energy of formation of MoO2. Am. Mineral. 71, 1007–
1010.
O’Neill, H.S.C., Palme, H., 1998. Composition of the silicate earth:
implications for accretion and core formation. In: Jackson, I.
(Ed.), The Earth’s Mantle—Composition, Structure and Evolu-
tion. Cambridge Univ. Press, Cambridge, UK, pp. 3–126.
O’Neill, H.S.C., Pownceby, M.I., 1993. Thermodynamic data from
redox reactions at high temperatures: I. An experimental and
theoretical assessment of the electrochemical method using sta-
bilized zirconia electrolytes, with revised values for the Fe–
‘‘FeO’’, Co–CoO, Ni –NiO and Cu–Cu2O oxygen buffers,
and new data for the W–WO2 buffer. Contrib. Mineral. Petrol.
114, 296–314.
Pearce, N.J.G., Perkins, W.T., Westgate, J.A., Gordon, M.P., Jack-
son, S.E., Neal, C.R., Chenery, S.P., 1997. A compilation of new
and published major and trace element data for NIST SRM 610
and NIST SRM 612 glass reference materials. Geostand. Newsl.
J. Geostand. Geoanal. 21 (1), 115–144.
Pretorius, E.B., Muan, A., 1992. Activity of nickel(II) oxide in
silicate melts. J. Am. Ceram. Soc. 75 (6), 1490–1496.
Richardson, C., McKenzie, D., 1994. Radioactive disequilibria from
2D models of melt generation by plumes and ridges. Earth
Planet. Sci. Lett. 128, 425–437.
Righter, K., Drake, M.J., 1997. Metal – silicate equilibrium in a
H.St.C. O’Neill, S.M. Eggins / Chemical Geology 186 (2002) 151–181180
homogeneously accreting earth: new results for Re. Earth Planet.
Sci. Lett. 146, 541–553.
Roeder, P.L., 1974. Activity of iron and olivine solubility in basaltic
liquids. Earth Planet. Sci. Lett. 23, 397–410.
Roeder, P.L., Emslie, R.F., 1970. Olivine– liquid equilibrium. Con-
trib. Mineral. Petrol. 29, 275–289.
Shaw, D.M., 2000. Continuous (dynamic) melting theory revisited.
Can. Mineral. 38, 1041–1063.
Snyder, D.A., Carmichael, I.S.E., 1992. Olivine– liquid equilibria
and the chemical activities of FeO, NiO, Fe2O3, and MgO in
natural basic melts. Geochim. Cosmochim. Acta 56, 303–318.
Spiegelman, M., Elliott, T., 1993. Consequences of melt transport
for uranium series disequilibrium in young lavas. Earth Planet.
Sci. Lett. 118, 1–20.
Sylvester, P.J., Eggins, S.M., 1997. Analysis of Re, Au, Pd, Pt and
Rh in NIST glass certified reference materials and natural basalt
glasses by laser ablation ICP-MS. Geostand. Newsl. 21, 215–
229.
Takahashi, E., Irvine, T.N., 1981. Stoichiometric control of crystal/
liquid single-component partition coefficients. Geochim. Cos-
mochim. Acta 45, 1181–1185.
Van Westrenen, W., Blundt, J.D., Wood, B.J., 2000. Atomistic sim-
ulation of trace element incorporation into garnets—compari-
son with experimental garnet-melt partitioning data. Geochim.
Cosmochim. Acta 64, 1629–1639.
Walter, M.J., Thibault, Y., 1995. Partitioning of tungsten and mo-
lybdenum between metallic liquid and silicate melt. Science
270, 1186–1189.
Ware, N.G., 1981. Computer programs and calibration with the
PIBS technique for quantitative electron probe analysis using
a lithium-drifted silicon detector. Comput. Geosci. 7, 167–184.
Wood, B.J., Blundy, J.D., 1997. A predictive model for rare earth
element partitioning between clinopyroxene and anhydrous sil-
icate melt. Contrib. Mineral. Petrol. 129, 166–181.
Wood, B.J., Fraser, D.G., 1977. Elementary Thermodynamics for
Geologists. Oxford Univ. Press, Oxford, UK.
Young, R.W., Duffy, J.A., Hassall, G.J., Xu, Z., 1992. Use of optical
basicity concept for determining phosphorus and sulphur slag-
metal partitions. Ironmaking Steelmaking 19, 201–219.
H.St.C. O’Neill, S.M. Eggins / Chemical Geology 186 (2002) 151–181 181