The Effect of Laser Power on Photothermoacoustic … · Nanoscience & Technology: Open Access. ......
10
*Corresponding author email: [email protected] Symbiosis Group Symbiosis www.symbiosisonline.org www.symbiosisonlinepublishing.com The Effect of Laser Power on Photothermoacoustic Imaging of Blood Containing Gold Nanoparticles and De- oxygenation using a Frequency-Domain Phased Array Probe: An In-vitro Assay Mohammad E. Khosroshahi*, Andreas Mandelis, and Bahman Lashkari Department of Mechanical and Industrial Engineering, Center for Advanced Diffusion-Wave Technologies (CADIFT), University of Toronto, ON, M5S 3G8, Canada Nanoscience & Technology: Open Access Open Access Research Article Introduction During the past decade there has been a growing interest in developing new techniques for non-invasive imaging of blood vessels, cancer diagnosis, treatment and research in order to replace other invasive and potentially harmful such as X-rays. It is well known that growing cancer cells need additional blood supply and gradually develop dense micro vascular networks inside or around tumors. Angiogenesis appears to be a marker for breast cancer and may have clinical implications in diagnosis and treatment [1]. The optical properties (absorption and scattering) of biological tissue in the visible (400-750 nm) and near-IR (750- 1300 nm) spectral ranges are basically related to the molecular constituents of tissues and their vibrational/electronic structures. The main advantage of optical methods despite their limited penetration depth is their dependence on tissue composition e.g. on optical absorption which acts as endogenous contrast such as Deoxyhemoglobin (Hb), Oxyhemoglobin (HbO 2 ), lipids, water and intrinsic chromophores with distinct fluorescent properties. Optical scattering in soft tissue degrades resolution with depth significantly, while ultrasound can provide better resolution than optical probes at greater depths but with much compromised contrast. Thus, the combination of high optical absorption contrast and high ultrasonic spatial resolution (low scattering) offers a very useful imaging technique. Time-domain Photoacoustic (PA) is based on the absorption of pulsed laser energy by a material creating transient, localized heating. The increase in temperature leads to a rapidly thermal expansion which in turn generates thermo elastic stress waves. These Laser-induced ultrasound waves can then be used for applications such as Photo Acoustic Imaging (PAI) [2-5]. PAI is a rapid emerging biomedical modality which provides in- vivo functional imaging information at clinically relevant penetration depths, while maintaining high spatial resolution and imaging contrast. However, real-time PAI requires ultrasonic array receivers and parallel data acquisition systems for the simultaneous detection of weak PA signals. Briefly, an ultrasonic phase array is a transducer consisting of multiple small transducer elements. These elements usually are rectangular in shape and can be arranged in a straight line in one dimension. The signals from each element of the array can be acquired independently. Unlike a conventional single element transducer, a phase array spatially resolves the returning wave front according to the arrival Abstract Imaging modality has a significant impact on clinical applications such as cancer diagnosis and therapy. We describe the in-vitro results of several samples which include whole blood only (S1); blood containing gold nanoparticles (Au NPs, S2); and deoxygenated blood (S5) using photoacoustic radar imaging (PARI). The results showed that blood with lower concentration Au NPs (S2) produces higher PA signals compared with a higher concentration sample (S3). After the optimization of concentration, three S1, S2 and S5 samples were selected for the imaging experiment. The PA signal amplitudes in all samples increased linearly up to 2.5 W in the order S5 > S2 > S1 from there onwards the signals decreased sharply. The cellular deformation time of S1 was found to be shorter than S2 and S5 but from 2.5 W afterwards S1 and S2 showed the same rate of decrease. The increase of signals in S1, S2 and S5 are thought to be due to hemoglobin, surface Plasmon resonance (SPR)-induced heating effects and release of choleoglobin and carboxyhemoglobin as oxidation products respectively. The consistent decrease in the signal amplitudes, however, at higher power levels is mainly attributed to the change of the thermo-optical properties of blood leading to decrease of the blood osmolarity due to temperature increase and hence causing irreversible deformation resulting in thermo- hemolysis of red blood cells (RBCs) which eventually degraded the photoacoustic signals. Keywords: Photoacoustic; Bioimaging; Diode laser; Blood; Gold nanoparticles; Frequency-domain Received: December 17, 2014; Accepted: March 23, 2015; Published: April 03, 2015 *Corresponding author: Mohammad E. Khosroshahi, Department of Mechanical and Industrial Engineering, Center for Advanced Diffusion- Wave Technologies (CADIFT), University of Toronto, ON, M5S 3G8, Canada, Tel: +1416-9781287; E-mail: [email protected]
Transcript of The Effect of Laser Power on Photothermoacoustic … · Nanoscience & Technology: Open Access. ......

*Corresponding author email: [email protected] Group
Symbiosis www.symbiosisonline.org www.symbiosisonlinepublishing.com
The Effect of Laser Power on Photothermoacoustic Imaging of Blood Containing Gold Nanoparticles and De-
oxygenation using a Frequency-Domain Phased Array Probe: An In-vitro Assay
Mohammad E. Khosroshahi*, Andreas Mandelis, and Bahman LashkariDepartment of Mechanical and Industrial Engineering, Center for Advanced Diffusion-Wave Technologies (CADIFT), University of Toronto, ON, M5S
3G8, Canada
Nanoscience & Technology: Open Access Open AccessResearch Article
IntroductionDuring the past decade there has been a growing interest in
developing new techniques for non-invasive imaging of blood vessels, cancer diagnosis, treatment and research in order to replace other invasive and potentially harmful such as X-rays. It is well known that growing cancer cells need additional blood supply and gradually develop dense micro vascular networks inside or around tumors. Angiogenesis appears to be a marker for
breast cancer and may have clinical implications in diagnosis and treatment [1]. The optical properties (absorption and scattering) of biological tissue in the visible (400-750 nm) and near-IR (750-1300 nm) spectral ranges are basically related to the molecular constituents of tissues and their vibrational/electronic structures. The main advantage of optical methods despite their limited penetration depth is their dependence on tissue composition e.g. on optical absorption which acts as endogenous contrast such as Deoxyhemoglobin (Hb), Oxyhemoglobin (HbO2), lipids, water and intrinsic chromophores with distinct fluorescent properties. Optical scattering in soft tissue degrades resolution with depth significantly, while ultrasound can provide better resolution than optical probes at greater depths but with much compromised contrast. Thus, the combination of high optical absorption contrast and high ultrasonic spatial resolution (low scattering) offers a very useful imaging technique.
Time-domain Photoacoustic (PA) is based on the absorption of pulsed laser energy by a material creating transient, localized heating. The increase in temperature leads to a rapidly thermal expansion which in turn generates thermo elastic stress waves. These Laser-induced ultrasound waves can then be used for applications such as Photo Acoustic Imaging (PAI) [2-5]. PAI is a rapid emerging biomedical modality which provides in-vivo functional imaging information at clinically relevant penetration depths, while maintaining high spatial resolution and imaging contrast. However, real-time PAI requires ultrasonic array receivers and parallel data acquisition systems for the simultaneous detection of weak PA signals. Briefly, an ultrasonic phase array is a transducer consisting of multiple small transducer elements. These elements usually are rectangular in shape and can be arranged in a straight line in one dimension. The signals from each element of the array can be acquired independently. Unlike a conventional single element transducer, a phase array spatially resolves the returning wave front according to the arrival
AbstractImaging modality has a significant impact on clinical applications
such as cancer diagnosis and therapy. We describe the in-vitro results of several samples which include whole blood only (S1); blood containing gold nanoparticles (Au NPs, S2); and deoxygenated blood (S5) using photoacoustic radar imaging (PARI). The results showed that blood with lower concentration Au NPs (S2) produces higher PA signals compared with a higher concentration sample (S3). After the optimization of concentration, three S1, S2 and S5 samples were selected for the imaging experiment. The PA signal amplitudes in all samples increased linearly up to 2.5 W in the order S5 > S2 > S1 from there onwards the signals decreased sharply. The cellular deformation time of S1 was found to be shorter than S2 and S5 but from 2.5 W afterwards S1 and S2 showed the same rate of decrease. The increase of signals in S1, S2 and S5 are thought to be due to hemoglobin, surface Plasmon resonance (SPR)-induced heating effects and release of choleoglobin and carboxyhemoglobin as oxidation products respectively. The consistent decrease in the signal amplitudes, however, at higher power levels is mainly attributed to the change of the thermo-optical properties of blood leading to decrease of the blood osmolarity due to temperature increase and hence causing irreversible deformation resulting in thermo-hemolysis of red blood cells (RBCs) which eventually degraded the photoacoustic signals.
Keywords: Photoacoustic; Bioimaging; Diode laser; Blood; Gold nanoparticles; Frequency-domain
Received: December 17, 2014; Accepted: March 23, 2015; Published: April 03, 2015
*Corresponding author: Mohammad E. Khosroshahi, Department of Mechanical and Industrial Engineering, Center for Advanced Diffusion-Wave Technologies (CADIFT), University of Toronto, ON, M5S 3G8, Canada, Tel: +1416-9781287; E-mail: [email protected]
Page 2 of 10Citation: Khosroshahi ME, Mandelis A, Lashkari B (2015) The Effect of Laser Power on Photothermoacoustic Imaging of Blood Containing Gold Nanoparticles and De-oxygenation using a Frequency-Domain Phased Array Probe: An In-vitro Assay. Nanosci Technol 2(1): 1-10.
The Effect of Laser Power on Photothermoacoustic Imaging of Blood Containing Gold Nanoparticles and De-oxygenation using a Frequency-Domain Phased Array Probe: An In-vitro Assay
Copyright: © 2015 Khosroshahi et al.
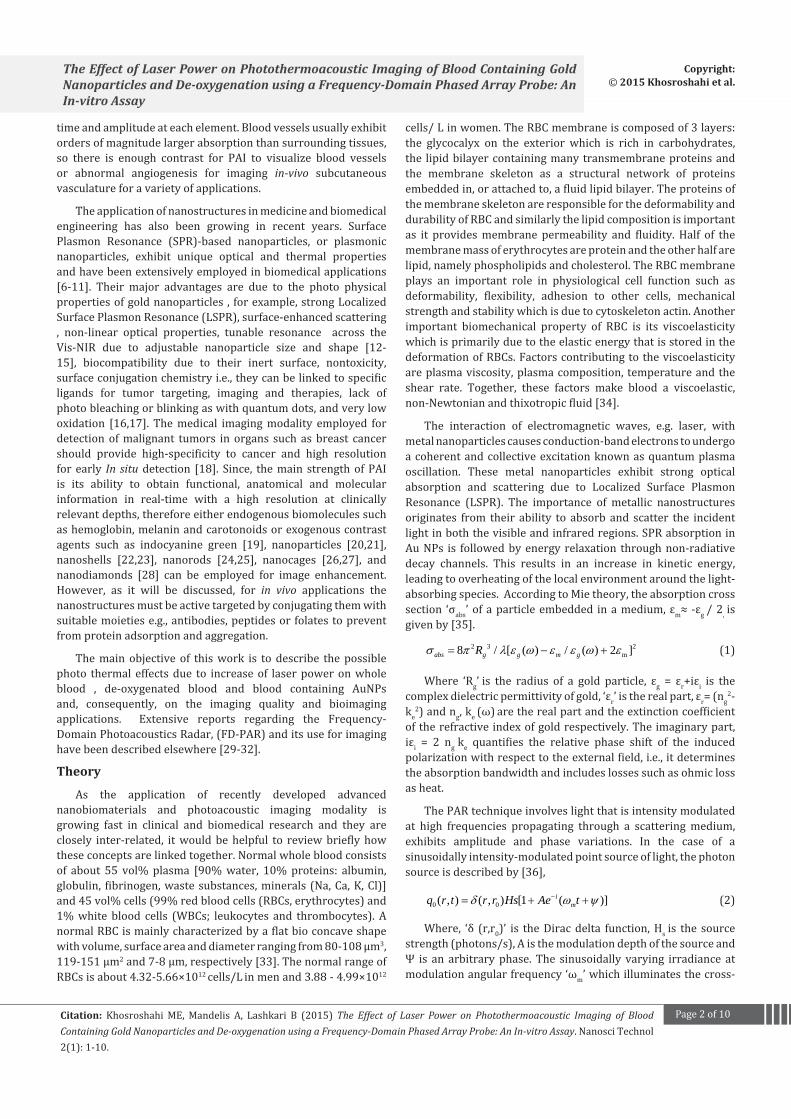
time and amplitude at each element. Blood vessels usually exhibit orders of magnitude larger absorption than surrounding tissues, so there is enough contrast for PAI to visualize blood vessels or abnormal angiogenesis for imaging in-vivo subcutaneous vasculature for a variety of applications.
The application of nanostructures in medicine and biomedical engineering has also been growing in recent years. Surface Plasmon Resonance (SPR)-based nanoparticles, or plasmonic nanoparticles, exhibit unique optical and thermal properties and have been extensively employed in biomedical applications [6-11]. Their major advantages are due to the photo physical properties of gold nanoparticles , for example, strong Localized Surface Plasmon Resonance (LSPR), surface-enhanced scattering , non-linear optical properties, tunable resonance across the Vis-NIR due to adjustable nanoparticle size and shape [12-15], biocompatibility due to their inert surface, nontoxicity, surface conjugation chemistry i.e., they can be linked to specific ligands for tumor targeting, imaging and therapies, lack of photo bleaching or blinking as with quantum dots, and very low oxidation [16,17]. The medical imaging modality employed for detection of malignant tumors in organs such as breast cancer should provide high-specificity to cancer and high resolution for early In situ detection [18]. Since, the main strength of PAI is its ability to obtain functional, anatomical and molecular information in real-time with a high resolution at clinically relevant depths, therefore either endogenous biomolecules such as hemoglobin, melanin and carotonoids or exogenous contrast agents such as indocyanine green [19], nanoparticles [20,21], nanoshells [22,23], nanorods [24,25], nanocages [26,27], and nanodiamonds [28] can be employed for image enhancement. However, as it will be discussed, for in vivo applications the nanostructures must be active targeted by conjugating them with suitable moieties e.g., antibodies, peptides or folates to prevent from protein adsorption and aggregation.
The main objective of this work is to describe the possible photo thermal effects due to increase of laser power on whole blood , de-oxygenated blood and blood containing AuNPs and, consequently, on the imaging quality and bioimaging applications. Extensive reports regarding the Frequency- Domain Photoacoustics Radar, (FD-PAR) and its use for imaging have been described elsewhere [29-32].
Theory
As the application of recently developed advanced nanobiomaterials and photoacoustic imaging modality is growing fast in clinical and biomedical research and they are closely inter-related, it would be helpful to review briefly how these concepts are linked together. Normal whole blood consists of about 55 vol% plasma [90% water, 10% proteins: albumin, globulin, fibrinogen, waste substances, minerals (Na, Ca, K, Cl)] and 45 vol% cells (99% red blood cells (RBCs, erythrocytes) and 1% white blood cells (WBCs; leukocytes and thrombocytes). A normal RBC is mainly characterized by a flat bio concave shape with volume, surface area and diameter ranging from 80-108 μm3, 119-151 μm2 and 7-8 μm, respectively [33]. The normal range of RBCs is about 4.32-5.66×10¹² cells/L in men and 3.88 - 4.99×10¹²
cells/ L in women. The RBC membrane is composed of 3 layers: the glycocalyx on the exterior which is rich in carbohydrates, the lipid bilayer containing many transmembrane proteins and the membrane skeleton as a structural network of proteins embedded in, or attached to, a fluid lipid bilayer. The proteins of the membrane skeleton are responsible for the deformability and durability of RBC and similarly the lipid composition is important as it provides membrane permeability and fluidity. Half of the membrane mass of erythrocytes are protein and the other half are lipid, namely phospholipids and cholesterol. The RBC membrane plays an important role in physiological cell function such as deformability, flexibility, adhesion to other cells, mechanical strength and stability which is due to cytoskeleton actin. Another important biomechanical property of RBC is its viscoelasticity which is primarily due to the elastic energy that is stored in the deformation of RBCs. Factors contributing to the viscoelasticity are plasma viscosity, plasma composition, temperature and the shear rate. Together, these factors make blood a viscoelastic, non-Newtonian and thixotropic fluid [34].
The interaction of electromagnetic waves, e.g. laser, with metal nanoparticles causes conduction-band electrons to undergo a coherent and collective excitation known as quantum plasma oscillation. These metal nanoparticles exhibit strong optical absorption and scattering due to Localized Surface Plasmon Resonance (LSPR). The importance of metallic nanostructures originates from their ability to absorb and scatter the incident light in both the visible and infrared regions. SPR absorption in Au NPs is followed by energy relaxation through non-radiative decay channels. This results in an increase in kinetic energy, leading to overheating of the local environment around the light-absorbing species. According to Mie theory, the absorption cross section ‘σabs’ of a particle embedded in a medium, εm≈ -εg / 2, is given by [35].
2 3 2m8 / [ ( ) / ( ) 2 ]σ π λ ε ω ε ε ω ε= − +abs g g m gR
(1)
Where ‘Rg’ is the radius of a gold particle, εg = εr+iεi is the complex dielectric permittivity of gold, ‘εr’ is the real part, εr= (ng
2-ke
2) and ng, ke (ω) are the real part and the extinction coefficient of the refractive index of gold respectively. The imaginary part, iεi = 2 ng ke quantifies the relative phase shift of the induced polarization with respect to the external field, i.e., it determines the absorption bandwidth and includes losses such as ohmic loss as heat.
The PAR technique involves light that is intensity modulated at high frequencies propagating through a scattering medium, exhibits amplitude and phase variations. In the case of a sinusoidally intensity-modulated point source of light, the photon source is described by [36],
0 0( , ) ( , ) [1 ( )]δ ω ψ−= + +imq r t r r Hs Ae t (2)
Where, ‘δ (r,r0)’ is the Dirac delta function, Hs is the source strength (photons/s), A is the modulation depth of the source and Ψ is an arbitrary phase. The sinusoidally varying irradiance at modulation angular frequency ‘ωm’ which illuminates the cross-

Page 3 of 10Citation: Khosroshahi ME, Mandelis A, Lashkari B (2015) The Effect of Laser Power on Photothermoacoustic Imaging of Blood Containing Gold Nanoparticles and De-oxygenation using a Frequency-Domain Phased Array Probe: An In-vitro Assay. Nanosci Technol 2(1): 1-10.
The Effect of Laser Power on Photothermoacoustic Imaging of Blood Containing Gold Nanoparticles and De-oxygenation using a Frequency-Domain Phased Array Probe: An In-vitro Assay
Copyright: © 2015 Khosroshahi et al.
sectional area of the sample is:
0( ) 1 / 2 ( )[1 ]ωω ω= + mi tI I e (3)
The spectral component of the thermal source Qs (z,ω) at any value of angular frequency, ‘ωm’ is given by:
( ) ( )0, . ω α α ω= + +s c c mQ z I exp h z i t
(4)
where ‘h’ is the thickness of the B-Au NP container, ‘αc’ is the absorption coefficient of combined volume fraction of B-Au, and ‘z’ is depth so that z ≤ -h. It is interesting to note from the biomechanical point of view that when a sinusoidally time varying field proportional to eiω
mt interacts with a viscoelastic
material such as blood it also results in a time varying flow which will produce a phase variation ‘Ψ’ between shear stress and shear strain. If Ψ=0, the material is purely elastic because both stress and strain are in phase and if Ψ=90°, the material is purely viscous since strain lags behind stress by 90°. A viscoelestic material will be somewhere in between 0 and 90° [37].
Materials and MethodsMaterials preparation
A 25 mL gold nanoparticle source with 100 nm diameter and concentration 3.8×10⁹ particles/ mL (i.e., 9.5×10⁹ particles) stabilized as suspension in citrate buffer was purchased from Sigma-Aldrich. Sheep whole blood was provided and kept in a refrigerator before each experiment. Prior to each test the blood was anti-coagulated with Ethylene Diamine Tetra-Acetic Acid (EDTA). Initially, 30 mL of blood were mixed with 3 mL of EDTA (i.e.10:1) giving a total blood source volume of 33 mL. A total of five samples were prepared as follows: S1 (whole blood only), S2 (blood+10% (3.8 μg/mL) Au NPs), S3 (blood+20% (7.6 μg/mL) Au NPs), S4 (Au NPs only) and S5 (de-oxygenated blood). For sample S2 (10%) a ratio of 0.5:0.05 mL of blood: NPs was used and for sample S3 (20%) the amount of NPs was doubled giving a total volume of 0.6 mL. The number of NPs (volume × concentration) and the corresponding concentration, S2 (10%),
using 0.05mL of Au were calculated to be 196×106 and 345×106 (N/ mL) respectively. Similarly for S3 (20%) using 0.1 mL of Au, the values of 380×106 and 633×106 (N/ mL) were obtained. All samples were safely mounted next to each other with 5 mm separation inside a saline solution container 50 mm below the water surface and irradiated with laser light. The experiment consisted of two parts: i) optimization of Au NPs concentration and ii) study of the effect of laser power on imaging using S1, S2 (optimized Au NP sample) and S5. To prepare the sample S5, sodium dithionite (Na2S2O4) crystalline powder with a weak sulfurous odor which is the most common and convenient reagent for the deoxygenation was used. The sample was prepared according to ref. [3] by adding Na2S2O4 to (S1) with the ratio of 0.02 mg/mL which corresponds to ≈ 80% of O2 (i.e., 20% deoxygenation) and the final product appeared darker compared with S1 and S2, see Figure 1b.
Experimental
As shown in Figure 1a, the intensity modulated output of a CW 800-nm diode laser (Jenoptik AG, Germany) with a chirp duration ’τc ‘ of 1 ms was used as an excitation source for PA generation at 1.6 W peak power. Figure 1b shows the blood samples prepared after optimization of Au NP concentration for studying the effect of laser power.
The laser driver was controlled by a software function generator sweeping the laser power modulation frequency range between 0.3 and 2.6 MHz. A collimator was used to produce a collimated laser beam with 2-3 mm spot size on the sample. A 3 mm diameter silicone rubber tube was used to mimic a blood vessel in the physiological saline container. For the first part of the experiment, the tube was linearly scanned with 0.5mm step and the back scattered pressure waves were detected by a focused transducer (V305, Olympus NDT Inc., Panametrics) with a center frequency at 2.25 MHz, 18.8 mm element diameter, focal length of 25 mm and beam width of approximately 0.9 mm. For the second part, PAR imaging was performed using a 64-element plane phase array (Ultrasonic) with a central frequency of
Figure 1: (a) The experimental set up, (b) Blood samples of S1 (blood only), S2 (blood + Au NPs) and S5 (deoxygenated).

Page 4 of 10Citation: Khosroshahi ME, Mandelis A, Lashkari B (2015) The Effect of Laser Power on Photothermoacoustic Imaging of Blood Containing Gold Nanoparticles and De-oxygenation using a Frequency-Domain Phased Array Probe: An In-vitro Assay. Nanosci Technol 2(1): 1-10.
The Effect of Laser Power on Photothermoacoustic Imaging of Blood Containing Gold Nanoparticles and De-oxygenation using a Frequency-Domain Phased Array Probe: An In-vitro Assay
Copyright: © 2015 Khosroshahi et al.
3 MHz and a sampling rate of 60 MHz/ s with high lateral resolution. The returning PA signals were received by the various elements or groups of elements and were then processed by the instrumentation software. Each received signal represents the reflection from a particular angular component of the beam or from a particular focal depth. The distance between the samples and the transducer immersed in water was kept at about 25 mm.
In the NIR (≈ 700 nm) region, blood has an absorption coefficient αb ≈ 7 cm-1 corresponding to an optical penetration depth of about 1.4 mm. Depending on the type of silicone rubber, the acoustic impedance ‘Z’ ranges between 1.1-1.5 ×10⁶ kg.m-2.s-1. Blood has an acoustic impedance of about 1.60 ×10⁶ kg.m-2.s-1. Therefore, the amplitude reflection at the rubber tube wall-blood interface varies between (0.1-3.4) percent. Data acquisition and signal processing were performed using Lab View software.
ResultsFigure 2 shows the envelope for the PA cross correlations.
The amplitudes decrease in the order S2>S3>S1>S4. The area under the curve of each envelope represents the total output energy of the matched filter at constant input energy. The profile amplitude provides a better signal to ratio (SNR) than the in-phase correlation alone. With regard to diagnostic capability, PAR is superior to conventional ultrasound imaging despite its lower SNR, due to its specificity determined by the NP material optical absorption, concentration and also on the blood absorption coefficient.
Based on the results of figure 2, the sample ‘S2’ was chosen as an optimized gold containing blood sample. It is also informative to calculate the power spectral density (PSD). The spectral content of stochastic process is decomposed into different frequencies present in that process, and helps identify periodicities. Figure 3 shows the corresponding PAR-PSD for S2. Referring to the spectrum, it can be seen that the PA signal is dominated by low frequency components. In the low frequency range, the PA response is affected only by the mixture of blood and NPs, so it does not reflect the individual signature of each component. The main feature in the case of PAR is that there is
no frequency content above the main peak frequency and the information is completely concentrated within the 300-800 kHz which exhibits the strongest power signal.
The next stage was to perform PAI of S1, S2 and S5 and to compare the results. As it is seen from figure 4, S1 showed a very weak acoustic response at 1.5 W but at 2.5 W relatively weak signals was detected and the image was barely visible to see the encircled region.
In the case of S2 (Blood + Au NPs) in figure 5, however, the PA signals were clearly enhanced which corresponds to a better image of blood tube containing Au NPs. It can be seen that the image quality or the resolution improved by increasing the power up to 2.5 W, but beyond this power level, the signal decreased and hence the quality of image was correspondingly degraded.
Figure 6 shows a similar trend to S2 in the case of S5 (blood + Na2S2O4) but at higher signal levels. This is in agreement with the fact that deoxygenated hemoglobin has a local maximum about 10 cm-1 at around 760 nm [38]. Again, a non-monotonic behavior was repeated after 2.5 W which will be discussed later.
Figure 7 illustrates the change of PAR signal amplitude with increase of laser power for various blood samples in the order of S5 > S2 > S1. Clearly, all samples demonstrated a consistent behavior with the PA signal maximum at 2.5 W and decreasing gradually beyond that irradiation power. The increase is almost negligible for S1 it is expected from whole blood as a relatively weakly absorbing medium at 800 nm. However, it is significant for S2 and S5. There are number of significant observations regarding figure 7 in that the trend of curves appears to be a Gaussian-type shape with almost similar symmetrical distribution with a peak representing the maximum signal amplitude. Also, all curves exhibited a maximum point at the same laser power (2.5 W) which statistically implies that the probability density function of such occurrence is meaningful. The full width half maximum is correlated to standard deviation and narrower the width the closer it is to the central point. In our case, S2 is narrower than S5 with corresponding lower standard deviation, σ, (i.e., σS2 ≈ 9.5% << σS5 ≈13%).Figure 2: Cross-correlation amplitude envelope of S2.
Figure 3: Variation of power spectral density of PA with frequency of S2.

Page 5 of 10Citation: Khosroshahi ME, Mandelis A, Lashkari B (2015) The Effect of Laser Power on Photothermoacoustic Imaging of Blood Containing Gold Nanoparticles and De-oxygenation using a Frequency-Domain Phased Array Probe: An In-vitro Assay. Nanosci Technol 2(1): 1-10.
The Effect of Laser Power on Photothermoacoustic Imaging of Blood Containing Gold Nanoparticles and De-oxygenation using a Frequency-Domain Phased Array Probe: An In-vitro Assay
Copyright: © 2015 Khosroshahi et al.
Figure 4: Phase array PA images of S1 at different powers with the corresponding acoustic signal amplitudes.
Figure 5: Phase array PA images of S2 at different powers with the corresponding acoustic signal amplitudes.
Figure 6: Phase array PA images of S5 at different powers with the corresponding acoustic signal amplitudes.

Page 6 of 10Citation: Khosroshahi ME, Mandelis A, Lashkari B (2015) The Effect of Laser Power on Photothermoacoustic Imaging of Blood Containing Gold Nanoparticles and De-oxygenation using a Frequency-Domain Phased Array Probe: An In-vitro Assay. Nanosci Technol 2(1): 1-10.
The Effect of Laser Power on Photothermoacoustic Imaging of Blood Containing Gold Nanoparticles and De-oxygenation using a Frequency-Domain Phased Array Probe: An In-vitro Assay
Copyright: © 2015 Khosroshahi et al.
Figure 7: Variation of PA signal amplitudes with laser power for S1, S2 and S5.
Figure 8: Variation of thermal diffusion length with modulation fre-quency for S2.
Figure 9: Calculated change of RBCs deformation time with applied la-ser power for S1, S2 and S5.
DiscussionThe first and foremost important issue to be emphasized is
the interaction process of nanoparticles with RBCs. In a biological medium, NPs; particularly colloidal NPs; can undergo an interaction process with biomolecules such as proteins, nucleic acids, and lipids due to their nano-size and significant surface-to volume ratio. Among these, the adsorption of proteins to NP surface is particularly important since it results in the formation of NP-protein complex which is known as “NP-protein corona”. Proteins as polypeptides with a defined conformation have a net surface charge which depends on the pH of the surrounding medium. The pH value is a key environmental factor, especially in chemical and biomedical systems. Any value above 7.0 is considered as alkaline and below that is acidic. A healthy blood pH without cancer has acid + alkaline balance almost equal. It affects the dissociation of functional groups on the surface of self-assembled monolayers; consequently changes in the pH will result in change of gold particle coverage. In fact it has been shown that the nanoparticle surface coverage and the spectral position of LSPR are both highly dependent on pH i.e., it was red shifted by increasing the pH [39,40].
Adsorption of proteins at nano-bio level occurs mainly by forces such as hydrogen bonds and Van der Waals interactions. Physical interactions of Au NPs with physiological fluids e.g. blood plasma can change their physiochemical properties such as size, aggregation and surface charge area. High ionic strength solutions are known to cause Au NPs aggregation due to electrostatic screening [41]. The longetivity of the NP-protein interaction depends on the rate of association or dissociation of proteins from the surface. Equally, it is important to note that NP-protein interaction process is subject to change even in a given medium due to changing rate of adsorption and desorption of proteins from the NP surface. Thus, such a process is dynamic where proteins with higher binding affinity for the surface can occupy the surface more than those with lower affinity. Regardless of different types of endocytosis mechanism, NPs may also enter cells by passive penetration of the cell membrane. Since RBCs lack endocytosis mechanism hence a passive transport or diffusion takes place after NPs are built at the surface of cell membrane.
Photoacoustic imaging contrast which is based on the optical absorption properties of tissue and the underlying molecular composition is a suitable modality for molecular imaging. In this paper, the use of an intensity modulated diode laser and a plane US-phased array was used for imaging blood tubes at different conditions. The analysis shows that the optical penetration depth in blood, δ0 (1.4 mm at 800 nm) ≈ φr where φr = 1 mm is the beam radius, and XT ≪ 2φr, where ‘XT’ is the thermal diffusion length in blood, XT ≈ (4Dbτp) 1/2, with ‘τp’ and ‘Db’ being respectively, the chirp duration and the thermal diffusivity of blood. Therefore, PA source in blood can be assumed to be 1-D model can be used. Using Db ≈ 1.38×10⁻³ cm2s-1 [42], XT ≈ 23 μm and ≈ 47 μm for τp = 1 and 4 ms, respectively. Also, the estimated values for blood thermal relaxation time, τr ≈ δ0
2 /4Db ≈ 3.6 s and the acoustic transient time, τr = δ0 /ca ≈ 890 ns. In our case, we also estimated
Page 7 of 10Citation: Khosroshahi ME, Mandelis A, Lashkari B (2015) The Effect of Laser Power on Photothermoacoustic Imaging of Blood Containing Gold Nanoparticles and De-oxygenation using a Frequency-Domain Phased Array Probe: An In-vitro Assay. Nanosci Technol 2(1): 1-10.
The Effect of Laser Power on Photothermoacoustic Imaging of Blood Containing Gold Nanoparticles and De-oxygenation using a Frequency-Domain Phased Array Probe: An In-vitro Assay
Copyright: © 2015 Khosroshahi et al.
that αbca << ωim and ωfm, αb XT << 1 and τc << τr, and τc >> τa where, ωim and ωfm are initial and final angular modulation frequencies ‘αb’ is the blood absorption coefficient. It can be deduced that S1 is effectively a weakly absorbing medium which satisfies thermal but not acoustic confinement. However, when Au NPs are added to blood, the situation begins to reverse and the medium becomes strongly absorbing, i.e., αbca >> ωim and ωfm, αbXT >> 1.
Figure 8 indicates the ‘XT’ values for a 0.3-2.6-MHz chirp using XT ≈ (2Dc /ωm) 1/2, where ‘Dc’ is thermal diffusivity of the combined volume fraction (blood and Au NPs). As it is seen, the thermal length decreases with increasing the modulation frequency and it increases with chirp duration. The analysis showed that almost 75% of thermal diffusion takes place between 0.3-1 MHz.
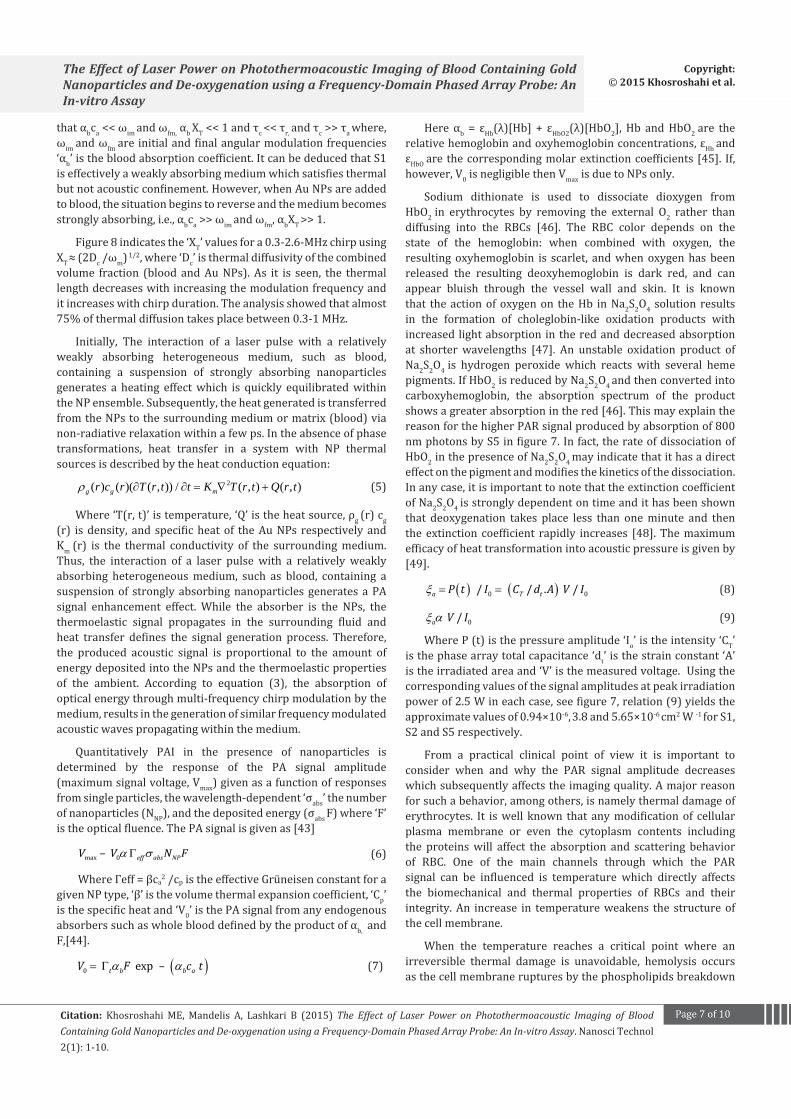
Initially, The interaction of a laser pulse with a relatively weakly absorbing heterogeneous medium, such as blood, containing a suspension of strongly absorbing nanoparticles generates a heating effect which is quickly equilibrated within the NP ensemble. Subsequently, the heat generated is transferred from the NPs to the surrounding medium or matrix (blood) via non-radiative relaxation within a few ps. In the absence of phase transformations, heat transfer in a system with NP thermal sources is described by the heat conduction equation:
2( ) ( )( ( , )) / ( , ) ( , )ρ ∂ ∂ = ∇ +g g mr c r T r t t K T r t Q r t
(5)
Where ‘T(r, t)’ is temperature, ‘Q’ is the heat source, ρg (r) cg (r) is density, and specific heat of the Au NPs respectively and Km (r) is the thermal conductivity of the surrounding medium. Thus, the interaction of a laser pulse with a relatively weakly absorbing heterogeneous medium, such as blood, containing a suspension of strongly absorbing nanoparticles generates a PA signal enhancement effect. While the absorber is the NPs, the thermoelastic signal propagates in the surrounding fluid and heat transfer defines the signal generation process. Therefore, the produced acoustic signal is proportional to the amount of energy deposited into the NPs and the thermoelastic properties of the ambient. According to equation (3), the absorption of optical energy through multi-frequency chirp modulation by the medium, results in the generation of similar frequency modulated acoustic waves propagating within the medium.
Quantitatively PAI in the presence of nanoparticles is determined by the response of the PA signal amplitude (maximum signal voltage, Vmax) given as a function of responses from single particles, the wavelength-dependent ‘σabs’ the number of nanoparticles (NNP), and the deposited energy (σabs F) where ‘F’ is the optical fluence. The PA signal is given as [43]
max 0 – eff abs NPV V N Fα σΓ (6)
Where Γeff = βca2 /cp is the effective Grüneisen constant for a
given NP type, ‘β’ is the volume thermal expansion coefficient, ‘Cp’ is the specific heat and ‘V0’ is the PA signal from any endogenous absorbers such as whole blood defined by the product of αb, and F,[44].
( )0 exp – t b b aV F c tα α= Γ
(7)
Here αb = εHb(λ)[Hb] + εHbO2(λ)[HbO2], Hb and HbO2 are the relative hemoglobin and oxyhemoglobin concentrations, εHb and εHbO are the corresponding molar extinction coefficients [45]. If, however, V0 is negligible then Vmax is due to NPs only.
Sodium dithionate is used to dissociate dioxygen from HbO2 in erythrocytes by removing the external O2 rather than diffusing into the RBCs [46]. The RBC color depends on the state of the hemoglobin: when combined with oxygen, the resulting oxyhemoglobin is scarlet, and when oxygen has been released the resulting deoxyhemoglobin is dark red, and can appear bluish through the vessel wall and skin. It is known that the action of oxygen on the Hb in Na2S2O4 solution results in the formation of choleglobin-like oxidation products with increased light absorption in the red and decreased absorption at shorter wavelengths [47]. An unstable oxidation product of Na2S2O4 is hydrogen peroxide which reacts with several heme pigments. If HbO2 is reduced by Na2S2O4 and then converted into carboxyhemoglobin, the absorption spectrum of the product shows a greater absorption in the red [46]. This may explain the reason for the higher PAR signal produced by absorption of 800 nm photons by S5 in figure 7. In fact, the rate of dissociation of HbO2 in the presence of Na2S2O4 may indicate that it has a direct effect on the pigment and modifies the kinetics of the dissociation. In any case, it is important to note that the extinction coefficient of Na2S2O4 is strongly dependent on time and it has been shown that deoxygenation takes place less than one minute and then the extinction coefficient rapidly increases [48]. The maximum efficacy of heat transformation into acoustic pressure is given by [49].
( ) ( )0 0 / / . /a T tP t I C d A V Iξ = = (8)
0 /a V Iξ α (9)
Where P (t) is the pressure amplitude ‘Io’ is the intensity ‘CT’ is the phase array total capacitance ‘dt’ is the strain constant ‘A’ is the irradiated area and ‘V’ is the measured voltage. Using the corresponding values of the signal amplitudes at peak irradiation power of 2.5 W in each case, see figure 7, relation (9) yields the approximate values of 0.94×10⁻⁶, 3.8 and 5.65×10⁻⁶ cm2 W -1 for S1, S2 and S5 respectively.
From a practical clinical point of view it is important to consider when and why the PAR signal amplitude decreases which subsequently affects the imaging quality. A major reason for such a behavior, among others, is namely thermal damage of erythrocytes. It is well known that any modification of cellular plasma membrane or even the cytoplasm contents including the proteins will affect the absorption and scattering behavior of RBC. One of the main channels through which the PAR signal can be influenced is temperature which directly affects the biomechanical and thermal properties of RBCs and their integrity. An increase in temperature weakens the structure of the cell membrane.
When the temperature reaches a critical point where an irreversible thermal damage is unavoidable, hemolysis occurs as the cell membrane ruptures by the phospholipids breakdown

Page 8 of 10Citation: Khosroshahi ME, Mandelis A, Lashkari B (2015) The Effect of Laser Power on Photothermoacoustic Imaging of Blood Containing Gold Nanoparticles and De-oxygenation using a Frequency-Domain Phased Array Probe: An In-vitro Assay. Nanosci Technol 2(1): 1-10.
The Effect of Laser Power on Photothermoacoustic Imaging of Blood Containing Gold Nanoparticles and De-oxygenation using a Frequency-Domain Phased Array Probe: An In-vitro Assay
Copyright: © 2015 Khosroshahi et al.
to produce pores in the membrane through which the contents are released. However, it was also suggested [50] that even at moderate temperatures a mechanism based on the concept of the critical bilayer assembly temperature of the cell membrane accounts for hemolysis. Echinocytosis, which is an indicator for morphological change is a characteristic of RBC thermal damage frequently used for this purpose. It was shown that one of the earliest morphological manifestations of RBC following heat injury is their transformation from disc to spherical shape [51].
Another approach of analysis is through ray optics which deals with the deformability of cells. This approach is valid only when the size of a biological object is much larger than the laser wavelength, i.e. 2πrc /λ ≈ 27.5 >>1 such as in our case where rc ≈ 3.5×10⁻⁶ m is the RBC radius. When the RBCs are at rest or exhibit very small shear rates, they tend to aggregate and stack together in an energetically favorable manner. The attraction is attributed to charged groups on the surface of cells and to the presence of fibrinogen and globulins [52]. Whenever a ray of light is reflected or refracted at an interface between media with different refractive indices, changing direction or velocity, optical momentum is transferred from the light to the interface and by Newton’s law a force is exerted on the interface. As a result a transient cell deformation occurs until elastic forces balance the applied optical forces unless the applied load and the optical force ‘Ƒo’ is too high and the cell membrane ruptures. The characteristic time ’tc’ for cellular deformation is defined as [53]
2 / c c c mt c r n Q Pµ= (10)
/o mF n PQ c= (11)
Here μb, nm, Q, c are respectively, the viscosity of blood ≈ (3 – 4) × 10-3 Pa.s [54], the refractive index of the medium (for blood only nb = 1.42, for nb+Au = 1.32 and nb+Na2 = 1.29 determined as volume fraction), the factor that describes the amount of momentum transferred (Q=1 for absorbing medium), and the speed of light in vacuum (3×10⁸ m s-1).
Figure 9 indicates, as expected, that by increasing the laser power, the deformation time decreases implying that the RBC will be damaged faster. This is found to occur in the order of S5 > S2 > S1, i.e. in our case, S1 reaches the damage point first at the peak value of 2.5 W. In general, the exact temperature for the onset of cell necrosis is rather difficult to determine, which includes not only the attained temperature but also the duration of this temperature which plays a significant role to the induction of irreversible damage. However, for a quantitative approximation of remaining active molecules or cells at a certain temperature level, one can use the well known Arrhenius equation:
0 0( ( ) / ( / ( ( ') '= − ∫ ∆ ≡ −ΩtIn C t C A exp E RT t dt (12)
Where ‘C0’ is the initial concentration of cells, ‘C(t)’ is the concentration at a time ‘t’, ‘A’ is Arrhenius constant, ‘R’ is the universal gas constant ∆E ≈ (kT / h) exp ∆s / R is the activation energy 'Ω’ is a specific tissue thermal property, ‘∆S’ is the activation entropy, ‘k’ is Boltzmann’s constant and ‘h’ is Planck’s constant. The local degree of damage defined by the damage
integral given in equation 12 is the fraction of deactivated cells.
( ) 0
0
( 1 exp () )dC C t
CC t −= = − −Ω (13)
Thus, by inserting an appropriate value of the tissue constant, one is able to calculate the probable damage degree Cd (t) as a function of time. There are different mechanisms which can cause cellular damage namely: photochemical, photothermal, photoablation and photodisruption. Therefore, a further investigation is needed to determine carefully the nature of damage in each given case. However, considering our experimental conditions and optical parameters, it is suggested that the decrease in the PAR signal observed in figure 7 above the peak point is probably due to opto-thermal irreversible damage or thermohemolysis. In other words, increasing the temperature can decrease the blood osmolarity, thereby causing thermo-hemolysis of erythrocytes which in effect degrades the photo acoustic signal.
ConclusionAu NP enhanced PAR imaging based on the SPR effect using
current modulated linear frequency modulated diode laser and a plane phased swept array is shown to be capable of detecting and imaging biological targets such as blood tissue at clinically relevant depths. The PARI of blood vessel phantoms containing Au NPs and deoxygenated blood was performed at different laser powers. The results showed that lower concentration Au NPs (S1) produces an enhanced PAR signal and PSD amplitude with most of the information concentrated within the 300-800 kHz. Also, the PA signal amplitudes in all samples increased linearly up to 2.5 W in the order of S5 > S2 > S1 above which the signals decreased sharply. Given that the cellular deformation time is a determining factor, the temperature temporal duration must be optimized in order to avoid possible photo thermal damage. The consistent decrease in the signal amplitudes at higher power levels can be attributed to the change of the thermo-optical properties of blood, decreasing the osmolarity due to temperature increase and hence causing thermo-hemolysis of RBCs which degrade the photoacoustic signals. Thus, in a real clinical PARI, not only the laser parameters, but also the amount of contrast agents such as Au NPs which can be used to enhance the PA signal, must be carefully optimized in terms of size, shape and concentration to prevent from cellular thermal damage and hence low quality imaging. Finally, it is known that angiogenesis which is the abnormal growth of blood vessels is the main hallmarks of cancer. Angiogenetic blood vessels supply tumors with nutrients but they tend to be highly irregular dilated and leaky. Thus, nanosize particles can easily extravasate from the blood stream into tumor tissues and be retained due to poor lymphatic drainage. It is, therefore, expected that a better differentiation between healthy and cancerous tissue to be achieved due to accumulation of Au NPs within cells based on Enhanced Permeability Retention (EPR) effect, thus leading to stronger photoacoustic signals.

Page 9 of 10Citation: Khosroshahi ME, Mandelis A, Lashkari B (2015) The Effect of Laser Power on Photothermoacoustic Imaging of Blood Containing Gold Nanoparticles and De-oxygenation using a Frequency-Domain Phased Array Probe: An In-vitro Assay. Nanosci Technol 2(1): 1-10.
The Effect of Laser Power on Photothermoacoustic Imaging of Blood Containing Gold Nanoparticles and De-oxygenation using a Frequency-Domain Phased Array Probe: An In-vitro Assay
Copyright: © 2015 Khosroshahi et al.
Acknowledgment The authors gratefully acknowledge the support of Samsung
Corp. for a GRO grant, to the Canada Research Chairs program and the Natural Sciences and Engineering Research Council of Canada (NSERC) for a Discovery Grant to A.M.
References1. Pan D, Pramanik M, Senpan A, Allen JS, Zhang H, Wickline SA. Molecular
photoacoustic imaging of angiogenesis with integrin-targeted gold nanobeacons. FASEB J. 2001; 25(3): 875-882. doi: 10.1096/fj.10-171728.
2. Genina EA, Lapin SA, Petrov VV, Tuchin VV. Optoacoustic visualization of blood vessels in Vitro. Proc. SPIE 3916, Biomedical Optoacoustics. 2000; 84-86.
3. Oraevsky AA, Savateeva EV, Solomatin SV, Karabutov AA, Andreev VG, Gatalica Z. Optoacoustic imaging of blood for visualization and diagnostics of breast cancer. Proc. SPIE 4618, Biomedical Optoacoustics III. 2002; 81-94.
4. Kolman RG, Steenbergen W, Van Leeuwen TG. In vivo photoacoustic imaging of blood vessels with a pulsed laser diode. Lasers Med Sci. 2006; 21(3): 134-139.
5. Wilson K, Wang TY, Willmann JK. Acoustic and photoacoustic molecular imaging of cancer. J Nucl Med. 2013; 54(11): 1851-1854. doi: 10.2967/jnumed.112.115568.
6. Khosroshahi ME, Nourbakhsh M. Enhanced laser tissue soldering using indocynine green and gold nanoshells combination. J Biomed Opt. 2011; 16(8): 088002. doi: 10.1117/1.3611001.
7. Luke GP, Yeager D, Emelianov SY. Biomedical applications of photoacoustic imaging with exogenous contrast agents. Ann Biomed Eng. 2012; 40(2): 422-437. doi: 10.1007/s10439-011-0449-4.
8. Gormley AJ, Larson N, Sadekar S, Robinson R, Ray A, Ghandehari H. Guided delivery of polymer therapeutics using plasmonics photothermal therapy. Nano Today. 2012; 7(3): 158-167.
9. Alwi R, Telenkov S, Mandelis A, Leshuk T, Gu F, Michaelian K. Silica- coated super paramagnetic iron oxide nanoparticles (SPION) as biocompatible contrast agents in biomedical photoacoustics. Biomed Opt Express. 2012; 3(10): 1-10. doi: 10.1364/BOE.3.002500.
10. Hassannejad Z, Khosroshahi ME, Firouzi M. Fabrication and characterization of magnetoplasmonic liposome carriers. Nanosci Technol. 2014; 1(2): 1-9.
11. Pustovalov VK, Astafyeva LG, Galanzha E, Zharov VP. Thermo-optical analysis and Selection of the properties of absorbing nanoparticles for laser applications in cancer nanotechnology. Cancer Nanotechnology. 2010; 1(1-6): 35–46.
12. Pustovalov VK, Babenkov VA. Optical properties of gold nanoparticles at laser radiation wavelengths for laser applications in nanotechnology and medicine. Laser Phys. Lett. 2004; 10: 516-520.
13. Hossain MK, Kitahma Y, Hung GG, Han X, Ozaki Y. Surface-enhanced Raman scattering: Realization of localized surface Plasmon resonance using unique substrates and methods. Anal Bioanal Chem. 2009; 394(7): 1747-1760. doi: 10.1007/s00216-009-2762-4.
14. Baffou G, Quidant R. Thermo-plasmonics: using metallic nanostructures as nano-sources of heat. Laser Photonics Rev. 2013; 7(2): 171-187.
15. Hasannejad Z, Khosroshahi ME. Synthesis and evaluation of time
dependent properties of plasmonic-magnetic nanoparticles. Opt Mat 3. 2013; 35(3): 644-651.
16. Khlebtsov B, Zharov V, Melikov A, Tuchin V, Khlebtsov N. Optical amplification of photothermal therapy with gold nanoparticles and Nanoclusters. Nanotechnology. 2006; 17: 5167-5179. doi:10.1088/0957-4484/17/20/022.
17. Hung X, Jain P, El-Sayed I, El-Sayed M. Gold nanoparticles: interesting optical properties and recent applications in cancer diagnostics and therapy. Nanomedicine (Lond). 2007; 2(5): 681- 693.
18. Huang Y, He S, Cao W, Liang XJ. Biomedical nanomaterials for imaging-guided cancer therapy. Nanoscale. 2012; 4(20): 6135-6149.
19. Kim G, Huang S, Day KC, O’Donnel M. Agayan RR, Day MA, et al. Indocyanine green-embedded PEBBLEs as a contrast agent for photoacoustic imaging. J Biomed Opt. 2007; 12(4): 044020.
20. Luke HG, Bashyam A, Homan K, Makhija S, Chen YS, Emelianov YS et al. Silica-coated gold nanoplates as stable photoacoustic contrast agents for sentinel lymph node imaging. Nanotechnology. 2013; 24: 455101-455109.
21. Wang Y, Strohm E, Sun Y, Niu Ch, Zheng Y, Wang Z, et al. PLGA/PFC particles loaded with gold nanoparticles as dual contrast agents for photoacoustic and ultrasound imaging. Proc. SPIE 8943. 2014; 89433M-1-M7.
22. Li M, Schwartz J, Wang J, Stocia G, Wang LV. In-vivo imaging of nanoshell extravasation from solid tumor vasculature by photoacoustic microscopy. Proc. SPIE 6437, Photons Plus Ultrasound: Imaging and Sensing. 2007; 64370B.
23. Rouleau L, Berit R, Mattea-Pelltier C, Lam T, Sabboural P. VCAM-1 targeting gold nanoshell probe for photoacoustic imaging of atherosclerotic plaque in mice. Contrast Media Mol Imaging. 2012; 8(1): 27-39. doi: 10.1002/cmmi.1491.
24. Jojerst JV, Thangaraj M, Kempen PJ, Sinclair R, Gambhir SS. Photoacoustic imaging of mesenchymal stem cells in living mice via silica-coated gold nanorods. ACNano. 2012; 6(7):5920- 5930. doi: 10.1021/nn302042y.
25. Chen YS, Frey W, Kim S, Kruizinga P, Homon K, Emelianov S. Silica-coated nanorods as photoacoustic signal nanoamplifiers. Nano Lett. 2011; 11(2): 348-354.
26. Song KH, Kim C, Cobley CM, Xia Y, Wang LV. Near-Infrared gold nanocages as a new class of tracers for photoacoustic sentine lymph node mapping on a rat model. Nano Lett. 2009 9(1):183-188.
27. Moon G, Choi S, Cai X, Li W, Cho E, Jeong U, et al. A New Theranostic system based on gold nanocages and phase-change materials with unique features for photoacoustic imaging and controlled release. J Am Chem Soc. 2011; 133(13): 4762-4765.
28. Zheng T, Cui H, Fang CY, Su LJ, Ren S, Chang HC, et al. Photoacoustic contrast imaging of biological tissues with nanodiamonds fabricated for high IR absorbance. J Biomed Opt. 2013; 18(2): 026018. doi: 10.1117/1.JBO.18.2.026018.
29. Telenkov S, Mandelis A. Fourier-domain biophotoacoustic subsurface depth selective amplitude and phase image of turbid phantoms and biological tissue. J Biomed Opt. 2006; 11(4): 044006.
30. Telenkov S, Mandelis A, Lashkari B, Forcht M. Frequency-domain photothermoacoustics: Alternative imaging modality of biological tissues. J. Appl. Phys. 2009; 105: 1-8.
31. Telenkov S, Alwi R, Mandelis A, Worthington A. Frequency-domain photoacoustic phased array probe for biomedical imaging applications.

Page 10 of 10Citation: Khosroshahi ME, Mandelis A, Lashkari B (2015) The Effect of Laser Power on Photothermoacoustic Imaging of Blood Containing Gold Nanoparticles and De-oxygenation using a Frequency-Domain Phased Array Probe: An In-vitro Assay. Nanosci Technol 2(1): 1-10.
The Effect of Laser Power on Photothermoacoustic Imaging of Blood Containing Gold Nanoparticles and De-oxygenation using a Frequency-Domain Phased Array Probe: An In-vitro Assay
Copyright: © 2015 Khosroshahi et al.
Opt Lett. 2011; 36(23): 4560-4562. doi: 10.1364/OL.36.004560.
32. Lashkari B, A. Mandelis A. Comparison between pulsed laser and frequency-domain photoacoustic modalities: Signal-to-noise ratio, contrast, resolution, and maximum depth detectivity. Rev Sci Instrum. 2011; 82(9): 094903. doi: 10.1063/1.3632117. doi: 10.1063/1.3632117.
33. Yaroslavasky A , Priezzhev A, Rodriquez A, Yaroslavasky I,Battarbee H. Optics of Blood. In Handbook of Optical Biomedical Diagnostics, Bellingham, SPIE press. 2002; 169-21.
34. Thurston GB. Rheological parameters for the viscosity, viscoelasticity, and thixotropy of blood. Biorheology. 1979; 16(3): 149-162.
35. Baffou G, Quidant R. Thermo-plasmonics: using metallic nanostructures as nano- Sources of heat. Laser & Photonics Rev. 2013; 7(2): 171-187.
36. Fishkin J, Gratton E. Propagation of photon-density waves in strongly scattering media containing an absorbing semi-infinite plane bounded by a straight edge. J Opt Soc Am A. 1993; 10(1): 127-140.
37. How T (1996) Advances in Hemodynamics and Hemorheology Vol. 1, JAI Press LTD. 1-32.
38. Briley K, Bjornerud A. Accurate de-oxygenation of ex-vivo whole blood using sodium Dithionate. Proc. Int Soc Mag Reson Med. 2008; 8: 2025.
39. Saptarshi SR, Duschl A, Lopata A. Interaction of nanoparticles with proteins: relation to bio-reactivity of the nanoparticle. J Nanobiotechnology. 2013; 11: 26. doi: 10.1186/1477-3155-11-26.
40. Park S, Park M, Han K, Lee S. The Effect of pH-adjusted gold colloids on the formation of gold clusters over APTMS-coated silica cores. Bull Korean Chem Soc. 2006; 27(9): 1341-1345.
41. Zhu J, Li W, Zhu M, Zhang W, Niu W, Liua G. Influence of the pH value of a colloidal gold solution on the absorption spectra of an LSPR-assisted sensor. AIP Advances. 2014; 4(3): 031338-6.
42. Duck F. Physical properties of tissue: a Comprehensive Reference Book. San Diago: Academic Press Inc: 1990.
43. Cook JR, Frey W, Emeilanov S. Quantitative photoacoustic imaging of
nanoparticles in cells and tissues. ACS Nano. 2013; 7(2): 1272-1280. doi: 10.1021/nn304739s.
44. Cox B, Laufer JG. Beard PC. The challenges for quantitative photoacoustic Imaging. Proc. SPIE177. 2009; 717713.
45. Hu S, Wang LV. Photoacoustic imaging and characterization of the microvasculature. J Biomed Opt. 2010; 15(1): 011101-1. doi: 10.1117/1.3281673.
46. Dalziel K, O’Brian J. Spectrophotometric studies of the reaction of methaemoglobin with hydrogen peroxide. 1. The formation of methaemoglobin-hydrogen peroxide. Biochem J. 1954; 56(4): 648-659.
47. Lemberg R, Legge J, Lockwood W. Coupled oxidation of ascorbic acid and haemoglobin: Quantitative studies on choleglobin formation. Estimation of haemoglobin and ascorbic acid oxidations. Biochem J. 1941; 35(3): 339-352.
48. Dalziel D, O’Brian J. Side reactions in the deoxygenation of dilute oxyhaemoglobin solution by sodium dithionate. Biochem J. 1957; 67(1): 119-125.
49. Pustovalov V, Astafyeva LG, Galanzha E, Zharov VP. Thermo-optical analysis and selection of the properties of absorbing nanoparticles for laser applications in cancer nanotechnology. Cancer Nano. 2010; 1(1-6): 35-46.
50. Greshfeld N. Phospholipid surface bilayers at the air-water interface. III. Relation between surface bilayer formation and lipid bilayer assembly in cell membranes. Biophys J. 1986; 50(3): 457-461.
51. Barr S, Arrwsmith DJ. Thermal damage to red cells. J Clin Path. 1970; 23(7): 572-576.
52. Pirkl L, Bonder T. Numerical simulation of blood flow using generated oldroyed-B model blood. European Conf on computational Fluid Dynamic. 2010.
53. Lubarda VA, Manzani A. Viscoelastic response of thin membranes with application to red blood cells. Acta Mechanica. 2008; 202(1-4): 1-16.
54. Ihab S, David W, Marr M, Eggleton C. Linear diode laser bar optical stretchers for cell deformation. Biomed Opt Express. 2010; 1(2): 482-488.