
THE EFFECT OF IRON POWDER PARTICLE SIZE TO THE CRACKED ...
25
THE EFFECT OF IRON POWDER PARTICLE SIZE TO THE CRACKED CORE DEFECT – A CASE STUDY ON MOLDED INDUCTOR (HM72A-12XXX) SITI ANOM BINTI LEHAN Thesis submitted in fulfillment of the requirements for the award of the degree of Bachelor of Manufacturing Engineering Faculty of Manufacturing Engineering UNIVERSITI MALAYSIA PAHANG JUNE 2013
Transcript of THE EFFECT OF IRON POWDER PARTICLE SIZE TO THE CRACKED ...

i
THE EFFECT OF IRON POWDER PARTICLE SIZE TO THE CRACKED CORE
DEFECT – A CASE STUDY ON MOLDED INDUCTOR (HM72A-12XXX)
SITI ANOM BINTI LEHAN
Thesis submitted in fulfillment of the requirements for the award of the degree of
Bachelor of Manufacturing Engineering
Faculty of Manufacturing Engineering
UNIVERSITI MALAYSIA PAHANG
JUNE 2013

vi
ABSTRACT
Cracked core defect is a visible fracture or point of separation which appear on
the surface of the part, but does not propagate through the entire thickness of the part. In
semiconductor industries, it is a challenge to manufacture products that is free of crack
defects. The effect of iron powder particle size to the cracked core defect has been
studied in this research. This research is conducted at molded inductor section at BI
Technologies Corporation Sdn Bhd. The part HM72A-12XXX series has been selected
as a case study because it has the highest number of reject with the percentage of 34.1
percent. In order to obtain sample with different average particle size, two samples of
iron powder from different supplier has been selected. These two powders are ATMIX-
11 and TP-18. The size of TP-18 is smaller than ATMIX-11, ranging from 6µm - 8µm
while ATMIX-11 is 12µm after the particle size distribution analysis. The surface
morphology, roughness and the width of crack are observed from the experimental
results. The results show that a larger particle size is better than small particle size
because the percentage of crack defect by using ATMIX-11 is lower than TP-18 which
is 9.4 percent and 18.1 percent respectively.

vii
ABSTRAK
Kecacatan teras retak ialah keretakan yang dilihat atau titik pemisahan yang
muncul di permukaan sesuatu bahagian, tetapi tidak tersebar ke seluruh ketebalan
sesuatu bahagian itu. Dalam industri semikonduktor, ia adalah satu cabaran untuk
mengeluarkan produk yang bebas daripada kecacatan retak. Kesan saiz zarah serbuk
iron terhadap kecacatan teras retak telah dikaji dalam kajian ini. Kajian ini dijalankan di
bahagian molded inductor di BI Technologies Corporation Sdn Bhd. Model siri
HM72A-12XXX telah dipilih sebagai kajian kes kerana ia mempunyai bilangan reject
tertinggi dengan peratusan sebanyak 34.1 peratus. Dalam usaha untuk mendapatkan
sampel dengan purata saiz zarah yang berbeza, dua sampel serbuk iron daripada
pembekal yang berbeza telah dipilih. Kedua-dua serbuk adalah ATMIX-11 dan TP-18.
Saiz TP-18 adalah lebih kecil daripada ATMIX-11, dari 6μm - 8μm manakala ATMIX-
11 adalah 12μm selepas analisis particle size distribution. Morfologi permukaan,
kekasaran dan lebar retak diperhati daripada keputusan eksperimen. Keputusan
menunjukkan bahawa saiz zarah yang lebih besar adalah lebih baik daripada saiz zarah
kecil kerana peratusan kecacatan retak dengan menggunakan ATMIX-11 adalah lebih
rendah daripada TP-18 yang merupakan 9.4 peratus dan 18.1 peratus masing-masing.

viii
TABLE OF CONTENTS
CHAPTER TITLE PAGE
SUPERVISOR’S DECLARATION ii
STUDENT’S DECLARATION iii
ACKNOWLEDGEMENT v
ABSTRACT vi
ABSTRAK vii
TABLE OF CONTENTS viii
LIST OF TABLES xi
LIST OF FIGURES xii
LIST OF ABBREVIATION xiii
1 INTRODUCTION
1.1 Research Background 1
1.2 Problem Statement 3
1.3 Objective 3
1.4 Scope of the Project 4
2 LITERATURE REVIEW
2.1 Failure in Production 5
2.1.1 Failure analysis on crack 6
2.2 Inductor 7
2.2.1 Q Factor 8
2.3 Molding Process 9
2.4 Quality 9
2.4.1 Quality Tools 11
2.4.1.1 Pareto diagram 11
2.4.1.2 Cause and effect diagram 12

ix
2.5 Reliability 12
3 METHODOLOGY
3.1 Methodology 15
3.2 Explanation of flow Chart 16
3.2.1 Field Research 16
3.2.2 Problem Identification 16
3.2.3 Literature Review 17
3.2.4 Problem Statement 17
3.2.5 Data Collection 18
3.2.5.1 Particle size distribution 18
3.2.5.2 Powder Mixing 19
3.2.5.3 Test Run 20
3.2.5.4 Visual Inspection 21
3.2.6 Data Analysis 21
3.2.7 Conclusion and Recommendation 22
4 RESULT AND ANALYSIS
4.1 Data collection 23
4.1.1 Company profile 24
4.1.2 Organizational structure 26
4.1.3 BI Technologies first floor plant layout 28
4.1.4 Production yield data 29
4.1.5 Types of model at molded inductor section 30
4.2 Analysis of data 32
4.2.1 Defects of part molded inductor 32
4.2.1.1 Mechanical defects on HM72A-12 series 32
4.2.1.2 Problem identify 34
4.2.1.3 Ishikawa diagram 35
4.2.2 Experimental and observation 38

x
4.2.2.1 Particle size distribution 38
4.2.2.2 Test run sample 40
4.2.2.3 Crack width 42
4.2.2.4 Surface roughness 44
4.2.3 Overall results 47
5 CONCLUSION AND RECOMMENDATION
5.1 Conclusion 48
5.2 Recommendation 49
REFERENCES 50
APPENDICES
A1 Particle size distribution for ATMIX-11 52
A2 Particle size distribution for TP-18 53

xi
LIST OF TABLES
Table
Title Page
4.1 Type of defects occur on HM72A-12 series 33
4.2 5W1H analysis 34
4.3
4.4
4.5
4.6
4.7
4.8
Data collected from test run for ATMIX-11
Data collected from test run for TP-18
Cracked core failure rate
Average surface roughness for ATMIX-11
Average surface roughness for TP-18
Overall results
40
40
42
44
45
47
xii
LIST OF FIGURES
Figure
Title Page
1.1 Examples of BI Technologies’ products 2
3.1 Flow Chart of research methodology 15
3.2
3.3
3.4
3.5
3.6
Flow Chart for Data Collection
Microtrac Series 3500 Particle Size Analyzer
Iron powder under magnification 45X
Binder
MANTIS 6X
18
19
20
20
21
4.1
4.2
BI Technologies Corporation Sdn Bhd
Percentage of Global Business Serving
24
25
4.3 Company Certificates based on ISO 26
4.4
4.5
4.6
4.7
4.8
4.9
4.10
4.11
4.12
4.13
4.14
4.15
4.16
4.17
4.18
Bi Technologies organizational chart
Bi Technologies current plant layout
Percentage yield by section for November 2012
Graph of Yield by month for Molded Inductor section
Examples of model produced
Overall yield by models
Pareto diagram
IEC 60424:1999 of crack standard
Ishikawa diagram
Process flow of particle size analysis
Graph of total amount of defect for ATMIX-11
Graph of total amount of defect for TP-18
Graph for average crack width
Crack width
Graph surface roughness for ATMIX-11 and TP-18
27
28
29
30
31
32
33
35
36
39
41
41
42
43
45

xiii
LIST OF ABBREVIATIONS
LPS Lean Production System
AC Alternate Current
DC Direct Current
SPC Statistical Process Control
TQM Total Quality Management
FTA Fault Tree Analysis
C&E Cause-and-effect

1
CHAPTER 1
INTRODUCTION
1.1 RESEARCH BACKGROUND
Today manufacturing industries has very tight competition and struggle to meet
the challenges to improve the productivity of the company. In this modern era, the
customers generally demand very good quality of products with the reasonable price.
Because of this current trend, many companies have taken Lean Production System
(LPS) as a management tools to improve their quality and productivity of their products.
LPS was originally established by the Toyota philosophy. Through the lean practice the
companies make effort to reduce the waste that will affect the quality, cost, delivery of
product, increase safety and morale.
As the market gets more competitive and the demand of a product increases, the
question of production capacity will occur. This means that the quality aspect becomes
more important in order to keep the market shares and produce as many error-free
products as possible without having to invest in new and costly production equipments.
According to Ishikawa (1985) this is the most important factor when it comes to gaining
a high quality level by building quality into each design and process, which means that
the quality control and must begin in the raw material processing and machining, as the
raw material and the basic component is the fundamental part of the product.
As the demand of the product increases, the pressure of producing in a higher
speed becomes a daily situation. The quality outcome of the process decreases,

2
especially in the manual working areas. Therefore it is important that the product has the
right quality and dimensions according to a company’s standards.
BI Technologies Corporation Sdn Bhd was established since 1976 and makes
their operation at Jalan Tanjung Api, Kuantan, Pahang. BI Technologies is a division of
TT electronics Plc, a public listed company listed in the London FT stock exchange. TT
electronics global EMS operations are based in the UK, US, China and Malaysia. This
company specializes in providing high quality manufacturing support for customers
operating in the Industrial, Telecom, Defense and Aerospace sectors in premier markets
throughout the world. The main activities of BI Technologies are producing electrical
components like inductors, semiconductor products and connectors.
(a) (b) (c)
Figure 1.1: BI Technologies’ product; (a) Low profile SMD inductor (b) Toroidal SMD
inductor (c) Isolation transformer
In overall, the implementation of LPS at BI Technologies is going well, but
unfortunately at moulded inductor section there is a problem that influenced BI
Technologies quality level that need serious concern and improvement. This is because,
at this section area, there is a problem that related with quality issue such as the high
number of defects occurs for the moulded inductor part. Therefore, the number of
customer complaint is also increase due to the defects.

3
1.2 PROBLEM STATEMENT
At moulded inductor section there is a problem that has been affecting the score
for BI Technologies quality. The problem is there are a high number of defects for the
product produced at this section. For this company, the target production yield per
month is 95 %, but this section cannot achieve that target. The average yield that they
can achieve until now is only 80 %. The critical defect that needs to be considered is
cracked cores defect because it has the higher defect yield than the other. The defect
yield of cracked core for November 2012 is 9.8 %. There are four models of inductors
which are produced; HM72A – 6 series, HM72B – 6 series, HM72A – 10 series, and
HM72B – 12 series. To go further for this research some of research question need to be
taken with serious consideration. There are:
i. What are the types of defect that happen on the molded inductor parts?
ii. Which type of the defects is higher?
iii. What is the root cause for that defect?
iv. How to reduce the defect?
v. Is the current procedure is the correct method to produce the molded inductor?
vi. Is there any better method to produce moulded inductor with fewer defects?
1.3 RESEARCH OBJECTIVES
The purposes of the research are:
i. To analyze the mechanical defects that occurs on the molded inductor parts.
ii. To analyze the root cause for the cracked cores defect.
iii. To understand the relationship between particle size of iron powder and the
cracked core defect.

4
1.4 SCOPE OF THE PROJECT
The scope of the project is important to make sure that the research is not being
out from the research objectives. The scopes of this research are:
Time
This research is involved for two semesters starting from September 2012 until June
2013.
Area of research
The research is conducted at BI Technologies Corporation Sdn Bhd. The area of
research is at the moulded inductor section. This area has been selected because the
number of defects is higher compare to the other section.
Part concentration
The moulded inductor (HM72A-12XXX) is selected because this part have problem
related to the quality issues (high number of defects).

5
CHAPTER 2
LITERATURE REVIEW
2.1 FAILURE IN PRODUCTION
Failure is the state or condition of not meeting a desirable or intended objective,
and may be viewed as the opposite of success. Their clarifications are based on various
perspectives. For example, failure can be divided into two types: functional and potential
(Rosmaini Ahmad et. al, 2012). Functional failure is the inability of an item (or the
component containing it) to meet a specified performance standard, whereas potential
failure is an identifiable physical condition indicating an imminent functional failure.
The failure is the termination of the ability of an item (i.e., any part, component, device,
subsystem, functional unit, component, or system that can be individually considered) to
perform a required function (SS-EN 13306). In other words, failure can be referred to as
an event or process of component deterioration. According to Marius Bazu and Titu
Bajenescu in their book (Failure Analysis: A practical guide for manufactures of
electronic components and systems), from a technical perspective, failure can be defined
as the cessation of function or usefulness. Failure analysis (FA) is the process of
investigating the failure modes (FMos) with the aim of identifying the failure
mechanisms (FMs), by using optical, electrical, physical and chemical analysis
techniques.
There are four possible classifications of failures which are: omission, value,
timing, and arbitrary. For example, a component that does not respond to an input from

6
another component, and thereby fails by not producing the expected output is exhibiting
an omission fault and the corresponding failure an omission failure. A fault that causes a
component to respond within the correct time interval but with an incorrect value is
termed a value fault (with the corresponding failure called a value failure). A timing
fault causes the component to respond with the correct value but outside the specified
interval (either too soon, or too late). The corresponding failure is a timing failure.
Timing failures can only occur in systems which impose timing constraints on
computations. The previous failure classes have specified how a component can be
considered to fail in either the value or time domain. It is possible for a component to
fail in both the domains in a manner which is not covered by one of the previous classes.
A failed component which produces such an output will be said to be exhibiting
an arbitrary failure (Byzantine failure).
2.1.1 Failure analysis on crack
In many industries, it is extremely difficult to manufacture products that will
totally immune to cracking. Cracking hairline crack appear on the surface of the part but
do not propagate through the entire thickness of the part. Cracks may be due to
excessive stress transferred to the substrate during centrifuge (Dale W. Swanson,
Leonard R. Enlow, 2000).
According to E. Smith, 1989, as the toughness of a material increases; the failure
behavior of a cracked engineering structure progressively changes from being fracture
mechanics controlled to being primarily flow stress controlled. Related to my study, this
is important to select the correct material used according to the characteristics of the
material. Iron has high melting point and other properties like strength, hardness,
ductility, heat resistance and stability, which can be regulated by alloying with different
materials both in prealloy as well as in the production of the friction composite itself
(N.M Talijan et al, 2000).

7
The particle size of the material whether it small or large also can give the effect
to the hardness due to the position of the atoms. This means that provided the toughness
is sufficient, failure, even though it occurs as a result of crack extension, can be
predicted via classic limit-load theories using an appropriate value for the net-section
stress across the uncracked section. The cracking process is predominantly controlled by
the residual stress (F. Malek Ghani et al, 2011). According to M. Anhalt, 2008, varying
in particle size of filler material shown that with the larger particle size coercivity and
dynamic losses are lowered due to fewer defects than with the smaller particles. The size
distribution of particles is an important consideration because it affects the processing
characteristics of the powder (Serope Kalpakjian and Steven R. Schmid).
2.2 INDUCTOR
An inductor is a component designed to resist changes in current. Inductors are
often referred to as “AC resistors”. Inductors are one of the bulk devices which limit the
performance in most of the power electronic circuits (B.S. Sreeja and S. Radha, 2011).
The ability to resist changes in current and store energy in its magnetic field account for
the bulk is the useful properties of inductors. Current passing through an inductor will
produce a magnetic field. For an inductor, only the energy stored in the magnetic field is
of interest. Therefore, the energy stored is equal to the difference between peak magnetic
and electric energies (Alireza Zolfaghari, Andrew Chan, and Behzad Razavi, 2001). A
changing magnetic field induces a voltage which opposes the field-producing current.
This property impeding changes of current is known as inductance.
An inductor is basically a wire coiled in such a way as to increase the magnetic
flux linkage between the turns of the coil. This increases the self-inductance of the wire
beyond what it would have been without flux linkage (Jayanthi Suryanarayanan, 2002).
In general, the relationship between the time-varying voltage v(t) across an inductor with
inductance L and the time-varying current i(t) passing through it is described by the
differential equation:

8
v(t) = L \frac{di(t)}{dt}
When there is a sinusoidal alternating current (AC) through an inductor, a sinusoidal
voltage is induced. An ideal inductor is characterized by purely reactive impedance (Z =
jXL) which is proportional to the inductance only. The phase of the signal across the
ideal inductor would always be +90 degrees out of phase with the applied voltage and
there would be no effect of DC current bias on its behavior (Jayanthi Suryanarayanan,
2002).
2.2.1 Q - Factor
An ideal inductor will be lossless irrespective of the amount of current through
the winding. However, typically inductors have winding resistance from the metal wire
forming the coils. Since the winding resistance appears as a resistance in series with the
inductor, it is often called the series resistance. The inductor's series resistance converts
electric current through the coils into heat, thus causing a loss of inductive quality.
The quality factor (or Q) of an inductor is the ratio of its inductive reactance to its
resistance at a given frequency, and is a measure of its efficiency. The higher the Q
factor of the inductor, the closer it approaches the behavior of an ideal, lossless,
inductor.
The Q factor of an inductor can be found through the following formula,
where R is its internal (Series Model) electrical resistance and is the inductive
reactance at resonance:

9
2.3 MOLDING PROCESS
According to Robert A. Tatara, compression molding is the oldest among
materials processing techniques. But, it was the first industrial method for plastic and
also known as matched die molding. In this process, the basic process consist of heating
a thermoset resin, under severe pressure, within a closed mold cavity until the resin
cures through a chemical reaction of cross-linking polymeric chain. Under pressure, the
resin liquefies and flows, taking the shape of the mold cavity, and then hardens into the
desired product. The part is removed from the mold once it’s sufficiently cooled and
strong. The curing reaction was continued while cooling to room temperature or ambient
condition. The common resins include phenol-formaldehyde, urea-formaldehyde,
melamine-formaldehyde, epoxy, polyester, silicone, and various rubbers and elastomers.
This molding process is suitable for a wide range of industrial, commercial, and
consumer parts and products ranging from very small to large automobile body panel.
Compression molding is a manufacturing process for producing composites
structures which work by compressing a precharge on a mold (Moo Sun Kim et. al,
2009). It stated that the main advantage by using this method is its relatively short
process cycle which is suited for mass production and the fact that the mechanical
properties of the final product are generally good.
2.4 QUALITY
“Quality is the degree to which the product or service conforms to customer
requirement” and “it implies meeting these requirements the first time and every time”
(Amra Jusufagic and Johanna Skoog, 2007). Quality issues have become increasingly
important in the production electronic, especially when dealing with electronic products
not assimilated to the mainstream of consumers electronics, but rather to the group of
industrial electronic devices and machinery designed to last for years or even decades
(Mika Liukkonen, Elina Havia, Hannu Leinonen and Yrjo Hiltunen, 2011). The
importance of data acquisition and exploitation in the electronics industry has been

10
highlighted in this recent time due to intention to achieve process improvements and
optimal manufacturing process. The equipment of modern electronics process can be
used to store data which flexible exploitation is, however, laborious to process expert.
According to Sauer et al, 2006 and Smith and Whitehall, 1997, it is typical for
the production of electronics that practically the only operation using the historical
process data is the statistical process control (SPC), whereas the proactive operations for
the process improvement such as diagnostic and optimization often lack this valuable
and abundant information. It also can be said that process equipment is regularly used in
the production without a thorough analysis of the data or it could be at least stored
during the process. The most common method of checking quality for sampled product
and service is SPC to draw conclusion by analyzing the outputs of the process. This
method deals with sampling the process while producing or delivering goods and is also
based on decision that are made whether the process is operating or if there any problem
then the process can be stopped and the problem was identified and solved (Slack,
Chambers, Johnston and Betts, 2006).
In the manufacturing of electronics, the method traditionally used in the process
improvement is through the data-driven which is statistical linear method or
experimental testing (Castillo, 2007, Sauer et al, 2006 and Smith and Whitehall, 1997).
For example, to optimize the process setting for wave soldering of electronic
components, the method that commonly used is trial-and-error based process tuning,
design of experiment, analysis of variance and linear regression (Arra et al, 2002, Santos
et al, 1997, Mesenbrink et al, 1994, Barbini, 2007, and Tsenev and Marivov, 2004).
Furthermore, Coit, Jackson and Smith, 2002, have suggested that the operator’s trial-
and-error experiments cannot form a reliable basis for proactive control and that the
linear methods such as regression may not be the optimal solution for a soldering
process.
11
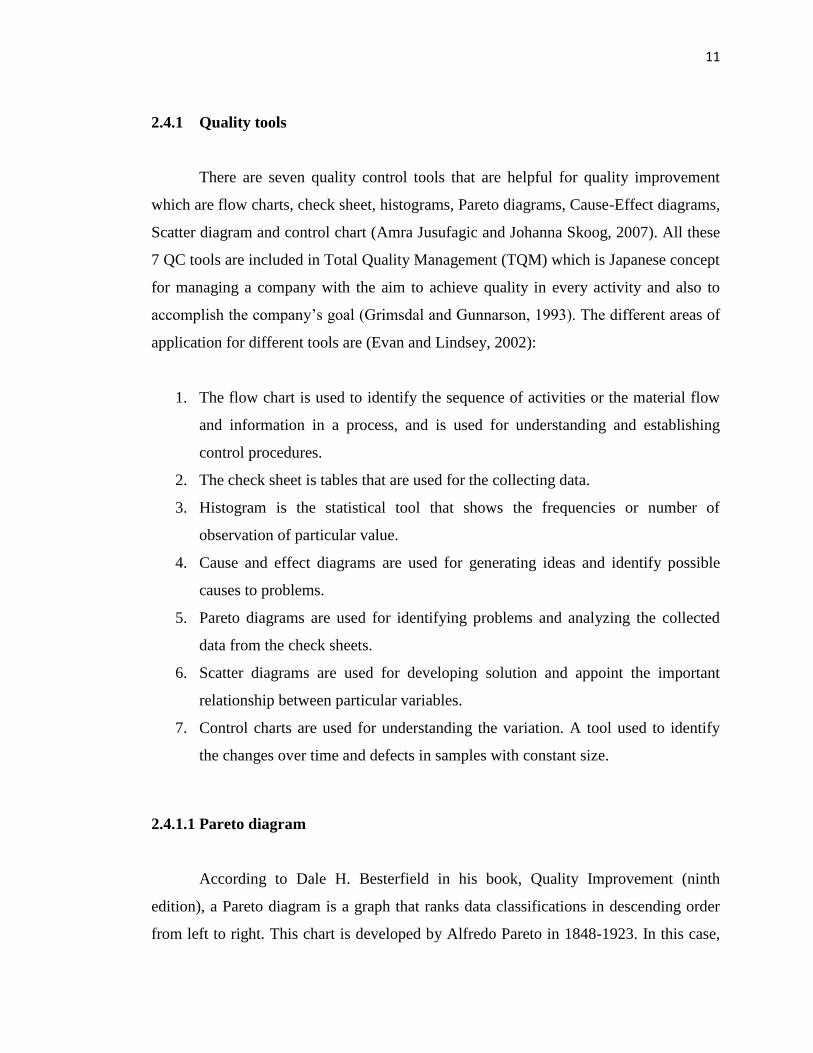
2.4.1 Quality tools
There are seven quality control tools that are helpful for quality improvement
which are flow charts, check sheet, histograms, Pareto diagrams, Cause-Effect diagrams,
Scatter diagram and control chart (Amra Jusufagic and Johanna Skoog, 2007). All these
7 QC tools are included in Total Quality Management (TQM) which is Japanese concept
for managing a company with the aim to achieve quality in every activity and also to
accomplish the company’s goal (Grimsdal and Gunnarson, 1993). The different areas of
application for different tools are (Evan and Lindsey, 2002):
1. The flow chart is used to identify the sequence of activities or the material flow
and information in a process, and is used for understanding and establishing
control procedures.
2. The check sheet is tables that are used for the collecting data.
3. Histogram is the statistical tool that shows the frequencies or number of
observation of particular value.
4. Cause and effect diagrams are used for generating ideas and identify possible
causes to problems.
5. Pareto diagrams are used for identifying problems and analyzing the collected
data from the check sheets.
6. Scatter diagrams are used for developing solution and appoint the important
relationship between particular variables.
7. Control charts are used for understanding the variation. A tool used to identify
the changes over time and defects in samples with constant size.
2.4.1.1 Pareto diagram
According to Dale H. Besterfield in his book, Quality Improvement (ninth
edition), a Pareto diagram is a graph that ranks data classifications in descending order
from left to right. This chart is developed by Alfredo Pareto in 1848-1923. In this case,

12
the data classifications are types of field failures. Besides that, the other possible data
classifications are problem, causes, types of noncomformities, and so forth. The vital
few are on the left, and the useful many are on the right. It is sometimes necessary to
combine some of the useful many into one classification called other. When the other
category is used, it is always on the far right. Two scales are used; the one on the left is
frequency and the one on the right is percent.
2.4.1.2 Cause-and-effect diagram
According to Dale H. Besterfield in his book, Quality Improvement (ninth
edition), a cause-and-effect (C&E) diagram is a picture composed of lines and symbols
designed to represent a meaningful relationship between an effect and its causes. It was
developed by Kaoru Ishikawa in 1943 and is sometimes referred to as an Ishikawa
diagram. C&E diagrams are used to investigate either a “bad” effect and to take action to
correct the causes or a “good” effect and to learn those causes responsible. For every
effect, there are likely to be numerous causes.
2.5 RELIABILITY
Product reliability is importance to both manufacturer and consumer since
inadequate reliability result in higher cost to both of the parties (D.N.P Murthy, T.
Osteraes, M. Rausand, 2009). According to the issue and the optimal investment in
reliability, it has involve two tasks which is; (1) deciding on the reliability requirement
and (2) deciding on component specification (SP) to achieved the desired reliability
(Murthy et al).
According to Man Cheol Kim and Poong Hyun Seong, 2002, the term of system
reliability analysis refers to the evaluation of the reliability of the system based on the
reliabilities of its elements. There are several methods that can be applied to this system
reliability analysis. For examples, a reliability graph, fault tree analysis (FTA), Markov
chain and Monte Carlo simulation. Each of the methods had their own characteristics,

13
merits and also demerits. Among of the existing methods, the fault tree analysis is most
widely used due to its expression power, applicability to complex system and various
tool supports.
For each of single point failure, the three dimensional understanding and analysis
gives an explicit and separate consideration and also helps identify the weak links in the
design for further action in order to improve reliability (Om Prakash Yadav, Nanua
Singh, Parveen S. Goel, 2005). Besides that, the framework helps to identify what types
of test to be performed and which physical element is subjected to the identified test
based on the knowledge of the potential failure mechanism and failure analysis results.

14
CHAPTER 3
METHODOLOGY
This chapter describes the research methods that will be used to conduct this
study. Research methodology is a set of procedures or methods used to conduct research.
It can be defined also as the study or the description of method. A methodology can be
considered to include multiple methods, each as applied to various facets of the whole
scope of the methodology. There are two types of research methodologies. These two
types of methodologies are qualitative methodologies and quantitative methodologies.
Both methodologies will be used during the analyzing phase. Qualitative research
involves the use of qualitative data such as interviews, direct observations, survey and
analysis of documents and material. Direct observation and experimental analysis are the
research method for this research. The flow chart below shows the steps that have been
taken in doing this research.

15
3.1 METHODOLOGY
Figure 3.1: Flow chart of research methodology
Start
Research background
Problem identification
Problem statement
Research objectives
Data collection
Analyze data
Literature review
Conclusion
Finish

16
3.2 EXPLANATION OF FLOW CHART
3.2.1 Field Research
Field research deals with creation and collection of actual and authentic
information by field of operation in any organization. It is also can be defined as the
collection of information outside of the laboratory and workplace setting. The process
involves determining what precise data is necessary and from where this information
needs to be obtained, methods: informal interviews, direct observation, participation in
the life of the group, collective discussions, analyzes of personal documents produced
within the group, self-analysis, and life-histories. At this stage, the method used is focus
on the direct observation in order to collect the information in general view of the
problem at the selected company. First of all, a company must be selected to make the
observation and case study. The selection of BI Technologies as the area of research
because of the company has the quality issues that lead to the high number of defect in
product. After that, the direct observation has been done at the company. The purpose of
this observation is to collect the general view of information such as company profile,
their product, and others.
3.2.2 Problem Identification
Problem identification is actually seeing the problem before trying to solve it. In
other word, it is a first strategy in solving a problem. First, it has to realize and accept
there is a problem. Once the problem have identified, then do the observation and reflect
what is going on, gather the information that is related and begin working on the
solution. For this step, the problem that has been identified is the high number of defects
occurred in moulded inductor part.