Pearl Ceramic Nano Coatings - Super Hydrophobic & Hydrophilic

The effect of hydrophobic and hydrophilic channel walls on the structure and diffusionof water and ionsT. W. Allen, S. Kuyucak, and S.-H. Chung Citation: The Journal of Chemical Physics 111, 7985 (1999); doi: 10.1063/1.480132 View online: http://dx.doi.org/10.1063/1.480132 View Table of Contents: http://scitation.aip.org/content/aip/journal/jcp/111/17?ver=pdfcov Published by the AIP Publishing Articles you may be interested in First principles molecular dynamics of molten NaI: Structure, self-diffusion, polarization effects, and chargetransfer J. Chem. Phys. 127, 094506 (2007); 10.1063/1.2768968 Effect of surface wettability on liquid density, structure, and diffusion near a solid surface J. Chem. Phys. 126, 034707 (2007); 10.1063/1.2424934 Effect of quantum partial charges on the structure and dynamics of water in single-walled carbon nanotubes J. Chem. Phys. 125, 114701 (2006); 10.1063/1.2338305 The effect of an external magnetic field on the structure of liquid water using molecular dynamics simulation J. Appl. Phys. 100, 043917 (2006); 10.1063/1.2335971 The hydrophobic effect: Molecular dynamics simulations of water confined between extended hydrophobic andhydrophilic surfaces J. Chem. Phys. 120, 9729 (2004); 10.1063/1.1697379
This article is copyrighted as indicated in the article. Reuse of AIP content is subject to the terms at: http://scitation.aip.org/termsconditions. Downloaded to IP:
130.56.107.12 On: Tue, 22 Sep 2015 01:47:20

The effect of hydrophobic and hydrophilic channel walls on the structureand diffusion of water and ions
T. W. Allena)
Protein Dynamics Unit, Department of Chemistry, Australian National University, Canberra,ACT 0200, Australia
S. KuyucakDepartment of Theoretical Physics, Research School of Physical Sciences, Australian National University,Canberra, ACT 0200, Australia
S.-H. ChungProtein Dynamics Unit, Department of Chemistry, Australian National University, Canberra,ACT 0200, Australia
~Received 8 June 1999; accepted 10 August 1999!
Molecular dynamics simulations are carried out to determine the effects of channel wall structure onwater and ion properties. We compare hydrophobic~Lennard-Jones 5-3 and atomic! andmolecular-hydrophilic cylindrical pores of 2–6 Å in effective radius, relevant to the study of mostsignificant biological ion channels including gramicidin A, ACh, and potassium channels, and to thestudy of many microporous materials. Large variations in levels of self-diffusion and rotationalcorrelation within hydrophobic channels are explained in terms of water geometry, hydrogenbonding, and dipole correlation. The differing levels of water structure and self-diffusion inhydrophobic and hydrophilic pores arise because of marked differences in the preferred orientationof water dipole moments, and due to hydrogen bonding with molecules on the pore lining. Axialsodium ion diffusion does not experience large variations with pore size, despite anomalous stabilityin moderate-sized hydrophobic pores. We attribute this to the ability of ions to diffuse along troughsof water density. Ion diffusion along the pore axis exhibits a general increase with channel radiusin hydrophobic channels but remains fairly low in hydrophilic channels. ©1999 AmericanInstitute of Physics.@S0021-9606~99!51541-9#
I. INTRODUCTION
Diffusion of water and ions in molecular-sized pores isan important problem in many areas of research rangingfrom biology~e.g., ion channels in membranes1! to chemistryand chemical engineering~e.g., zeolites and silicates2,3!.There are large variations in the size and constitution ofpores, and one intuitively expects these variations to have asignificant impact on the water and ion structure and trans-port properties. For example, biological ion channels may belined with mostly hydrophobic amino acids, such as in theACh channel,4 mostly hydrophilic residues such as in grami-cidin A,5 or a combination, as recently discovered for thepotassium channel.6 These channels also vary in dimensionfrom the narrow gramicidin, with radius approximately 2 Å,to the wider nicotinic ACh receptor having radius of theorder 3–6 Å, and bacterial porin larger than 10 Å in radius~see, e.g., Tieleman and Berendsen7!. Therefore, it is impor-tant that the effects of both the pore size and the pore con-stitution on water and ion structure and dynamics withinthese channels is understood.
When simulating ions in channels with continuum meth-ods, such as Poisson–Boltzmann and Poisson–Nernst–Planck, and stochastic dynamics, such as Brownian dynam-ics, channel water is not implemented. Instead, one
introduces a mean ion mobility reflecting the ability of an ionto diffuse under the action of systematic and random forces.Until recently there has been little knowledge about thevariation in ion diffusion coefficient with channel constitu-tion and size, and very little understanding of the mecha-nisms underlying these dependencies. Studies exist whichexamine the effect of a confining, exponentially repulsivewall on water structure and diffusion8 and ion diffusion9
within cylindrical channels. However, there remains little in-vestigation into the effects of realistic channel pores on iondiffusion, except for the occasional ion diffusion estimate forparticular channel systems such as model ACh channels,10
and gramicidin.11 Here we report the results of systematicmolecular dynamics ~MD! simulations within atomic-hydrophobic and molecular-hydrophilic channels, providingmicroscopic explanations for the channel water structure,self-diffusion, and sodium ion diffusion. The latter will beespecially useful in constraining the range of ion diffusionparameters used in the more phenomenological approachesmentioned above.
In large biological ion channels, hydrophobic segmentscan account for a majority of the protein residues lining thepore. Representing these hydrophobic segments with one-dimensional potential functions can appreciably speed upMD simulations. Until now only Lennard-Jones~LJ! poten-tial functions for planar hydrophobic surfaces have beena!Electronic mail: [email protected]
JOURNAL OF CHEMICAL PHYSICS VOLUME 111, NUMBER 17 1 NOVEMBER 1999
79850021-9606/99/111(17)/7985/15/$15.00 © 1999 American Institute of Physics
This article is copyrighted as indicated in the article. Reuse of AIP content is subject to the terms at: http://scitation.aip.org/termsconditions. Downloaded to IP:
130.56.107.12 On: Tue, 22 Sep 2015 01:47:20

available for this purpose~see, e.g., Lee, McCammon, andRossky12!. We introduce a new LJ potential function opti-mized for use in pore situations with radii ranging from 2.1to 6.1 Å. This LJ potential will be useful in speeding upcomputer simulation studies of biological ion channels andmicroporous materials.
The paper is arranged as follows: We first introduce ourmodel channels, simulation protocols, and analysis proce-dures, and then report and discuss the results of these MDsimulations. To understand variations in water self-diffusionwith channel wall type and size, we investigate the packingof water molecules in these channels. The packing is re-vealed in terms of the ordering of water molecules into disks,shells, and columns. In particular, the dipole correlationswithin and between these well-defined regions, and the hy-drogen bonding networks are used to explain the transla-tional and rotational freedom of the solvent. We finally dis-cuss ion–water geometry and ion diffusion estimates withinthe different pore types and report our major findings inSec. VII.
II. METHODS
A. Model systems
In this study we consider three channel types. The firsthas a hydrophobic wall consisting of a regular array of LJ12-6 centers on a cylindrical shell, the second is a structure-less one-dimensional potential function which approximatesthis atomic wall, and the third type is a hydrophilic wallcontaining an array of bound polar molecules. The hydro-philic wall consists of water molecules at bulk water densitywith oxygen atoms fixed on a cylindrical grid. The atomichydrophobic wall is generated with just the oxygen atom LJ12-6 centers. The atomic grid is designed such that thenearest-neighbor distances ~typically 3.14 Å! on a particulardisk, of radiusa, is equal to the nearest-neighbor distancebetween disks on this cylindrical shell, as shown in Fig.1~A!. Because each disk has been rotated with respect to itsneighbors so as to maximize the closeness of packing, thedisk separation isd5 (A3/2)s. The volume of this cylindri-cal shell, extending from radiusa2s/2 to a1s/2, is4A3p3a3/N2, where N is the number of atoms~or mol-ecules! on each circular disk. Assuming a density ofr51g/cm3, N is given by the nearest integer to 1.93a. We con-sider radiia from 3.5 to 7.0 Å in 0.5 Å increments corre-sponding to effective channel radii 2.1–5.6 Å. This numberof oxygen atoms is evenly spaced around the circular diskwith separations52pa/N, with each adjacent disk offset bys/2. For the chosen values ofa, N52a and therefored5 (A3/2)a52.72 Å for all channel sizes. Water hydrogenatoms are free to rotate around these oxygen atoms in thehydrophilic wall. The effective radius of these cylinders isR5a21.4 Å where the approximate radius of an oxygenatom has been subtracted from the radial position of theatomic centers.
To obtain a one-dimensional hydrophobic potential thatdepends only on the perpendicular distance from the channelwall, we Boltzmann average the LJ 12-6 potentials due to thearray of oxygen atoms. This procedure was previously used
for averaging LJ 12-6 potentials due to an array of atoms ona planar surface,13 which can be approximated with an effec-tive LJ 9-6 potential. For a cylinder with radiusR, theBoltzmann averaged potentialVR
B(r ) is given by
FIG. 1. ~A! Atomic wall lattice structure: Two layers of an oxygen atomlattice are drawn for a cylinder containing 6 atoms per layer. The inter-atomic distance within a layer and between layers (s), and the layer sepa-ration (d) are drawn as double headed arrows. The vectorsa, b, and cradiating from the channel axis (z) indicate the directions used for demon-stration of potential profiles. The vectors are: between layers, directed to-ward the point directly under one atom~a!; within a layer, directed at a pointmidway between neighboring atoms~b!; and within a layer, directed straightat an atom~c!. ~B! Potential profiles for theR54.1 Å (a55.5 Å! channel.Each layer/disk contains 11 atoms arranged 32.7° apart, separated fromadjacent disks by 2.72 Å. The vectorsa, b, andc radiate from the channelaxis at (f,z) values of~16.36°,0!, ~16.36°, 1.36 Å!, and ~0°, 1.36 Å!, re-spectively. Potential profiles for directionsa, b, andc ~dashed curves! arecompared to the Boltzmann averaged potential function~the solid curve!.The LJ 5-3 fitting function~3! is shown as a dotted curve. The horizontalaxis is the distance from the effective channel radius (R2r where R5a21.4 Å!. ~C! Lennard-Jones 5-3 parameters: Depth of potential minimumeR ~solid curve, filled circles, left axis! and the position of the potentialminimum sR ~dashed curve, open circles, right axis!. Uncertainties ineR
andsR are less than 4% and 0.4%, respectively, and thus are not shown.
7986 J. Chem. Phys., Vol. 111, No. 17, 1 November 1999 Allen, Kuyucak, and Chung
This article is copyrighted as indicated in the article. Reuse of AIP content is subject to the terms at: http://scitation.aip.org/termsconditions. Downloaded to IP:
130.56.107.12 On: Tue, 22 Sep 2015 01:47:20

VRB~r !5kT lnF 1
2pdE2d/2
d/2
dzE0
2p
dfe2V(r ,f,z)/kTG , ~1!
where
V~r ,f,z!5(i
eF S s
ur2r i uD 12
22S s
ur2r i uD 6G . ~2!
The sum is carried over all the atoms on the wall at positionsr i , and gives the total potentialV at r5(r ,f,z). The LJparameters gives the position of the minimum in the LJ12-6 function, ande is the depth of this minimum. TheBoltzmann average involves an integral over the potentialdue to a total of 19 disks of atoms covering cylindrical seg-ments approximately 51.69 Å in length. The effective one-dimensional potentialVR
B is then fitted by a general LJ func-tion of the form
VRLJ~D!5
mR
nR2mReRF S sR
D D nR
2nR
mRS sR
D D mRG , ~3!
whereD5a2r is the distance from the channel wall as de-fined by the atomic centers, and the parametersnR , mR , eR ,andsR are determined through an iterative least-squares pro-cedure. The function~3! has been designed such thatsR andeR correspond to the position and depth of the potential mini-mum, respectively.
Figure 1~B! compares the Boltzmann averaged potentialfor a moderate size cylinder of effective radiusR54.1 Åwith potential curves corresponding to three directional vec-tors a, b, and c as indicated in Fig. 1~A!. Away from thewall, the averaged function provides a good estimate of thepotential for all z and f. Closer to the channel wall thereexists a noticeable difference between points adjacent to wallatoms and those between atoms. Density profiles, and otherstructural analysis, to be revealed later in this article, deter-mine by how much these deviations should influence waterproperties within the channels.
For the range in effective cylinder radiiR52.1– 6.1 Å,the function~3! is fitted to the Boltzmann averaged poten-tials. In each case, only a LJ 5-3 potential can be fitted towithin the uncertainties in the parameters. The parameterseR
andsR obtained from fits of Eq.~3! assuming a LJ 5-3 formare shown in Fig. 1~C!. TheseeR andsR values can be fittedwith the quadratic forms inR,
eR57.776022.2455R10.2197R2 kJ/mol, ~4!
and
sR53.041410.180 34R20.018 95R2 Å, ~5!
as indicated by the solid and dashed curves, respectively, inFig. 1~C!. Note that the variation insR with R is quite smalland one can use the average value 3.45 Å. The LJ 5-3 fittingfunction for the pore sizeR54.1 Å is shown Fig. 1~B! ~dot-ted line!, which gives an adequate representation of the Bolt-zmann averaged curve~solid line!. Similar agreement is seenfor the whole range of channel sizes.
B. Simulation details
MD simulations are performed using theCHARMM v25b2
code14 with modifications. A time step of 1 fs is used withthe Verlet MD algorithm.15 Velocity rescaling at 1 ps inter-vals leads to temperatures of 300.060.5 K, with negligibleeffect on diffusion. Coordinates are saved each 0.1 ps fortrajectory analysis. Periodic boundaries are enforced with asingle image placed above and below each channel.
The standard rigid five-site ST2 water model has beenemployed16 with LJ 12-6 parameters for the oxygen–oxygeninteraction beings53.4796 Å ande50.3170 kJ/mol. Thismodel is chosen because of its ability to represent water inaqueous solutions accurately across the range of static anddynamic ion and water properties. For example, a bulk waterself-diffusion value of 0.285 Å2/ps has been found for ST2water,17 which is in reasonable agreement with the experi-mental value18 0.24 Å2/ps. Only the SPC/E model providesbetter agreement with experiment with the value19 0.25Å2/ps. In the popular TIP3P model,20 a rather high diffusionconstant of 0.40 Å2/ps arises.21 This has prompted introduc-tion of a modified TIP3P model with flexible O–H bonds,reducing self-diffusion to a more acceptable level21 ~0.32Å2/ps!, as employed, for example, in MD simulations ofmodel channels.8 Such modifications are not needed in ST2.Hydration numbers, radii, and ion–water geometry are wellreproduced with the ST2 model for a variety of ion species17
despite the apparent exaggeration of charge distribution withthe five-site model. A drawback of this model is the in-creased trajectory storage and simulation times associatedwith the explicit treatment of lone pairs. However,CHARMM
offers special fast routines for this water model, overcomingthis problem to some degree. Ion–water potential models areavailable for the ST2 model and LJ 12-6 parameters havebeen taken from Heinzinger.17 The Na–water oxygen LJ12-6 interaction hass53.2776 Å ande50.330 kJ/mol.
Test simulations reveal that channel length can have aconsiderable influence on diffusion. Channels of length 50and 60 Å are found to give indistinguishable levels of self-diffusion in the axial (z) direction, whereas the shorter 40 Åchannels have diffusion reduced by approximately 25%.Tests also show that the diffusion does not change noticeablywhen the periodic ends of this segment are replaced withrepulsive constraints. Our structureless hydrophobic wall~LJ5-3! channels are given a length of 50 Å with periodicboundaries, applied to water molecules and ions, acting ateach end. Because of the discrete nature of the wall latticefor the atomic hydrophobic and hydrophilic walls, periodicboundaries are applied at the ends of a 51.69 Å segment.
The treatment of long-range forces can influence self-and ion diffusion.22,23 The noticeable reduction in both self-and ion diffusion in bulk simulations when the long-rangecutoff is reduced from 12 to 8 Å, observed by Del Buono,Cohen, and Rossky,22 leads us to attempt no smaller trunca-tion distance than 12 Å. We implement a switched forcecutoff for electrostatic interactions and a switched potentialcutoff for LJ 12-6 interactions14 which are applied to groupsat 12 Å, slowly turned off from 8 Å. Nonbonded interactionlists are recorded out to 13 Å and are updated at 5–10 fsintervals.
7987J. Chem. Phys., Vol. 111, No. 17, 1 November 1999 The effect of channel walls on diffusion of water and ions
This article is copyrighted as indicated in the article. Reuse of AIP content is subject to the terms at: http://scitation.aip.org/termsconditions. Downloaded to IP:
130.56.107.12 On: Tue, 22 Sep 2015 01:47:20
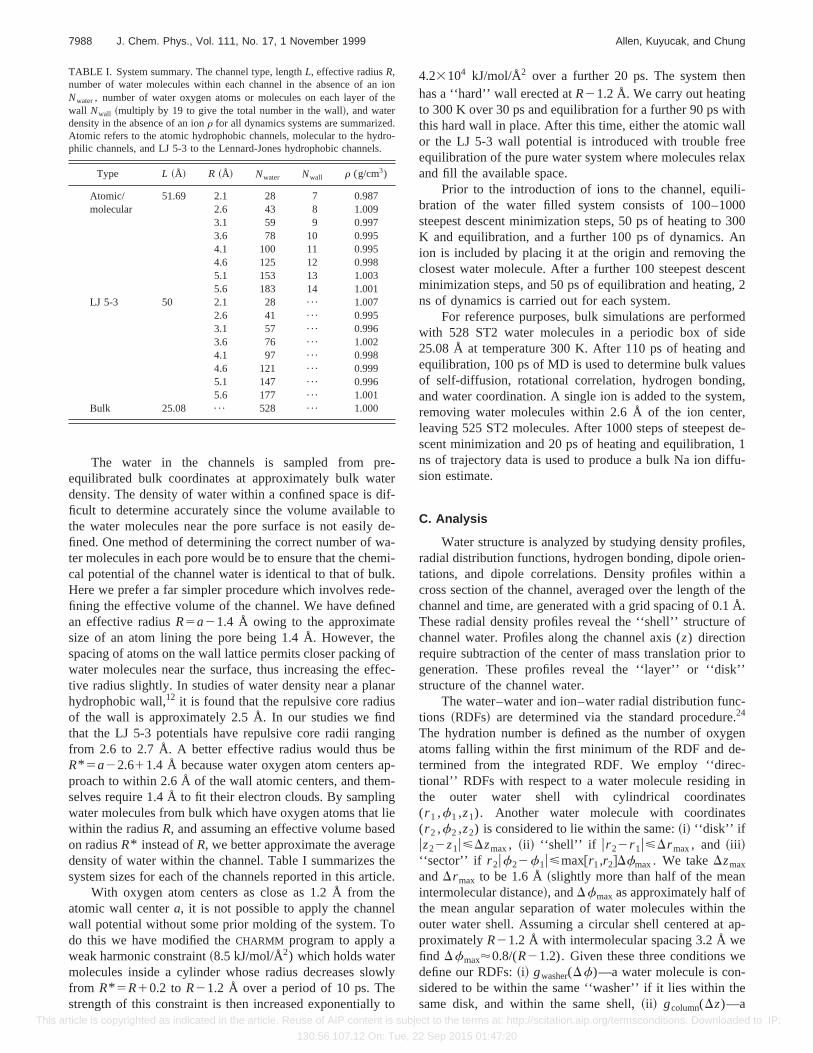
The water in the channels is sampled from pre-equilibrated bulk coordinates at approximately bulk waterdensity. The density of water within a confined space is dif-ficult to determine accurately since the volume available tothe water molecules near the pore surface is not easily de-fined. One method of determining the correct number of wa-ter molecules in each pore would be to ensure that the chemi-cal potential of the channel water is identical to that of bulk.Here we prefer a far simpler procedure which involves rede-fining the effective volume of the channel. We have definedan effective radiusR5a21.4 Å owing to the approximatesize of an atom lining the pore being 1.4 Å. However, thespacing of atoms on the wall lattice permits closer packing ofwater molecules near the surface, thus increasing the effec-tive radius slightly. In studies of water density near a planarhydrophobic wall,12 it is found that the repulsive core radiusof the wall is approximately 2.5 Å. In our studies we findthat the LJ 5-3 potentials have repulsive core radii rangingfrom 2.6 to 2.7 Å. A better effective radius would thus beR* 5a22.611.4 Å because water oxygen atom centers ap-proach to within 2.6 Å of the wall atomic centers, and them-selves require 1.4 Å to fit their electron clouds. By samplingwater molecules from bulk which have oxygen atoms that liewithin the radiusR, and assuming an effective volume basedon radiusR* instead ofR, we better approximate the averagedensity of water within the channel. Table I summarizes thesystem sizes for each of the channels reported in this article.
With oxygen atom centers as close as 1.2 Å from theatomic wall centera, it is not possible to apply the channelwall potential without some prior molding of the system. Todo this we have modified theCHARMM program to apply aweak harmonic constraint~8.5 kJ/mol/Å2) which holds watermolecules inside a cylinder whose radius decreases slowlyfrom R* 5R10.2 to R21.2 Å over a period of 10 ps. Thestrength of this constraint is then increased exponentially to
4.23104 kJ/mol/Å2 over a further 20 ps. The system thenhas a ‘‘hard’’ wall erected atR21.2 Å. We carry out heatingto 300 K over 30 ps and equilibration for a further 90 ps withthis hard wall in place. After this time, either the atomic wallor the LJ 5-3 wall potential is introduced with trouble freeequilibration of the pure water system where molecules relaxand fill the available space.
Prior to the introduction of ions to the channel, equili-bration of the water filled system consists of 100–1000steepest descent minimization steps, 50 ps of heating to 300K and equilibration, and a further 100 ps of dynamics. Anion is included by placing it at the origin and removing theclosest water molecule. After a further 100 steepest descentminimization steps, and 50 ps of equilibration and heating, 2ns of dynamics is carried out for each system.
For reference purposes, bulk simulations are performedwith 528 ST2 water molecules in a periodic box of side25.08 Å at temperature 300 K. After 110 ps of heating andequilibration, 100 ps of MD is used to determine bulk valuesof self-diffusion, rotational correlation, hydrogen bonding,and water coordination. A single ion is added to the system,removing water molecules within 2.6 Å of the ion center,leaving 525 ST2 molecules. After 1000 steps of steepest de-scent minimization and 20 ps of heating and equilibration, 1ns of trajectory data is used to produce a bulk Na ion diffu-sion estimate.
C. Analysis
Water structure is analyzed by studying density profiles,radial distribution functions, hydrogen bonding, dipole orien-tations, and dipole correlations. Density profiles within across section of the channel, averaged over the length of thechannel and time, are generated with a grid spacing of 0.1 Å.These radial density profiles reveal the ‘‘shell’’ structure ofchannel water. Profiles along the channel axis (z) directionrequire subtraction of the center of mass translation prior togeneration. These profiles reveal the ‘‘layer’’ or ‘‘disk’’structure of the channel water.
The water–water and ion–water radial distribution func-tions ~RDFs! are determined via the standard procedure.24
The hydration number is defined as the number of oxygenatoms falling within the first minimum of the RDF and de-termined from the integrated RDF. We employ ‘‘direc-tional’’ RDFs with respect to a water molecule residing inthe outer water shell with cylindrical coordinates(r 1 ,f1 ,z1). Another water molecule with coordinates(r 2 ,f2 ,z2) is considered to lie within the same:~i! ‘‘disk’’ ifuz22z1u<Dzmax, ~ii ! ‘‘shell’’ if ur 22r 1u<Dr max, and ~iii !‘‘sector’’ if r 2uf22f1u<max@r1,r2#Dfmax. We takeDzmax
andDr max to be 1.6 Å~slightly more than half of the meanintermolecular distance!, andDfmax as approximately half ofthe mean angular separation of water molecules within theouter water shell. Assuming a circular shell centered at ap-proximatelyR21.2 Å with intermolecular spacing 3.2 Å wefind Dfmax'0.8/(R21.2). Given these three conditions wedefine our RDFs:~i! gwasher(Df)—a water molecule is con-sidered to be within the same ‘‘washer’’ if it lies within thesame disk, and within the same shell,~ii ! gcolumn(Dz)—a
TABLE I. System summary. The channel type, lengthL, effective radiusR,number of water molecules within each channel in the absence of an ionNwater, number of water oxygen atoms or molecules on each layer of thewall Nwall ~multiply by 19 to give the total number in the wall!, and waterdensity in the absence of an ionr for all dynamics systems are summarized.Atomic refers to the atomic hydrophobic channels, molecular to the hydro-philic channels, and LJ 5-3 to the Lennard-Jones hydrophobic channels.
Type L ~Å! R ~Å! Nwater Nwall r (g/cm3)
Atomic/ 51.69 2.1 28 7 0.987molecular 2.6 43 8 1.009
3.1 59 9 0.9973.6 78 10 0.9954.1 100 11 0.9954.6 125 12 0.9985.1 153 13 1.0035.6 183 14 1.001
LJ 5-3 50 2.1 28 ¯ 1.0072.6 41 ¯ 0.9953.1 57 ¯ 0.9963.6 76 ¯ 1.0024.1 97 ¯ 0.9984.6 121 ¯ 0.9995.1 147 ¯ 0.9965.6 177 ¯ 1.001
Bulk 25.08 ¯ 528 ¯ 1.000
7988 J. Chem. Phys., Vol. 111, No. 17, 1 November 1999 Allen, Kuyucak, and Chung
This article is copyrighted as indicated in the article. Reuse of AIP content is subject to the terms at: http://scitation.aip.org/termsconditions. Downloaded to IP:
130.56.107.12 On: Tue, 22 Sep 2015 01:47:20

water is considered to be in the same ‘‘column’’ if it lieswithin the same shell and the same sector, and~iii !gray(Dr )—a water is considered to reside in the same ‘‘ray’’if it lies within the same disk and the same sector.
Dipole orientations are studied by analyzing the aver-aged projection of the water dipolem5@mx ,my ,mz# onto thez axis and onto the radial vectorr5@x,y#, leading to the twocosines: cosu and cosf, respectively. The average orienta-tion anglesumean andfmean quoted in the text are found bysumming all possible cosine moduli weighted by normalizeddistribution probabilities, and then taking inverse cosines.When umean50° the dipoles are oriented along thez direc-tion, while for 90° they are in thexy plane. In the latter case,fmean50° corresponds to radially oriented dipoles and 90°to circular ones. Also summarizing the dipole orientations isthe net dipole moment of the channel water. The momentabout the center of charge is averaged over time for eachchannel to yield a separate measure of the mean orientation.
Dipole correlations are measured over the same direc-tions as the previously defined RDFs. The dot product of twodipole vectors within the same washer, column, or ray isplaced into a bin in the distribution alongf, z, and r coor-dinates, respectively, leading to the functionsCwasher(Df),Ccolumn(Dz), and Cray(Dr ). The normalized integral of theproduct of these distributions with the RDFs produces anaverage weighted dipole correlation within washers, col-umns, or rays:Cwasher
mean , Ccolumnmean , andCray
mean, respectively.Hydrogen bonding is measured by the time averaged
number of water–water pair interactions with total electro-static plus LJ 12-6 energy exceeding a minimum attractiveinteraction. Cutoffs of28.5, 212.7, or217.0 kJ/mol havebeen used near hydrophobic and polar interfaces.25,12,26Herewe choose an intermediate cutoff value of212.7 kJ/mol ap-plied in both bulk and channel water simulations.
Water self-diffusion and ion diffusion coefficients arecalculated by averaging the mean square fluctuations of oxy-gen and ion position vectors over the range in time intervals0.1<Dt<10 ps. Statistical uncertainty is minimized by us-ing an overlapped data procedure.27 We consider the range1–10 ps after the initial shoulder, corresponding to inertialmotion within the hydration ‘‘cage.’’ Before calculating dif-fusion coefficients, the center of mass motion of the systemis subtracted to remove any net momentum associated withthe periodic boundary. We break diffusion down into threecomponents, Dz , Df , and Dr along the axial-z,tangential-f, and the radial-r directions, respectively. In ad-dition, the total nonaxial~transverse! diffusion is given bythe quantityDxy . These are given by the fluctuation formu-las
Dz51
2
d
dt^@z~ t !2z~0!#2&,
Dxy51
4
d
dt^@x~ t !2x~0!#21@y~ t !2y~0!#2&,
Dr51
2
d
dt^@r ~ t !2r ~0!#2&
Df51
2
d
dt^r 2@f~ t !2f~0!#2&52Dxy2Dr . ~6!
BecauseDr is of little interest in narrow channels it is notconsidered in this study. The tangential diffusionDf can becalculated in two ways, of which we prefer the latter in Eq.~6! because of the arbitrariness in the choice ofr 2.
Water rotational correlation is determined by analyzingthe decay of the dipole autocorrelation. The dipole autocor-relation function is defined as the time and system average ofthe cosine of the anglex(Dt) a water dipole at timet0
1Dt makes with its dipole at timet0 . A monoexponentialdecay is assumed and appears to be justified by analysis ofthe autocorrelation functions. The resulting expression gov-erning the calculation of the inverse rotational correlationtime is
t2152d
dtln^cosx~Dt !&, ~7!
which is valid at large time intervals (Dt). The samplingprocedure for this calculation is identical to that used fordiffusion.
III. CHANNEL WATER STRUCTURE
We begin with a summary of channel water properties.Water and ion diffusion are determined by the extent of or-dering and strength of intermolecular interactions within thechannel water. Here we examine the effect of the pore sizeand type on this structure. Bulk reference values are listed inTable II.
A. Density analysis
Figure 2 shows the water oxygen atom density profilesagainst distance from the effective wall radius for each walltype and for effective radiiR52.1– 5.6 Å. The distinct re-gions of high density near the wall and near the center of thepore have been observed in previous studies.8,9 The profilesfor the atomic and LJ 5-3 hydrophobic walls are very similar.Within hydrophobic channels~solid and dotted curves! oneshell of waters exists forR<3.6 Å while two shells appearfor larger pores. A band of water molecules centered at 1.2–1.4 Å from the effective channel radius solvates the pore
TABLE II. Bulk hydration and diffusion. Bulk propertiesr max, r min , n,nHB , D, and t21 are the first minima and maxima in the RDF, the firsthydration number~nearest neighbors!, the number of hydrogen bonds, thediffusion coefficient, and the first-order inverse rotational correlation timeconstant, respectively. Experimental results are given in square brackets.
Property Water Na
r max ~Å! [email protected]#a [email protected]#c
r min ~Å! 3.5260.04 3.1260.08n [email protected]#a 6.6760.02@4–6#d
nHB 2.7360.05 ¯
D (Å2/ ps! [email protected]#b [email protected]#e
t21 (ps21) 0.08460.002 ¯
aReference 29.bReference 18.cReference 30.dReference 31.eReference 32.
7989J. Chem. Phys., Vol. 111, No. 17, 1 November 1999 The effect of channel walls on diffusion of water and ions
This article is copyrighted as indicated in the article. Reuse of AIP content is subject to the terms at: http://scitation.aip.org/termsconditions. Downloaded to IP:
130.56.107.12 On: Tue, 22 Sep 2015 01:47:20

lining. As expected, the hydrophobic and hydrophilic chan-nels result in distinct density profiles. Water molecules areable to approach closer to a molecular wall resulting in amore sharply defined density maximum which is shifted to-ward the wall. Also a third peak in the density profile ap-pears in the larger pores.
Figure 3 displays 20 Å segments of the center of masscorrected density profiles in thez direction for atomic hydro-phobic ~A!, LJ hydrophobic~B!, and hydrophilic channels~C! with R52.6, 4.1, and 5.6 Å. In both of the hydrophobicchannels, a transition occurs atR54.1 Å ~also seen atR53.6 Å!, where the water becomes highly structured, andwell-defined layers appear. As in the case of Fig. 3, the re-sults for the two hydrophobic channels are very similar, thatis, an explicit treatment of the atomic structure of the channeldoes not have an appreciable effect on water structure.Therefore, in the following structural analysis, the results forthe LJ hydrophobic channel will not be shown if they requireadditional graphs, but will otherwise be included as dotted
curves for comparison. In the hydrophilic channels, the waterstructure exhibits again a markedly different behavior, withonly the narrow 2.6 Å channel exhibiting some order in thezdirection.
More insights into the structure of water can be obtainedfrom the directional RDFs, which are displayed in Fig. 4 forthe atomic hydrophobic~solid curves! and hydrophilic chan-nels ~dashed curves!. For simplicity, we analyze only theoutermost washer, which is the most relevant region sincethe vast majority of water molecules reside there. For eachgraph in Fig. 4 corresponding to channel radii 2.1–5.6 Å, theleft-hand panels show how water molecules within thiswasher are distributed in thef direction while the right-handpanels show distributions within columns. The total numberof waters in this washer, given at the top of each left-handpanel, equals the integral of this RDF plus one~to accountfor the molecule in question!. Consider first the hydrophobicchannels~solid curves!. The narrowest 2.1 Å channel repre-sents a near-single file system~;1.5 water molecules perdisk!, while the largest 5.6 Å channel contains over elevenwater molecules per disk~more than eight in the outerwasher alone!. For most channel sizes there exists an observ-able ordered distribution of molecules within each washer.This order is most apparent in the hydrophobic channel ofradius 4.1 Å where the five water molecules within the outerwasher are arranged in an approximate pentagonal arrange-ment. That is, two water molecules are at approximately672° and two at approximately6144°, with almost vanish-ing minima in between. Sample coordinates illustrating thisgeometry are shown in Fig. 5~A!. A similar near-pentagonal
FIG. 2. Water oxygen atom radial density profiles: Density profiles for theatomic hydrophobic~solid curve!, LJ hydrophobic~dotted curve!, and hy-drophilic ~dashed curve! channels are compared for effective channel radii2.1–5.6 Å. All profiles are plotted against the distance from the effectivewall of the channelR2r . The left-hand vertical axis represents the effectivewall while the right hand axis represents the channel axisz. Each graph islabeled with the effective channel radiusR.
FIG. 3. Water oxygen atom density profiles along channel axis direction:~A! Density profiles for atomic hydrophobic channels of effective radii 2.6~left-hand panel!, 4.1 ~central panel!, and 5.6 Å~right-hand panel!. ~B! Den-sity profiles for LJ hydrophobic channels.~C! Density profiles for hydro-philic channels.
7990 J. Chem. Phys., Vol. 111, No. 17, 1 November 1999 Allen, Kuyucak, and Chung
This article is copyrighted as indicated in the article. Reuse of AIP content is subject to the terms at: http://scitation.aip.org/termsconditions. Downloaded to IP:
130.56.107.12 On: Tue, 22 Sep 2015 01:47:20

geometry is also observed in the 3.6 Å hydrophobic channel.The RDFs within columns~right-hand panels of Fig. 4!
have density maxima diminishing in size with distancewhich is due to the restricted window in thef direction.Again the level of ordering becomes most prominent for themoderate sized (R53.6– 4.1 Å! hydrophobic channels. Themean number of waters in a column per 3.14 Å~the approxi-mate mean intermolecular distance!, averaged over the rangeuDzu<10 Å, is shown at the top of each graph on the right-hand panel. This value is a maximum for the moderate hy-drophobic pore sizes, again reflecting the extent of orderingin those channels and the strength of interactions betweenneighboring water molecules in the axial direction. Figure5~B! shows a random sample containing three disks of watermolecules within the 4.1 Å atomic hydrophobic channel. The
FIG. 4. Water radial distribution functions for the atomic hydrophobic~solidcurves! and hydrophilic~dashed curves! channels of radii 2.1–5.6 Å. Eachfigure has two panels: the left-hand panel is the oxygen atom RDF in thefdirection within the outermost washersgwasher(Df), while the right-handpanel is the RDF in thez direction within columns in the outermost watershell gcolumn(Dz). Variable axis ranges are used to highlight features ofdistribution functions. Due to the symmetry of each profile about the origin,distributions include contributions from both sides of the water molecule inquestion. At the top of the left-hand panels is given the number of watermolecules in the outer washer obtained from integrating the washer RDF forthe atomic hydrophobic channel, and in brackets the value for the hydro-philic channel. At the top of the right-hand panels is given the number ofwater molecules within the column per 3.14 Å obtained from integrating thecolumn RDF.
FIG. 5. Pentagonal arrangement of waters:~A! A sample disk of waterstaken at random from the end of the simulation of an atomic hydrophobicchannel with radius 4.1 Å.~B! Three disks of waters as viewed along thexaxis. Oxygen atoms are black, hydrogens gray, and lone pairs white.
7991J. Chem. Phys., Vol. 111, No. 17, 1 November 1999 The effect of channel walls on diffusion of water and ions
This article is copyrighted as indicated in the article. Reuse of AIP content is subject to the terms at: http://scitation.aip.org/termsconditions. Downloaded to IP:
130.56.107.12 On: Tue, 22 Sep 2015 01:47:20

distinct layering and the hydrogen bonding within columnsof water molecules are obvious in this illustration.
The hydrophilic channel RDFs~dashed curves in Fig. 4!show a different dependence on channel radius. The structureof water within the outer washers~left-hand panels! remainswell defined, but the density minima at radii 3.6–4.1 Å donot drop to near zero as they do in the hydrophobic channels.In other words, no anomalous stability is observed in thehydrophilic channels. Within columns~right-hand panels!only the narrow 2.6 Å channel, and to a lesser extent the 2.1Å channel, exhibit a high level of ordering away fromnearest-neighbor disks. Therefore, within hydrophilic chan-nels there exists strong interaction between adjacent disks,but weak interaction between distant disks.
B. Energy and hydrogen bonding
Figure 6~A! shows the variation in the average total sys-tem energy per water molecule. Within both hydrophobicchannels~solid and dotted curves, closed circles! the energydecreases to a minimum forR53.6– 4.1 Å and then in-creases and levels off as radius becomes large. This feature isnot observed within the hydrophilic channels~dashed curve,open circles!, where the energy stays nearly constant acrossthe range of radii. The minimum in the energy at moderatehydrophobic channel radii is associated with increased at-tractive interactions of neighboring molecules. The extent ofhydrogen bonding is maximized at moderate radii@Fig. 6~B!#where greater than bulk levels are observed. Figure 6~C! re-veals that the number of nearest-neighbor molecules levelsoff for small radii and only begins to increase forR.3.6 Å.Figure 2 shows that this corresponds to the onset of a secondshell of high water density. ForR<3.6 Å the channel watercannot achieve optimum packing and will suffer from el-evated free energy.
Within the hydrophilic channels there are no large varia-tions in the energy, number of hydrogen bonds, or the num-ber of nearest neighbors with the channel radius. Nearestneighbors and hydrogen bonds have been raised in compari-son to the hydrophobic channels as a result of the majority ofchannel waters having access to the molecular wall. If wediscount the hydrogen bonds involving wall water moleculesin the hydrophilic channels, then a significant reduction inhydrogen bonds is observed@dash-dot-dot curve of Fig.6~B!#, as seen in previous studies of polar surfaces.26 Whenthe wall water molecules are excluded, the mean number ofhydrogen bonds per channel water molecule is significantlylower than that for the corresponding hydrophobic channels.Thus water molecules sacrifice water–water hydrogen bondsfor water–wall hydrogen bonds. This strong interaction be-tween channel waters and fixed wall molecules is likely toresult in a reduced average self-diffusion.
C. Dipole distributions and the hydrophobic anomaly
Perhaps the most obvious difference between hydropho-bic and hydrophilic channels comes from the average waterdipole orientation distributions. In Figs. 7~A!, 7~B!, and7~C!, we show the cosu ~left-hand panels! and cosf ~right-hand panels! distributions for theR52.6, 4.1, and 5.6 Å
channels, respectively. In the hydrophobic channels~solidand dotted curves!, water molecules have a definite prefer-ence to point either up or down the channel axes. This trendis very clear in the narrow channels but becomes less welldefined with growing radius as secondary shells of waterappear. Most distributions possess symmetry about the originand result in zero net dipole moment~to within statisticaluncertainty!. Exceptions occur for the narrowR52.1–2.6 Åchannels where there is only one maximum in their cosudistributions, that is, the molecular dipoles all prefer to point
FIG. 6. The effect of pore radius on the total system energy per watermolecule~A!, the number of hydrogen bonds per water moleculenHB ~B!,and the number of nearest neighborsnNN ~C! for the atomic hydrophobic~solid curves, filled circles!, LJ hydrophobic~dotted curves, filled circles!,and the hydrophilic channels~dashed curves, open circles!. The number ofhydrogen bonds and nearest neighbors in hydrophilic channels when chan-nel wall molecules are excluded are drawn as dash-dot-dot curves~opencircles!. Error bars are one standard error of means for energy values, whilethose fornHB andnNN are6 one standard deviation.
7992 J. Chem. Phys., Vol. 111, No. 17, 1 November 1999 Allen, Kuyucak, and Chung
This article is copyrighted as indicated in the article. Reuse of AIP content is subject to the terms at: http://scitation.aip.org/termsconditions. Downloaded to IP:
130.56.107.12 On: Tue, 22 Sep 2015 01:47:20

down the channel axis. This leads to a rather large net dipolemoment per water molecule, namely, 2.0460.06 D for the2.1 Å channel and 1.8460.14 D for the 2.6 Å channel~cf.ST2 dipole moment is 2.35 D!. There is also a small asym-metry in the distributions of the moderate size 3.6–4.1 Åchannels@as seen in Fig. 7~B!#, leading to relatively smallnet dipole moments of 0.1660.09 and 0.2660.06 D, respec-tively. Within the hydrophilic channels~dashed curves ofFig. 7!, the water dipoles prefer to lie in thexy plane ratherthan run up or down the channel axis, and orient themselvesmore toward the channel wall~maxima in cosf distributionaway from zero!. Net dipole moments are zero for all hydro-philic channels.
This contrast in orientation is expected to have someinfluence on water and ion diffusion within these channels.For example, a charge or dipole~ion or water molecule!attempting to pass alongside a line of dipoles arranged headto tail will be impeded less than if it were to attempt to passalongside a line of dipoles oriented perpendicular to the line.Calculation of potential barriers indicates a maximum heightof about 12–15 kJ/mol along the pore lining of the hydro-phobic channels, whereas barrier heights of as large as 150kJ/mol are observed within the large hydrophilic channels.While the presence of an ion would alter the local orientationof water dipoles, thus reducing these barriers, there would
still remain some effect of the natural dipole orientationscaused by confinement.
We make some simple observations regarding the geom-etry and dipole orientations of water molecules in hydropho-bic channels. The number of water molecules in a singlewasher near the channel wall, provided in the left-hand pan-els of Fig. 4, reveals the average water geometry withindisks. Interpolating these numbers we see that three waterswould be arranged in a triangle~at 60° between neighbors!for a radiusR52.9 Å, four waters arranged in a square~at90°! for R53.4 Å, five waters arranged in a pentagon~at108°! for R54.0 Å, six waters in a hexagon~at 120°! forR54.5 Å, and so on. The angle between hydrogen, oxygen,and lone pair atoms within an ST2 water molecule is con-stant at 109.5°. Thus, if a water molecule attempts to formhydrogen bonds with both of its nearest neighbors within awasher, then it can do so most effectively for a pentagonalarrangement which occurs at a channel radius of approxi-mately 4 Å. If one hydrogen and one lone pair were to lie onthe xy plane then the water dipole must have au value of45°. Our orientation studies have revealed a preference fordipoles to run around each washer (fmean578°), elevatedout of the plane such thatumean546°. Therefore, moderatesize hydrophobic channels exhibit near optimal configura-tions for strong hydrogen bonding. This situation is observedin any randomly chosen sample disk of [email protected]., Fig.5~A!#, and offers an explanation for the high level of order-ing within disks, and consequently between disks, in thesemoderate channel sizes. Because there are an odd number ofwater molecules within the disk, and this optimal hydrogen–lone pair configuration requires that the dipole vector belifted out of the plane by approximately 45°, it is unlikelythat a zero net dipole within each disk will occur. In Fig.5~B! we observe 3 water dipoles in the pentagon directeddownwards while 2 are directed up the channel axis. Thispattern is repeated throughout the entire cylinder. This ex-plains the small asymmetry in the dipole distribution of Fig.7~B! and the nonzero dipole moment. Figure 5~B! also re-veals hydrogen bonding between disks of water molecules,which is a consequence of the dipole orientations.
An optimal-configuration phenomenon is not observedin the hydrophilic channels as a result of the smaller pre-ferred anglefmean of under 60° which can be attributed tothe strong interactions with the molecular wall. We remarkthat a similarly anomalous stability is observed nearR54 Åin pores with exponentially repulsive walls using the SPC/Ewater model.9 Therefore, this phenomenon is not a conse-quence of the ST2 charge distribution or the wall type used,but appears to be a generic feature of water confined in ahydrophobic cylinder with radiusR'4 Å.
D. A measure of structure: Dipole correlation
We now briefly examine dipole correlation in an attemptto understand how neighboring molecules arrange them-selves so as to, with the exception of the very narrow hydro-phobic channels, produce near-symmetric dipole distribu-tions, thus minimizing the net dipole moment and theelectrostatic energy. They are also a very good measure ofthe extent of ordering within the system. The RDF weighted
FIG. 7. Water dipole orientation distributions for channels of effective ra-dius 2.6~A!, 4.1 ~B! and 5.6 Å~C!: The left-hand panels show the averageprojections ofm onto thez axis~cosu! for atomic hydrophobic~solid curve!,LJ hydrophobic~dotted curve!, and hydrophilic~dashed curve!, channels.The right-hand panels show the projections onto the radial vectorr ~cosf!.
7993J. Chem. Phys., Vol. 111, No. 17, 1 November 1999 The effect of channel walls on diffusion of water and ions
This article is copyrighted as indicated in the article. Reuse of AIP content is subject to the terms at: http://scitation.aip.org/termsconditions. Downloaded to IP:
130.56.107.12 On: Tue, 22 Sep 2015 01:47:20

average correlations within washers, columns and rays foratomic hydrophobic and hydrophilic channels are providedin Figs. 8~A! and 8~B!, respectively. Before discussing thecomplex features of the plots for the hydrophobic channelswe remark on the hydrophilic pores@Fig. 8~B!#. Within thehydrophilic pores, dipoles are always positively correlatedwithin both washers and rays while there is little correlationin columns. This can be attributed to the strong interactionswith the molecular wall. There is negligible correlation ofdipole z components@dotted curves of Fig. 8~B!# in any di-rection and this explains the near-zero net axial dipole mo-ments within all hydrophilic channels. Also, in related analy-sis, we observe a strong positive correlation between watermolecules bound in the hydrophilic wall and those inside thechannel within the same ray. This is not surprising given thegeneral positive correlation between shells (Cray
mean) withinthe channels, and the extent of hydrogen bonding betweenchannel and wall water molecules.
In the hydrophobic channels@Fig. 8~A!# with small poreradii there is a strong positive correlation between water di-poles in washers, columns, and rays~total andz-dipole com-ponents! which explains the strong net dipole of the channelcontents. This behavior is expected due to the small dimen-sions of the pore and the near single-file nature of the water.In all directions, this correlation drops to small values forR53.1 Å, where we would anticipate large diffusion andshort rotational correlation times. At moderate sizes (R53.6– 4.1 Å!, the correlation within each washer increases~negative! and drastically increases within columns~posi-tive!. Therefore, in the medium size hydrophobic channels,dipoles are correlated such that cancellation occurs withineach disk and not from adjacent layers, in agreement with the
analysis of dynamics coordinates, such as shown in Fig. 5.This is the reverse of what is seen in the corresponding hy-drophilic channel. The mean correlation of nearly unity@seethe central panel of Fig. 8~A!# is indicative of the rigid struc-ture seen in Fig. 5~A!. The maxima in correlation within bothwashers and columns at radii 3.6–4.1 Å explain the highlyordered configurations, and are expected to result in de-creased translational and rotational diffusion. For poreslarger than 4.1 Å, correlation is again reduced within wash-ers and columns, becoming more positive in washers andrays, but likely to settle to zero in the bulk limit.
FIG. 8. Effect of pore size on weighted average dipole correlations: A andB correspond to the atomic hydrophobic~filled circles! and hydrophilic~open circles! channels, respectively. Weighted averages over washersCwasher
mean ~left-hand panels!, columnsCcolumnmean ~central panels, considering the
range610 Å!, and raysCraymean~right-hand panels!, of the dipole correlation
are drawn as solid curves. Weighted averages ofz components of dipolecorrelation are drawn as dotted curves.
FIG. 9. Self diffusion and rotational correlation:~A! axial self-diffusionDz
self , ~B! tangential self-diffusionDfself , and ~C! first-order inverse rota-
tional correlation time constantt21 for the atomic hydrophobic~solidcurves, filled circles!, LJ hydrophobic~dotted curve, filled circles! and hy-drophilic ~dashed curve, open circles! channels are compared. The horizon-tal dash-dot lines~no symbols! are the bulk reference values from Table II.Error bars are one standard error of means.
7994 J. Chem. Phys., Vol. 111, No. 17, 1 November 1999 Allen, Kuyucak, and Chung
This article is copyrighted as indicated in the article. Reuse of AIP content is subject to the terms at: http://scitation.aip.org/termsconditions. Downloaded to IP:
130.56.107.12 On: Tue, 22 Sep 2015 01:47:20

IV. WATER SELF-DIFFUSION
Figure 9 shows self-diffusion and first-order inverse ro-tational correlation times for each channel type against ra-dius. As anticipated, axial self-diffusion@Fig. 9~A!# withinhydrophobic channels experiences a dramatic fall at moder-ate channel sizes~3.6–4.1 Å!, which is associated withanomalous stability. Diffusion has effectively been elimi-nated at these radii, falling to as low as 4% of bulk. Forsmaller hydrophobic channels,Dz rises to about half the bulkvalue for the hydrophobic channels atR52.6 Å. Because thenarrowest channel~2.1 Å! is not small enough so that thewater forms a true single file system, self-diffusion does notexperience the significant attenuation associated with singlefile diffusion.3 As channel radius is increased past 4.1 Å,Dz
rises, asymptoting at the bulk diffusion level. The atomic andLJ 5-3 potentials give similar self-diffusion results over thisrange in channel size; the small deviations owing to a smallincrease in layering associated with the corrugated wall. Inhydrophilic channels,Dz increases steadily from 13% to66% of bulk diffusion. The relatively smooth increase inhydrophilic Dz was anticipated based on structural analysis.There is a reduction in axial self-diffusion for hydrophilicchannels with respect to the hydrophobic channels for smalland large pores that can be attributed to the preferred dipoleorientations and hydrogen bonding with fixed wall mol-ecules.
If we ignore the anomalous lack of axial diffusion formoderate size hydrophobic channels, there is a general up-ward trend with radius that can be explained in terms of ageneral decrease in channel water structure withR. As Rincreases, the separation of water molecules into well-defined and correlated regions becomes less apparent andwater molecules become more free to translate in the axialdirection. Simulations with an exponentially repulsive chan-nel wall and the SPC/E water model9 also produce this gen-eral trend, and anomalous diffusion atR'4 Å, though thereduction in self-diffusion is not as pronounced~only '40%reduction!. In parallel studies with the ST2 water modelwhere a strong harmonic confining wall potential is em-ployed, we have observed a similar anomaly forR53.6– 4.1 Å, with the axial self-diffusion dropping to'23%of bulk. Thus the small attractive component of the wallpotential appears to add an extra stability to water structureat these radii, suppressing axial diffusion further.
Although transverse motions of water molecules are notlikely to have the impact on axial ion diffusion that axialwater motions have, it is of some interest how free moleculesare to move perpendicular to the pore axis, and how thismotion is dependent on pore size and constitution. In all butthe wide channels (R>4.6 Å!, transverse self-diffusion canbe considered to be almost completely in thef direction~water molecules moving in circles!. Results forDf are plot-ted in Fig. 9~B!. Equation~6! shows thatDf has anr 2 de-pendence, and since most water molecules reside in the outershell near the channel wall, we expectDf to increase as thechannel radius grows. This general behavior is obvious inboth hydrophobic channel types. A significant decrease inDf is not obvious for our 3.6–4.1 Å hydrophobic pores. Theanomalously high levels of dipole correlation in the 3.6–4.1
Å hydrophobic channels have most strongly affected axialdiffusion and have had minimal influence on transverse com-ponents. Since we have observed well-defined columns ofwater molecules~Fig. 4! and strong positive dipole correla-tion within columns@Fig. 8~A!#, transverse diffusion for 3.6–4.1 Å hydrophobic channels must involve a considerableamount of collective motion of disks, indicating a lack ofwall friction. Analysis of water trajectories has shown thatalmost all water molecules rotate around thez axis at thesame time within these moderate-sized hydrophobic chan-nels. In contrast, rotations around thez axis are far less co-operative in the hydrophilic channels, and are reduced owingto the preferred dipole directions and hydrogen bonding withwall molecules.
Consider next the inverse rotational correlation of watermolecules@Fig. 9~C!#. Both hydrophobic channels experi-ence a gain in rotational freedom at radius 3.1 Å, as well aslarge radii. In fact, the inverse rotational correlation timeconstant exceeds the bulk value forR53.1 and 4.6–5.6 Å.Examination of Fig. 8 shows that there is least dipole corre-lation within the channels at these radii. The obvious drop inrotational freedom at 3.6–4.1 Å corresponds to the highlycorrelated, highly ordered systems.
V. ION STRUCTURE
We report our findings regarding ion positions and sol-vation within these channels before discussing ion diffusionestimates. In Fig. 10 we compare ion radial probability dis-tributions ~solid curves for atomic hydrophobic channels inthe left-hand panel, dashed curves for hydrophilic channelsin the right-hand panel! with the density profiles for water~dotted curves!. In hydrophobic channels, the distance of theion from the channel axis remains under 0.7 Å for effectiveradii 2.1–3.6 Å~ion between water shell and channel axis!.With increasing radii a second water shell develops near thecenter, and the ion moves further away from the axis. Thesedistributions are qualitatively similar to those found with ex-ponentially repulsive cylinders.9 In all channel sizes, the ionprefers to reside in regions of minimum water density, hy-drated by neighboring shells. There is, however, a tendencyfor the ion in the narrowest 2.1 Å channel to reside withinthe band of high water density~near single-file system!. Forthe larger pores the ion probability distribution is spreadmore evenly over the interior of the channel as a result of themore uniform water distribution.
Within hydrophilic channels~right-hand panels! the ionprefers to dwell near the channel wall lining, except for thelargest channel (R55.6 Å! where it tends to reside betweenwater shells. In 2.1<R<4.1 Å channels, the ion is about 0.3Å away from the effective wall atr 5R. Within larger chan-nels (R54.6– 5.1 Å!, the ion moves outwards and sits al-most on the wall (r 5R20.05 Å!. We observe the ion exist-ing between layers of the molecular lattice. In this position,the ion-nearest wall oxygen distance is 2.35 Å, which corre-sponds to the position of the first hydration maximum in thebulk Na ion RDF~Table II!. Thus, for these two large hy-drophilic channels, the curvature of the cylinder is such thatthe wall molecules provide an optimal hydration for the ion,so it prefers to stay very close to the pore lining.
7995J. Chem. Phys., Vol. 111, No. 17, 1 November 1999 The effect of channel walls on diffusion of water and ions
This article is copyrighted as indicated in the article. Reuse of AIP content is subject to the terms at: http://scitation.aip.org/termsconditions. Downloaded to IP:
130.56.107.12 On: Tue, 22 Sep 2015 01:47:20

We also see localization of ion density along the channelaxis direction as illustrated for the hydrophobic 3.6 Å chan-nel in Fig. 11~A!. We note that localization is most evident inthe 3.6 and 4.1 Å hydrophobic channels and either pore sizecould be chosen to illustrate this effect. The left-hand panelof Fig. 11~A! shows how the ion resides between water disksin the hydrophobic channel. In contrast, there is a fairly uni-form distribution of the ion in the hydrophilic channel~theright-hand panel!. The ion–water geometry is further quan-tified in Fig. 11~B!, which shows the angleu the ion–oxygenvector makes with the channel axis. As a result of the ion
residing between disks and between shells of waters withinhydrophobic channels, theu distribution of water moleculeswithin the first hydration shell of the ion exhibits no 0, 90°,or 180° components@left-hand panel of Fig. 11~B!#. The factthat the water molecules within the hydrophobic channel areunable to diffuse freely forR53.6 Å @Fig. 9~A!# suggeststhat the ion could move within these density troughs withlittle friction from neighboring water molecules. The situa-tion in the hydrophilic channel of the same radius@the right-hand panel of Fig. 11~B!# is very different. Although the ionprefers to reside within a plane between the layers of themolecular wall~dash-dot-dot curve!, a fairly uniform distri-bution of channel waters around the ion exists~solid curve!.Now consider the larger 5.1 Å channels@Fig. 11~C!# inwhich we have observed a strong attachment between the ionand the molecular wall~Fig. 10!. There is a complete rever-sal in the water distribution, which becomes uniform in thehydrophobic channel@the left-hand panel of Fig. 11~C!#, andordered in the hydrophilic one@the right-hand panel of Fig.11~C!#. Inspection of the ion hydration geometry in the hy-drophilic channel reveals fixed wall waters in the layer abovethe ion~near cosu50.5!, and in the layer below the ion~nearcosu520.3!. The free water molecules~solid curve! fill thespaces around the ion with clear preferences foru50°, 90°,and 180° positions. The Na ion is therefore strongly solvatedby the molecular wall forR54.6– 5.1 Å, and is surrounded
FIG. 10. Ion probability distributions: The left-hand panels show the ionprobability distribution~solid curves!, againstR2r , for the atomic hydro-phobic channels of radii 2.1–5.6 Å. The average number of ions within ashell of thickness 0.1 Å in the radial direction is plotted. The correspondingwater density profiles are drawn as dotted curves. The right-hand panelsshow the ion distributions for the hydrophilic channels~dashed curves! withcorresponding water density profiles superimposed~dotted curves!. The axisrange for the water density is 0–5.75 g/cm3 for all graphs. The axis rangefor ion numbers is 0–0.35. Vertical dash-dot lines represent the channel axisin each figure.
FIG. 11. ~A! Ion z profiles: The ion and water densities within an 8 Åsegment of the atomic hydrophobic~left-hand panel! and hydrophilic~right-hand panel! channels of radius 3.6 Å are shown as solid and dotted curves,respectively.~B! Hydration shell distributions forR53.6 Å channels: Thedistribution of water oxygen atoms within the first hydration shell aroundthe ion, as measured by the angleu the ion–oxygen vector makes with thez axis, is shown. The dash-dot-dot curve in the right-hand panel is thecontribution from the hydrophilic channel wall molecules.~C! Same as~B!but for R55.1 Å channels.
7996 J. Chem. Phys., Vol. 111, No. 17, 1 November 1999 Allen, Kuyucak, and Chung
This article is copyrighted as indicated in the article. Reuse of AIP content is subject to the terms at: http://scitation.aip.org/termsconditions. Downloaded to IP:
130.56.107.12 On: Tue, 22 Sep 2015 01:47:20

by water molecules in axial and transverse directions. Thesefactors are likely to cause reduced ion diffusion for thesehydrophilic channels. The absence of concentrated hydrationwaters in the axial and transverse directions in the largerhydrophobic channel is expected to lead to high levels of iondiffusion.
The first hydration numbers, obtained from Na1 ionRDFs, together with the ion electrostatic potential energycalculations, reveal that the hydrophobic channels have dif-ficulty permitting complete solvation of the ion for smallpore radius. For very narrow channels the first coordinationnumber is reduced to as little as 4, while it asymptotes at alittle over the bulk value at large radius. The first hydrationnumber of the ion within hydrophilic channels, on the otherhand, remains approximately constant at the bulk value forall R. Inside all hydrophilic channels withR<5.1 Å, ap-proximately half of the ion’s solvating molecules belong tothe channel wall which should tend to lower ion diffusioncoefficients relative to the hydrophobic channels. At radiiR54.6– 5.1 Å this number is raised slightly, which, combinedwith the propensity for the ion to be partially embedded inthe wall, will result in reduced ion mobility. The ion-wallcoordination contribution then drops to zero for the largestpore radiusR55.6 Å corresponding to the ion being releasedfrom the channel wall, with unfavorable planarlike geometry,toward the center of the channel.
VI. Na ION DIFFUSION
Because there are obvious ranges in channel size wherewater molecules are relatively free to move and rotate, andranges where there is little translation or rotation of watermolecules, one could naively expect that an ion would alsoexperience large variations in its diffusion. Figure 12~A! dis-plays thez component of the Na ion diffusion. We expect ageneral upward trend in axial ion diffusion with pore sizebecause of the increase in axial water diffusion associatedwith reduced ordering and correlation of molecules as chan-nel radius increases. Within hydrophobic channels~solid anddotted curves! there is a gentle increase inDz with poreradius, experiencing only small fluctuations. In atomic hy-drophobic channels the ion diffusionDz ranges from 10% to64% of bulk while in LJ 5-3 channels the Na diffusionranges from 18%–81% of bulk diffusion. It is clear that theinfluence of the corrugated channel wall has reduced axialion diffusion for the atomic hydrophobic channels relative tothe structureless LJ hydrophobic channels. The anomalouslylow diffusion of water at moderate sizes is not evident in theion diffusion. This feature can also be observed in channelswith exponentially repulsive walls.9 Consider, for example,the R53.6– 4.1 Å hydrophobic channels where axial selfdiffusion almost vanishes@Fig. 9~A!#, but where Na diffu-sion is only marginally reduced. Since a hydrated ion wouldnot move if the water cannot move, this means that the ionmust be able to diffuse within zones of low water density,exchanging solvation waters as it moves.
Within hydrophilic channels@the dashed curve of Fig.12~A!# Dz ranges from 12%–44% of bulk. There is a fairlylarge drop inDz at the larger 4.6–5.1 Å pore radii corre-sponding to the strong attachment of the ion to the molecular
wall, as demonstrated in Fig. 10 and by calculation of ioncoordination and electrostatic potentials. In addition, there isa significant axial ion coordination@u50 and 180°; Fig.11~C!#, which further attenuates axial diffusion.
Tangential Na diffusion (Df) exhibits a clear size de-pendency. WithinR<3.6 Å hydrophobic channels the ionresides closest to the channel axis at aboutr 50.3– 0.5 Å~cf.Fig. 10!. Because the shell of hydrating waters has a well-defined peak~Fig. 10!, the ion has little freedom to moveaway from its optimum radial position and is restricted tomove around the channel axis. When the ion resides veryclose to the axis it cannot diffuse in this direction either, thusthe attenuated tangential diffusion for small hydrophobicchannels seen in Fig. 12~B! ~solid and dotted curves!. Whenthe ion is released from the pore center (R>4.1 Å!, trans-verse diffusion rapidly increases, withDf reaching the bulklevel. Within hydrophilic channels@the dashed curve of Fig.12~B!# the f component of ion diffusion is further dimin-ished. ForR,5.6 Å, approximately half of hydration watersare taken from the channel wall. This, combined with muchtransverse coordination and reduced self-diffusion explainsthe reducedf component of ion diffusion within all hydro-philic channels.
VII. SUMMARY AND CONCLUSION
In this paper we have used MD simulations to investi-gate the influence of pore constitution and size on water and
FIG. 12. Sodium ion diffusion:~A! DzNa and~B! Df
Na for atomic hydropho-bic ~solid curve, filled circles!, LJ hydrophobic~dotted curve, filled circles!and hydrophilic~dashed curve, open circles! channels are compared to thebulk value~horizontal dash-dot line, open circles!. Error bars are one stan-dard error of means.
7997J. Chem. Phys., Vol. 111, No. 17, 1 November 1999 The effect of channel walls on diffusion of water and ions
This article is copyrighted as indicated in the article. Reuse of AIP content is subject to the terms at: http://scitation.aip.org/termsconditions. Downloaded to IP:
130.56.107.12 On: Tue, 22 Sep 2015 01:47:20

ion structure and diffusion. In hydrophobic pores, waterstructure and self-diffusion exhibit a dramatic dependence onthe pore size. The packing of water molecules into mediumsize hydrophobic pores leads to near optimum hydrogenbonded networks such that the system becomes anomalouslystable leading to near complete attenuation of water self-diffusion. This enhanced stability is not seen to the sameextent in studies with repulsive cylinders,9 which suggeststhat it is the attractive component of the atomic wall thatleads to additional structure within the channel. Indeed oursimulations repeated with a confining hard wall and the ST2water model resulted in less stable water structure confirm-ing this observation. Although the ST2 model exhibits ex-plicit lone-pair ‘‘atoms,’’ it is unlikely that the extent ofstability within these pores can be explained by exaggeratedcharge distributions around the water molecules. Because ofthe different preferred dipole orientations within the hydro-philic pores, no anomalous stability is observed.
The atomic hydrophobic channels are well representedby a one-dimensional potential function. The LJ 5-3 functiongives a very good reproduction of structural and dynamicalproperties of water and ions for all channel sizes. The sig-nificant decrease in simulation times with the use of thisfunction makes it very useful for many applications involv-ing narrow hydrophobic pores. With the use of the LJ 5-3potential, computation times are reduced by a factor of 2–4.This factor would be increased if the ratio of the number ofwall to water atoms were to be increased. The use of thispotential function in MD studies of ion selectivity, structure,and diffusion within the potassium channel28 made it pos-sible to simulate for long enough periods to resolve small ionenergy barrier differences, and produce ion diffusion pro-files. If the entire protein of the channel were to have beenincluded, these simulations would not have been possible.
Ions are found to reside between shells of water mol-ecules within atomic and LJ hydrophobic pores. The pres-ence of just one water shell for narrow channels (R<3.6 Å!results in the ion residing very close to the channel axis. Incontrast, ions prefer to lie close to the pore lining in a hy-drophilic channel for all radii except the largest 5.6 Å chan-nel. The polarizable channel lining provides an energeticallyfavorable environment for the ion up toR55.1 Å. Abovethis radius the wall lattice approaches a planarlike geometryand the ion is released from the channel wall. As a result ofthe uniform packing of wall molecules and the size of the Naion, wall molecules fit perfectly into the ion’s hydration shellfor pore radii 4.6–5.1 Å where the ion sits against the walllining. This phenomenon is dependent on the wall-lattice ge-ometry and may occur at a different pore radius for a realhydrophilic pore. The ability of narrow hydrophilic channelwalls to attract the Na ion has been observed in gramicidinA5 and in a model potassium channel.28
Despite the large variations in axial self-diffusion withhydrophobic channel radius, axial ion diffusion experiencesa fairly smooth growth with pore size. We have observedions residing between well-defined shells and disks of wa-ters. Although the water is almost incapable of translation,the ion maintains a relatively high level of axial diffusiondue to the absence of obstacles in its path. It appears that
when the channel water becomes highly stable, the ionmoves in troughs of water density where it can remain sol-vated with only small motions and rotations of water mol-ecules. Within hydrophilic channels these troughs are not sowell defined. As a result of water molecules surrounding theion in axial and transverse directions, ion diffusion becomessubject to levels of self-diffusion within the hydrophilicchannels. In addition, approximately half of the coordinatingmolecules are fixed on the molecular wall, which also con-tributes to this reduced diffusion.
Our results for ion diffusion in hydrophobic and hydro-philic channels can be compared to results for particular bio-logical channels. For example, the Na diffusion coefficientwithin gramicidin A11,5 ~with approximate radius 2 Å! isbetween 5.531024 and 0.058 Å2/ps. Diffusion in our 2.1 Åhydrophilic channel is approximately 29% of bulk, or, basedon the experimental bulk diffusion, 0.037 Å2/ps. Our predic-tion is therefore that Na ion diffusion in gramicidin A wouldbe slightly less than this value, in agreement with the exist-ing studies of that channel. Similarly we can compare ourhydrophobic channel results to those for nAChR models. TheM2 helix bundle with narrowest radius 6 Å is found to resultin 2/3 of bulk Na ion diffusion.10 Examination of Fig. 12~A!shows that our hydrophobic channel would also result in anion diffusion coefficient of approximately 2/3 of bulk.
The study of molecular diffusion in zeolites,3 where dif-fusion is a single file process, reveals two orders of magni-tude reduction from bulk diffusion levels. This phenomenonis not observed in the range of pore sizes studied in thiswork. Even our narrowest channel~2.1 Å radius! is not smallenough to result in a single-file diffusion, housing approxi-mately 1.5 water molecules per intermolecular spacing alongthe channel axis direction, and as a result exhibits relativelylarge molecular and ion diffusion.
Our observations on the effects of pore size and consti-tution on ion diffusion can be related to the organization ofthe protein residues in the linings of transmembrane pores.The fact that axial ion diffusion is higher in hydrophobicchannels than in hydrophilic ones for large pores (R.4 Å!,and the reverse for the smaller pores (R,4 Å! implies exis-tence of an optimal selection for a pore type according itssize. Indeed nature tends to line wide biological transmem-brane segments with nonpolar amino acids~e.g., nAChR,porins, and the wide region of the potassium channel!,whereas narrow segments are lined with polar groups~suchas in gramicidin A and the potassium channel selectivityfilter!. Our results offer realistic ion diffusion estimates foratomic and molecular pores such that ion mobility need nolonger be treated as a free parameter that may be arbitrarilyaltered to match experimental findings.
ACKNOWLEDGMENTS
This work was supported by grants from the AustralianResearch Council and the National Health & Medical Re-search Council of Australia. The calculations upon whichthis work is based were partly carried out with the SiliconGraphics Power Challenge of the ANU Supercomputer Fa-cility.
7998 J. Chem. Phys., Vol. 111, No. 17, 1 November 1999 Allen, Kuyucak, and Chung
This article is copyrighted as indicated in the article. Reuse of AIP content is subject to the terms at: http://scitation.aip.org/termsconditions. Downloaded to IP:
130.56.107.12 On: Tue, 22 Sep 2015 01:47:20

1B. Hille, Ionic Channels of Excitable Membranes, 2nd ed.~Sinauer Asso-ciates, Sunderland, MA, 1992!.
2S. Yashonath and P. Santikary, J. Phys. Chem.98, 6368~1994!.3K. Hahn, J. Ka¨rger, and V. Kukla, Phys. Rev. Lett.76, 2762~1996!.4N. Unwin, Neuron3, 665 ~1989!.5B. Roux and M. Karplus, Annu. Rev. Biophys. Biomol. Struct.23, 731~1994!.
6D. A. Doyle, J. Morais Cabral, R. A. Pfuetzner, A. Kuo, J. M. Gulbis, S.L. Cohen, B. T. Chait, and R. MacKinnon, Science280, 69 ~1998!.
7D. P. Tieleman and H. J. C. Berendsen, Biophys. J.74, 2786~1998!.8M. S. P. Sansom, I. D. Breed, and R. Sankaramakrishnan, Biophys. J.70,693 ~1996!.
9R. M. Lynden-Bell and J. C. Rasaiah, J. Chem. Phys.105, 9266~1996!.10G. R. Smith and M. S. P. Sansom, Biophys. J.75, 2767~1998!.11B. Roux and M. Karplus, J. Phys. Chem.95, 4856~1991!.12C. Y. Lee, J. A. McCammon, and P. J. Rossky, J. Chem. Phys.80, 4448
~1984!.13F. F. Abraham, J. Chem. Phys.68, 3713~1978!.14B. R. Brooks, R. E. Bruccoleri, B. D. Olafson, D. J. States, S. Swami-
nathan, and M. Karplus, J. Comput. Phys.4, 187 ~1983!.15L. Verlet, Phys. Rev.159, 98 ~1967!.16F. H. Stillinger and A. Rahman, J. Chem. Phys.60, 1545~1974!.17K. Heinzinger, Physica B131, 196 ~1985!.18CRC Handbook of Chemistry and Physics, edited by D. R. Lide~CRC,
Cleveland, 1994!.
19H. J. C. Berendsen, J. R. Grigera, and T. P. Straatsma, J. Phys. Chem.91,6269 ~1987!.
20W. L. Jorgensen, J. Chandrasekhar, J. D. Madura, R. W. Impey, and M. L.Klein, J. Chem. Phys.79, 926 ~1983!.
21V. Dagget and M. Levitt, Annu. Rev. Biophys. Biomol. Struct.22, 353~1993!.
22G. S. Del Buono, T. S. Cohen, and P. J. Rossky, J. Mol. Liq.60, 221~1994!.
23L. Perera, U. Essmann, and M. L. Berkowitz, J. Chem. Phys.102, 450~1995!.
24M. P. Allen and D. J. Tildesley,Computer Simulation of Liquids~OxfordUniversity Press, New York, 1987!.
25B. Jonsson, Chem. Phys. Lett.82, 520 ~1981!.26R. Kjellander and S. Marc`elja, Chem. Phys. Lett.120, 393 ~1985!.27D. C. Rapaport,The Art of Molecular Dynamics Simulation~Cambridge
University Press, Cambridge, 1995!.28T. W. Allen, S. Kuyucak, and S-H. Chung, Biophys. J.~in press!.29D. Eisenberg and W. Kauzmann,The Structure and Properties of Water
~Oxford University Press, London, 1969!.30G. W. Neilson and J. E. Enderby, Annu. Rep. Prog. Chem., Sect. C: Phys.
Chem.76, 185 ~1979!.31S.-B. Zhu and G. W. Robinson, J. Chem. Phys.97, 4336~1992!.32H. G. Hertz, Aqueous Solutions of Simple Electrolytes, inWater: A Com-
prehensive Treatise Vol. 3,edited by F. Franks~Plenum, New York,1973!.
7999J. Chem. Phys., Vol. 111, No. 17, 1 November 1999 The effect of channel walls on diffusion of water and ions
This article is copyrighted as indicated in the article. Reuse of AIP content is subject to the terms at: http://scitation.aip.org/termsconditions. Downloaded to IP:
130.56.107.12 On: Tue, 22 Sep 2015 01:47:20