Household Characteristics That Influence Simple Household ...

THE AUSTRALIAN NATIONAL UNIVERSITY
WORKING PAPERS IN ECONOMICS AND ECONOMETRICS
The Effect of Household Characteristics on Living Standards in South Africa 1993 - 98: A Quantile
Regression Analysis with Sample Attrition ∗
Pushkar Maitra† and Farshid Vahid‡
Working Paper No. 452
May, 2005
ISBN: 086831 452 8
Abstract: This paper examines whether the dismantling of apartheid has resulted in the improvement in the standard of living for the vast majority of South Africans. The study is based on a panel data set from the Kwazulu-Natal province. Despite the best efforts of the interview team, the attrition rate in this panel is around 16%. We find that household income and size in 1993, several community characteristics and survey quality in 1993 significantly affect the probability of attrition. We use weighted quantile regressions to examine the distribution of standards of living, which corrects for the potential bias arising from non-random sample attrition. Our results show that there has been a significant increase in the spread of the distribution of household expenditure of the Non-White households residing in Kwazulu-Natal province. We argue that the stretch to the right of the upper tail of distribution can be attributed to significant increase in returns to primary and high school education, while movement to the left of the lower quantiles can be associated with the increase in the proportion of female headed households and household size. Key Words: Living Standards, Quantile Regression, Sample Attrition, South Africa JEL Classification: I3, D1, C21, C24. ∗ Funding provided by t he Australian Research Council Discovery Grant Scheme. †Department of Economics, Monash University, Clayton Campus, VIC 3800, Australia. Email: [email protected]. Corresponding author. ‡School of Economics, Australian National University, ACT 0200, Australia. Email: [email protected]
Abstract
This paper examines whether the dismantling of apartheid has resulted in the improve-
ment in the standard of living for the vast majority of South Africans. The study is
based on a panel data set from the Kwazulu-Natal province. Despite the best efforts
of the interview team, the attrition rate in this panel is around 16%. We find that
household income and size in 1993, several community characteristics and survey qual-
ity in 1993 significantly affect the probability of attrition. We use weighted quantile
regressions to examine the distribution of standards of living, which corrects for the
potential bias arising from non-random sample attrition. Our results show that there
has been a significant increase in the spread of the distribution of household expendi-
ture of the Non-White households residing in Kwazulu-Natal province. We argue that
the stretch to the right of the upper tail of distribution can be attributed to significant
increase in returns to primary and high school education, while movement to the left
of the lower quantiles can be associated with the increase in the proportion of female
headed households and household size.
Key Words: Living Standards, Quantile Regression, Sample Attrition, South Africa
JEL Classification: I3, D1, C21, C24.
2

1 Introduction:
The primary aim of this paper is to examine changes in living standards in South African
households following the dismantling of apartheid. Notwithstanding its status as an upper-
middle income country with a per capita income in excess of $3000, South Africa is charac-
terised by enormous extents of poverty, inequality and material deprivation.1 The Human
Development Index of the Whites in South Africa is between those of Italy and Israel, while
that for the Blacks is between those of Swaziland and Lesotho. Carter & May (1999) and
Maitra & Ray (2003) compute the overall poverty rate in South Africa in 1993 to be more
than 50% and the poverty rate was significantly higher for the Black households compared to
the Non-Black households. These results are corroborated by the findings of Klasen (1997,
2000). In the context of South Africa, much of the differences in living standards among the
different segments of the population are the direct result of apartheid policies that denied
equal access to education, employment, services and resources to the Non-White popula-
tion of South Africa.2 Apartheid was officially dismantled in 1994 following the election of
Nelson Mandela as the president of South Africa. Following the dismantling of apartheid,
the official policy of classifying individuals on the basis of race and skin colour no longer
exists. However the legacy and history of the years of injustice is difficult to forget and is
apparent in the form of wide divergences in the living standards of the different segments
of the population. The important question now is whether the dismantling of apartheid has
resulted in improvements in living standards among the vast majority of South Africans.
In 1993, during the nine months preceding the historic 1994 elections, a sample of approx-
imately 9000 households were surveyed as a part of Living Standard Measurement Study
(LSMS) initiated by the World Bank in a number of developing countries.3 The data set
is unique because it is the first that covers the entire South African population, including
1See the volume edited by May (2000).2During the apartheid era, every South African was classified as belonging to one of the following races:
Black (or African, 75.2%), Coloured (or Mixed Race, 8.6%), Indian (or Asian, 2.6%) andWhite (or Caucasian,
13.6%).3We discuss the data set in greater detail in Section 3 below.
3

those residing in the predominantly Black “homelands”.4 Using this data set, Deaton (1997)
computes inequality levels in South Africa in 1993 and notes that the 1993 data can “serve
as a baseline against which future progress could be assessed. Because there have been no
subsequent LSMS surveys in South Africa, these data cannot be used to track living stan-
dards over time, but they provide a snapshot of living standards by race at the end of the
apartheid era.” (Deaton, 1997; page 156). In 1998, Black and Indian households in the 1993
data set that resided in the Kwazulu-Natal province were re-interviewed as a part of the
Kwazulu-Natal Income Dynamics Study (KIDS). We use these two data sets to examine the
change in the standard of living in South Africa between 1993 and 1998.
Although this panel of households the Kwazulu-Natal province (from surveys conducted
in 1993 and 1998) allows us to analyse the issue of changes in living standards over the
period5, there are two caveats that we need to consider. The first is the problem of non-
random attrition and the potential selection bias associated with sample attrition. We discuss
this problem at length and account for attrition in our econometric analysis. The second
issue arises from the fact that our panel data set only includes Non-White households that
resided in the Kwazulu-Natal province, and therefore it is not a representative of the general
population in South Africa. We cannot do much about this issue other than emphasize
throughout the paper that this is a study of the change in the living standards of Non-White
South Africans, and we caution the readers that the measures of inequality reported here
must not be compared with measures of inequality reported for all South Africans in other
studies. We think that the study of distribution of living standards within the Non-White
population is an interesting measure of progress in South Africa, perhaps even more so than
the study of the entire population. It is the evolution of the distribution of living standards
within the Non-White population that gives a more telling picture of the process of change
in South Africa.
The measure of living standard used in this paper is per capita household expenditure.
Traditionally per capita household income has been used as a measure of household living
4The “homelands” were designated residential regions for the Blacks during the apartheid regime. These
were typically autonomous states within South Africa.5See Hsiao (1986) for a general discussion of advantages of using panel data in econometrics.
4

standard. Increasingly however researchers are using per capita household expenditure as a
measure of household standard of living and as a proxy for household permanent income.
Household expenditure is easier to measure compared to household income and is typically
measured with less error. Moreover household expenditure is typically a better proxy for per-
manent income because while income might be subject to transitory fluctuations, households
typically use a variety of mechanisms to smooth consumption over time.
We start by examining changes in the unconditional distribution in per capita household
expenditure by comparing the living standards at the mean and at different quantiles. We
also examine how inequality has changed over the period 1993 - 1998. All of these calcu-
lations control for the effect of attrition. We find that there has been an increase in the
mean and also a significant increase in the spread of the living standards of Non-White
South Africans. The results clearly show that probability mass from the middle of the ex-
penditure distribution has been redistributed to its two tails, and as a result all measures
of inequality have significantly increased. We then analyse the distribution of expenditure
conditional on household characteristics in order to determine if there has been a change in
the conditional distribution or a change in the household characteristics that can be asso-
ciated with the increase in the spread of the distribution of living standards. We examine
the changes in the conditional distribution of living standards by estimating the quantiles of
this distribution using quantile regressions (see Koenker & Bassett, 1978; Buchinsky, 1998;
Deaton, 1997). Quantile regressions allow us to examine whether the relationship between a
particular explanatory variable and household expenditure (or household standard of living)
is affected by the position of the household on the expenditure distribution.6 It might be
noted that quantile regressions have often been used to estimate the wage premium of years
of schooling (see Buchinsky (1998)). Anderson & Pomfret (2000) use quantile regression to
estimate changes in living standards in the Kyrgyz Republic over the period 1993 - 1996,
during transition to the market economy. In the context of South Africa, Thomas (1996)
has used quantile regressions to estimate the returns to education by race and Mwabu &
Schultz (1996, 2000) use quantile regressions to estimate education returns across quantiles
6See Deaton (1997) for a discussion of the benefits of using quantile regressions over ordinary least squares
regressions.
5

of the wage function.
We use the Kwazulu-Natal panel to detect if the conditional quantile parameters have
changed significantly between 1993 and 1998. Since some households that were in 1993
sample could not be re-interviewed in 1998, we need to control for this attrition for consis-
tent estimation and inference. The effects of sample attrition can be particularly important
in panel data sets from developing countries where there is considerable mobility in the pop-
ulation primarily because of migration.7 In recent years a great deal of attention has been
paid to the issue of selection bias in panel data sets (see the special symposium on attrition
in panel data sets in the Journal of Human Resources, Spring 1998). The main conclusion of
all these studies is that in the developed countries “biases in estimates of socio-economic re-
lations due to attrition are small - despite attrition rates as high as 50% and with significant
differences between attritors and non-attritors for the means of a number of outcome and
control variables” (Alderman, Behrman, Kohler, Maluccio & Watkins, 2001). The question
that follows immediately is: Is selectivity bias and sample attrition a bigger problem in data
from the developing countries? There are a number of reasons why one might expect it to be
so. Availability of information and tracking facilities are better in developed countries. In
developing countries the high levels of mobility and long distance migration that are so much
a part of the process of development, result in increasing the problem of sample attrition.
The literature on sample attrition using data from developing countries is however relatively
sparse.8 Thomas, Frankenberg & Smith (2001) argue that while with careful planning it
is possible to collect panel data sets in developing countries with attrition rates lower than
those obtained in developed countries, the attrition that remains is still non-random and is
typically associated with both community and household characteristics.9 We also find that
the attrition from the Kwazulu-Natal sample in 1998 is related to observable characteristics
in a way that may render the standard quantile regression estimates inconsistent. Hence we
7Of course the potential problem of selection bias due to non-response exists in cross-sectional data sets
as well but in panel data the problems are exacerbated because of the inherent difficulties associated with
re-interviewing the same household or the same individual.8This is partly because there are very few large panel data sets from developing countries.9In Indonesia as a part of Indonesian Family Life Surveys (IFLS), tracking movers (something typically
not done in developing countries) reduced attrition by more than 50%.
6

use a form of weighted quantile regression to obtain consistent estimates, and we make all
of our statistical inferences on based on weighted estimators.
The rest of the paper is organised as follows. Section 2 presents the econometric framework
specifically designed to analyse the problem at hand. Section 3 describes the data sets used
in the paper, selected descriptive statistics and some preliminary descriptions of how things
have changed in South Africa during the period 1993 - 1998. Sections 4 and 5 present the
regression results and finally section 6 concludes.
2 Econometric Framework
The general question of sample selection, of which attrition is a special case, and its effect on
the estimation of parameters of interest has been discussed extensively in the literature (see
Fitzgerald, Gottschalk & Moffitt, 1998 and references therein). The method of inverse prob-
ability weighting as a means to counter the selection bias and obtain a consistent estimator
of parameters of interest has been studied, among others, by Robins, Rotnitzky & Zhao
(1995) and Wooldridge (2002). We explain these in the context of a very simple example
of attrition in a two period panel, and then describe the econometric specifications that we
have used for studying the change in the expenditure distribution in South Africa.
Consider a two period panel. In period 1, we observe variable y for 200 randomly chosen
individuals, half of whom are male. Assume that y and gender are statistically dependent.
In period 2, 80 people drop out. If attrition is independent of y, then obviously attrition
does not cause any problems.10 Suppose that attrition is not independent of y and from the
80 dropouts, 20 are men and 60 are women. Then there are two possibilities:
1. Selection on observables: Conditional on gender, attrition is independent of y, i.e.
10In the statistics literature, this case is referred to as “missing completely at random”.
7

within the group of men, attrition is completely random, and the same for women.11
Whether this type of attrition makes the usual estimators biased depends on the pa-
rameter of interest:
(a) If the parameter of interest relates to the conditional distribution of y given gen-
der, then attrition on observables does not matter. For example, if we are inter-
ested in conditional mean of y given gender in period 2, the sample average of
y for the 40 remaining women and the sample average of y for the remaining 80
men will be unbiased estimators of the expectation of y conditional on gender.
This is because the 40 women observed in period 2 still form a representative
sample of all women, and similarly the group of men observed in period 2 are a
representative sample of the male population.
(b) If the parameter of interest relates to the unconditional distribution of y, or if
it relates to the conditional distribution of y given a characteristic other than
gender, then attrition based on gender does matter. For example, the sample
average of observed y for all persons in period 2 will be a biased estimator of the
unconditional mean of y in period 2. That is because the sample of all persons
observed in period 2 is not a representative sample of the population anymore.
2. Selection on unobservables: Even after conditioning on gender, attrition depends on y.
This would be the case, for example, if within the male and the female group those with
lower y were more likely to drop out. This kind of attrition causes inconsistency in the
estimation of parameters related to the conditional or unconditional distribution of y
unless a complete statistical model of attrition is specified and estimated jointly with
the statistical model for y. This case has been extensively discussed in econometrics
literature, in particular in the literature on social experiments and policy evaluations
(e.g., Hausman & Wise, 1979, Heckman, 1979).
The case we concentrate on here is case (1.b). In that situation, if instead of solving the usual
moment conditions, we solve the weighted moments, where the weight of each observation is
11In the statistics literature, this type of attrition is called “missing at random” (Lipsitz, Fitzmaurice,
Molenberghs & Zhao, 1997).
8
the inverse of probability of that observation being observed in the second period, then we get
a consistent estimator of the mean in period 2. In the above example, this leads to a weighted
average of the observations in period 2, in which female observations get a weight that is
twice as large as the weight given to male observations (the inverse probability of being in
the sample in period 2 is 100/40 for females and 100/80 for males). In this simple example,
where the observable determinant of attrition is a single binary variable, the estimation of
probability of being in sample in period 2 is quite straightforward, and it is quite clear
how inverse probability weighting leads to a consistent estimator of the mean. However,
when there are several discrete and continuous observables that determine attrition, then
the assumption of correct specification of the model of attrition that produces the estimated
probabilities becomes crucial for the consistency of weighted estimators.
In this paper, we are interested in the parameters related to the unconditional distribution
of expenditure (such as its mean, variance and measures of inequality), as well as parameters
related to the distribution of expenditure conditional on a small subset of observables, such
as education, race, place of residence. However, we have a larger set of observable variables
that are useful for predicting the probability of attrition, some of which are also correlated
with expenditure in the second period. For example, whether a family lived near a paved road
is a very good predictor of attrition, but we are not interested in examining the expenditure
distribution conditional on being or not being close to a paved road. This places our problem
in category (1.b) above. We believe that it is justified to assume that conditional on the
covariates used for predicting the probability of attrition, expenditure is independent of
attrition, in particular because lag expenditure is one of such covariates.
We study the conditional distribution of expenditures given specific households characteris-
tics (like educational attainment and age of the household head, household composition) by
analyzing the 10th, 25th, 50th, 75th and 90th quantiles of this distribution. Quantile regres-
sions where introduced by Koenker & Bassett (1978) and have been since used extensively
in applied labour economics (see Buchinsky, 1998, for a survey). Here we want to investigate
whether distribution of expenditures of Non-White South African households has changed
since the abolition of the apartheid regime, and if so, if there has been a change in the way
9

household characteristics influence the distribution. If we denote the logarithm of expendi-
ture of household i in period t (t = 1 for 1993 and t = 2 for 1998) by yit and the vector of
other characteristics of interest of household i in period t by Xit , then quantile regression
models assume that the θ quantile of the conditional distribution of yit given Xit is Xitβθt.
If attrition was completely random, then the sample moment conditions that delivered the
method of moments estimator for βθ2 would be
N2
i=1
Xi2 θ − I yi2 < Xi2β̂θ2 = 0 (1)
where I{.} is the indicator function, and N2 is the number of households in the sample inperiod 2. If ATTRITEi denotes the binary variable that is equal to 1 if household i drops
out in period 2, and equals 0 otherwise, then the moment condition (1) can be written as
N
i=1
(1−ATTRITEi)Xi2 θ − I yi2 < Xi2β̂θ2 = 0. (2)
If attrition is completely random, this equation (after both sides are divided by N) converges
in probability to a constant times the population moment condition
E (Xi2 (θ − I {yi2 < Xi2βθ2})) = 0
which is satisfied for the true parameters of the conditional quantile function. However,
when attrition is not completely random and it depends on covariates other than Xi2 that
are correlated with yi2, equation (2) does not converge to a population moment condition that
has the true βθ2 as its solution, and therefore the solution of the sample moment condition
(1) will not be a consistent estimator of the parameters of the conditional quantile function.
Under the assumption of attrition on observables we have
ηi ≡ Pr (ATTRITEi = 1 | Zi1, yi2, Xi2) = Pr (ATTRITEi = 1 | Zi1)
where Zi1 is the vector of all observed characteristics of household i in period 1 including,
but not limited to, yi1 and Xi1. Since ATTRITEi is a binary variable, this implies
ηi = E (ATTRITEi | Zi1, yi2, Xi2) = E (ATTRITEi | Zi1) .
10

The inverse probability weighted estimator12 solves
N
i=1
1−ATTRITEiπi
Xi2 θ − I yi2 < Xi2β̂θ2 = 0 (3)
where πi is the probability of household i being in the sample in period 2, that is πi =
1 − ηi. Using the law of iterated expectations, the expected value of the summand for
any β is E (Xi2 (θ − I {yi2 < Xi2β})) . Therefore, under the standard regularity conditions,the solution to the sample moment condition (3) converges in probability to the solution
of E (Xi2 (θ − I {yi2 < Xi2β})) = 0, which is the true conditional quantile parameter (againunder standard identifiability conditions). When probability of attrition is unknown and it is
estimated from a first stage model for attrition, as long as this model is correctly specified and
consistently estimated, the argument for the consistency of the inverse probability weighted
estimator remains basically the same.13
When conditional quantiles are the same in periods 1 and 2, one should use information in
both periods to estimate the quantile parameters. Indeed, one of our main objectives to
test if these parameters have changed significantly, and if so, which elements have changed.
To mix information from both periods, we use the weighting scheme suggested by Lipsitz,
Fitzmaurice, Molenberghs & Zhao (1997). In this scheme, all observations of a household
which is in the sample in both periods 1 and 2 receive the same weight equal to the inverse
of the probability of that household being in sample in period 2 (i.e., probability of not
attriting), and period 1 observation of a household that is not observed in period 2 receives
a weight equal to the inverse of probability of that household attriting, i.e.,
N
i=1
di
t=1
1
πidiXit θ − I yit < Xitβ̂θ = 0 (4)
where di = 1 for attritors and di = 2 for non-attritors, and denoting probability of attrition
for household i by ηi, then πidi = ηi if di = 1 and πidi = 1−ηi if di = 2. This weighting schemehas the advantage that observations of the same household in different periods receive the
12An alternative method of treating sample selection in quantile regressions is a Heckman-type correction
as in Buchinsky (2001).13See Newey and McFadden (1994) for a more rigorous proof of the consistency of two stage estimators.
11

same weights, and it is easily generalizable to panels with more than 2 time periods with
some attrition at each stage. Defining
X∗it =Xitπidi
and y∗it =yitπidi
,
equation (4) can be re-written as
N
i=1
di
t=1
X∗it θ − I y∗it < X∗it β̂θ = 0, (5)
This implies that the weighted estimator can be easily estimated using any statistical package
that has a quantile regression procedure. Note that we have dropped the time subscript on
β̂θ. This is because we include a full set of interactions of household characteristics with a
period 2 dummy variable in Xit to investigate if the quantiles have significantly changed
in period 2. The weights depend on the probability of attrition ηi and in practice these
probabilities need to be estimated. We use a logit model for the binary indicator of attrition
based on Zi1 to model attrition. There are many more variables in Zi1 in addition to Xi1.
Asymptotic normality of the inverse probability weighted quantile regression estimator is a
more challenging proposition to prove. Wooldridge (2002) proves the asymptotic normality
of the inverse probability weighted method of moment estimator with a smooth objective
function, when the weights are estimated. He also derives the asymptotic covariance matrix
of this estimator. As a referee has pointed out, however, the asymptotic distribution of
two-step inverse probability weighted estimators in the case where the moment condition in
not smooth, as in equation (4) with π̂idi instead of πidi , has not been explicitly established
in the literature. We believe that such a proof can be established along similar lines as in
Wooldridge (2002) but using the appropriate regularity conditions for non-smooth objective
functions as in Newey & McFadden (1994). However, this is beyond the scope of the present
paper. Here, we assume asymptotic normality, and use a bootstrap in bootstrap procedure
for inference.
For the usual (unweighted) quantile regression estimator, Buchinsky (1995) shows some
evidence that estimating the covariance matrix of the parameters with a bootstrap procedure
12

is more accurate than using a consistent estimator of the asymptotic covariance matrix.
Here, we design a bootstrap in bootstrap procedure to account for the uncertainty in the
first stage estimation of the weights on the second stage estimation of β̂θ as well. In the first
step, probability of attrition is estimated for each household based on a bootstrap sample of
period 1 households. Then, one hundred bootstrap samples are drawn from the entire data
set, and for each of these samples the inverse probability weighted β̂jθ is calculated. From
this sample of β̂1θ , ..., β̂100θ , a bootstrap covariance matrix is calculated. This is based on
one set of estimated weights, and therefore does not take the uncertainty in estimation of
probability weights into account. Then a new set of weights are estimated based on a new
bootstrap sample of first period households, and a new set of one hundred β̂θ are estimated,
leading to a new covariance matrix. This process is repeated 200 times. The reported
standard errors of β̂θ are the square root of the diagonal elements of the sample average of
the 200 bootstrapped covariance matrices. These standard errors incorporate the effect of
the estimation uncertainty of the first step on the variance of the second stage estimator.
3 Data and Descriptive Statistics
Two different data sets are used in this paper. They are the South Africa Integrated House-
hold Survey (SIHS) 1993 data and the Kwazulu-Natal Income Dynamics (KIDS) 1998 data.
The SIHS data was collected in the nine months preceding the historic 1994 elections. This
survey was jointly conducted by the World Bank and the South Africa Labour and Devel-
opment Research Unit (SALDRU) as a part of the Living Standard Measurement Study
(LSMS) in a number of developing countries. The main instrument used in this survey was
a comprehensive questionnaire covering a wide range of topics. As mentioned in the Intro-
duction, this data set is unique because it is the first that covers the entire South African
population, including those residing in the predominantly Black “homelands”. The complete
sample consists of approximately 9000 households drawn randomly from 360 clusters. The
questionnaire and summary statistics are contained in SALDRU (1994).
13

Households in the SIHS data set that resided in the Kwazulu-Natal province were re-
interviewed in 1998 as a part of the Kwazulu-Natal Income Dynamics Study (KIDS). The
KIDS data set is the outcome of a collaborative project between the researchers at the Uni-
versity of Natal, the University of Wisconsin at Madison and the International Food Policy
Research Institute (IFPRI). Details of the KIDS data set can be obtained from Maluccio,
Haddad & May (2000), May, Carter, Haddad & Maluccio (2000), Maluccio, Thomas & Had-
dad (2003) and Maluccio (2004). Kwazulu-Natal is the home of a fifth of the population
of South Africa and was formed by combining the former homeland of Kwazulu and the
province of Natal. 12% of the population of Kwazulu-Natal are Indians, 85% are Blacks
and the remaining are of European descent (primarily British).14 The KIDS survey did not
re-interview the White households.15
An important aspect of the KIDS 1998 data set that differentiates it from most longitudi-
nal surveys in developing countries, is that whenever possible the interviewer teams tracked
down and re-interviewed households that had moved. In consequence migration does not
automatically imply attrition from the sample. Maluccio, Haddad & Thomas (2001) and
Maluccio (2004) present more details of the re-survey and the tracking procedure used and
conclude that this resulted in a 25% reduction in the number of households that attrited.
The 1993 Kwazulu-Natal sample consisted of 1354 households (1139 Black and 215 Indian).
This defines the target sample. Of the target sample, 1132 households (83.60%), with at least
one 1993 member, were successfully re-interviewed in 1998. The attrition rate was signifi-
cantly higher in the Indian sub-sample (21.86%) compared to the Black sub-sample (15.36%)
and also significantly higher for households residing in former Natal (25.57%) compared to
households residing in former Kwazulu (12.62%).16 However the attrition rates were fairly
similar in rural and urban areas - 16.61% in rural areas and 16.07% in urban areas.
The primary outcome variable of interest in this paper is per capita household expenditure.
14Natal was one of the two main British colonies in South Africa, the other being the Cape Colony. The
Indians residing in Natal are generally descendants of the indentured labourers who were brought to Natal
by the British to work in plantations.15There were no Coloured households in the SIHS 1993 data that resided in Kwazulu-Natal.16In both cases the difference is statistically significant using a standard t-test.
14

Remember that this is used as a proxy for household permanent income. Table 1, Panel
A presents the sample mean and quantiles of household expenditure. For 1998 two sets of
results are presented: those where we do not take into account the sample attrition and
those where we do take into account the sample attrition and weight each observation in
the sample by the inverse probability of being in the sample. The unweighted means and
quantiles are reported only to see the effect of the weighting and we do not use them for
inferential purposes. All subsequent discussion is based on the weighted estimates.
Some observations are worth noting. The mean per capita household expenditure in 1993
is (almost significantly) lower than the mean of the per capita household expenditure in
1998. However, the 10th, the 25th and the 50th percentiles of the expenditure distribution
have significantly17 declined in 1998 relative to 1993. On the other hand, the 90th percentile
has significantly increased from R592.47 in 1993 to R712.55 in 1998. Comparing this to
households at the 10th quantile, whose per capita expenditure has declined during the period
from R81.71 to R63.85, one can conclude that the spread of the distribution of household
expenditure has increased substantially. Panel B in the same Table confirms that inequality
in per capita household expenditure of Non-Whites in the province of Kwazulu-Natal over
the period 1993 - 1998 has increased. Three different measures are presented: the Gini
coefficient of inequality of per capita household expenditure, the standard deviation of the log
of per capita household expenditure and the coefficient of variation of per capita household
expenditure. Inequality has increased significantly during the period: for example the Gini
coefficient of inequality has increased from 0.4550 to 0.5495 over the period, a 21% increase,
which is significant by any measure. This basic result remains true irrespective of which
measure of inequality we use. The results on the extent of inequality are therefore consistent
with those obtained in Panel A.
We also compare the means of the variable of interest (per capita household expenditure)
and also the means of several household characteristics in the 1993 sample for (eventual)
attritors versus non-attritors. These are presented in Table 2. There are some interesting
17At the 5% level of significance. The test of significance of the change in unconditional quantiles is
performed using bootstrap with inverse probability weights to account for attrition in the 1998 sample.
15

differences between attritor and non-attritor households. What is particularly interesting is
that the average household expenditure is higher for attritor households compared to non-
attritor households. With this in mind, the comparison of weighted and unweighted 1998
estimates of the mean and quantiles of the expenditure distribution in Table 1 reveals that
our weighting scheme has corrected the estimates in the right direction.
4 Modeling the Probability of Attrition
The first step in the analysis is to link household characteristics to attrition probability. This
gives us the weights that are later used in the weighted quantile regressions. We consider a
standard logit regression where the dependent variable is:
ATTRITE =
⎧⎨⎩ 1 if the household was not re-interviewed in 1998
0 otherwise
The probability of attrition is assumed to depend on a set of 1993 characteristics. The
explanatory variables include household characteristics, community characteristics and a set
of variables that reflect survey quality in 1993. The coefficient estimates, their standard
errors and the marginal effect of each variable on attrition probability are presented in Table
3. This final specification is obtained by initially including a large number of household,
community and survey quality characteristics as explanatory variables and then dropping
those that turned out to be statistically not significant.
The household characteristics included (in the final specification) are log of per capita house-
hold expenditure in 1993 (LPCEXP93), two dummies for the highest level of education at-
tained by the household head in 1993 (HDEDUC2-93 and HDEDUC3-93)18, household size in
1993 (HHSIZE93) and the total number of children in the household in 1993 (TOTCHILD93).
The results, presented in Table 3, are quite interesting. Although Table 2 shows that the
18HDEDUC2-93 takes a value of one if the highest level of education attained by the household head in
1993 is more than primary school but less than secondary school and HDEDUC3-93 takes a value of one if
the highest level of education attained by the household head in 1993 is more than secondary school.
16

attritor households had higher per capita expenditure than the non-attritor households in
1993, our logit estimates show that keeping other characteristics such as education and size
constant, household expenditure actually has a negative and statistically significant effect
on the probability of attrition. All else constant, household size has a negative and statisti-
cally significant effect on the probability of drop-outs, implying that the KIDS survey was
more likely to re-interview larger households, a result that is similar to that obtained by
Maluccio (2004). This also implies that larger households were less likely to have moved,
consistent with the argument that moving costs are higher for larger households. The co-
efficient estimates of HDEDUC2-93 and HDEDUC3-93 are both positive implying that the
probability of attrition is significantly higher for household where the head has more than
primary schooling. Relative to the reference category (the head of the household having no
education or that the highest education attained by the household head is primary school-
ing), the probability of attrition is higher by 5.1 percentage points for households where
the highest education attained by the household head is more than primary school but less
than secondary school and the probability is higher by 9 percentage points where the highest
education attained by the household head is secondary schooling or higher. Finally, all else
constant, households with a greater number of children (aged 0 - 16) in 1993 are less likely
to attrite.
Turning to community level characteristics, the presence of a tarred road in the cluster
(TARROAD93) in 1993 and the presence of a clinic in the cluster in 1993 (CLINIC93) both
decrease the probability of dropouts in 1998. The marginal effects show that the presence
of a tarred road in the cluster in 1993 reduces the probability of drop-out in 1998 by 8.6
percentage points and the presence of a clinic in the cluster in 1993 reduces the probability
of drop-out in 1998 by 4.6 percentage points. Surprisingly the presence of a doctor in the
cluster in 1993 (DOCTOR93) actually increases the probability of the household dropping
out in 1998 (by 4.6 percentage points, statistically significant at the 5% level).
The accuracy of panel data depends heavily on the quality of the original fieldwork. It has
been argued that measures of quality of the original interview may help predict the success
of re-interview. We include one measure of the quality of the 1993 interview: whether the
17
questionnaire was verified by the supervisor (VERIFY93). The hypothesis is that prop-
erly verified questionnaires were more likely to have been accurately completed making re-
interviewing relatively easier. The marginal effects resented in Table 3 indicate that the
probability of dropouts is lower by 9.4 percentage points for households with verified ques-
tionnaires.
5 Results from Quantile Regressions
We now turn to the quantile regression estimates. We compute the estimates at the 10th(θ =
0.10), 25th(θ = 0.25), 50th(θ = 0.50), 75th(θ = 0.75) and 90th(θ = 0.90) quantiles. The de-
pendent variable is log per capita household expenditure. The explanatory variables included
in the regressions are the age and the squared of the age of the household head (AGEHD and
AGEHD2 respectively), a dummy to indicate whether the household head is female (FHH),
the highest level of education attained by the household head, which is accounted for by
including three dummies: HDEDUC1, HDEDUC2 and HDEDUC3. Here HDEDUC1 takes
a value of one if the highest level of education attained by the household head is primary
school, HDEDUC2 takes a value of one if the highest level of education attained by the
household head is more than primary school but less than secondary school and HDEDUC3
takes a value of one if the highest level of education attained by the household head is more
than secondary school. The reference category is that the household head has no education.
We also include as explanatory variables household composition variables: Total number of
children in the household, TOTCHILD, (individuals aged 0 - 17), the total number of work-
ing age adults, TOTADULT, (males aged 18 - 64 and females aged 18 - 59) and the total
number of elderly in the household, TOTELDER, (males aged 65 and above and females
aged 60 and above). The definition of working age adults and the elderly follows the official
definitions of the South African government. There is an official social pensions program
in South Africa and every male aged 65 or higher (officially classified as elderly male) and
every female aged 60 or higher (officially classified as elderly female) is eligible for social
18
pension (subject to a means test).19 In the South African context, living standards vary
widely depending on the race of the household and we include a race dummy BLACK to
capture this race effect. We also include two location dummies - RURAL to account for
rural residence and residence in former Natal (NATAL) to account for differences within the
Kwazulu-Natal province of South Africa. See Table 8 for a description of all the variables
used in the regression.
5.1 Are Attritor Households Different?
We first examine whether the households that subsequently leave the sample (the attritor
households) differ in their initial expenditure distribution compared to those households that
do not attrite. We compute the quantile regression estimates (at the 10th, 25th, 50th, 75th and
90th quantiles) for the SIHS 1993 sample but in this case we include the ATTRITE dummy
and a set of interaction terms where ATTRITE is interacted with each of the explanatory
variables. The non-interacted coefficients give the effects for the non-attritor households
while the interacted coefficients give us the difference between the attritor and non-attritor
households in 1993. The (non-interacted) coefficient estimates and the bootstrapped stan-
dard errors are presented in Table 4.20 The standard errors were computed by bootstrapping
with 100 replications. We also compute a F-test for the joint significance of ATTRITE and
the interaction terms - to test whether there are significant differences between the attritor
and the non-attritor sample. This is essentially a test of whether the coefficients of the set of
explanatory variables and the constant differ for those households that are going to attrite
versus those that are not going to attrite. The F-tests indicate that the attritor and the
non-attritor samples differ at the two extremes - at the 10th and the 90th quantiles but not
in the middle (at the 25th, 50th and 75th quantiles). This implies that quantile regressions
is the correct approach to examine living standards because it allows one to examine the
relationship between explanatory variables and the dependent variable at different points
on the expenditure distribution and it is clear that the relationship changes as one moves
19See Lund (1994) and Case & Deaton (1998) for more details on the social pensions program in South
Africa.20We do not present the difference estimates. They are available on request.
19

along the expenditure distribution. Simply looking at the average (as one would do us-
ing OLS) could result in incorrect conclusions regarding the difference between attritor and
non-attritor households. The coefficient estimates are as expected. The coefficient of FHH is
always negative and statistically significant, implying that female-headed households perform
poorly compared to male-headed households. The coefficient estimates of HDEDUC1, HD-
EDUC2 and HDEDUC3 are always positive and are in most cases statistically significant.21
Per capita expenditure is lower for Black households (compared to Indian households) and
for households residing in rural areas (compared to households residing in urban areas and
metropolitan regions) and is higher for households residing in former Natal (compared to
those residing in former homeland of Kwazulu). Not many of the difference estimates are
statistically significant. The results imply that a large part of what is driving the difference
between attritor and non-attritor households in 1993 is the difference in the educational
attainment of the household head.
5.2 Quantile Regression Estimates of Standard of Living
Tables 5 and 6 present the weighted quantile regression estimates (on the pooled sample) at
the 10th, 25th, 50th, 75th and 90th quantiles. However in this case we also include a TIME
(Year = 1998) dummy and also include as additional explanatory variables the interaction
all of the explanatory variables with the TIME dummy to account for possible changes in
slope (as opposed to only the intercept) over period 1993 - 1998. Remember that in this
case the non-interacted coefficients (presented in Table 5) give the effects for t = 1993 and
the interacted coefficients (presented in Table 6) give the difference between 1993 and 1998.
The F-tests presented in Table 5 show that the TIME dummy and the interactions of the
other explanatory variables with the TIME dummy are jointly statistically significant. This
essentially implies that there are statistically significant differences between the 1993 and
1998 samples and that standard of living, measured by log per capita expenditure, changed
significantly for households residing in Kwazulu-Natal during that period.
21The only exception is that the coefficient estimate of HDEDUC1 is not statistically significant at the
90th quantile.
20

We start by examining the non-interacted coefficient estimates (Table 5). Remember that
they correspond to the relationship between household characteristics and log per capita
expenditure in 1993. When discussing the marginal effect of a conditioning variable on
each quantile, we will also report if there is any statistically significant evidence that the
particular variable affects different parts of the distribution differently. These are based on
tests of equality of parameters across different quantiles.
Per capita household expenditure is lower for female-headed households relative to male-
headed households everywhere on the distribution. It also seems that, other things equal,
the incidence of female-headedness increases inequality as it decreases the lower quantiles
proportionally more than it decreases the upper quantiles. The coefficient estimates imply
that relative to male-headed households per capita household expenditure is lower for female-
headed households by 19.59%, 17.43%, 15.09%, 16.98% and 14.68% at the 10th, 25th, 50th,
75th and 90th quantiles respectively. Further note that the coefficient estimate of FHH is only
weakly significant at the 90th quantile. Despite this, there is no significant evidence in the
data to reject that FHH affects different quantiles equally. We conclude that, other things
equal, the incidence of female-headedness decreases the well-being of households uniformly
across the distribution.
In contrast, other things equal, an increase in educational attainment of the household head
increases household living standards by different proportions at different parts of the dis-
tribution. The magnitude of the coefficient estimates of the three educational attainment
dummies reveal some interesting patterns. First, there is a high premium on a high school
degree at every quantile. For example at the median (50th quantile), relative to house-
holds where the head of the household has no education, per capita expenditure is higher
by 15.81%, 26.06% and 92.81% when the highest education attained by the head of the
household is primary schooling, more than primary but less than secondary schooling and
secondary schooling or higher respectively, which shows a massive and highly significant pre-
mium for having finished high school, relative to households with heads with a lower level of
educational attainment. Second, the marginal effect of highest level of education attained by
the head of household on per capita expenditure is significantly different at different parts of
21

the distribution. This is most striking for the effect of high school completion. For example
at the 10th quantile, per capita household expenditure is higher by 108% when the highest
education attained by the household head is secondary schooling compared to 54% at the
90th quantile. On the other hand, the premium on primary school attained by the house-
hold head is statistically significant only for households at the lower end of the expenditure
distribution. For households at the upper end of the expenditure distribution (75th and 90th
quantiles) the effect of primary education is not statistically significant. These results show
that other things equal, education in general, and secondary education in particular, not
only improves the standard of living for all households but also decreases inequality because
it has a larger proportional effect on the left tail than on the right tail. Remember also that
very few households have heads who have attained secondary schooling or higher - 3.32% in
1993 and 4.51% in 1998.
Of course the main reason for this “low” education attainment stems from the skewed educa-
tional policies followed by the South African government during the apartheid era. A racially
segregated education system was possibly the central pillar propping up the apartheid regime.
The Bantu Education Act of 1953 centralised control of Black education and linked tax re-
ceipts from the Blacks to public expenditure on education for the Blacks. This obviously led
to extreme disparities in educational expenditures - for example in 1975, expenditure on an
average White child was nearly fifteen times the expenditure on an average Black child.22
With the Soweto Riots in 1976 and the boycotting of schools over the 1970’s and 1980’s,
the situation improved somewhat and more resources were allocated to the Black schools.
However, the disparities still continued to be fairly large. In addition, as a result of the
official policies implemented by the apartheid era South African government, Black families
were assigned to “homelands” based on their language, irrespective of where the household
had previously resided. Following the ‘Black Homeland Citizenship Act’ of 1970, the South
African government forced millions of Blacks to these “homelands” and every conceivable
effort was made to restrict movement between the homelands and the Union of South Africa.
Further there were restrictions on job eligibility and in particular Blacks could not be em-
ployed as skilled workers. It is no surprise that in 1993, the returns to education for the
22See for example Thomas (1996) and Case and Deaton (1999).
22
Blacks on the right tail of distribution were quite low.
The presence of an additional child or an additional working age adult in the household
generally reduces per capita household expenditure while the presence of an additional el-
derly member in the household does not have a statistically significant effect on per capita
household expenditure. Moreover, the evidence is compatible with the hypothesis that these
effects were the same everywhere on the distribution.
There is significant evidence that each of the two dummy variables BLACK and NATAL
affect different quantiles differently. Not surprisingly in 1993 South Africa, the race of
the household has a significant effect on the standard of living of the household. Black
households are worse off compared to Indian households at every quantile and interestingly
the difference continues to remain quite large at the upper end of the expenditure distribution
- for example compared to Indian households, the per capita household expenditure is lower
for Black households by 124% at the 10th quantile and this difference falls to 76% at the
90th quantile (remember this is keeping everything else, including education, constant). The
NATAL dummy is always negative and statistically significant implying that the per capita
household expenditure is always lower for households residing in former Natal, compared to
those residing in the former homeland province of Kwazulu. And the difference is significantly
larger at the low end of distribution relative to the upper tail. The result that households
residing in the former homeland province of Kwazulu appear to be generally doing better
than those residing in former Natal in 1993 is quite surprising at first. However once again it
is worth emphasising that the sample includes only Black and Indian households. Given the
laws that restricted residency and employment of the Non-Whites during the apartheid era,
the sample of households residing in Natal in 1993 possibly includes migrants who are either
unemployed or at the very best employed in low paying jobs. On the other hand households
in Kwazulu were typically more prosperous compared to Blacks residing in other homelands
both because of special government grants and transfers to Kwazulu and also the fact that
the region was more productive and fertile compared to other homelands. The estimated
coefficients of the only other variable, RURAL, shows that per capita household expenditure
is significantly lower for households residing in rural regions (compared to households residing
23

in urban and metropolitan regions), and this effect is statistically uniform on all quantiles.
The F-tests presented in Table 5 show that the TIME dummy and the interactions of the
other explanatory variables with the TIME dummy are jointly statistically significant for
all quantiles. This essentially implies that the relationship between the living standards
and household characteristics has significantly changed between 1993 and 1998 for Non-
White households residing in Kwazulu-Natal. It is therefore worth examining the difference
estimates, which are presented in Table 6. In a sense these are the more interesting results
since the primary aim of this paper is to examine how things have changed in South Africa
following the dismantling of apartheid.
While not many of the difference estimates are statistically significant, those that are tell
an interesting story. Basically the parameters that have significantly changed are the co-
efficients of the NATAL dummy in the median and lower quantiles, and the coefficients of
education of the household head in all but the lowest quantile. The coefficient of the NATAL
dummy has statistically significantly increased at the 10th, 25th and 50th quantiles. Given
that Table 5 shows that, all else constant, the (Non-White) residents of Natal were at a dis-
advantage relative to the residents of Kwazulu in 1993, these positive changes have improved
the position of the residents of Natal so that there is no significant difference between the
two in 1998 (the 1998 coefficients are the sum of corresponding coefficients in Tables 5 and
6). However, the rural-urban gap and the Black-Indian gap has remained unchanged. While
the Kwazulu-Natal difference can be totally attributed to the movement restrictions imposed
by the apartheid regime, the rural-urban gap and the Black-Indian gap were perhaps not a
direct consequence of apartheid, and therefore have persisted. The most striking change is
the significant increase in returns to secondary education in almost all parts of the distribu-
tion. Adding the corresponding parameters of Table 5 and Table 6, we see that the premium
for some high school education (HDEDUC2) has risen to more than 50% at all quantiles
other than the 10th quantile, and the premium to finishing high school (HDEDUC3) has
risen to more than 100%. Recall that the 1993 results showed that high school education
both increased living standards of all households and also decreased the inequality of living
standards. The 1998 results, in contrast, shows that the equality enhancing property of high
24

school education of household head is no longer there. This supports the hypothesis that the
significantly lower returns to education on the upper quantiles in 1993 was due to artificial
barriers in the labour market on career opportunities for skilled Non-White workers. In fact,
the hypothesis of the equality of the coefficients of each education attainment dummy at
different quantiles can no longer be rejected in 1998. The abolition of restrictions on job
eligibility seems to have equalised the return to education everywhere on the distribution.
Comparing the results of change in conditional distribution with those related to uncondi-
tional distribution of per capita expenditure reported in Table 1, the question arises that
if nothing other than the coefficient of NATAL has changed in the 10th percentile of condi-
tional distribution, then what explains the significant decrease in the 10th percentile of the
unconditional distribution of expenditure? The answer is that some of the aspects of the
distribution of household characteristics must have changed between 1993 and 1998. Going
back to Table 2, and comparing the characteristics of the households in 1998 sample with the
characteristics of the same households in 1993, we see that more of them have female heads
in 1998 relative to 1993, and the household size has increased substantially, mostly caused
by having more adults in the household. These characteristics all have negative effects on
quantiles, and it can partly explain why the standard of living at the 10th percentile has de-
teriorated. This partly reflects the changing composition of the household in South Africa.
There is some evidence that the extension of the social pension program to cover the Black
elderly has resulted in significant negative incentive effects for the working age adults in the
household. For example Bertrand, Mullainathan & Miller (2003), using the SIHS 1993 data,
find evidence increased unemployment of resident working age Black South Africans. They
argue that this is a result of the extension of the coverage of the social pension program
and sharing of this additional resource inflow within the household. We find similar effects
here. However a more detailed examination of the causes of households losing their male
heads and merging into bigger units between 1993 and 1998, though interesting, is beyond
the scope of this paper.
In closing, we compare these results to those obtained from the standard (unweighted) quan-
tile regressions on the pooled data set without controlling for attrition. The difference es-
25
timates (the time interacted coefficient estimates) are presented in Table 7. Although the
overall picture from this Table is similar to that of Table 6, the increase in returns to edu-
cation are underestimated, and more significant changes in effects of household composition
on quantiles are found. These discrepancies can be attributed to the unweighted estima-
tor not taking into account the systematic difference between the non-attritor and attritor
households. The upshot of all this is that when there is evidence to suggest that attrition is
indeed non-random (a result that is consistent with earlier work using the same data), one
has to take it into account in order to have confidence that the results are not tainted by
attrition bias.
6 Conclusion
The main purpose of this paper is to examine whether the dismantling of apartheid has
resulted in improvements in the standard of living of the vast majority of South Africans.
To analyse this issue, we use a panel data set from the Kwazulu-Natal province - the largest
province in the country and home to nearly a fifth of the population of the country. The
first wave of the data was collected in 1993, prior to the historic elections in 1994 (as a part
of the South Africa Integrated Household Survey) and the second wave was collected in 1998
(as a part of the Kwazulu-Natal Income Dynamics Study). Despite the best efforts of the
interview team to track down movers and re-interview them, the attrition rate in the panel
remained at around 16%. Using binomial logit regressions we find that household income
and size in 1993, several community characteristics and survey quality in 1993 significantly
affect the probability of dropouts as does the quality of the original survey.
The distribution of living standards is studied using quantile regressions. The use of quantile
regressions allows one to examine whether the relationship between a particular explanatory
variable and household expenditure is affected by the position of the household on the dis-
tribution and therefore does not require the assumption that the relationship between a
particular explanatory variable and the standard of living is constant across groups. How-
ever problems arise from the potential non-random sample attrition. Indeed we find that
26
the characteristics of the attritor households are different from the non-attritor households
at the two ends of the distribution. In analysing changes in living standards in South Africa
over the period 1993 - 1998, we therefore use a weighted quantile regression approach, which
corrects for the potential bias arising from non-random sample attrition. The approach used
requires that the process generating the missing data can be estimated but does not make
any assumptions about the distribution of the responses other than those imposed by the
quantile regression model. To derive the standard errors of quantile regression coefficients,
we use two levels of bootstrapping in order to account for the uncertainty caused by the
estimation of weights as well as the uncertainty in estimation of quantile parameters given
the weights.
Our results show that there has been a significant increase in the spread of the distribution
of household expenditure of the Non-White households residing in Kwazulu-Natal province.
We find that the stretch to the right of the upper tail of distribution can be attributed to
significant increase in returns to primary and high school education, while movement to the
left of the lower quantiles can be associated with the increase in the proportion of female
headed households and household size. It seems that the availability of well paying jobs
that were previously not available to Non-Whites has improved the standard of livings of
Black and Indian households at the upper end of the distribution, which is a positive sign.
However, the increased incidence of female headedness and the crowding of households has
dragged many households into poverty at the low end of the distribution, which is quite
alarming. Evidence also suggests that the significant difference between the standards of
living of Non-White residents of Natal and Kwazulu, that was caused by the restrictions on
the movements of Blacks between the two regions during the apartheid regime, is no longer
significant in 1998.
27

References
1. Alderman, H., Behrman, J. R., Kohler, H., Maluccio, J. A. & Watkins, S. C. (2001):
“Attrition in Longitudinal Household Survey Data: Some Tests for Three Developing
Country Samples”, Demographic Research, 5(4): 77-124.
2. Anderson, K. & Pomfret, R. (2000): “Living Standards During Transition to a Market
Economy: The Kyrgyz Republic in 1993 and 1996”, Journal of Comparative Eco-
nomics, 28(3): 502-523.
3. Ashenfelter, O., Deaton, A. & Solon, G. (1986): “Collecting Panel Data in Developing
Countries: Does it Make Sense?” Living Standards Measurement Study Working Paper
#23, World Bank.
4. Bertrand, M., Mullainathan, S. & Miller, D. (2003): “Public Policy and Extended
Families: Evidence from Pensions in South Africa”, World Bank Economic Review,
17(1): 27-50.
5. Buchinsky, M. (1995): “Estimating the Asymptotic Covariance Matrix for Quantile
Regression Models: A Monte Carlo Study”, Journal of Econometrics, 68: 303-338.
6. Buchinsky, M. (1998): “Recent Advances in Quantile Regression Models”, Journal of
Human Resources, 33(1): 88-126.
7. Buchinsky, M. (2001): “Quantile Regression with Sample Selection: EstimatingWomen’s
Return to Education”, Empirical Economics, 26(1): 87-114.
8. Carter, M. R. & May, J. (1999): “Poverty Livelihood and Class in Rural South Africa”,
World Development, 27(1): 1-20.
9. Case, A. & Deaton, A. (1998): “Large Cash Transfers to the Elderly in South Africa”,
Economic Journal, 108(450): 1330 - 1362.
10. Deaton, A. (1997): The Analysis of Household Surveys: A Microeconometric Approach
to Development Policy : World Bank.
28

11. Fitzgerald, J., Gottschalk, P. & Moffitt, R. (1998): “An Analysis of Sample Attrition
in Panel Data: The Michigan Panel Study of Income Dynamics”, Journal of Human
Resources, 33: 251-299.
12. Hausman, J. & Wise, D. (1979): “Attrition Bias in Experimental and Panel Data: The
Gary Income Maintenance Experiment”, Econometrica, 47: 455-474.
13. Heckman, J. (1979): “Sample Selection Bias as a Specification Error”, Econometrica,
47: 153-162.
14. Hsiao, C. (1986): Analysis of Panel Data: Cambridge University press, New York.
15. Jung, S. (1996): “Quasi-likelihood for Median Regression Models”, Journal of Ameri-
can Statistical Association, 91(251-257).
16. Klasen, S. (1997): “Poverty, Inequality and Deprivation in South Africa: An Analysis
of the 1993 SALDRU Survey”, Social Indicators Research, 41(1/3): 51-94.
17. Klasen, S. (2000): “Measuring Poverty and Deprivation in South Africa”, Review of
Income and Wealth, 46(1): 33-58.
18. Koenker, R. & Bassett, G. (1978): “Regression Quantiles”, Econometrica, 46(1): 33-
50.
19. Lipsitz, S. R., Fitzmaurice, G. M., Molenberghs, G. & Zhao, L. P. (1997): “Quan-
tile Regression Methods for Longitudinal Data with Drop-outs: Application to CD4
Cell Counts of Patients Infected with the Human Immunodeficiency Virus”, Applied
Statistics, 46(4): 463-476.
20. Lund, F. (1994): “State Social Benefits in South Africa”, International Social Security
Review, 46(1): 5 - 25.
21. Maitra, P. & Ray, R. (2003): “The Effect of Transfers on Household Expenditure
Patterns and Poverty in South Africa”, Journal of Development Economics., 71(1):
23-49.
29
22. Maluccio, J. (2004): “Using Quality of Interview Information to Assess Nonrandom
Attrition Bias in Developing Country Panel Data”, Review of Development Economics,
8(1): 91-109
23. Maluccio, J., Haddad, L. & May, J. (2000): “Social Capital and Household Welfare in
South Africa, 1993-98”, The Journal of Development Studies, 36(6): 54-81.
24. Maluccio, J., Thomas, D. & Haddad, L. (2003): “Household Structure and Child Well-
Being: Evidence from KwaZulu-Natal ”, in Quisumbing, A. (ed), Household Decisions,
Gender and Development: A Synthesis of Recent Research, IFPRI and Johns Hopkins
University Press: 121-130.
25. May, J. (Ed.). (2000): Poverty and Inequality in South Africa: David Philip Publishers,
Cape Town and Zed Books, London and New York.
26. May, J., Carter, M. R., Haddad, L. & Maluccio, J. (2000): “Kwazulu-Natal Income
Dynamics Study (KIDS) 1993 - 1998: A longitudinal Household Database for South
African Policy Analysis”: Centre for Social and Development Studies, Working Paper
No. 21, University of Natal, Durban.
27. Mwabu, G. & Schultz, T. P. (1996): “Education Returns Across Quantiles of the
Wage Function: Alternative Explanations for Returns to Education by Race in South
Africa”, American Economic Review, Papers and Proceedings, 86(2): 335-339.
28. Mwabu, G. & Schultz, T. P. (2000): “Wage Premiums for Education and Location
of South African Workers, by Gender and Race”, Economic Development & Cultural
Change, 48(2): 307-334.
29. Newey, W.K. & McFadden, D. (1994): “Large Sample Estimation and Hypothesis
Testing”, Chapter 36 in R.F. Engle & D. McFadden (eds.) Handbook of Econometrics,
Volume 4: 2111-2245.
30. Robins, J.M., Rotnitzky, A. & Zhao, L.P. (1995): “Analysis of Semiparametric Regres-
sion Models for Repeated Outcomes in the Presence of Missing Data”, Journal of the
American Statistical Association, 90: 106-121.
30

31. SALDRU. (1994): South Africans Rich and Poor: Baseline Economic Statistics: Cape
town: School of Economics, University of Cape town.
32. Thomas, D. (1996): “Education Across Generations in South Africa”, American Eco-
nomic Review, Papers and Proceedings, 86(2): 330-334.
33. Thomas, D., Frankenberg, E. & Smith, J. P. (2001): “Lost but Not Forgotten: Attrition
and Follow-Up in the Indonesia Family Life Survey”, Journal of Human Resources,
36(3): 556-592.
34. Wooldridge, J.M. (2002): “Inverse Probability Weighted M-Estimators for Sample
Selection, Attrition and Stratification”, Portuguese Economic Journal, 1: 117-139.
31

Table 1: Descriptive Statistics 1993 1998
(Unweighted) 1998
(Weighted) Panel A Per Capita Expenditure at
295.24 305.02 314.12 Mean (9.89) (12.71) 81.71 63.67 63.85 10th Quantile (2.46) (2.18) 121.20 99.14 99.92 25th Quantile (2.91) (3.19) 198.04 167.07 170.47 50th Quantile (5.33) (5.82) 328.79 321.43 333.52 75th Quantile (12.46) (14.14) 592.47 666.12 712.55 90th Quantile (24.25) (54.38)
Panel B
0.4550 0.5325 0.5495 Gini Coefficient of Inequality of Per Capita Expenditure (0.0133) (0.0137) 0.8007 0.9267 0.9618 SD of Log Per Capita Expenditure
(0.0213) (0.0233) 1.2172 1.3687 1.4191 Coefficient of Variation of Per Capita Expenditure
(0.1580) (0.0760) Notes: Standard errors are in parentheses below parameter estimates. Standard errors of quantiles and measures of inequality are bootstrap standard errors. Weighted estimates are computed using the inverse probability of being in the sample in 1998 as weights. Standard errors of the weighted estimators are calculated with the bootstrap in bootstrap procedure explained in the text so that they incorporate the uncertainty in the estimation of the weights as well. Unweighted estimates are reported only to see the effect of weights. We do not use the unweighted estimates for inferential purposes.
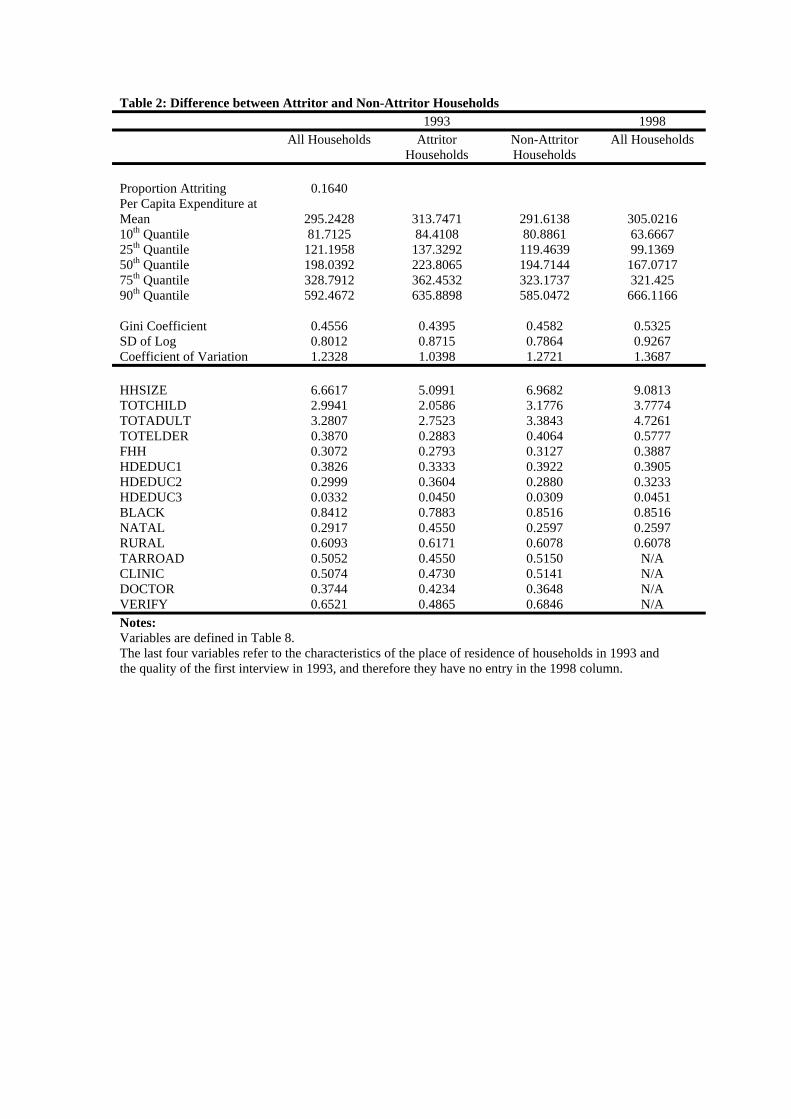
Table 2: Difference between Attritor and Non-Attritor Households 1993 1998
All Households Attritor Households
Non-Attritor Households
All Households
Proportion Attriting 0.1640 Per Capita Expenditure at Mean 295.2428 313.7471 291.6138 305.0216 10th Quantile 81.7125 84.4108 80.8861 63.6667 25th Quantile 121.1958 137.3292 119.4639 99.1369 50th Quantile 198.0392 223.8065 194.7144 167.0717 75th Quantile 328.7912 362.4532 323.1737 321.425 90th Quantile 592.4672 635.8898 585.0472 666.1166 Gini Coefficient 0.4556 0.4395 0.4582 0.5325 SD of Log 0.8012 0.8715 0.7864 0.9267 Coefficient of Variation 1.2328 1.0398 1.2721 1.3687 HHSIZE 6.6617 5.0991 6.9682 9.0813 TOTCHILD 2.9941 2.0586 3.1776 3.7774 TOTADULT 3.2807 2.7523 3.3843 4.7261 TOTELDER 0.3870 0.2883 0.4064 0.5777 FHH 0.3072 0.2793 0.3127 0.3887 HDEDUC1 0.3826 0.3333 0.3922 0.3905 HDEDUC2 0.2999 0.3604 0.2880 0.3233 HDEDUC3 0.0332 0.0450 0.0309 0.0451 BLACK 0.8412 0.7883 0.8516 0.8516 NATAL 0.2917 0.4550 0.2597 0.2597 RURAL 0.6093 0.6171 0.6078 0.6078 TARROAD 0.5052 0.4550 0.5150 N/A CLINIC 0.5074 0.4730 0.5141 N/A DOCTOR 0.3744 0.4234 0.3648 N/A VERIFY 0.6521 0.4865 0.6846 N/A Notes: Variables are defined in Table 8. The last four variables refer to the characteristics of the place of residence of households in 1993 and the quality of the first interview in 1993, and therefore they have no entry in the 1998 column.
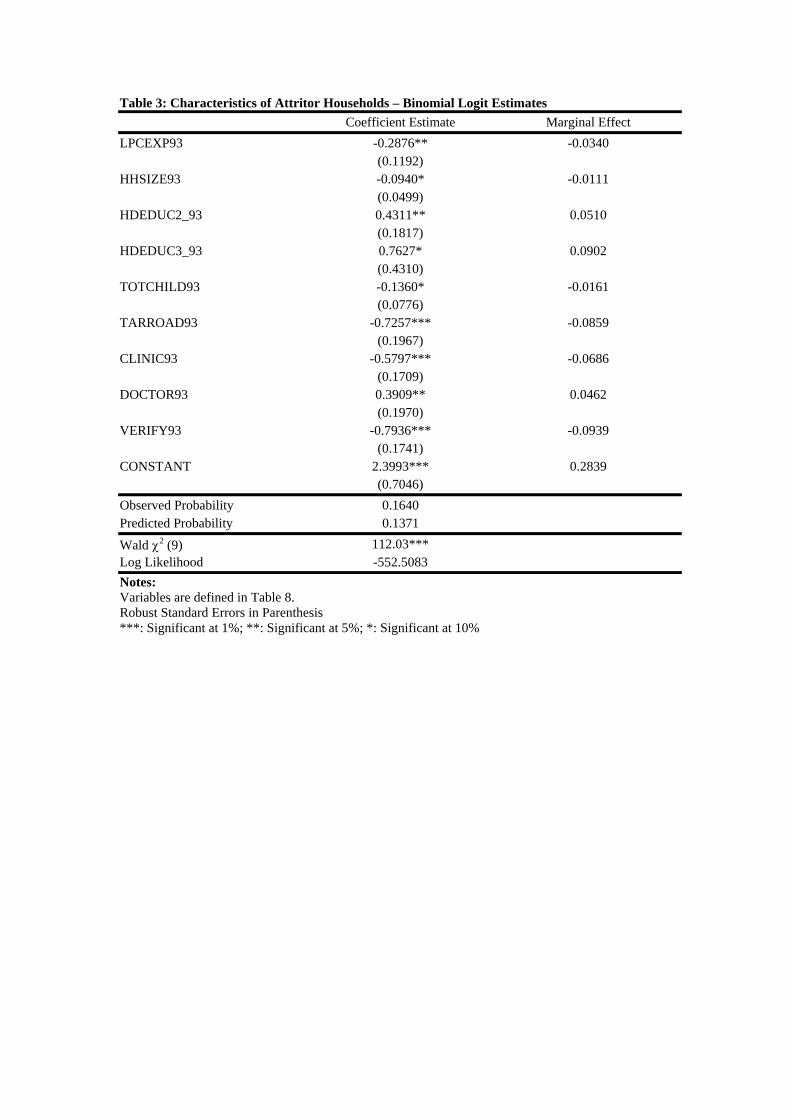
Table 3: Characteristics of Attritor Households – Binomial Logit Estimates Coefficient Estimate Marginal Effect LPCEXP93 -0.2876** -0.0340 (0.1192) HHSIZE93 -0.0940* -0.0111 (0.0499) HDEDUC2_93 0.4311** 0.0510 (0.1817) HDEDUC3_93 0.7627* 0.0902 (0.4310) TOTCHILD93 -0.1360* -0.0161 (0.0776) TARROAD93 -0.7257*** -0.0859 (0.1967) CLINIC93 -0.5797*** -0.0686 (0.1709) DOCTOR93 0.3909** 0.0462 (0.1970) VERIFY93 -0.7936*** -0.0939 (0.1741) CONSTANT 2.3993*** 0.2839 (0.7046) Observed Probability 0.1640 Predicted Probability 0.1371
Wald χ2 (9) 112.03*** Log Likelihood -552.5083 Notes: Variables are defined in Table 8. Robust Standard Errors in Parenthesis ***: Significant at 1%; **: Significant at 5%; *: Significant at 10%

Table 4: Are Attritor Households Different from Non-Attritor Households? Quantile Regression Using SIHS1993
θ = 0.10 θ = 0.25 θ = 0.50 θ = 0.75 θ = 0.90 AGEHD 0.0191*** 0.0164* 0.0009 -0.0225** -0.0179 (0.0072) (0.0094) (0.0108) (0.0105) (0.0133) AGEHD2 -0.0001** -0.0001 0.0000 0.0002* 0.0002 (0.0001) (0.0001) (0.0001) (0.0001) (0.0001) FHH -0.1885*** -0.1556*** -0.1344*** -0.0910* -0.1435** (0.0581) (0.0435) (0.0436) (0.0465) (0.0556) HDEDUC1 0.1580*** 0.1181** 0.1019** 0.1261** 0.1201 (0.0556) (0.0507) (0.0483) (0.0493) (0.0807) HDEDUC2 0.3533*** 0.3440*** 0.2776*** 0.2270*** 0.2755*** (0.0868) (0.0744) (0.0562) (0.0591) (0.0983) HDEDUC3 1.0648*** 0.9503*** 0.9252*** 0.8550*** 0.5620*** (0.1259) (0.1251) (0.1202) (0.0998) (0.1406) TOTCHILD -0.0916*** -0.0837*** -0.0928*** -0.0994*** -0.1107*** (0.0131) (0.0091) (0.0094) (0.0120) (0.0171) TOTADULT -0.0696*** -0.0705*** -0.0472*** -0.0574*** -0.0502*** (0.0182) (0.0149) (0.0125) (0.0110) (0.0170) TOTELDER 0.0249 0.0148 -0.0005 -0.0648 0.0060 (0.0550) (0.0426) (0.0338) (0.0451) (0.0744) BLACK -1.3792*** -1.0901*** -0.9419*** -0.8769*** -0.9647*** (0.1264) (0.1015) (0.0829) (0.1255) (0.1446) NATAL -0.8409*** -0.5928*** -0.5307*** -0.3861*** -0.3991*** (0.1111) (0.1000) (0.0752) (0.1003) (0.0836) RURAL -0.3080*** -0.2841*** -0.3603*** -0.2955*** -0.3691*** (0.0509) (0.0496) (0.0430) (0.0544) (0.0677) ATTRITE 1.8177* 1.0267 0.0799 -0.8738 -0.3770 (1.0047) (0.6837) (0.6764) (0.7909) (1.0586) CONSTANT 6.0694*** 6.1830*** 6.8233*** 7.6560*** 8.0146*** (0.2323) (0.2810) (0.2907) (0.3089) (0.3152) F Test for Attrition
2.01** 1.08 0.73 1.15 1.69*
Notes: Variables are defined in Table 8. Bootstrapped Standard Errors in Parenthesis Bootstrapped Standard Errors obtained with 100 replications ***: Significant at 1%; **: Significant at 5%; *: Significant at 10%

Table 5: Weighted Quantile Regression Estimates θ = 0.10 θ = 0.25 θ = 0.50 θ = 0.75 θ = 0.90 AGEHD 0.0108 0.0197 0.0136 -0.0079 -0.0164 (0.0204) (0.0151) (0.0144) (0.0146) (0.0189) AGEHD2 -0.0001 -0.0002 -0.0001 0.0001 0.0001 (0.0002) (0.0001) (0.0001) (0.0001) (0.0002) FHH -0.1959** -0.1743** -0.1509** -0.1698** -0.1468* (0.0872) (0.0783) (0.0572) (0.0648) (0.0806) HDEDUC1 0.2034** 0.1501* 0.1581* 0.0615 0.0019 (0.0971) (0.0786) (0.0835) (0.0882) (0.1030) HDEDUC2 0.3346** 0.2439** 0.2606** 0.1314 0.0585 (0.1371) (0.1027) (0.1003) (0.1114) (0.1276) HDEDUC3 1.0785*** 0.7623*** 0.9281*** 0.6730*** 0.5378*** (0.2704) (0.1838) (0.1609) (0.1446) (0.1992) TOTCHILD -0.0623** -0.0424* -0.0598*** -0.0846*** -0.1095*** (0.0280) (0.0259) (0.0143) (0.0125) (0.0152) TOTADULT -0.0687** -0.0650*** -0.0639*** -0.0411* -0.0556** (0.0287) (0.0207) (0.0203) (0.0247) (0.0252) TOTELDER -0.0869 -0.0829 -0.0812 -0.1157* -0.0826 (0.0744) (0.0793) (0.0724) (0.0681) (0.0793) BLACK -1.2413*** -0.9545*** -0.8461*** -0.6708*** -0.7600*** (0.1844) (0.1085) (0.1050) (0.1566) (0.1271) NATAL -0.7333*** -0.5767*** -0.4871*** -0.3287** -0.3432*** (0.1463) (0.0761) (0.0921) (0.1254) (0.1017) RURAL -0.3749*** -0.4271*** -0.4026*** -0.4622*** -0.4786*** (0.1048) (0.0795) (0.0839) (0.0922) (0.0890) CONSTANT 6.1073*** 6.1920*** 6.4541*** 7.2725*** 7.9920*** (0.7864) (0.5433) (0.5076) (0.5977) (0.6841) F-Test for Joint Significance of Time Interactions
3.88*** 5.04*** 5.90*** 5.06*** 5.44***
Notes: Variables are defined in Table 8. Bootstrapped Standard Errors in Parenthesis Bootstrapped Standard Errors obtained with 200*100 replications. See Text for Details ***: Significant at 1%; **: Significant at 5%; *: Significant at 10% Also included are a set of interaction terms with YEAR = 1998. These difference estimates are presented in Table 6.

Table 6: Difference Estimates from the Weighted Quantile Regressions θ = 0.10 θ = 0.25 θ = 0.50 θ = 0.75 θ = 0.90 TIME (YEAR = 1998) -0.6851 -0.4288 -0.9014** -0.8979** -1.5321*** (0.6760) (0.4293) (0.4044) (0.4361) (0.5063) AGEHD -0.0057 -0.0065 0.0195 0.0184 0.0324 (0.0239) (0.0186) (0.0184) (0.0198) (0.0257) AGEHD2 0.0001 0.0002 -0.0001 0.0000 -0.0001 (0.0002) (0.0002) (0.0002) (0.0002) (0.0002) FHH 0.0738 0.0058 0.0026 0.0475 0.0583 (0.1063) (0.0981) (0.0738) (0.0802) (0.1051) TOTCHILD -0.0366 -0.0005 0.0043 0.0241 0.0579*** (0.1278) (0.0281) (0.0181) (0.0151) (0.0202) TOTADULT 0.1082 -0.0018 -0.0013 -0.0061 0.0006 (0.1809) (0.0242) (0.0231) (0.0271) (0.0293) TOTELDER 0.0689 -0.0446 -0.0666 -0.0006 -0.0176 (0.3497) (0.0921) (0.0818) (0.0762) (0.1004) HDEDUC1 0.0157 0.0415 0.0581 0.1891* 0.2644* (0.0310) (0.1040) (0.1043) (0.1071) (0.1405) HDEDUC2 0.0145 0.3916*** 0.3618*** 0.4758*** 0.5160*** (0.0337) (0.1316) (0.1198) (0.1336) (0.1707) HDEDUC3 -0.0712 0.5846*** 0.2661 0.4860*** 0.4937* (0.0917) (0.2227) (0.1873) (0.1806) (0.2562) BLACK 0.2848 -0.0298 -0.1325 -0.3010 -0.3988** (0.2353) (0.1553) (0.1459) (0.1920) (0.1914) NATAL 0.6543*** 0.3580*** 0.3016*** 0.1432 0.2329 (0.1811) (0.0990) (0.1230) (0.1486) (0.1536) RURAL -0.0176 0.0259 0.0342 0.0810 0.1993 (0.1356) (0.1043) (0.0988) (0.1086) (0.1297)
Notes: Variables are defined in Table 8. Bootstrapped Standard Errors in Parenthesis Bootstrapped Standard Errors obtained with 200*100 replications. See Text for Details ***: Significant at 1%; **: Significant at 5%; *: Significant at 10%
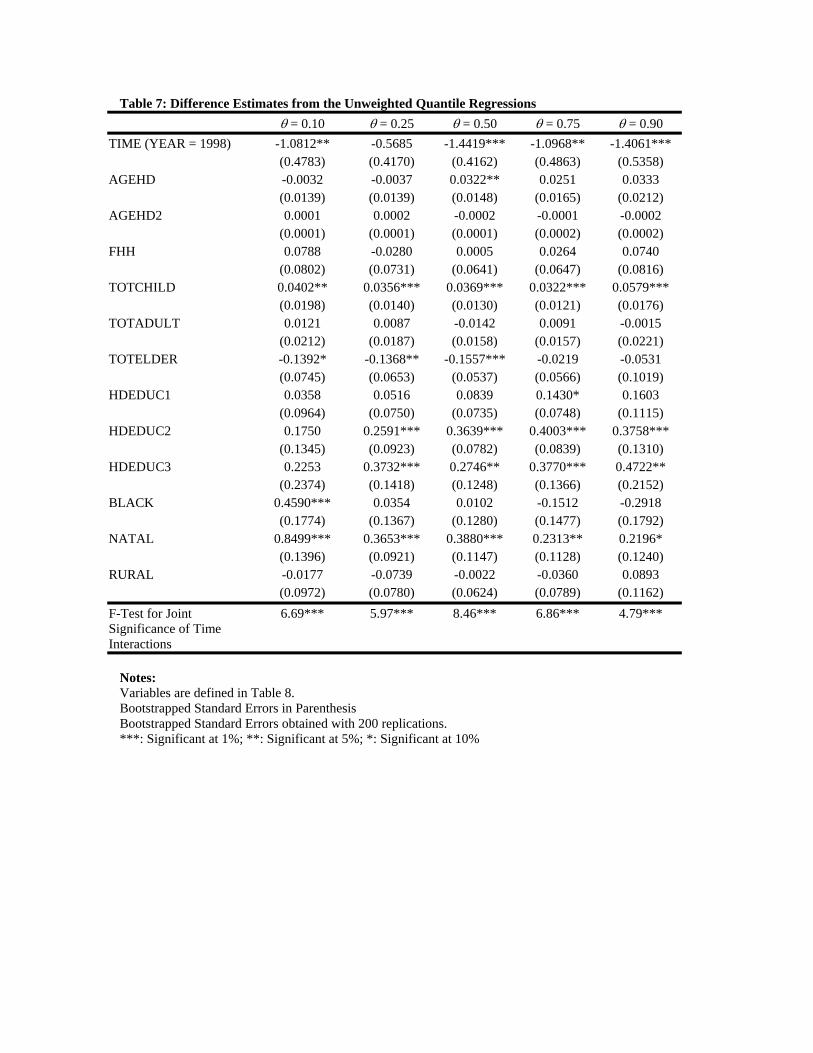
Table 7: Difference Estimates from the Unweighted Quantile Regressions θ = 0.10 θ = 0.25 θ = 0.50 θ = 0.75 θ = 0.90 TIME (YEAR = 1998) -1.0812** -0.5685 -1.4419*** -1.0968** -1.4061*** (0.4783) (0.4170) (0.4162) (0.4863) (0.5358) AGEHD -0.0032 -0.0037 0.0322** 0.0251 0.0333 (0.0139) (0.0139) (0.0148) (0.0165) (0.0212) AGEHD2 0.0001 0.0002 -0.0002 -0.0001 -0.0002 (0.0001) (0.0001) (0.0001) (0.0002) (0.0002) FHH 0.0788 -0.0280 0.0005 0.0264 0.0740 (0.0802) (0.0731) (0.0641) (0.0647) (0.0816) TOTCHILD 0.0402** 0.0356*** 0.0369*** 0.0322*** 0.0579*** (0.0198) (0.0140) (0.0130) (0.0121) (0.0176) TOTADULT 0.0121 0.0087 -0.0142 0.0091 -0.0015 (0.0212) (0.0187) (0.0158) (0.0157) (0.0221) TOTELDER -0.1392* -0.1368** -0.1557*** -0.0219 -0.0531 (0.0745) (0.0653) (0.0537) (0.0566) (0.1019) HDEDUC1 0.0358 0.0516 0.0839 0.1430* 0.1603 (0.0964) (0.0750) (0.0735) (0.0748) (0.1115) HDEDUC2 0.1750 0.2591*** 0.3639*** 0.4003*** 0.3758*** (0.1345) (0.0923) (0.0782) (0.0839) (0.1310) HDEDUC3 0.2253 0.3732*** 0.2746** 0.3770*** 0.4722** (0.2374) (0.1418) (0.1248) (0.1366) (0.2152) BLACK 0.4590*** 0.0354 0.0102 -0.1512 -0.2918 (0.1774) (0.1367) (0.1280) (0.1477) (0.1792) NATAL 0.8499*** 0.3653*** 0.3880*** 0.2313** 0.2196* (0.1396) (0.0921) (0.1147) (0.1128) (0.1240) RURAL -0.0177 -0.0739 -0.0022 -0.0360 0.0893 (0.0972) (0.0780) (0.0624) (0.0789) (0.1162) F-Test for Joint Significance of Time Interactions
6.69*** 5.97*** 8.46*** 6.86*** 4.79***
Notes: Variables are defined in Table 8. Bootstrapped Standard Errors in Parenthesis Bootstrapped Standard Errors obtained with 200 replications. ***: Significant at 1%; **: Significant at 5%; *: Significant at 10%

Table 8: Variable Definition Variable Description PCEXP Per Capita Household Expenditure LPCEXP Log Per Capita Household Expenditure LPCINC Log Per Capita Household Income AGEHD Age of Household Head AGEHD2 Age of Household Head Squared FHH = 1 if Household Head is Female HDEDUC1 = 1 if Highest Education Attained by Household Head is Primary School HDEDUC2 = 1 if Highest Education Attained by Household Head is Middle School HDEDUC3 = 1 if Highest Education Attained by Household Head is Secondary School or
higher TOTCHILD Total Number of Children in the Household (Individuals aged less than 18) TOTADULT Total Number of Working Age Adults in the Household (Males aged 18 - 64,
Females aged 18 - 59) TOTELDER Total Number of Elderly in the Household (Males 65 and higher, Females aged
60 and higher) BLACK = 1 if Household is Black NATAL = 1 if Household is resident of former Natal RURAL = 1 if the Household resides in a rural area TIME = 1 if 1998 ATTRITE = 1 if the Household was not re-interviewed in 1998 LPCEXP93 Log Per Capita Household Expenditure in 1993 HHSIZE93 Household Size in 1993 VERIFY93 = 1 if questionnaire was verified by a supervisor in 1993 TARROAD93 = 1 if there is tarred road in the cluster in 1993 CLINIC93 = 1 if there is a clinic in the cluster in 1993 DOCTOR93 = 1 if there is a doctor in the cluster in 1993 HDEDUC1-93 = 1 if Highest Education Attained by Household Head in 1993 is Primary
School HDEDUC2-93 = 1 if Highest Education Attained by Household Head in 1993 is Middle
School HDEDUC3-93 = 1 if Highest Education Attained by Household Head in 1993 is Secondary
School or higher TOTCHILD93 Total Number of Children in the Household in 1993 (Individuals aged less than
18)