THE EFFECT OF GRADED HOMEWORK IN A HIGH SCHOOL …
58
THE EFFECT OF GRADED HOMEWORK IN A HIGH SCHOOL CHEMISTRY CLASSROOM FOCUSED ON STUDENTS’ LONGTERM RETENTION, STUDY SKILLS, AND CONFIDENCE IN THE CONTENT by Cheryl C. Brenner A professional paper submitted in partial fulfillment of the requirements for the degree of Master of Science in Science Education MONTANA STATE UNIVERSITY Bozeman, Montana July 2018
Transcript of THE EFFECT OF GRADED HOMEWORK IN A HIGH SCHOOL …

THE EFFECT OF GRADED HOMEWORK IN A HIGH SCHOOL
CHEMISTRY CLASSROOM FOCUSED ON STUDENTS’
LONGTERM RETENTION, STUDY SKILLS, AND
CONFIDENCE IN THE CONTENT
by
Cheryl C. Brenner
A professional paper submitted in partial fulfillment
of the requirements for the degree
of
Master of Science
in
Science Education
MONTANA STATE UNIVERSITY
Bozeman, Montana
July 2018

©COPYRIGHT
by
Cheryl C. Brenner
All Rights Reserved

ii
TABLE OF CONTENTS
1. INTRODUCTION AND BACKGROUND ........................................................1
2. CONCEPTUAL FRAMEWORK ........................................................................3
3. METHODOLOGY ..............................................................................................9
4. DATA AND ANALYSIS ..................................................................................18
5. INTERPERTATION AND CONCLUSION .....................................................34
6. VALUE ..............................................................................................................38
REFERENCE CITED ............................................................................................40
APPENDICES .......................................................................................................42
APPENDIX A Institutional Review Board Exemption .............................43
APPENDIX B Pre and Post Questionnaires ..............................................45
APPENDIX C Unit Surveys ......................................................................48
APPENDIX D SHS Grading Rubric..........................................................51

iii
LIST OF TABLES
1. Male to Female Population in Chemistry Classes Table ..................................10
2. Data Collection Matrix .....................................................................................17
3. Representation of the Number (Percentage) of Student Responses to Each
Statement in the Pre and Post Questionnaires........................................................19
4. Statistical Analysis of Graded and Non-graded Homework Assessments ........29
5. Student Unit Test Scores Comparing Graded Homework Units to Non-Graded
Homework Units ....................................................................................................32
6. Normalized Gain per Unit ..................................................................................33

iv
LIST OF FIGURES
1. Representation of Percentage of Student Responses to Likert Statements in the
Pre and Post Questionnaires...................................................................................20
2. Pre and Post Questionnaire Responses to “What makes homework
Meaningful?” .........................................................................................................23
3. Post Questionnaire Results in Regards to Whether or Not Homework Should be
Graded ....................................................................................................................23
4. Overall Average Response in Percentage to “Did you complete your homework
for this unit?” .........................................................................................................25
5. Overall Average Response in Percentage to “Does homework help me become
a more independent learner?” ................................................................................26
6. Response by Unit in Percentage to “Does homework help me improve my
study skills?” ..........................................................................................................27
7. Overall Average Response in Percentage to “Does homework make me a more
efficient test taker?” ...............................................................................................28
8. The Disbursement of Student Assessment Scores by Graded vs. Non-graded
Homework Units ....................................................................................................29

v
ABSTRACT
One part of being a high school science student (or a high school student
in general) is completing homework. Homework has become futile in many
schools around the United States as districts push towards “No Homework”
policies. It seems that high school science students are not benefitting from this
movement; but instead are achieving lower assessment scores, losing their
confidence in test taking, and are lacking independent study skills. During my
Action Research project I investigated whether graded homework not only had an
impact on students understanding of the content, but, also investigated students’
attitudes towards homework, study skills, and confidence during tests based on
whether or not homework was graded. Throughout the first semester of chemistry,
students were assigned homework that was graded every other unit, allowing for a
direct comparison on how graded homework affected students learning. Test
scores, percentage of homework completed, unit surveys, and final assessment
scores were used to determine whether or not grading homework improved unit
test scores, independent study skills, and long-term retention of each standard
taught. The results showed that graded homework, with feedback, showed an
increase in students unit assessment scores, especially for those in the “below
proficient” grade level. Unit surveys and questionnaires strongly indicated that
students felt more confident on tests, felt they were better independent learners,
and had stronger study skills when they were graded on their homework as a
result of feeling the necessity to complete it. Overall, it was shown in my results
that when homework was graded more students choose to complete it, and
therefore, performed better on unit tests and would potentially retain content
longer as observed in their final assessment scores.

1
INTRODUCTION AND BACKGROUND
Summit High School is a public high school in Breckenridge, Colorado that serves
the entire population of Summit County. The school is composed of grades 9 to 12 with a
population of approximately 900 students as the number changes significantly throughout the
year. Summit County is a transient community, with people moving in and out based on
seasonal work, seasonal activities (like competitive skiing), and other lifestyle choices. There
is a clear distinction between the upper and lower classes with few that fall into the middle.
The student population is made up of 67% white, 28% Hispanic, 3% two races, and under
2% Pacific Islander, American Indian, African American, or Asian. The male to female ratio
is 51 to 49%. Students eligible for free or reduced lunch include 27.2% of total students
present and rising as our community grows.
Summit School District is part of the International Baccalaureate Diploma
Programme (IB Program) and follows standards-based grading. Together these systems
encourage students at Summit High School (SHS) to apply themselves in advanced classes to
achieve an IB Diploma while following standards-based grading, where students are only
graded on summative assessments. Since homework does not count as a formative
assessment, it is not graded, and therefore, students often choose not to complete it, thus
creating a “no homework” culture at SHS. Students have begun to disvalue homework and
this has become a notable issue, especially for the math department and teachers of the
upper-level science courses (i.e., chemistry, physics, Diploma Programme (DP) Biology, DP
Environmental Systems and Sustainability, etc.). Recently, a concern for the lack of
homework completion has grown with complaints from the AP World History teachers and

2
English teachers who assign readings for homework. It seems that more and more secondary
teachers are in concurrence that homework is actually valuable to students learning, but at
SHS homework is not seen this way and has resulted in students showing up unprepared for
class, struggling to keep up with content, and lacking independent study skills.
The potential effect of no homework provokes a number of questions, for example,
are students learning as much content without doing homework? Are they getting enough
practice to master the content? Do teachers have to spend more time reviewing in class? Are
students feeling more or less prepared for class and exams without homework? Would they
feel more prepared for exams with it? There are many debates going on right now in schools
across the US about homework use, and it caused me to wonder what was best for our high
school students? Both proponents and opponents of homework have made their cases known,
for example, proponent studies are describing homework as, “An important extension of in-
school opportunities to learn” (Good & Brophy, 2003, p. 393). While the opponents hold a
strong case against homework that only applies to elementary level students, “…there's
absolutely no proof that homework helps elementary school pupils learn more or have greater
academic success” (Bennett & Klash, 2006, p. iv).
Research leads me to believe that an appropriate amount of homework returned with a
grade and feedback would result in a better learning outcome for secondary level students.
My action research question was formulated from my reflection, and was focused towards
my three chemistry classes. My question was: "How does graded science homework affect
students’ content mastery, study skills, and retention over a semester of chemistry?” The goal
was to determine if graded homework would encourage students to do work outside of class,

3
have a better understanding of content taught in class, and increase study habits for students.
This study also looked into whether or not students’ long-term retention of content increases
with graded homework and if homework created more confident and accurate test takers. The
sub-questions pertaining to this were:
1. How will graded homework effect students study skills and independent learning
skills outside of class?
2. What impact does graded homework have on students’ final assessment scores
and long-term retention of the content taught in chemistry class?
3. How does graded homework impact students’ ability to become more confident
and accurate test takers?
4. How does assigning graded homework influence me as a teacher?
CONCEPTUAL FRAMEWORK
During my literature review, I found that there is an enormous amount of research
that has been completed over the past two decades on whether or not homework is beneficial
to students. Much of this research has been focused on primary education and evidence has
indicated homework is not beneficial to primary students. As my research project focused on
secondary students, it was discovered that there is much less research being done at this
grade level. However, with the data and evidence gathered in my research, I believe the study
provided confirmation that an appropriate amount of homework given with value, meaning,
and feedback will result in a better learning outcome for the secondary level student. The
publications I reviewed provided many theories and ideas on how to best implement
homework, the benefits of homework, theories providing guidelines on how much homework

4
should be assigned, how to create meaningful and purposeful homework assignments, and
finally, how to encourage students to complete their homework.
Assigning students an appropriate amount of homework each night can increase their
long-term retention of the content. According to Maltese, Tai, & Fan (2012) when an
appropriate amount of homework is assigned it has been shown to increase standardized test
score by 1.8 to 3 points higher than the average score. This was also reflected in students
SAT scores, for example, as a result of completing only 30 to 60 minutes of homework a
night students performed 40 points higher in math. “Without controlling for other factors,
these results indicate that students completing one to two hours of daily homework earn the
best grades and highest test scores” (Maltese, Tai, and Fan, 2012, p. 61). As many school
districts are doing away with homework altogether, they could be hurting students’ long-term
retention and test scores when it comes to state and government assessments.
This is supported with the National Report Card, a standardized test comparable to
the SAT or ACT that is given to students across America in diversified towns and cities. In
2015,’s Anya Kamenetz (2016) interviewed one of the National Report Cards Measurement
Experts, Andrew Ho, and found that the test showed scores had decreased by one point since
the previous test given two years earlier in 2013. Ho explained that the lowest test takers are
getting lower scores while the highest performers are getting higher scores in comparison to
previous years data. Only 40% of students are achieving scores that show they are ready for
life beyond high school. Summit High School is seeing similar data in the various
standardized tests given at SHS, which included the Colorado Measurement of Academic
Success (CMAS), the Northwest Evaluation Association in Math and English (NWEA), and

5
the Scholastic Aptitude Test (SAT). This is scary because these scores are low and show
students are not ready for life beyond high school. “… in 2015 the nationwide high school
graduation rate was 82%, not 40%. That leaves a potentially large group of kids who earned a
diploma but who weren't ready to succeed in college” (Kamenetz, 2016).
It seems that homework could be beneficial in the long run, but we are hearing
students say they feel that they are overworked and parents are agreeing with this, which
supports the no homework culture that has swept the nation. David Skinner, author of
Homework Wars, (Skinner 2014) investigated various studies that have lead Americans to
believe their children were being overworked with too much homework. His research found
that a number of these studies were skewed by unreliable sources to support the writer or
researchers view points. According to the 2014 Brown Center Report on America Education,
the amount of time students of any age spend on homework each night has not changed
significantly since 1984. The Brown Center Report references the National Assessment of
Educational Progress survey where students were asked how much time they spent on
homework yesterday and how often they thought they had received a “heavy load” of
homework. They learned that no matter how the question was asked, the results were the
same, i.e., students are not overburdened with homework. “The percentage of students with
no homework has increased from 22% to 27%... Also note that the percentage of 17-year-
olds who had homework but did not do it was 11% in 2012, the highest for the three NAEP
age groups” (Loveless, 2014). This means that about one-third of seventeen year olds (38%)
did no homework in 2012 which is similar to the 33% in 1984. In reference to the students
who were assigned more than two hours of homework, the amount has lingered in the 10 to

6
13% range, and so there is no evidence of significant change. As students stop doing
homework, test scores drop and parents are not happy. It seems that parents want the best of
both worlds; their students to achieve high grades and to have free time with less stress.
There’s a direct correlation between students’ grades when homework is completed and
when it is not. Skinner (2014) found on average high school students who do homework have
an average of 19% gain in their grades. It seems students need to work for what they want (or
what parents want), and this just might mean completing homework.
It is becoming clear that there are several key benefits to doing homework. But not all
homework is good homework, for example, students should be completing homework
assignments with fidelity, which can be done by creating homework assignments that give
students a feeling of purpose. It is now known that coloring maps, filling out repetitive
worksheets, and outlining chapters in textbooks are activities completed mindlessly by
unengaged students. Teachers need to set higher expectations and create assignments that
encourage students to think. There are different ways this can be done and Dougherty, author
of Assignments Matter, (2012) proposed how an assignment should best be created. She
suggests creating an assignment with a prompt, a rubric, and a product. In order to create a
successful and meaningful assignment in this format, Dougherty (2012) provided gives some
steps to follow: “1. Identify content, focus standards, and skills, 2. Determine a product, 3.
Identify demands and qualities, 4. Write a prompt, 5. Write a rubric, 6. Do your assignment,
7. Make an instructional plan” (p. 41). Creating a good homework assignment is not an easy
task for teachers but if we want students to get something from our assignments we have to
put in some work as well. This is backed by Marzano (2007) who said “… it is not time per

7
se that has a positive effect on student achievement. Rather, it is the proportion of homework
completed that appears to produce the strongest achievement gains” (Marzano, 2007, p. 69).
The goal is to create homework assignments that students will complete.
Once engaging homework has been created, it is important to grade it and give
feedback. Studies show that when homework is graded there is a 28% gain compared to the
11% gain when homework is not graded. When teachers give comments and feedback the
student percentile gain is 30% (Marzano, 2007). It is important to give students feedback on
homework in order to give it value and to help students achieve mastery of the content. These
steps were taken into account when creating homework assignment for the students
participating in my Action Research project.
Giving students homework they are more likely and willing to do is one step towards
good homework assignments, the next is to determine how much to give. There is a lot of
information out there showing how homework was on the rise throughout the 1990s. It may
appear that more homework was given in the 90s but it is believed that more students were
actually completing their homework and parents started preparing their children for school at
younger ages. In contrast, in 2014 it was reported:
Only about one-third of American college freshman said they'd spent more than one
hour a night on homework as high school seniors. As the Brookings report comments,
such a homework load makes American high school students look underworked
compared with their peers in other developed nations (Skinner, 2014, p. 59).
In Classroom Instruction that Works, Marzano, Pickering, and Pollock (2001)
explained how research showed students who were assigned, on average, 60 - 120 minutes of
homework per day at the high school level will achieve, on average, an 18-percentile gain.

8
Finally, students and parents should be informed on what their role is when it comes
to doing homework. Parents should know that their role is to encourage students, not
complete their work for them. It is advised that parents should not let their students work on
homework late into the night or struggle on a single problem for too long. This leaves
students tired and frustrated. Leaving questions incomplete allows the teacher to know where
their students are struggling. As for students, they should have an understanding of the
purpose of the assignment and should set a goal for themselves. Marzano, Pickering, and
Pollock (2001) encourage teachers to articulate the purpose of the homework assignment,
meaning the teacher should explain whether the homework is either used to practice concepts
or to prepare/expand on content (Marzano, Pickering, & Pollock, 2001). These insights can
help increase the success rate of homework completion.
While all of the information above has helped build an understanding of how to create
meaningful and successful homework assignments, there is also valuable research that helps
create the methods for conducting research. A final take away for me was how to create a
well-written and informational survey or questionnaire. The Homework Process Inventory
(HPI), described in Homework Attitudes and Achievement by Cooper, Lindsay, Nye,
Greathouse, (1998) is a survey used to ask teachers, students, and parents about homework. It
provides examples of different types of questions and scales used on the HPI. The types of
questions used include; informative questions, Likert scale questions, and short answer
questions. The HPI shows how to use these types of questions together, and also explains that
that order of questions is important. The questionnaire started with basic questions such as,
grade, subject, age, etc. and was followed by questions pertaining to the participants’ general

9
feelings towards homework. This portions included these questions, “‘In general, how do you
feel about homework?’… A second question asked ‘Do you think homework increases or
decreases students’ interest in school?’” (p. 74). These questions were answered with a Likert
scale. These styles of questioning were implemented into the methodology of my action
research.
Much of the data and research gathered has strongly indicated that a reasonable
amount of meaningful homework is benefitting students at the high school level. Students
given homework assignments that were well thought out by the teachers and written to
benefit student learning were found to increase grades and improve scores on standardized
testing. Kohn author of the book, The Homework Myth: Why Our Kids get Too Much of a
Bad Thing, states: “There is no evidence to demonstrate that homework benefits students
below high school age.” (Kohn, 2006, p. ii). As a matter of fact, Lillydahl (1990) found that
students’ high school grade point average increased when no more than 13.5 hours of
homework was given in a week. Another study by DeSimone (2006) supported this but
determined homework should not exceed 15 hours per week before grade point averages
were affected negatively. Though much of the research against homework is valid, it is only
valid for younger students. Research shows the effects of homework at the high school level
are positive and should encourage the use of engaging homework with feedback.
METHODOLOGY
Demographics
Summit High School (SHS) is on a partial block schedule meaning students attend
each class for two 80-minute class periods and one 52-minute class period each week. I have

10
three sections of chemistry: periods one, two, and five. All three classes were subjects for my
action research. Each student was given the opportunity to participate in the action research
project. The demographics of the classes are as follows; there were a total 72 students, 41
female (56.94%) and 31 males (43.06%). A breakdown by class can be seen in table one. The
classes were made up of 34 tenth graders (47.22%), 37 eleventh graders (51.39%), and one
senior (1.39%). There was not much diversity amongst the students, where eleven were
Hispanic (15.23%), one was Pacific Islander (1.39%), two had chosen not to disclose their
ethnicities (2.78%), and 58 were Caucasian (80.56%). For the most part, these were the
“middle” or “average” students at SHS. There were seven (9.72%) gifted and talented
students in these classes. There were five students with IEP’s or 504’s (6.94%) and one ELL
student (1.39%). Though this changed a little throughout the semester as students lives
changed with family moving, expulsion, and studying abroad opportunities.
Table 1
Male to Female Population in Chemistry Classes Chemistry Classes Male Female Total
Period 1 13 (54.17%) 11 (45.83%) 24
Period 2 8 (34.78%) 15 (65.22%) 23
Period 5 10 (40.0%) 15 (60.0%) 25
Total 31 (43.06%) 41 (56.94%) 72
Treatment
To test whether or not graded homework has an effect on student learning, homework
was given on a regular basis, but was only graded every other unit. When homework was
graded it was important for students to complete it and because the culture at SHS is not to
do homework a short homework quiz was given after each homework assignment. The quiz

11
was completed and turned in with completed homework attached in order to receive full
credit. This served as a homework grade that was in line with the Summit School District
Standard Based Grading Policy. Students were allowed to use their homework on the
homework quiz, but were given a set amount of time to complete the quiz to ensure that
academic time was not lost and to encourage students to become more efficient when
completing work that they were familiar with. Each homework quiz took about five to ten
minutes for students to complete depending on the quiz given. In order for a student to earn a
perfect score of a four, the quiz had to be completed accurately and also needed to have
completed homework stapled to the quiz. Graded homework was returned the next class
period with comments and feedback. The homework quizzes were given every other unit in
order to directly compare students’ unit test results, attitudes, and content retention, thus, the
first unit homework quizzes were given with homework, and were graded and entered into
the grade book. The following unit, with no homework quizzes was given and homework
was not graded but was still assigned. Then I rotated back to graded homework quizzes, then
no graded homework, and so on until the end of the first semester. Each unit was about three
to four weeks, so students went three weeks with homework quizzes then three weeks
without homework quizzes.
Instrumentation
In this independent investigation, students were still given homework, as they
normally would, but at times it was graded. Students also took unit assessments and the final
assessment as normal. They participated in surveys and interviews by choice. The research
methodology for this project received an exemption by Montana State University’s

12
Institutional Review Board, and compliance for working with human subjects was
maintained (Appendix A).
Unit Assessments
Unit assessments were given at the end of each unit in both scenarios. The scores
were used as data to determine whether or not students’ accuracy on assessments was
affected by graded homework. Specifically, this data was used to determine whether or not
students who completed homework scored higher, felt more efficient, and felt more confident
since they had practiced the content and had been given feedback more often.
A graded homework unit was piloted before the study truly began. The first unit
taught in chemistry is lab safety and inquiry, which was done by teaching Gas Laws. Since
homework had not been graded in chemistry since standards-based grading was implemented
at SHS, graded homework quizzes were given during this unit but were not used in this
study. This was done for three reasons: 1) to prepare students for homework quizzes, 2) to be
sure homework quizzes took an appropriate amount of time, and 3) to ensure the grading
system was truthful.
Final Exam
The semester ended with a final exam that was administered in a formal testing
setting. This exam was multiple choice and broken down into the four standards covered
throughout the semester. These four standards (1.2 The Atom and Electrons, 1.2 Periodic
Table, 1.3 Chemical Reactions, 1.4 Chemical Bonding) coincided with the two units of
homework quizzes versus the two units of non-homework quizzes. The scores were used as a
large sample size to determine whether or not students’ retention of the content increased

13
with the use of graded homework. Analyzing final assessment scores by comparing graded
versus non-graded homework by use of normalized gain allowed for concluding whether or
not homework was effective in increasing students’ retention over the semester.
Pre and Post Questionnaires
The semester started and ended with questionnaires administered to students in the
sample chemistry classes (Appendix B). The questionnaire evaluated the large group of
students participating in the study on their attitudes towards homework, their opinions on
whether or not homework benefits their learning, and how often they complete homework
when it is assigned to them. The wording of many of the questions and the presentation of the
order of the questions was adapted from Cooper, Lindsay, and Nye’s homework
questionnaire (Cooper et al. 1998).
These questionnaires were administered during class to every student willing to
participate. The questionnaires were administered using Google Forms that were accessed via
the students’ Chromebooks. Students had used this platform before and were familiar with it.
The students were told that honest answers and opinions would be appreciated. Responses
were collected anonymously to encourage students to give honest answers. This was
especially important at the beginning of the school year when a strong rapport with my
students had not yet been built. The goal was to ensure that students who choose to
participate felt they could give honest and accurate answers, and therefore useful data. This
same method was used for the post-questionnaire at the end of the semester.
The questions were used to gather quantitative and qualitative data on how homework
affected student lives outside of school, confidence levels when studying and test taking, if

14
students felt that homework was benefiting them, etc. The pre and post questionnaire was
written using a Likert Scale and open-ended questions. Students answered Likert Scale
questions by placing themselves on a 1 to 4 scale where 1 represented “Agree” and 4
represented “Disagree”. No neutral number option was provided ensuring that students
choose a side and could not be neutral. Neutral data would not be helpful during analysis.
Open-ended questions were used to allow students to give explanations and share thoughts or
opinions. The results of the pre and post questionnaires were used to determine any changes
in opinions and attitudes on homework over the semester and these results were graphed.
Unit Surveys
Unit surveys were given after each unit assessment to allow students the opportunity
to reflect on what went well for them during the unit and where they struggled. These were
given using Google Forms. The survey asked a number of Likert scale questions followed by
open ended questions where needed. These surveys were worded and formatted in adaptation
from Cooper, Lindsay, and Nye’s homework questionnaire (1998). The survey was reviewed
and modified with the help of Emily Glissmann (Summit High School Chemistry Teacher)
and classmates from the MSSE program. Similar surveys were given to my students during
the previous school year to ensure the process was valid and that students’ responses were
reliable. The survey covered four topics; 1) Whether or not students completed homework, 2)
Confidence levels during unit tests in relation to the homework given, 3) Study skills in
relation to the homework, and 4) Independent learning skills in relation to the homework.
Open-ended questions were used to collect explanations and interpretations to Likert Scale
answers. The first two unit surveys were much longer than the last two, and they were more

15
detailed with more open-ended questions. After realizing that students were getting tired of
answering these long surveys, the last two unit surveys were shorted to ensure that students
were giving their best answers. These surveys are presented in the Appendix C. Students’
names were collected with these surveys to allow for follow-up interviews to ask more
specific questions.
Student Interviews
Throughout the semester students were interviewed either one-on-one or in small
groups. The students were selected by sample of convenience; it was easiest to round up a
few students who had completed unit assessments and were available to step outside for a
quick interview. To ensure a variety of students were interviewed, they were selected based
on grades in chemistry, grade level, and equal male to female ratio. There were also students
selected based on responses from the unit surveys though this did not happen until later in the
semester. Interviews were held once a unit, after the unit assessment to gather clarifying
answers to the surveys and questionnaires bringing illumination to how students felt about
homework and what potential benefit they observed. Hearing students speak and share ideas
out loud brought on more questions and conversations leading to even more qualitative data.
Teacher Journal
Throughout the semester a teacher journal was kept to record any interesting
observations and notes that would be useful to this action research study. The journal was
most useful in answering sub question 4, “How does assigning graded homework influence
me as a teacher?” In this electronic journal each unit was reflected upon and was used to
evaluate how grading homework has changed me as a teacher over this time.

16
Data Collection Matrix
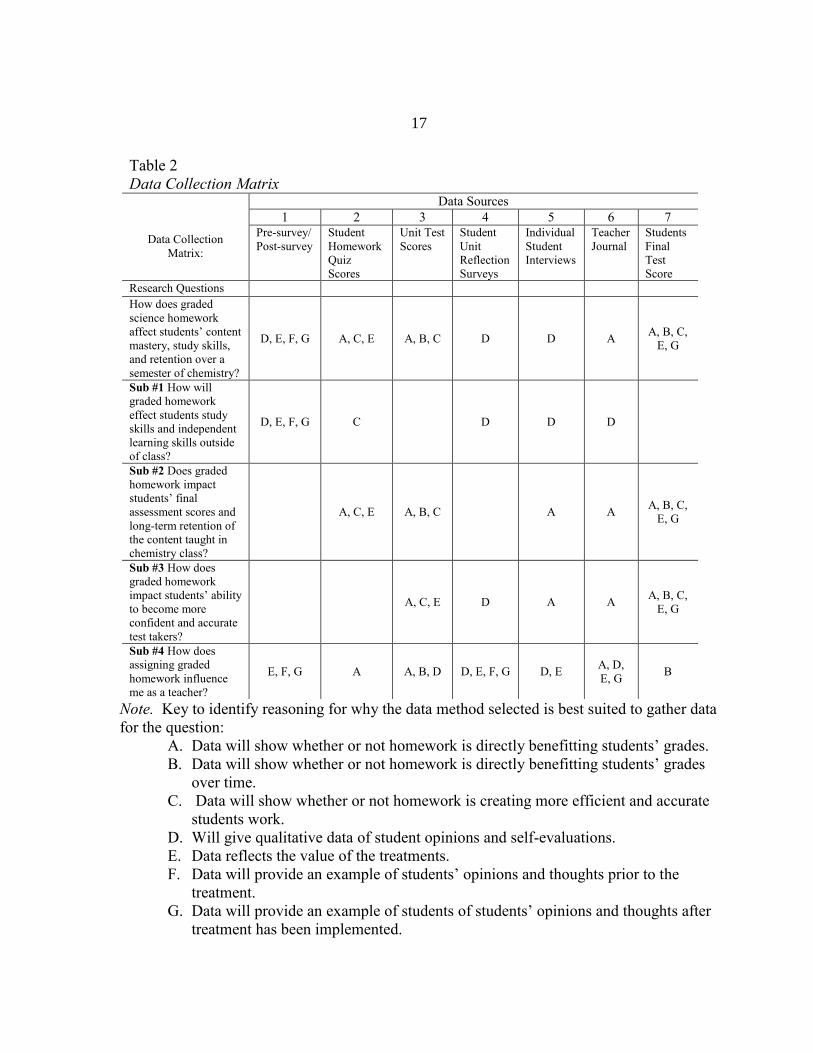
The data collection matrix (Table 2) represents the various uses of data collection that
were implemented during my action research. Each set of data was used to gather a better
understanding of student use of homework and the effect it had. Pre and post questionnaires,
student unit reflection surveys, and individual student interviews answered the first sub-
question; “How will graded homework affect students study skills and independent learning
skills outside of class?” Observing how students performed when homework was given, in
contrast to when non-graded homework, unit assessments scores and the semester final
scores were compared using graded versus non-graded homework units. This answered the
second sub-question; “Does graded homework impact students’ final assessment scores and
long-term retention of the content taught in chemistry class?” The pre-surveys and post
surveys, unit reflection surveys, unit assessment scores, and individual student interviews
answered the third sub-question; “How does graded homework impact students’ ability to
become more confident and accurate test takers?” Finally, all data collection methods, the
teacher journal, and the action research process provided answers to sub-question four: “How
does assigning graded homework influence me as a teacher?”
17
Note. Key to identify reasoning for why the data method selected is best suited to gather data
for the question: A. Data will show whether or not homework is directly benefitting students’ grades.
B. Data will show whether or not homework is directly benefitting students’ grades
over time.
C. Data will show whether or not homework is creating more efficient and accurate
students work.
D. Will give qualitative data of student opinions and self-evaluations.
E. Data reflects the value of the treatments.
F. Data will provide an example of students’ opinions and thoughts prior to the
treatment.
G. Data will provide an example of students of students’ opinions and thoughts after
treatment has been implemented.
Table 2
Data Collection Matrix
Data Sources
1 2 3 4 5 6 7
Data Collection
Matrix:
Pre-survey/
Post-survey
Student
Homework
Quiz
Scores
Unit Test
Scores
Student
Unit
Reflection
Surveys
Individual
Student
Interviews
Teacher
Journal
Students
Final
Test
Score
Research Questions How does graded
science homework
affect students’ content
mastery, study skills,
and retention over a
semester of chemistry?
D, E, F, G A, C, E A, B, C D D A A, B, C,
E, G
Sub #1 How will
graded homework
effect students study
skills and independent
learning skills outside
of class?
D, E, F, G C D D D
Sub #2 Does graded
homework impact
students’ final
assessment scores and
long-term retention of
the content taught in
chemistry class?
A, C, E A, B, C A A A, B, C,
E, G
Sub #3 How does
graded homework
impact students’ ability
to become more
confident and accurate
test takers?
A, C, E D A A A, B, C,
E, G
Sub #4 How does
assigning graded
homework influence
me as a teacher?
E, F, G A A, B, D D, E, F, G D, E A, D,
E, G B

18
DATA AND ANALYSIS
After collecting a semester’s worth of data from homework completion to pre and
post questionnaires to unit assessments and unit surveys to the final exam, there was an
overwhelming amount of data to analyze. This data was dissected and organized by
instrument type using various data analysis tools including t-charts, normalized gain, graphs,
and data tables.
Pre and Post Questionnaires
The pre and post questionnaires focused on how graded homework affected students
study skills, independent learning skills, attitude towards homework, and confidence while
taking a test. The results of the questionnaire given at the start of the first school semester,
were compared to the results of the post questionnaire that was given after the final exam at
the end of the first semester. The pre and post questionnaires are presented in Appendix B.
There were a number of interesting data points observed. First, when examining the
relationships between students opinion of homework in comparison to the value they find in
homework, as asked in the pre and post questionnaire, it was found that students felt they
received too much homework, but also believed they would perform higher on tests if they
completed their homework. The Likert scale statement “I get too much homework” showed
results of 60.61% pre versus 50.94% post of the students agreed, and 15.15% pre and 33.96%
post results indicated students somewhat agreeing (see Table 3 and Figure 1 below). Though
students believed they received too much homework, the majority admitted that they always
complete their homework, 36.36% pre and 41.51% post. This is an accurate statement when
looking at the average amount of homework completed throughout the semester (graded and

19
non-graded). When graded, the majority of students were completing all of their homework,
but when homework was not graded only a handful of students completed all homework.
Table 3
Representation of the Number (percentage) of Student Responses to Likert Statements in the
Pre and Post Questionnaires
Note. Pre N=66, Post N= 53.
Some notable changes seen from the pre to post questionnaires were the number of
students that “Agreed” at the start of the semester compared to “Somewhat Agreed” at the
end. These deviations were noted in the statements “I only do homework if it is worth a
grade” and “When I do homework I feel more confident on tests”. Figure one shows how
these results flipped almost identically. There were 30.30% pre students that stated they
Statement
Number Likert Type Statement
Agree – 1
Pre Post
Somewhat Agree – 2
Pre Post
Somewhat
Disagree – 3
Pre Post
Disagree– 4
Pre Post
1 I always complete my
homework.
24
(36.36%)
22
(41.51%)
23
(34.85%)
20
(37.74%)
15
(22.72%)
9
(16.98%)
4
(6.06%)
2
(3.77%)
2
Homework overwhelms
me or stresses me out.
42
(63.64%)
23
(43.40%)
5
(7.76%)
17
(32.08%)
16
(24.24%)
11
(20.75%)
3
(4.55%)
2
(3.77%)
3
When I do homework I
feel more confident on
tests.
28
(42.42%)
15
(28.30%)
15
(22.72%)
22
(41.51%)
5
(7.76%)
12
(22.64%)
18
(27.28%)
4
(7.55%)
4
I only do homework if it is
worth a grade.
20
(30.30%)
8
(15.09%)
13
(19.70%)
16
(30.19%)
18
(27.28%)
16
(30.19%)
15
(22.72%)
13
(24.53%)
5 I am a confident test taker. 15
(22.72%)
16
(30.19%)
26
(39.41%)
24
(47.17%)
15
(22.72%)
10
(18.87%)
10
(15.15%)
2
(3.77%)
6 I get too much homework. 40
(60.61%)
27
(50.94%)
10
(15.15%)
18
(33.96%)
15
(22.72%)
6
(11.32%)
1
(1.52%)
2
(3.77%)
7
I could benefit from more
homework/ practicing
what I learned in class.
31
(46.97%)
8
(15.09%)
15
(22.72%)
18
(33.96%)
16
(24.24%)
22
(41.51%)
4
(6.06%)
5
(9.43%)
8
If I do my homework
(graded or not), I will earn
higher grades in my
classes.
20
(30.30%)
23
(43.40%)
9
(13.64%)
16
(30.19%)
21
(31.82%)
9
(16.98%)
16
(24.24%)
5
(9.43%)

20
“agreed” and 19.70% pre stated they “somewhat agreed” with only completing homework if
it was worth a grade. The reverse was seen, as fewer students “agreed” in the post
questionnaire (15.09%) and more “somewhat agreed” (30.19%). This deviation was reversed
in responses showing students’ opinions on their confidence during tests. During the pre
questionnaire there were more students who felt homework would increase their confidence
on tests, but in the post questionnaire there were more who “somewhat agreed” that
homework increased their confidence. It is curious that this change happened, but this might
be because the post questionnaire was given immediately after the final exam, a stressful
experience.
Figure 1. Representation of percentage of student responses to Likert statements in the
questionnaires, (Pre N=66, Post N= 53).

21
More dramatic results were seen in Likert statements where students changed their
responses completely from “agree” to “disagree” or vice versa. Responses to the statements
“I am a confident test taker” and “If I do my homework (graded or not), I will earn higher
grades in my classes” both shifted towards agree. It seems students felt they became stronger
test takers over the semester and showed agreeing type responses (i.e., agree or somewhat
agree) increasing from 62.13% pre to 77.36% post; and also showed a 15.23% increase in
test taking confidence. Students’ responses increased dramatically in response to whether or
not doing homework influenced their overall grades, i.e., shifting from 43.94% pre to 73.59%
post. This is a dramatic 29.65% increase. In relation to this statement, students’ responses to
“I could benefit from more homework/practicing what I learned in class” dropped towards
disagree. Students clearly did not think more homework was needed, but they were content
with the amount of homework that was already given as seen in the results discussed above.
The results from the statement “I could benefit from more homework/practicing what I
learned in class” decreased in the agree responses from 69.69% pre to 49.05%, representing a
20.64% decrease. Similar results were recognized with students’ opinions on whether or not
they received too much homework. It seemed that students believed there was value in
homework but were struggling with finding a balance in determining what the appropriate
amount of homework would be.
When looking into the open-ended questions asked on the questionnaires the results
showed that students had a good understanding of what makes homework meaningful and, in
the end, believed that homework should be graded. Figure 2 below shows that most students
believed homework is considered meaningful when it helps them better understand concepts

22
or review the material taught in class. One student interviewed stated, “I think homework is
good if it is going over skills we worked on in class so I can perfect them and better
understand what I am doing.” Students also consistently agreed that homework should be
kept short. The most interesting variation was the increase in the number of students who
believed homework should be graded, which resulted in the number of students who thought
homework should not be graded decreased to zero. It is interesting that not a single student
mentioned this in the post questionnaire, and this aligns with the number of students who
stated homework should be graded. According to Figure 3, 71.7% of students indicated that
homework should be graded, and many students implied that graded homework quizzes
encouraged them to complete it. “I think it helps motivate me to do homework and is an easy
way to show that I know something or need help.” Others explained that homework quizzes
helped them see where they were having trouble and needed to ask questions. “The
homework quizzes help me realize what I need to practice and what I have down” was a
common response. Of course, there were students who did not agree, 24.5%, and who made
statements like, “I think if homework contributed to ones grade it would be more stressful
and less beneficial. Maybe just a check mark.” and, more dramatically, “It’s beyond stupid. I
should not be punished for not understanding what I’m being taught.” Though in the end,
graded homework seemed to prevail in accordance to the students.

23
Figure 2. Questionnaire responses to “What makes homework meaningful?” (Pre N=66, Post
N=53).
Figure 3. Post questionnaire results in regards to whether or not homework should be graded,
(N= 53).
Unit Reflection Surveys
As fewer students are completing homework on regular basis homework quizzes were
given to encourage students to complete homework. Unit reflection surveys were compared
between the homework quiz units and the non-homework quiz units. A few distinguished
observations were found in the amount of homework completed during these units and

24
students’ responses in regard to their independent learning skills, study skills, and their
confidence in test taking between graded and non-graded homework units.
Unit surveys were given at the end of each of the four units covered throughout the
semester. The first two unit surveys were identical and the last two were shortened. Results
from each survey were compared based on whether or not homework quizzes were given
during the unit. The first observation was related to how much homework was completed
during these units. As seen in Figure 4, the number of students who completed all homework
assignments was significantly higher during graded homework units, 61.45% in comparison
to 47.76%. This is a 13.69% difference where students were doing less homework. It is
observed that during non-graded homework units students admitted to only completing
“Most of it” which is supported by the increase in responses. It is also noted that when
homework is not graded there are more students not doing any homework and there was an
increase of 4.84% of “none” responses. During interviews students were asked, “What
motivates you to complete your homework?” and a number responded with, “When it is
graded I feel like I have to do it”. These statements align with the results and prove that
holding students accountable was beneficial to students’ motivation to complete homework.

25
Figure 4. Overall average response in percentage to “Did you complete your homework for
this unit?” (N=62).
In each unit survey students were asked, “Does homework help me become a more
independent learner?” The results are displayed in Figure 5 below. It is observed that
throughout the semester students’ opinions on whether homework helped them become
stronger independent learners increased dramatically until the last unit. This is inquisitive
because many students made statements in the post questionnaire regarding how homework
helped them learn on their own. “It helped me because I could see what I needed work on
and what I was already fairly good at.” and “The homework quizzes made me ask more
questions if I didn’t understand or gave me a better understanding of what we did during
class.” These statements show how students learned to think independently on their own.
Graded homework was successful and increased knowledge, though they may not be aware.

26
Figure 5. Overall average response in percentage to “Does homework help me become a
more independent learner?” (Unit 1 – N= 66, Unit 2 - N = 63, Unit 3 - N = 56, Unit 4 – N=
53).
It is important to note that the Unit 4 Assessment Survey was built into the post
questionnaire. Students answered these statements after taking their final when they may
have felt more defeated. The reason for combing the survey and questionnaire was because
the number of surveys the students were taking was becoming overwhelming. It would have
been interesting to see if students answered differently if this survey was given separately.
Though, the Unit 4 survey results still showed an increase in this statement compared to the
Unit 1 results. Generally, it can be assumed that students felt homework helped them become
stronger independent learners.
In regards to homework improving independent learning skills increased, both graded
and non-graded homework units increased in students’ response to “yes, it helped a ton”
throughout the semester. From Unit 1 to Unit 4 there was a 16.92% increase in response to
this. It was interesting to see this same pattern in the response “it was not helpful”, there was

27
a 6.75% increase. This shows that throughout the semester students became more aware of
how homework directly affected their independent learning. Figure 6 shows where the two
middle choices decreased and the more assertive “yes” or “no” options increased. Overall,
there was more consistency in higher results on the left (or “yes”) portion of the graph
signifying that students do feel homework is improving their independent learning skills and
this notion grew over the semester.
Figure 6. Response by unit in percentage to “Does homework help me improve my study
skills?” (Unit 1 – N= 66, Unit 2 - N = 63, Unit 3 - N = 56, Unit 4 – N= 53).
In the first unit survey some students said they felt that they became stronger
independent learners by doing practice problems on their own and writing down questions or
asking more questions, but as the semester went on the answers to this question became more
thoughtful. In the third and fourth unit surveys and interviews students’ responses were more
confident. They seemed to have learned how to study on their own. One student responded to

28
an open-ended question with, “Using my notes and problems, like examples, from class I can
usually use those to teach myself at home. When I get the general idea it helps a ton to build
my own ideas and teach myself.” During the final interview, students agreed that homework
is beneficial if it is interesting and helpful. These students explained that reading a textbook
did not help them learn on their own but expanding on what they had learned in class helped
them become independent learners. Students needed the foundation of the content before
they felt comfortable exploring and learning on their own. One student said it best,
“Something that helps you learn at independent learning is searching for new things or trying
new things out. Without ever exploring how are you going to find out what’s at the end of the
bridge?”
Figure 7. Overall average response in percentage to “Does homework make me a more
efficient test taker?” (N=62).
The results to the question, “Does homework make me a more efficient test taker?”
seen in Figure 7, represents students responses compared between graded and non-graded
homework units, where 41.5% of students said graded homework made them become more

29
efficient test takers, and 33.85% of students said that non-graded homework helped them
become more efficient test takers, which is a 7.65% difference. Whether or not homework
was graded, the “No” response was always lowest. This means that if students completed
their homework, graded or not, they, felt they were better test takers. When asking students
about this during interviews many students generally responded with something along the
lines of, because they had practiced the material more often they were able to perform more
confidently on the test. One student specified, “I am not standing there wondering if we went
over it in class because I remember it from homework.” while another elaborated, “It’s cause
you know how to do everything faster and quicker, you're also pretty certain you know how
to do it right so you don’t take time to doubt yourself.” Only one student in the interview
shared a thought that gave explanation for students who disagree. He said, “No cause
homework doesn’t effect how I take a test, whether I do homework or not, I’m still going to
try my best on the test and I just do my tests as quickly as possible anyways.” This is one of
the few students who rarely completed homework, but is an average academic student who
earned an overall grade of a two but also a student who enjoyed giving attitude towards
almost everything. The largest gap noticed between graded and non-graded homework units
was the “maybe” response. There was a much larger “maybe” response during non-graded
homework units. This may be due the fact that they were not completing homework as often
when compared to graded homework units.
Unit Assessments
Unit assessments were used to address the crucial question; does graded homework
have an affect on test scores and, therefore students’ overall grades? This question was

30
answered by analyzing unit test scores based on whether homework was graded or not during
the unit. According to Table 4 and Figure 8, there was a significant difference in the
disbursement of grades based on whether or not homework was graded. Looking at the box
and whisker plot (Figure 8), the higher scores in the maximum and upper quartile are the
same (i.e., ~ 3.5 out of 4) in both graded and non-graded units. However, when looking at the
minimum and lower quartile there was a greater range between the sets of scores. The results
indicate the lower scoring students were performing lower when homework was not graded,
the minimum at 0.250 and the lower quartile at 1.750. When homework was graded the
minimum increased to 0.625 and the lower quartile increased to 2.313, a huge gain.
Figure 8. The disbursement of student assessment scores by Graded vs. Non-graded
Homework Units, (Unit 1 – N= 70, Unit 2 - N = 70, Unit 3 - N = 71, Unit 4 – N= 71).
Table 4
Statistical Analysis of Graded and Non-graded Homework Assessments (N=70)
Unit Minimum Lower
Quartile
Median Upper
Quartile
Maximum
Graded 0.625 2.3125 2.9075 3.5 4
Non-Graded 0.25 1.75 2.585 3.5 4

31
Gain was also seen in the percentage of students passing the assessments with a
proficient score of 2. When homework was not graded 23.24% of students scored below a 2,
this was almost a quarter of the students tested (Table 5), and when compared to graded
homework units where only 15.75% of students scored below a 2, I observed a 7.49%
difference. There was a smaller gain on the upper end of the grade scale as well. The students
that earned a 3.5 or 4 when homework was graded during the unit was 31.76% in comparison
to 27.47% during non-graded units, a 4.29% difference. The smallest population effected by
graded homework was the “average” student. 52.14% students scored a 2 to a 3 on the
assessments during graded units while 49.46% of students scored in this range during non-
graded units. This was only a 2.68% variance. To summarize the box and whisker plot,
graded homework had the largest positive effect on students who typically earn lower grades
Graded homework was closing this gap and moving these students up into the proficient level
(2 to 3). This was also seen in the movement of students from the proficient level to the
advanced level (3.5 to 4), though the increase was not as significant. See Appendix D for
Summit High School’s rubric.

32
Table 5
Student Unit Test Scores Comparing Graded Homework Units to Non-Graded Homework Units
Note. Unit 1.2 Atoms and Electrons covered two standards given in one unit, scores were averaged.
In contrast to what the assessment scores showed, the majority of students disagreed
with the statement “If I do my homework (graded or not), I will earn higher grades in my
classes” when asked in unit surveys. SHS uses standards based grading, meaning students are
graded only on assessments such as tests, labs, and other projects. It makes sense that
students would not associate homework with their overall grade.
Final Assessment
Finally, the long-term retention of the content taught based on graded homework was
analyzed by looking at students’ grades from the final exam in relation to whether or not
homework was graded during the unit the content was taught. The normalized gain proved
that students’ grades increased significantly from non-graded units compared to graded units,
see Table 6. As a matter of fact, the normalized gain decreased in Unit 3, a graded homework
unit. This represents one of two things, either that graded homework did not have an increase
Units with Graded Homework Units with Non-Graded Homework
Grade Unit 1.2
Atoms and
Electrons
Unit 1.4
Molecules
Average (%)
Unit 1.2
Periodic Table
Unit 1.3
Chemical
Reactions
Average (%)
0 0 (0%) 0 (0%) 0% 0 (0%) 2 (2.82) 1.41%
0.5 1 (0.72%) 1 (1.41%) 0.94% 1 (1.41%) 0 (0%) 0.70%
1 1.5 (2.00%) 7 (9.86%) 4.47% 1 (1.41%) 12 (16.90%) 9.16%
1.5 7 (10.00%) 8 (11.27%) 10.34% 6 (8.45%) 11 (15.49%) 11.97%
2 12.5 (17.86%) 13 (18.31%) 18.01% 6 (8.45%) 7 (9.86%) 9.16%
2.5 13 (18.57%) 6 (8.45%) 15.17% 15 (21.13%) 8 (11.27%) 16.35%
3 12.5 (17.86%) 15 (21.13%) 18.96% 22 (30.99%) 12 (16.90%) 23.95%
3.5 12.5 (17.86%) 12 (16.90%) 17.54% 12 (16.90%) 7 (9.86%) 13.38%
4 10.5 (15.00%) 9 (12.68%) 14.22% 8 (11.27%) 12 (16.90%) 14.09%
Total 70 (100%) 71 (100%) ------- 71 (100%) 71 (100%) --------

33
in students long term retention of the content or, the more likely option, it showed that as
students use the content more they have a better chance of improving their scores, especially
if their scores were low to start with. In chemistry, each unit builds off the previous unit so
the students were constantly using what they had previously learned. This explains how the
lower scores in the non-graded units had a better chance of improving before the final exam,
significantly improving the lowest scores. It makes sense that it would be more difficult to
improve the already high scores in the graded homework units. It might be more effective to
measure normalized gain with students standardized test scores such as CMAS, the state
science test. This would present a more accurate representation of students’ long-term
retention. This cannot be done until test scores are released early next school year
Table 6
Normalized Gain per Unit
Teacher Journal
A teacher journal was kept throughout the semester. This journal was used to take
down any observations and notes that were considered valuable throughout the personal
action research project. After reviewing the teacher journal there were a few valuable themes
that should be pointed out. The first observation to note was that I found that I learned a
significant amount about my students’ academic abilities. When I was grading homework
and giving feedback, I found that I became much more aware of my students reading,
Unit 1 -
Graded
Unit 2 – Non-
Graded
Unit 3 -
Graded
Unit 4 – Non-
Graded
Unit Assessment
Average
2.946 2.607 2.792 2.408
Final Exam Average 2.951 2.965 2.634 2.789
Normalized Gain 0.0041 0.257 -0.131 0.239

34
writing, and math skills. This information proved to be incredibly valuable. For example, I
learned that one of my students is struggling with reading and writing in English. His ability
to speak the language would have you fooled! I started providing him with homework and
homework quizzes in Spanish and he was able to complete the work with ease. The second
valuable theme that came out of the teacher journal was that when I gave feedback more
often I was much more aware of where my students were with the content. I was able to pick
up on common misconceptions and misunderstandings before it was too late. I would address
the class or a group of students about these and immediately see positive changes in their
work. When teaching students to “crisscross” their ions during one of the graded homework
units, I discovered that there were a handful of students that were making the same errors
over and over again. When I handed back their homework quizzes, I made a point to have a
quick conversation about it. These short conversations improved students understanding of
the content immediately. If I had not been grading homework, I would have never known
exactly which students were making simple mistakes until a quiz or test, which is too late.
Overall, I felt that I had a stronger relationship with my students during graded homework
units because I better understood the way they were thinking and the levels at which they
were preforming.
INTERPRETATION AND CONCLUSION
The goal of this action research project was to increase students’ knowledge of
content and confidence in the material taught in a high school chemistry classroom. With the
use of graded homework, students were encouraged to complete their homework and become
more confident in their knowledge of the content which would, ideally, lead to higher unit

35
test scores and long term retention of the content. Various quantitative and qualitative data
collection methods were put into place and multiple data analysis tools were applied.
In looking at the first sub-question on whether or not graded homework effects
students study skills and independent learning skills outside of class, it was found that graded
homework does increase both of these skills. This was seen in students survey results where
it was expressed in both graded and non-graded units where over 60% of students agreed
homework helped them become better independent learners. In both cases, over 50% of
students agreed homework always or usually benefits their study skills. Most students believe
that homework is beneficial to their study habits and learning abilities whether it is graded or
not. The problem is that fewer students complete their homework when it is not graded and,
therefore, are doing a disservice to themselves by choosing not to complete the homework.
This shows that high school students need motivation to do homework and a grade just might
be the motivation they need.
Sub-question two “What impact does graded homework have on students’ final
assessment scores and long-term retention of the content taught in chemistry class?”, was
answered by comparing the final assessment scores to whether or not homework was graded
during the unit. The final assessment scores associated with graded homework appeared to
increase the least. Scores increased from non-graded homework units to the final because
students had scored lower and had a larger gap of opportunity for improvement. Students’
scores certainly did increase in non-graded units, but their average scores for graded units
stayed constant. This showed that students did retain the content but did not have room to
grow when homework was graded.

36
Homework not only improves students study skills but it also improves their test
taking skills and confidence levels, helping answer sub-question three. In open ended
responses and student interviews the students expressed that when they completed homework
they felt more confident on tests and were able to work out problems more efficiently.
Students expressed that they were more assertive in their answers so they didn’t need to
spend time second-guessing themselves. One student stated, “I think they encourage me to do
my homework, which made me a better studier and helped me one later tests because I'd had
more practice.” When surveyed during graded homework units 41.5% of students said
homework made them more efficient test takers but only 39.4% agreed to this when
homework was not graded. This indicates that grading homework and providing immediate
feedback does improve students test taking skills and confidence. The downfall to assigning
graded homework was that students then felt more stress. Though stress was increased, it was
not necessarily a bad thing. One student shared, “It was stressful but it made me get better at
time management and making sure I understand what is happening in class.” In the end,
students expressed that they did not necessarily enjoy doing homework, but knew it was
benefitting them and preferred to be held accountable with homework quizzes because they
felt more confident and successful on unit tests.
The results to sub-question three regarding the fact that students confidence levels
increased on unit tests made sense. The more they practiced and worked with the content the
better they would perform and, therefore, students earned higher scores. Comparing grades
from graded versus non-graded homework units it is clear that students scored higher when
homework was graded. During grading of the homework units, students received feedback

37
more often and were completing homework more often. These two observations show an
increase in unit test scores and students long-term retention of content. A paired t-test was
conducted to compare unit test scores from graded (𝜇1) to non-graded homework (𝜇2) units.
The results were clearly rejected; the mean for graded homework units was 2.72 while the
mean for non-graded homework units was 2.5. The value of t = -2.850439 and a value of p is
0.017903 with a significance at p ≤ 0.05. The p-value is significantly lower than the 0.05 and
therefore the null hypothesis can be rejected meaning that units where homework was graded
likely produced higher grades, and the test was significant. Not only did the t-test support
this, but also the box and whisker plot expressed how students who would normally score a 2
or below were earning higher unit test grades. Homework quizzes are incredibly beneficial to
the “middle level students”.
In conclusion, homework, graded or not, appears to strongly benefit students learning
and content mastery, study skills and independent learning, and retention throughout the
semester. Students agree that homework does help them, but they also agree that they don’t
want to do it. It was seen that when there was a grade on the line more homework was
completed and students proved to score higher on tests, felt more confident during the test,
and are remembered the content for a longer period of time. When homework was not
graded, students were less motivated to do the work and it showed in their unit scores and
overall grades. Therefore, holding students accountable for practicing content by use of
graded homework has proven to be successful when it comes to students mastering content.

38
VALUE
After completing this independent study, I have learned that homework is a valuable
asset to a high school students’ education. At this point I have decided to continue giving
graded homework. It not only improved students understanding of content and increased test
scores, but it also gave immediate feedback to where students are with the content. As a
teacher, it is incredibly valuable to know how your students are doing and to know where
they are struggling. Giving students feedback a few times a week provided me the
opportunity to speak with students’ immediately about misconceptions and common errors
made. I feel that this has made the greatest difference in my students learning during this
study. I have enjoyed feeling that I have a better concept of my students understanding and
am able to teach at a pace that meets their needs. I also think graded homework has
encouraged my students to do it and according to conversation with my students they feel
more comfortable and knowledgeable during units when they do their homework. I will
continue to give graded homework quizzes because quizzes allow me to give feedback and
the homework portion allows students the opportunity to ask questions and get clarification.
Homework might not be the perfect solution for every student when it comes to
increased grades, long-term retention, and testing confidence but it does seem to be effective
for the majority of our science students at SHS. This is the message that should be passed on
to others at SHS, and in the District. As this debate over assigning homework and grading
homework continues, it would be valuable for teachers in other departments to experiment
with the concept of graded homework. My Action Research has been shared with the math
department and with the department heads at SHS. The responses are positive and the

39
teachers that don’t give or grade homework have a better understanding of how it could be
valuable to student success. There will not be any changes to Summit School Districts
grading policy any time soon, but as the year came to end there were more conversations
taking place regarding how to increase the rigor in classes. This action research clearly seems
to show how graded homework is beneficial in the chemistry classroom, and I think we can
assume similar results will be found in other science classes and in the math department (and
probably others), but we cannot know for sure until others give it a try. As I continue to share
my results with other subject areas at SHS there is hope that graded homework will benefit
students across all subject matters. This could eventually lead to conversations at the
administration and district level in regards to our current Standards Based Policy and grade
book system.

40
REFERENCES CITED

41
Bennett and Klash. (2006). The Case Against Homework: How It is Hurting Our
Children and What We Can Do About It. New York. Crown Publishers.
Cooper, H., Lindsay, J., Nye, B., Greathouse, S. “Relationships Among Attitudes About
Homework, Amount of Homework Assigned and Completed, and Student
Achievement”. Journal of Educational Psychology. 1998, Volume 90, 70-83.
DeSimone, J. (2006). “Academic Performance and Part-Time Employment among
High School Seniors.” Topics in Economic Analysis and Policy 6(1): 1-34.
Dougherty, Eleanor. (2012) Assignments Matter: Making the Connections That Help
Students Meet Standards. Association for Supervision and Curriculum
Development.
Good, T., Brophy, J. (2003). Looking in classrooms, ninth ed. Boston: Allyn and Bacon.
Kamenetz, A. “Most High School Seniors Aren't College Or Career Ready, Says
'Nation's Report Card'”. National Public Radio: Education K-12. April 27, 2016.
Kohn, Alfie. (2006). The Homework Myth: Why Our Kids get Too Much of a Bad Thing.
Boston. De Capo Books.
Lillydahl, J.H. (1990). “Academic Achievement and Part-Time Employment of High School
Students.” Journal of Economic Education 21(3): 307-316.
Loveless, Tom. (2014). “Homework in America.” The Brookings Institute. 2014.
Maltese, A., Tai, R., and Fan, X. “When is Homework Worth the Time? Evaluating the
Association Between Homework and Achievement in High School Science and
Math”. The University of North Carolina Press. 2012, pp. 52-72.
Marzano, Robert. (2007) The Art and Science of Teaching. Alexandria, VA. Association
for Supervision and Curriculum Development, pp. 60 – 71.
Marzano, R., Pickering, D., Pollock, J. (2001) Classroom Instruction that Works:
Research Based Strategies for Increasing Student Achievement. Association for
Supervision and Curriculum Development, Chapter 5, pp. 60 - 68.
Skinner, David. “The homework wars.” National Affairs. Winter 2014, pp. 49 - 60.

42
APPENDICES

43
APPENDIX A
INSTITUTIONAL REVIEW BOARD EXEMPTION

44

45
APPENDIX B
PRE AND POST QUESTIONNAIRE

46
Pre- Questionnaire
* Created and given via Google Forms
Likert Style Questions:
1- Agree 2- Somewhat Agree 3- Somewhat Disagree 4- Disagree
1. I always complete my homework.
2. Homework helps me better understand what is taught in class.
3. Homework overwhelms me or stresses me out.
4. When I do homework I feel more confident on tests.
5. I only do homework if it is worth a grade.
6. I am a confident test taker.
7. I get too much homework.
8. I fight with my parents/ guardians over homework.
9. I could benefit from more homework/ practicing what I learned in class.
10. If I do my homework (graded or not), I will earn higher grades in my classes.
Open Ended Questions:
11. How long do you spend on homework each night?
12. What makes a homework assignment meaningful or beneficial to you?
Post-Questionnaire
* Created and given via Google Forms
* Likert Style Questions:
1- Agree 2- Somewhat Agree 3- Somewhat Disagree 4- Disagree
Section 1 – All Homework
1. Homework (in general) overwhelms me or stresses me out. (Likert)
2. I am a confident test taker (in general). (Likert)
3. I get too much homework all together. (Likert)
4. How long do you spend on homework each night? (open ended)

47
5. I fight with my parents/ guardians over homework. (Likert)
6. What makes a homework assignment meaningful or beneficial to you? (open ended)
Section 2 – Science Homework
7. I could benefit from more homework/ practicing what I learned in class. (Likert)
8. I always complete my science homework. (Likert)
9. When I do my science homework I feel more confident on tests. (Likert)
10. I believe that if I do my science homework (graded or not), I will earn a higher grades in
my science class. (Likert)
11. I choose only do science homework if it is worth a grade. (Likert)
Section 3 – Science Homework
12. Homework quizzes encouraged me to complete my science homework. (Likert)
13. Homework quizzes helped me prepare myself for science tests. (Likert)
14. Homework quizzes helped improve my study skills. (Likert)
15. Homework quizzes helped become a more independent learner (I can learn things on my
own) (Likert)
16. I felt more confident on unit tests when I did my science homework. (Likert)
17. Homework should be graded in science class. (Likert)
18. Homework should be graded in all classes. (Likert)
19. What are your thoughts on graded homework (homework quizzes) in science class? (open
ended)
20. What are your thoughts on graded homework (homework quizzes) in all your core
classes? (open ended)

48
APPENDIX C
UNIT SURVEYS
(FULL LENGTH AND SHORTENED)

49
Full Unit Survey (Units 1 and 2)
1. Did you complete homework for this unit on atoms and electrons?
Yes, all of it! Most Some None
2. What motivated you to complete your homework? (open-ended)
3. Do you feel homework should be part of your grade? Yes No
4. Were there any benefits from completing homework this chapter? If yes, list a few. If no,
why isn't it beneficial. (open-ended)
5. If you did homework... Did you feel more confident on the test because you completed
homework?
I felt more confident I felt the same I did not do my homework
I felt less confident with completing my homework
6. Explain why homework help you become more or less confident on the test. (open-ended)
7. Do you feel that completing homework has made you a more efficient (quicker and more
accurate) test taker?
Yes No Maybe
8. Explain why homework helped you become more or less efficient on the test. (open-
ended)
9. Did the homework from this chapter help you study? Yes No
10. Do you feel that the homework has helped you improve your study skills?
Yes it helped a ton It was usually helpful
It was helpful sometimes It was not helpful
11. How does homework help you improve your study skills? (open-ended)
12. What would help you get better at studying on your own? (open-ended)
13. Do you feel that you are someone who learns well on your own?
Yes No
14. Do you feel that homework has helped you become a stronger independent learner?

50
Yes No
15. What might help you become stronger at independent learning? (open-ended)
Shortened Unit Survey (Units 3 and 4)
1. Did you complete homework for this unit on Ionic and Covalent Bonds?
Yes, all of it! Most Some None
2. Do you feel homework should be part of your grade? Yes No
3. If you did homework... Did you feel more confident on the test because you completed
homework?
I felt more confident I felt the same I did not do my
homework
I felt less confident with completing my homework
4. Do you feel that completing homework has made you a more efficient (quicker and more
accurate) test taker?
Yes No Maybe
5. Did the homework from this chapter help you study? Yes No
6. Do you feel that the homework has helped you improve your study skills?
Yes it helped a ton It was usually helpful
It was helpful sometimes It was not helpful
7. Do you feel that homework has helped you become a stronger independent learner?
Yes No

51
APPENDIX D
SUMMIT SCHOOL DISTRICT GRADE RUBRIC

52
Summit High School Standard Based Grading Rubric
Score Level Descriptors
4 Advanced
High
Student consistently exceeds grade level expectations/standards
and is able to apply them almost faultlessly in a wide variety of
situations. The student demonstrates originality and insight and
regularly produces work of high quality.
3.5 Advanced Student consistently meets and exceeds grade level
expectations/standards and is able to apply learned information
and skills to new and unfamiliar situations with original insights
beyond what is covered in the classroom.
3 Proficient High Independently, student consistently meets and sometimes
exceeds grade level expectations/standards and is able to apply
learned information and skills to complex ideas and processes in
familiar situations. (This is the level being “taught”)
2.5 Proficient With minimal adult support, student consistently meets grade
level expectations/standards and is able to apply learned
information and skills to complex ideas and processes in familiar
situations.
(The student is showing proficient level of work but not as
consistently)
2 Progressing The student meets or exceeds proficiency of foundational details
and processes or prerequisite skills, but is still working toward
proficiency of the complex ideas and processes of the grade
level.
1.5 Partially
Proficient
With assistance, the student displays knowledge of foundational
details and processes or prerequisite skills. (Minimum passing
grade for course credit)
1 Unsatisfactory The student is rarely able to display knowledge of foundational
details and process, even with help.
.5 Unsatisfactory The student is unable to display knowledge of foundational
details and process, even with help.