The Effect of Geometric Defects and Porosity on the ...
60
Clemson University Clemson University TigerPrints TigerPrints All Theses Theses December 2019 The Effect of Geometric Defects and Porosity on the Mechanical The Effect of Geometric Defects and Porosity on the Mechanical Behavior of Additively Manufactured SS 316L and AlSi10Mg Behavior of Additively Manufactured SS 316L and AlSi10Mg Components Components Benjamin A. Smith Clemson University, [email protected] Follow this and additional works at: https://tigerprints.clemson.edu/all_theses Recommended Citation Recommended Citation Smith, Benjamin A., "The Effect of Geometric Defects and Porosity on the Mechanical Behavior of Additively Manufactured SS 316L and AlSi10Mg Components" (2019). All Theses. 3201. https://tigerprints.clemson.edu/all_theses/3201 This Thesis is brought to you for free and open access by the Theses at TigerPrints. It has been accepted for inclusion in All Theses by an authorized administrator of TigerPrints. For more information, please contact [email protected].
Transcript of The Effect of Geometric Defects and Porosity on the ...
Clemson University Clemson University
TigerPrints TigerPrints
All Theses Theses
December 2019
The Effect of Geometric Defects and Porosity on the Mechanical The Effect of Geometric Defects and Porosity on the Mechanical
Behavior of Additively Manufactured SS 316L and AlSi10Mg Behavior of Additively Manufactured SS 316L and AlSi10Mg
Components Components
Benjamin A. Smith Clemson University, [email protected]
Follow this and additional works at: https://tigerprints.clemson.edu/all_theses
Recommended Citation Recommended Citation Smith, Benjamin A., "The Effect of Geometric Defects and Porosity on the Mechanical Behavior of Additively Manufactured SS 316L and AlSi10Mg Components" (2019). All Theses. 3201. https://tigerprints.clemson.edu/all_theses/3201
This Thesis is brought to you for free and open access by the Theses at TigerPrints. It has been accepted for inclusion in All Theses by an authorized administrator of TigerPrints. For more information, please contact [email protected].
THE EFFECT OF GEOMETRIC DEFECTS AND POROSITY ON THE
MECHANICAL BEHAVIOR OF ADDITIVELY MANUFACTURED
SS 316L AND ALSI10MG COMPONENTS
A Thesis
Presented to
the Graduate School of
Clemson University
In Partial Fulfillment
of the Requirements for the Degree
Master of Science
Mechanical Engineering
by
Benjamin Aaron Smith
December 2019
Accepted by: Garrett Pataky, Committee Chair
Huijuan Zhao
Xin Zhao

ii
ABSTRACT
Additive manufacturing (AM) is becoming increasingly popular in the automotive,
aerospace, energy and healthcare industries. Standards for critical defect sizes and porosity
levels in AM materials have not been established. A critical porosity manufactured defect
relationship which can qualify components for safe use needs to be developed. Defects
including a quarter crack, an internal void, and a through-hole were intentionally
manufactured into SS 316L and AlSi10Mg AM tubular tensile specimens to investigate
and improve the understanding of the ductility-defect-porosity relationship of AM Metals.
SS 316L and AlSi10Mg compression specimens were tested from different build heights
and locations on the build plate to explore the effects of spatial location on the material
properties. Thin single edge notch tensile fracture toughness specimens with AM notch and
diamond saw notch were studied to investigate the apparent fracture toughness of thin AM
specimens. Levels of porosity were introduced by reduced laser power in all the AlSi10Mg
specimens. This study helps define the relationship between defects, porosity, and ductility
of AM SS 316L and AlSi10Mg and compares this relationship to conventional metals.
From the results of this study, AM SS 316L and AM AlSi10Mg follow conventional
knowledge about stress concentration and ductility for metals.
There was no significant difference in fracture toughness between the AM and
diamond saw notch in the fracture toughness specimens. The SS 316L compression
specimens closer to the build plate had increased material properties while the AlSi10Mg
compression specimens had similar material properties throughout. The material properties
of the SS 316L and AlSi10Mg compression specimens varied by the build plate location.
iii
Geometric defects decreased the ductility and strength for all the tubular tensile
specimens. With a significant increase in porosity, the mechanical behavior started to be
dominated by the porosity over the intentionally manufactured geometric defects. The
mechanical behavior of the ductile SS 316L tubular specimens was driven by the reduction
in the cross-sectional area while the more brittle AlSi10Mg was driven by stress
concentrations. From this study, AM SS 316L and AlSi10Mg produced by selective laser
melting had similar mechanical behavior to traditional ductile and brittle metals.

iv
ACKNOWLEDGMENTS
I want to thank my advisor Dr. Garrett J. Pataky for supporting me through my
Master’s study at Clemson University. He has been an outstanding advisor, and I wish him
the best in his future research endeavors.
I want to thank Jody B. Bartanus for designing the test tooling, experimental
procedures, and his Master’s research on AM SS 316L specimens. Jody performed the
majority of the experiments of the stainless steel specimens.
I want to thank Dr. Jay Carroll, Dr. Christopher Laursen, and Sandia National
Laboratories for providing funding, materials, and support for this study on additively
manufactured metals. I want to thank the staff at Clemson’s Advanced Materials Research
Laboratories (AMRL) for the use of their SEM to perform fractography. I would also like
to thank my committee member Dr. Huijuan Zhao and Dr. Xin Zhao.
I want to thanks my lab mates Jacob Biddlecom, Kaitlynn Conway, Mitra Shabani,
Matt Williams, Fredrick Monroe and Abhishek Mahajan for providing a wonderful work
environment and positive atmosphere.
I also want to thank my family and friends who have supported me through my
academic career at Clemson University.

v
TABLE OF CONTENTS
ABSTRACT .................................................................................................................................... ii
ACKNOWLEDGMENTS .............................................................................................................. iv
LIST OF FIGURES ....................................................................................................................... vii
LIST OF TABLES ......................................................................................................................... ix
1. Chapter 1: Introduction............................................................................................................ 1
1.1 Motivation ....................................................................................................................... 1
1.2 Research Questions ......................................................................................................... 2
1.3 Background ..................................................................................................................... 3
2.1 Materials and Characterization ........................................................................................ 7
2.2 Specimens ...................................................................................................................... 12
2.2.1 Tapered Tubular Specimens .................................................................................. 12
2.2.2 Fracture Toughness Specimens ............................................................................. 14
2.2.3 Compression Specimens ........................................................................................ 15
3. Chapter 3. Experimental Methods ......................................................................................... 15
3.1 Tubular Tensile Specimens ........................................................................................... 15
3.2 Fracture Toughness Testing .......................................................................................... 17
3.3 Compression Testing ..................................................................................................... 19
4. Chapter 4: Results.................................................................................................................. 20
4.1 Tubular Tensile Specimen Results ................................................................................ 20
4.1.1 SS 316L Tubular Tensile Specimens Results ........................................................ 20
4.1.2 AlSi10Mg Tubular Tensile Specimen Results ...................................................... 22
4.1.3 Tubular Tensile Specimens Fractography Results ................................................ 26
4.2 Fracture Toughness Results ........................................................................................... 33
4.3 Compression Results ..................................................................................................... 36
5. Chapter 5: Discussion ............................................................................................................ 38
5.1 Relationship of Defects and Ductility ........................................................................... 38
5.2 Defect and Porosity Relationship .................................................................................. 40
5.3 AM and DS Notch Fracture Toughness ........................................................................ 41
5.4 Effect of Build Plate Height and Location .................................................................... 42 6.
Chapter 6: Conclusions.......................................................................................................... 43
TITLE PAGE.................................................................................................................................... i

vi
7. Chapter 7: Future Works ....................................................................................................... 44
REFERENCES .............................................................................................................................. 45
vii
LIST OF FIGURES
Figure 1: Images of the fracture surface of dog bone specimens from AlSi10Mg build plate
A, build plate B, and build plate C show the different levels of porosity (dark spots) and
build quality. ....................................................................................................................... 9
Figure 2: A) AM SS316L build plate layout B) AlSi10Mg build plate layout with Pristine
(P), Internal Void (IV), Through Hole (TH) and Quarter Crack (QC) defects in tubular
tensile specimens, Compression specimens are circled in red .......................................... 12
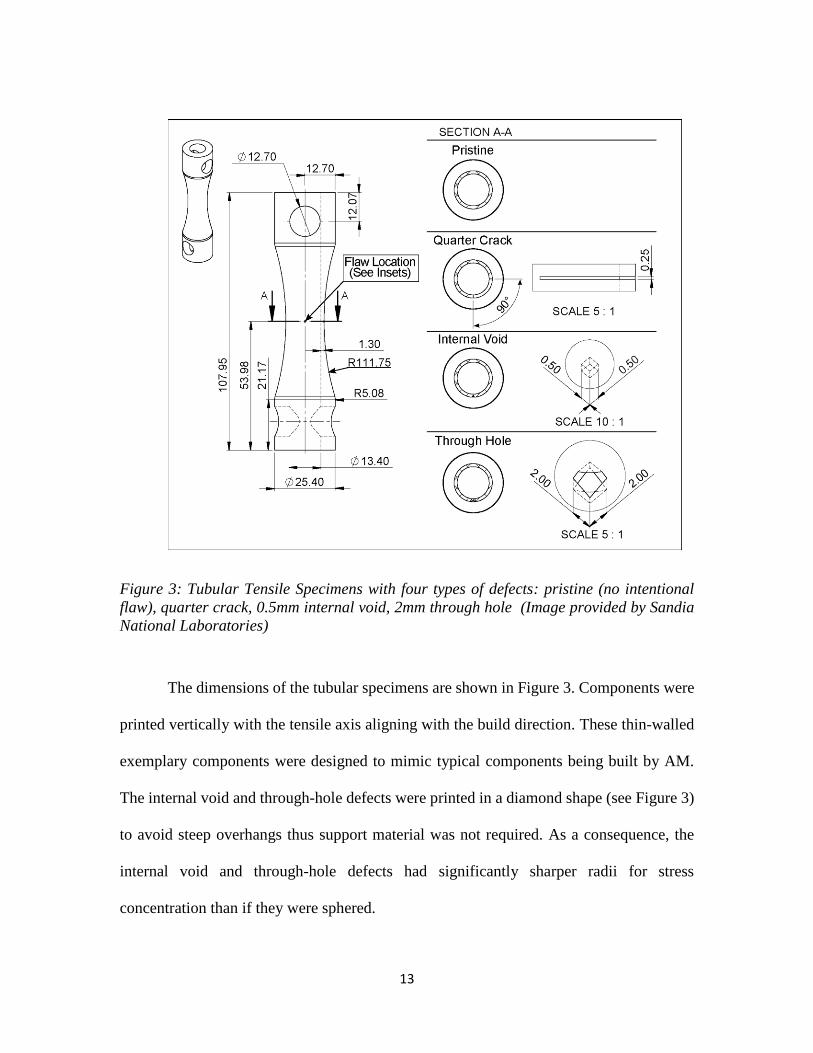
Figure 3: Tubular Tensile Specimens with four types of defects: pristine (no intentional
flaw), quarter crack, 0.5mm internal void, 2mm through hole (Image provided by Sandia
National Laboratories) ...................................................................................................... 13
Figure 4: Fracture toughness specimen dimensions (inches) ........................................... 14
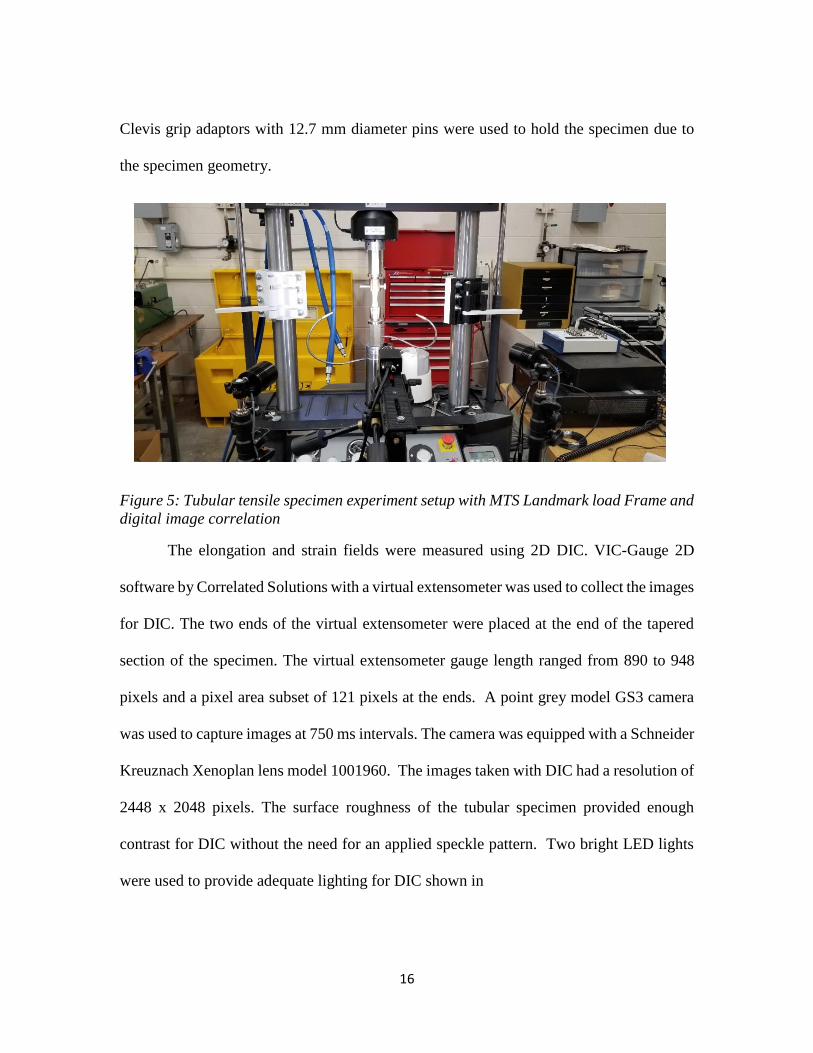
Figure 5: Tubular tensile specimen experiment setup with MTS Landmark load Frame and
digital image correlation ................................................................................................... 16
Figure 6: Compression platen tooling dimensions (inches) used in compression testing 19
Figure 7: Force-displacement results for SS 316L tubular specimen with intentionally
manufactured defects in the sidewall. ............................................................................... 20
Figure 8: AlSi10Mg force-displacement results for each build plate. A) As-built build plate
A AlSi10MG B) As-built build plate B AlSi10Mg C) As-built build plate C AlSi10Mg D)
Heat-treated build plate A AlSi10Mg E) Heat-treated build plate B AlSi10Mg F) Heat-
treated build plate C AlSi10Mg ........................................................................................ 22

viii
Figure 9: Fractography images of the fracture surface of the as-built AlSi10Mg pristine
specimens build plate A, B, and C .................................................................................... 27
Figure 10: Fractography images of the fracture surface at manufactured defects in SS 316L
and build plate A AlSi10Mg specimens A) SS 316L internal void highlighted in the red
triangle. B) SS 316 through hole C) SS 316L quarter crack transition line between fracture
surface and manufactured quarter crack defect D) AlSi10Mg internal void highlighted in
the red triangle E) AlSi10Mg through hole F) AlSi10Mg quarter crack defect surface G)
Heat-treated AlSi10Mg internal void highlighted in the red triangle H) Heat-treated
AlSi10Mg through hole I) Heat-treated AlSi10Mg quarter crack transition area shown
between the red lines ......................................................................................................... 28
Figure 11: Quarter crack defect surface of SS 316L and AlSi10Mg. Bridging on the quarter
crack defects surface is circled in red. .............................................................................. 29
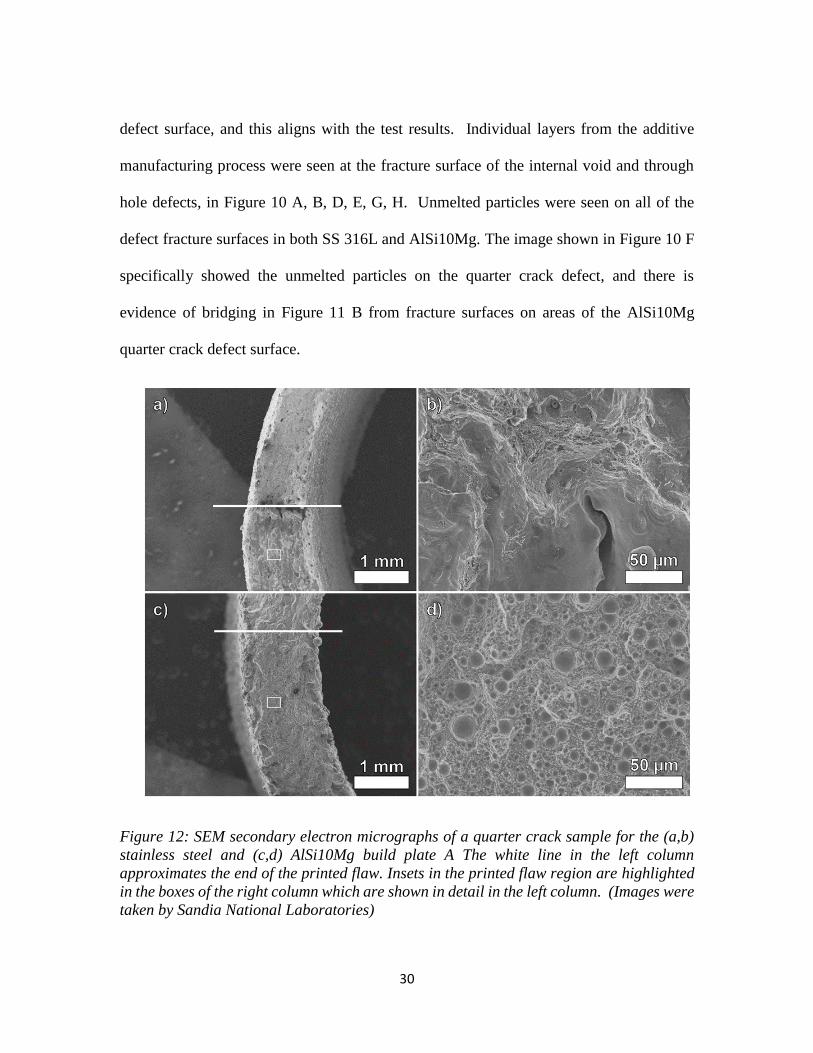
Figure 12: SEM secondary electron micrographs of a quarter crack sample for the (a,b)
stainless steel and (c,d) AlSi10Mg build plate A The white line in the left column
approximates the end of the printed flaw. Insets in the printed flaw region are highlighted
in the boxes of the right column which are shown in detail in the left column. (Images
were taken by Sandia National Laboratories) ................................................................... 30
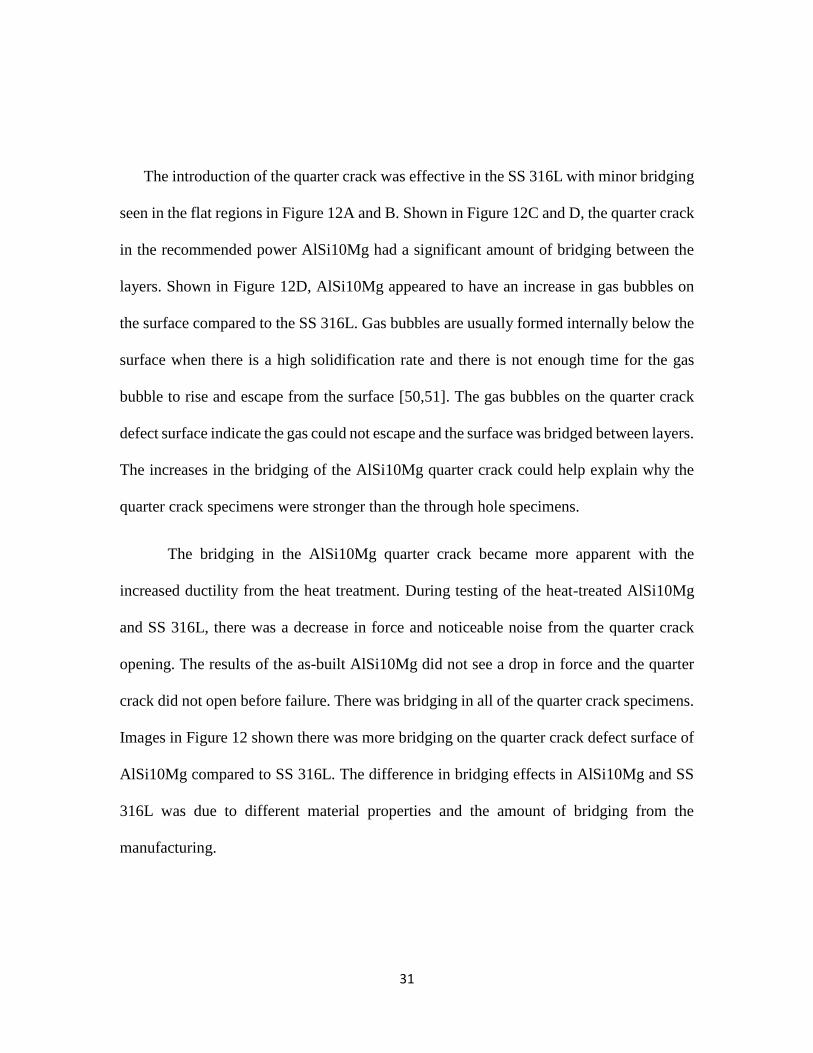
Figure 13: Fractography images of AlSi10Mg build plate C comparing internal void and
pristine specimens. ............................................................................................................ 32

ix
LIST OF TABLES
Table 1 - Average relative density measurement (ASTM B311) of AlSi10Mg with build
plate A laser power (370W), build plate B laser power (277.5W) and build plate C laser
power (185W) as well as the 316 L comparator build. ....................................................... 9
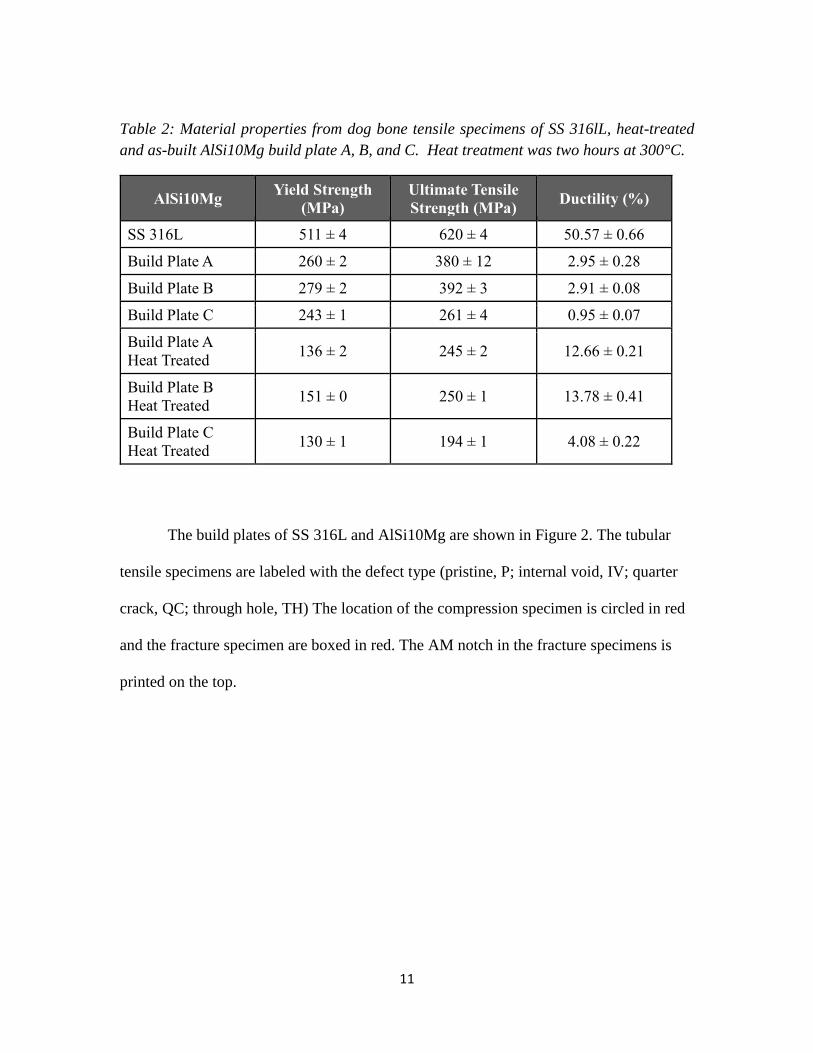
Table 2 - Material properties from dog bone tensile specimens of SS 316lL, heat-treated
and as-built AlSi10Mg build plate A, B and C. Heat treatment was two hours at 300°C.
........................................................................................................................................... 11
Table 3- Average maximum force of AlSi10Mg and SS 316L tubular tensile specimens
with intentionally manufactured defects in the sidewall................................................... 24
Table 4 -Average elongation of AlSi10Mg and SS 316L tubular tensile specimens with
intentionally manufactured defects in the sidewall ........................................................... 25
Table 5: AM SS316L Fracture Toughness Results........................................................... 33
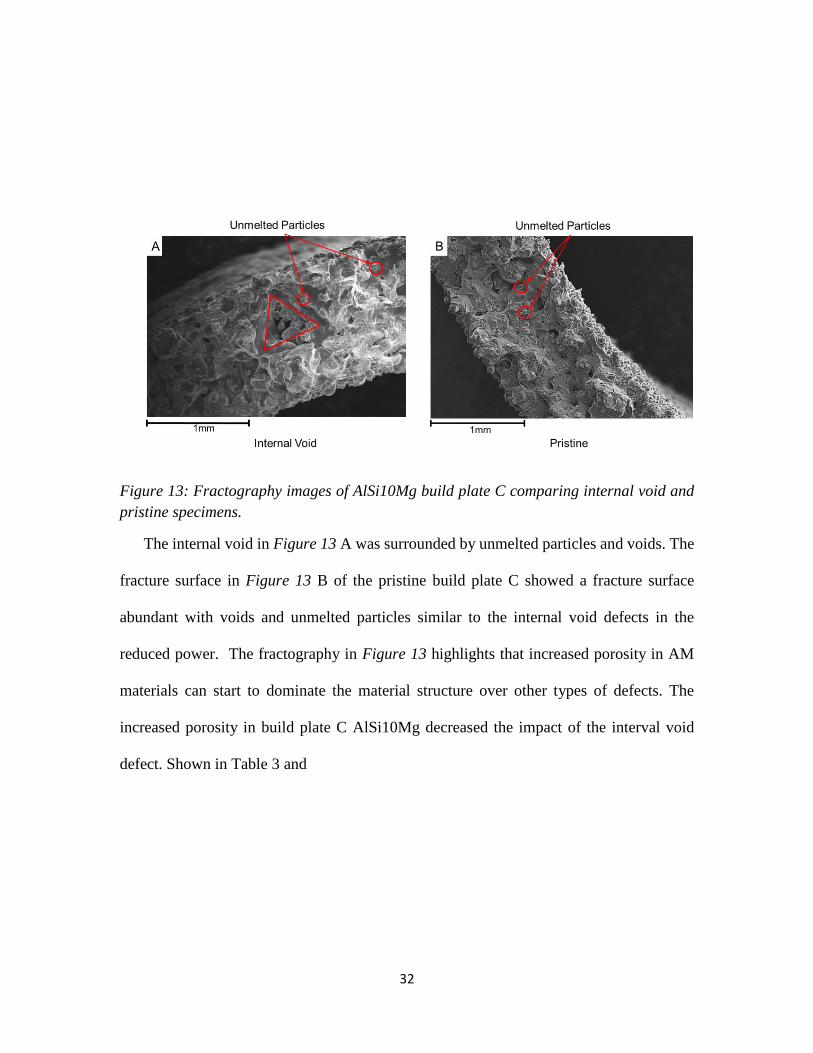
Table 6: AM AlSi10Mg Fracture Toughness Results Heat Treated ................................. 34
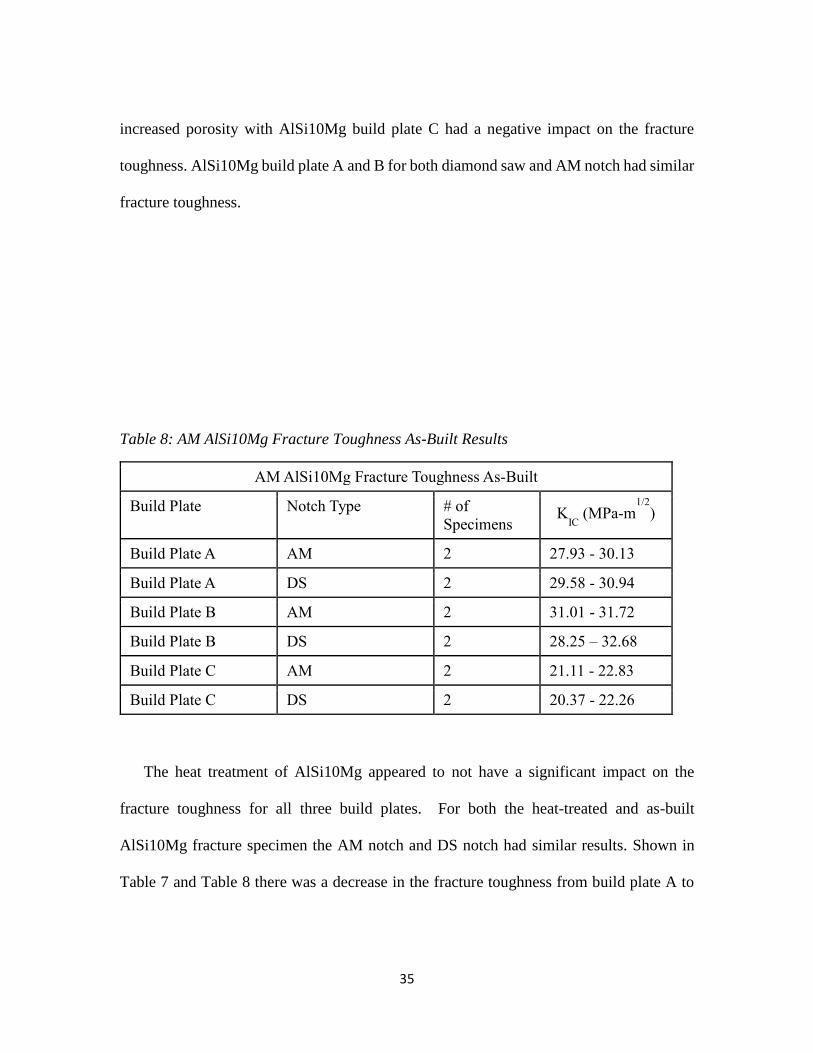
Table 7: AM AlSi10Mg Fracture Toughness As-Built Results ........................................ 35
Table 8: AM SS 316L Compression Results .................................................................... 36
Table 9: AM AlSi10Mg Compression Results ................................................................. 37
1
1. Chapter 1: Introduction
1.1 Motivation
Additive manufacturing (AM) is becoming increasingly popular in industries such
as automotive, medical, energy, and aerospace, because of the flexibility and customization
over traditional manufacturing methods [1,2]. For the past five years, there has been a 40%
growth in the sale of AM powdered metal alloys [3]. ASTM has developed standards for
describing AM in terms of geometry, tolerances, and nomenclature, but there is not a
defined standard for critical defect sizes and porosity level for any AM material in terms
of quality control [4–7]. A critical defect-porosity relationship needs to be determined to
qualify AM metal components for safe use.
Understanding how the build height and location affect the material properties is
also important for characterizing AM material for safe use. The effects of the build plate
height and location have been studied, but the observations and conclusions vary for each
study and material [8–10]. In a study on AM SS 304, results concluded components closer
to the build plate height had finer grain size and increased mechanical properties [10]. In
another study on AM Inconel 718 components, the build height had no significant effect
on the material properties[9]. This thesis investigates the effect of build plate height and
location for SS 316L and AlSi10Mg.
When making components it is essential that the material properties meet a certain
standard for design. Knowing the fracture toughness for thin complex AM structural

2
components is critical for designing against catastrophic failure. As the thickness decreases
the apparent fracture, toughness generally increases and above a certain thickness, the
apparent fracture toughness is constant [11]. The effect of porosity on the fracture
toughness of AM parts can provide additional information on the influence of porosity on
the mechanical behavior for AM metals. The diamond saw and AM notches were studied
to compare the effects of the manufacturing method to produce the notch.
Defects will be present in AM components and it is important to be able to qualify
the size and shape of defects for safe-use. The function and safety of components could
be put at risk if the mechanical properties are lower than required. A critical porosity
manufactured defect relationship which can qualify components for safe use needs to be
developed. Once this porosity manufactured defect relationship is established, methods
such as computed tomography (CT) and acoustic resonance testing can be used to identified
components safe for use [12,13]. The goal of this thesis project is to move the field closer
to an understanding of this material-defect-porosity relationship.
1.2 Research Questions
Additive manufacturing has become increasingly popular in commercial applications.
Defects will always occur with AM and will be a concern for qualify components for safe-
use. The focus of the thesis is expanding the understanding of the ductility-defect-porosity
relationship in AM metals.
1. What is the relationship between porosity, geometric defects and ductility for AM
metals?

3
2. What level of the ductility-defect-porosity relationship understanding is needed to
qualify AM components for safe use?
3. What knowledge about stress concentrations and ductility for conventional metals
can also be applied to AM metals?
4. How does porosity and type of notch affect the fracture toughness of single edge
notch AlSi10Mg and SS 316L fracture toughness specimens?
5. How does spatial location (height, build plate location) affect the material
properties of AM SS 316L and AM AlSi10Mg in compression?
1.3 Background
Additive manufacturing is fundamentally different from traditional, subtractive
manufacturing methods, as the material is added layer by layer to build the component.
Complex geometries and custom components are possible with AM that would have been
cost-prohibitive or impossible with traditional manufacturing methods. AM can produce a
near-net shape compared to traditional manufacturing methods that might use multiple
machines and tooling [1]. Using AM can drastically reduce the tooling cost and lead time
to make low production and custom component [1,14]. There is a variety of AM process
and they each have unique benefits and advantages.
Most metal AM processes fall into three categories: powder bed systems, powder
feed systems, and wire feed systems [15,16]. In a powder bed system, metal powder is
spread out over the bed and a laser melts the powder layer by layer [15–17]. In a powder
feed system, metal powder is fed throw a nozzle, and the powder is melted by a laser on to
the component and built layer by layer [15,16]. In a wire feed system, the metal wire is fed

4
into the laser beam or energy source to metal the wire and the component is built up layer
by layer [16].
One type of powder bed metal AM, and the process used in this study is selective
laser melting (SLM). SLM is a popular AM method for producing aluminum and stainless
steel alloys [18] [19]. SLM is a powder bed additive manufacturing process that uses a
high-intensity laser to melt powder metal together layer by layer to build a component
[17,20,21]. This study focused on ductile SS 316L, moderate-ductility heat-treated
AlSi10Mg, and brittle as-built AlSi10Mg tubular tensile specimen produced with SLM to
compare the material behavior of ductile and brittle AM materials with intentionally
manufactured defects
Geometric defects can occur internally in AM materials because of the layer by
layer manufacturing process. Some common defects in AM components include gas
bubbles, voids from lack of fusion, keyhole porosity, surface skin defects such as roughness
and cracks, and layer separation [22,23]. Voids are individual defects formed throughout
the AM material and reduce the density and can lead to premature failure. Porosity is a
term for the decrease in the overall relative density of the material from the formation of
voids which comes either lack of fusion induced, gas-induced or keyhole induced [23].
Porosity can be powder-induced, process-induced, or an artifact of solidification [20]. To
complicate the matter, there are multiple variables at play during the building process
creating a complex process-property relationship that must be optimized for the specific
material and individual build. Studies on optimizing the processing parameters, including
laser power, scan speed, and hatch distance, have shown a decrease in overall porosity and

5
material variability [24–26]. Layer separation or delamination is the separation of adjacent
layers, because of incomplete melting between layers [20]. Cracking can occur in AM from
unmelted particles between layers. Thermal gradients can also cause cracks to form [22].
Nevertheless, because of the complexity in optimizing parameters, it is expected that
internal porosity in these materials will continue to be a present feature well into the
evolution of this technology.
Voids can be caused by a combination of different build parameters, and there are
three types of mechanisms that have been identified by which void defects are produced
[23]. First, at very high power density, deposition, or melting, AM may be performed in
keyhole mode. With poor control, the keyhole can be unstable, collapse, and entrap vapor.
If the applied power, scan speed, and beam size are above a certain value, spatter injection
may occur in a process called keyhole formation [20]. In keyhole formation, the power
density is high enough to cause evaporation of the metal and the formation of plasma. Metal
evaporation causes the development of a vapor cavity. The collapse of the cavity can leave
a void in the wake of the laser beam [27]. Second, gas can be entrapped inside the powder
particles during the powder atomization process. The entrapped gas cause gas pores. Gas
pores may also be caused by the entrapment of shielding gas or alloy vapors inside the melt
pool. Third, lack of fusion defects can be caused by inadequate penetration of the molten
pool into either the substrate or into the previous layer [23]. When there is not enough laser
power to melt the powder lack of fusion can occur which results in porosity and unmelted
particles. Lack of fusion regions may be identifiable by un-melted powder particles in or
6
near the pore [20]. Each of these types of voids can be caused by incorrect laser power and
contamination in the material.
AM can be used with numerous powder metals alloys including stainless steel,
aluminum alloys, and titanium alloys [25,28]. It is critical to know how each type of defect
affects different materials. Typically, brittle metals are generally more sensitive to stress
concentrations and have rapid crack propagation compared to ductile metals [11]. The
effects of defects on powder metal AM materials may not be consistent across all AM
metals and may not align with ductile and brittle wrought metals. It is important to
understand how defects affect the material behavior of AM materials. Identifying the
critical defect size and type of defect is vital for quality control and reliability prediction
of AM components. By knowing the critical defect type and size for each AM material,
techniques can be taken to inspect for these defects. Geometric defects in AM can be stress
concentrations that could be an initial site for crack growth and lead to failure.
In this study, AM metal specimens were studied to investigate the ductility-defect-
porosity relationship, the effect of spatial location on the build plate, and fracture toughness
of thin AM specimen. Geometric defects (internal voids, through-holes, and quarter
cracks) were intentionally manufactured in AlSi10Mg and SS316L tubular tensile
specimens using SLM to observe the effect of porosity, geometric defects, and ductility on
the mechanical behavior. Fracture toughness specimens were studied to evaluate effective
fracture toughness on thin AM specimens with AM notches and diamond saw notches at
different porosity levels. Compression specimens were studied to observe the impact the
distance from the build plate and location on the build had on the material properties. There
7
have been studies on the effect of build plate location on the material properties of powder
bed AM materials [29]. Smaller grain sizes have been observed closer to the build plate,
resulting in better material properties compared to further away from the build plate for SS
304 [30,31].
The two materials, SS 316L and AlSi10Mg, were chosen based on their expected
mechanical behavior ranging from relatively brittle in the case of the aluminum material to
relatively ductile in the case of the stainless steel. Furthermore, the effect of relative
material porosity induced from laser power levels was varied at three levels in the
AlSi10Mg specimens. It is known that bulk porosity will also affect the overall ductility of
a material [32,33], yet it is unclear how the geometry of a key defect will interact will the
bulk porosity. This study helps define the relationship between defects, porosity, and
ductility of AM SS316L and AlSi10Mg and compares this relationship to conventional
metals.
2. Chapter 2: Materials
2.1 Materials and Characterization
AM SS 316L and AM AlSi10Mg were the two materials studied to represent a
ductile material and a brittle material. SS 316L and AlSi10Mg are two common metals
used for direct metal laser sintering (DMLS) [34]. The SS 316L specimens were produced
on a single build plate in a Renshaw AM 400 operating at a nominal laser power of 200W
and a hatch distance of 0.06 mm. Three different build plates of AlSi10Mg were produced

8
on an EOS M290 with a laser speed of 1300 mm/s and a hatch distance of 0.19 mm, each
with a different laser power output.
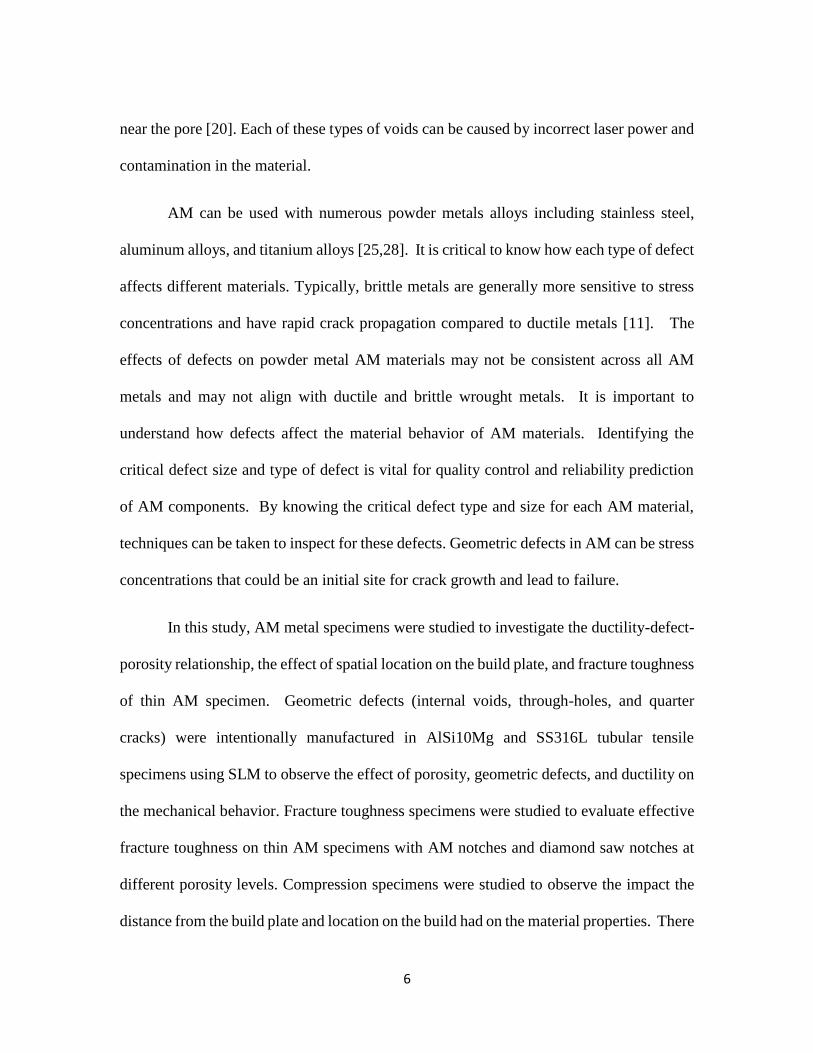
AlSi10Mg build plates A, B, and C were manufactured at different laser power
levels. Build plate A was at 370 W; the recommended operating parameter from the
manufacturer. Build plate B and build plate C reduced the laser power to 227.5W (75%
reduction) and 185W (50% reduction) of the first build, respectively. The goal of reducing
laser output was to observe the effect this would have on the overall porosity; and thus,
criticality of additional intentionally introduced geometric flaws. The relative change in
laser power induced porosity can be seen in the fracture surface of dog bone specimens in
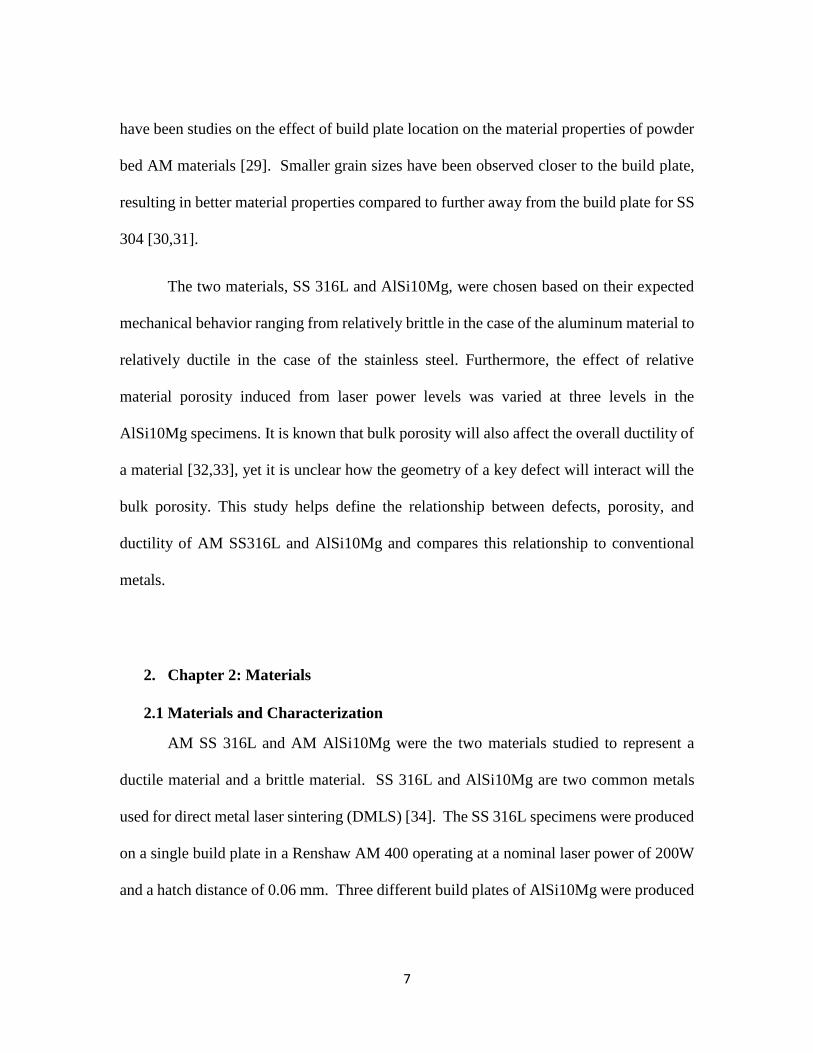
Figure 1. The relative density in Table 1 was calculated using the Archimedes method
with water and a basket support arrangement to follow ASTM standard B311[35]. The
density measurement of each build plate was an average of four square column specimens
that were printed beside the tubular tensile specimens. The middle section of the
compression specimen which had a similar height to the defect in the tubular tensile
specimens was used for the density measurements. The density of 2.67 g/cm3 was used for
the fully dense AlSi10Mg in the calculation for the relative density [36], while the SS316L
assumed a full density of 7.99 g/cm3 [37]. The density measurement for build plate C was
outside the two percent porosity as defined in the ASTM standard B311 [35].
It is common to heat treat AlSi10Mg to increase ductility with a trade-off of
strength [36,38]. As a worst-case scenario of limited ductility, some engineered tubular
specimens were not heat-treated in the present study. The remaining tubular AlSi10Mg
specimens were heat-treated to provide a material that was used in real-world applications
9
and had a ductility between SS 316L and the as-built AlSi10Mg. Heat treatment was
performed on a series of characterization coupons on the build plates to obtain baseline
material properties between the heat-treated and as-received states. The heat treatment
followed a common stress-relief annealing process of placing the samples at 300°C for 2
hours followed with a static air quench [39,40].
Figure 1: Images of the fracture surface of dog bone specimens from AlSi10Mg build plate
A, build plate B, and build plate C show the different levels of porosity (dark spots) and
build quality.
Table 1: Average relative density measurement (ASTM B311) of AlSi10Mg with build
plate A laser power (370W), build plate B laser power (277.5W) and build plate C laser
power (185W) as well as the 316 L comparator build.
Baseline mechanical testing was also performed by Sandia National Laboratories
on a variety of coupons from the build plates to fully characterize the mechanical behavior
before testing the engineered tubular specimens with intentional geometric defects.
Specimen Average Relative Density
Build Plate A AlSi10Mg 99.5 %
Build Plate B AlSi10Mg 99.3%
Build Plate C AlSi10Mg 94.9 %
316L Stainless Steel 99.2%
10
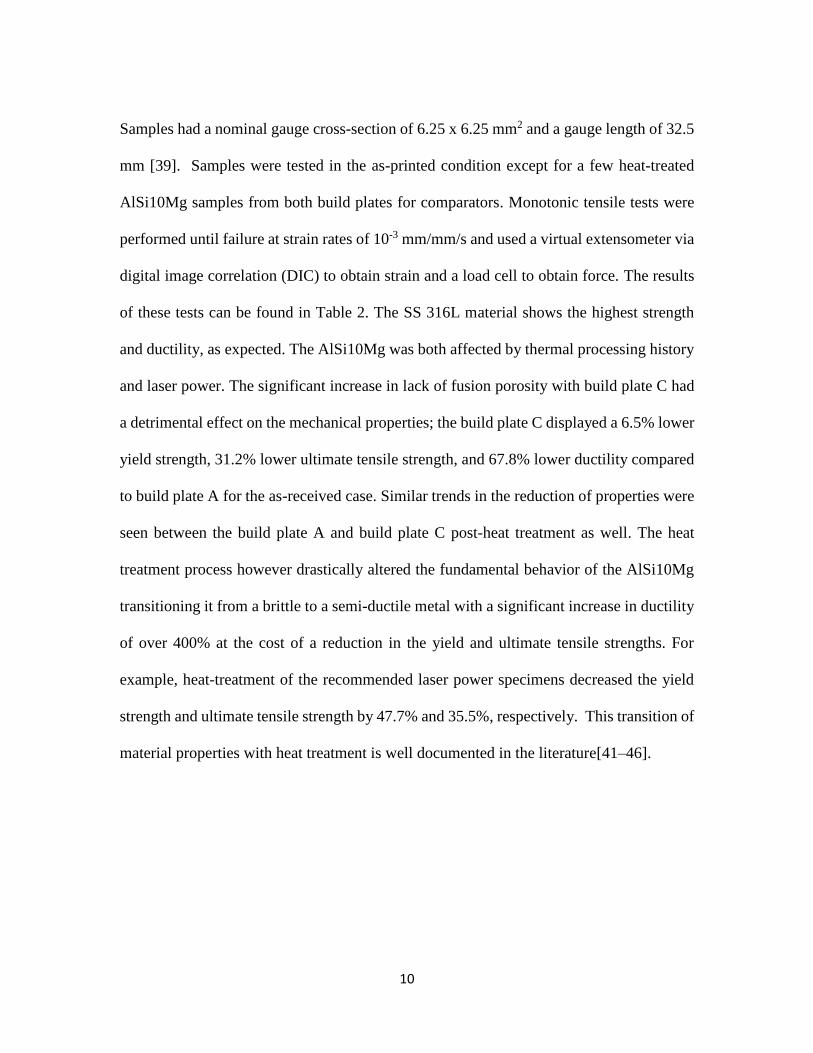
Samples had a nominal gauge cross-section of 6.25 x 6.25 mm2 and a gauge length of 32.5
mm [39]. Samples were tested in the as-printed condition except for a few heat-treated
AlSi10Mg samples from both build plates for comparators. Monotonic tensile tests were
performed until failure at strain rates of 10-3 mm/mm/s and used a virtual extensometer via
digital image correlation (DIC) to obtain strain and a load cell to obtain force. The results
of these tests can be found in Table 2. The SS 316L material shows the highest strength
and ductility, as expected. The AlSi10Mg was both affected by thermal processing history
and laser power. The significant increase in lack of fusion porosity with build plate C had
a detrimental effect on the mechanical properties; the build plate C displayed a 6.5% lower
yield strength, 31.2% lower ultimate tensile strength, and 67.8% lower ductility compared
to build plate A for the as-received case. Similar trends in the reduction of properties were
seen between the build plate A and build plate C post-heat treatment as well. The heat
treatment process however drastically altered the fundamental behavior of the AlSi10Mg
transitioning it from a brittle to a semi-ductile metal with a significant increase in ductility
of over 400% at the cost of a reduction in the yield and ultimate tensile strengths. For
example, heat-treatment of the recommended laser power specimens decreased the yield
strength and ultimate tensile strength by 47.7% and 35.5%, respectively. This transition of
material properties with heat treatment is well documented in the literature[41–46].
11
Table 2: Material properties from dog bone tensile specimens of SS 316lL, heat-treated
and as-built AlSi10Mg build plate A, B, and C. Heat treatment was two hours at 300°C.
AlSi10Mg Yield Strength
(MPa) Ultimate Tensile
Strength (MPa) Ductility (%)
SS 316L 511 ± 4 620 ± 4 50.57 ± 0.66
Build Plate A 260 ± 2 380 ± 12 2.95 ± 0.28
Build Plate B 279 ± 2 392 ± 3 2.91 ± 0.08
Build Plate C 243 ± 1 261 ± 4 0.95 ± 0.07
Build Plate A Heat Treated
136 ± 2 245 ± 2 12.66 ± 0.21
Build Plate B Heat Treated
151 ± 0 250 ± 1 13.78 ± 0.41
Build Plate C Heat Treated
130 ± 1 194 ± 1 4.08 ± 0.22
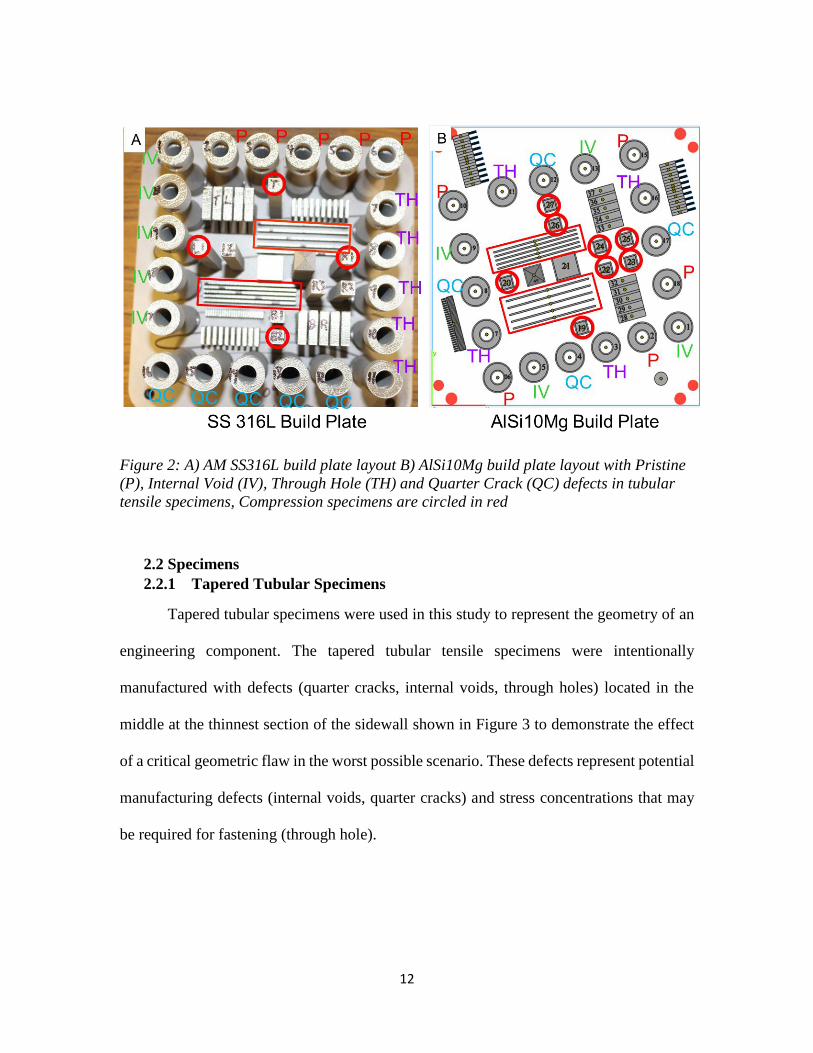
The build plates of SS 316L and AlSi10Mg are shown in Figure 2. The tubular
tensile specimens are labeled with the defect type (pristine, P; internal void, IV; quarter
crack, QC; through hole, TH) The location of the compression specimen is circled in red
and the fracture specimen are boxed in red. The AM notch in the fracture specimens is
printed on the top.
12
Figure 2: A) AM SS316L build plate layout B) AlSi10Mg build plate layout with Pristine
(P), Internal Void (IV), Through Hole (TH) and Quarter Crack (QC) defects in tubular
tensile specimens, Compression specimens are circled in red
2.2 Specimens
2.2.1 Tapered Tubular Specimens
Tapered tubular specimens were used in this study to represent the geometry of an
engineering component. The tapered tubular tensile specimens were intentionally
manufactured with defects (quarter cracks, internal voids, through holes) located in the
middle at the thinnest section of the sidewall shown in Figure 3 to demonstrate the effect
of a critical geometric flaw in the worst possible scenario. These defects represent potential
manufacturing defects (internal voids, quarter cracks) and stress concentrations that may
be required for fastening (through hole).
13
Figure 3: Tubular Tensile Specimens with four types of defects: pristine (no intentional
flaw), quarter crack, 0.5mm internal void, 2mm through hole (Image provided by Sandia
National Laboratories)
The dimensions of the tubular specimens are shown in Figure 3. Components were
printed vertically with the tensile axis aligning with the build direction. These thin-walled
exemplary components were designed to mimic typical components being built by AM.
The internal void and through-hole defects were printed in a diamond shape (see Figure 3)
to avoid steep overhangs thus support material was not required. As a consequence, the
internal void and through-hole defects had significantly sharper radii for stress
concentration than if they were sphered.
14
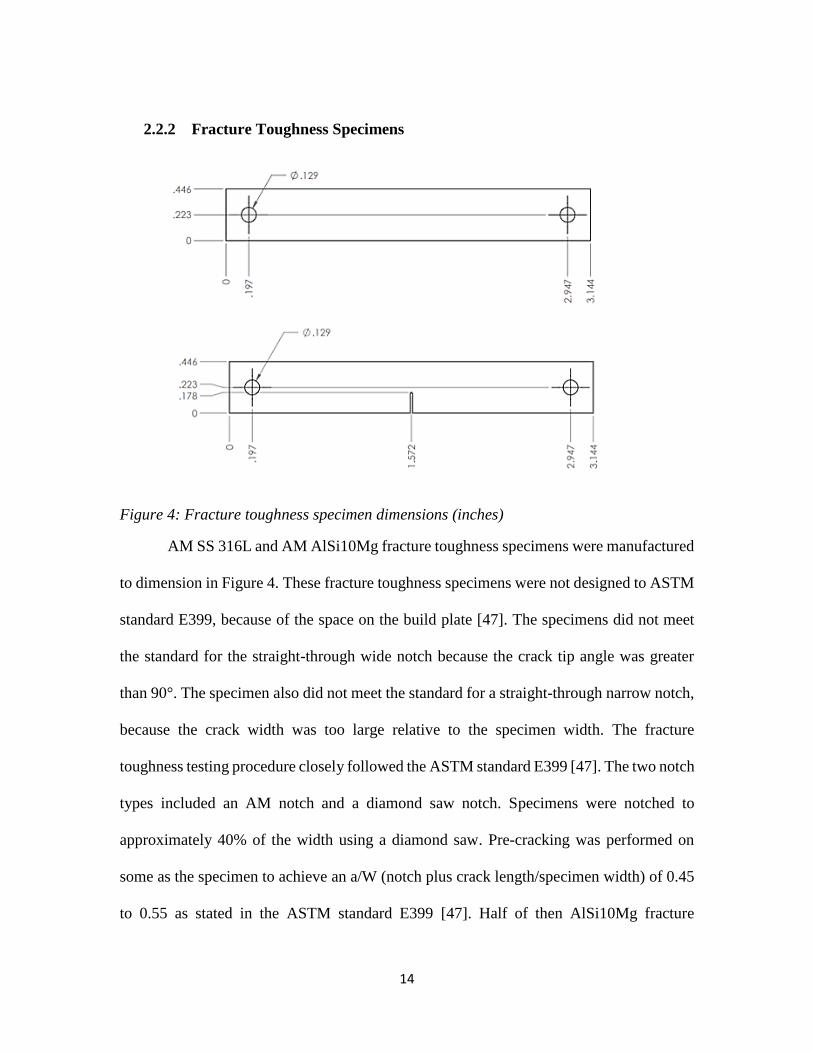
2.2.2 Fracture Toughness Specimens
Figure 4: Fracture toughness specimen dimensions (inches)
AM SS 316L and AM AlSi10Mg fracture toughness specimens were manufactured
to dimension in Figure 4. These fracture toughness specimens were not designed to ASTM
standard E399, because of the space on the build plate [47]. The specimens did not meet
the standard for the straight-through wide notch because the crack tip angle was greater
than 90°. The specimen also did not meet the standard for a straight-through narrow notch,
because the crack width was too large relative to the specimen width. The fracture
toughness testing procedure closely followed the ASTM standard E399 [47]. The two notch
types included an AM notch and a diamond saw notch. Specimens were notched to
approximately 40% of the width using a diamond saw. Pre-cracking was performed on
some as the specimen to achieve an a/W (notch plus crack length/specimen width) of 0.45
to 0.55 as stated in the ASTM standard E399 [47]. Half of then AlSi10Mg fracture
15
toughness specimens were heat treated. The reported fracture toughness values are not
standard values for the AM 316 SS and AlSi10Mg but are still useful in studying as a
comparison of how notch types and how heat treatment and porosity of AlSi10Mg affect
the fracture behavior by comparing their effective fracture toughness values to each other.
2.2.3 Compression Specimens
AM SS 316L and AM AlSi10Mg bars with a cross-section of 10 mm by 10 mm
with an approximate length of 100 mm were manufactured. Each of the SS 316L bars and
AlSi10Mg bars were machined into five 20 mm long sections for the desired length ratio
of 2:1. The build plate location of the bars is circled in red in Figure 2. For both the
AlSi10Mg and SS 316l compression specimens, the section closed to the build plate was
labeled “1” and the furthest section from the build plate was labeled “5”. The specimens
were machined and leveled to 0.0005’’ with the accordance with ASTM standard E9-9
[48].
3. Chapter 3. Experimental Methods
3.1 Tubular Tensile Specimens
Monotonic tensile tests were performed on an MTS Landmark 370 hydraulic load
frame with a 100 kN load cell. Experiments were performed in displacement control at a
rate of 50 μm/s for SS 316L and 20 μm/s for AlSi10Mg until failure. Different strain rates
were used to ensure ample data points were collected because SS 316L was more ductile
than AlSi10Mg. Five SS 316L specimens were tested for each defect type. Three as-built
and one heat-treated AlSi10Mg specimens were tested for each defect type and build plate.
16
Clevis grip adaptors with 12.7 mm diameter pins were used to hold the specimen due to
the specimen geometry.
Figure 5: Tubular tensile specimen experiment setup with MTS Landmark load Frame and
digital image correlation
The elongation and strain fields were measured using 2D DIC. VIC-Gauge 2D
software by Correlated Solutions with a virtual extensometer was used to collect the images
for DIC. The two ends of the virtual extensometer were placed at the end of the tapered
section of the specimen. The virtual extensometer gauge length ranged from 890 to 948
pixels and a pixel area subset of 121 pixels at the ends. A point grey model GS3 camera
was used to capture images at 750 ms intervals. The camera was equipped with a Schneider
Kreuznach Xenoplan lens model 1001960. The images taken with DIC had a resolution of
2448 x 2048 pixels. The surface roughness of the tubular specimen provided enough
contrast for DIC without the need for an applied speckle pattern. Two bright LED lights
were used to provide adequate lighting for DIC shown in
17
Figure 5.
Fractography was performed at Clemson University’s Advanced Materials
Research Laboratory with a Hitachi SU 6600 SEM. Images were taken with accelerating
voltages of 20 kV. The fracture surface was examined on both SS 316L and AlSi10Mg
tubular tensile specimens for each type of defect and build plate.
3.2 Fracture Toughness Testing
Fracture toughness testing was performed using a MTS Landmark load frame.
Pinhole grips were inserted to the hydric grips on the load frame. The specimens were
loaded into the grips by lining up the specimen with the top pinhole grips and inserted a
pin. The actuator was moved up to align the bottom pinhole grip with the specimen. After
both pins were inserted into place, the load frame was set to load control of 0 N to make
sure there was no accidental loading on the specimen when tightening the plate on the
pinhole grips. Plates on the pinhole grips were used to friction clamp the fracture specimen.
In order to measure the fracture toughness, monotonic tensile experiments were
performed for each test with a known crack length. This crack length was measured by
taking the length of the crack in pixels and using the resolution of the point grey model
GS3 camera with a Navistar lens to obtain the crack length in meters. The initial notch and
crack were additionally measured after fracture using a microscope. The monotonic tensile
tests were performed in displacement control at a rate of 60 μm/s, or a strain rate of
approximately 10-3 s-1. An initial monotonic tensile test was run to establish a baseline for
the strength of the AM notch specimens. In order to test both the effect of an AM notch on
18
the fracture toughness compared to a diamond saw notch, and the effect of pre-cracking on
the fracture toughness compared to initial notches without pre-cracking, four types of tests
were performed: diamond saw notch (DS), diamond saw notch with pre-crack grown, AM
notch, and AM notch with pre-crack grown. Diamond saw notches were cut into the middle
virgin AM SS 316L and AlSi10Mg specimens (same locations as AM notch specimens) to
a length of approximately 40% of the width of the specimen. A monotonic test on a
diamond saw notch specimen was first performed. This established both an expected value
for fracture toughness of notched specimens and a baseline for the expected maximum load
that the notched specimens could handle. The SS316L fracture toughness testing was
performed by Joby Bartanus [49]. The resulting maximum stress was approximately 700
MPa for SS 316L and 190 MPa for AlSi10Mg. Using this maximum load, a value of 350
MPa for SS316L and 95 Mpa for AlSi10Mg (50% expected max load) was determined to
be used as the max cyclic loading of specimens. Pre-cracking of the specimen was
performed by cyclically loaded at an R-value of 0.1 between 35 MPa and 350 MPa for the
SS316L and 9.5 MPa and 95 MPa or AlSi10Mg to ensure incidental compressive loading
was avoided. This was done for the diamond saw and AM notch pre-cracked specimens
while viewing the end of the notch through a camera until the crack tip grew and the total
crack length reached between 0.45W and 0.55W, according to ASTM standard.
19
3.3 Compression Testing
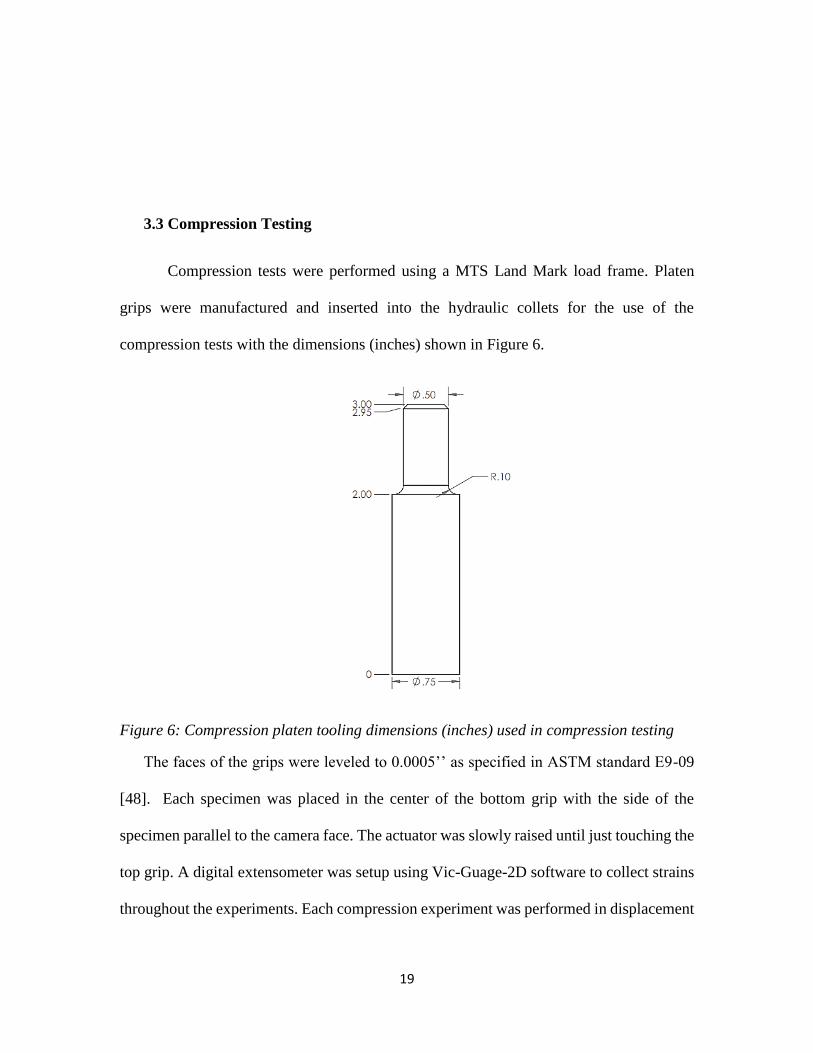
Compression tests were performed using a MTS Land Mark load frame. Platen
grips were manufactured and inserted into the hydraulic collets for the use of the
compression tests with the dimensions (inches) shown in Figure 6.
Figure 6: Compression platen tooling dimensions (inches) used in compression testing
The faces of the grips were leveled to 0.0005’’ as specified in ASTM standard E9-09
[48]. Each specimen was placed in the center of the bottom grip with the side of the
specimen parallel to the camera face. The actuator was slowly raised until just touching the
top grip. A digital extensometer was setup using Vic-Guage-2D software to collect strains
throughout the experiments. Each compression experiment was performed in displacement
20
control at 20 μm/s to a compressive strain of approximately 10%. A point grey model GS3
camera was used to capture images at 500 ms intervals. The images taken with DIC had a
resolution of 1900 x 1200 pixels. The rough surface finish from the additive manufacturing
process on the tubular specimen provided enough contrast for DIC without the need for an
applied speckle pattern. The testing of the 4 top and 4 bottom sections of the SS 316L
compression specimens was performed by Jody Bartanus [49]. Two bright LED lights were
used to provide adequate lighting for DIC.
4. Chapter 4: Results
4.1 Tubular Tensile Specimen Results
4.1.1 SS 316L Tubular Tensile Specimens Results
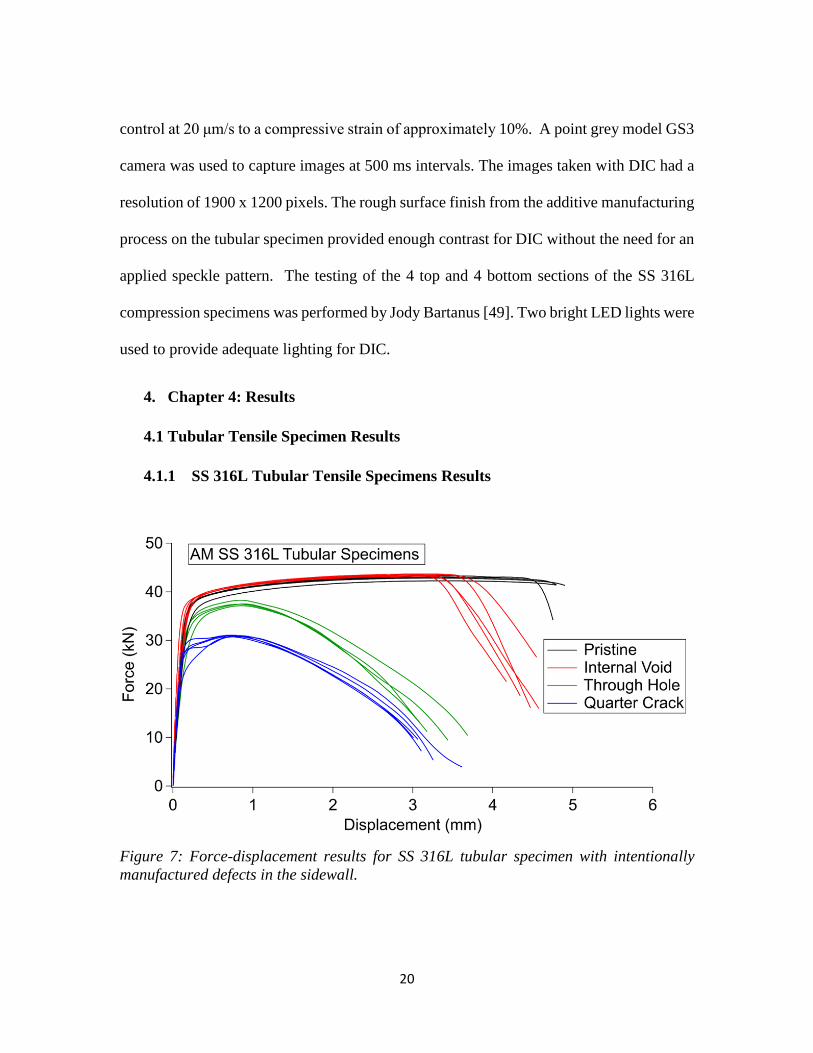
Figure 7: Force-displacement results for SS 316L tubular specimen with intentionally
manufactured defects in the sidewall.

21
Force/displacement results of tensile tests on all SS 316L tubular components are
displayed in Figure 7. The flawed specimens exhibited ductility and softening after peak
load. The pristine specimen exhibited less softening before failure. Tubular specimens with
internal voids had similar strength to the pristine specimens with an average maximum
force of 43.47 ± 0.15 kN compared to 42.90 ± 0.42 kN. The internal void in the SS 316L
specimens decreased the overall ductility of the component, resulting in a reduction of 6%
average elongation compared to the pristine counterparts, reducing from 5.01 ± 0.22 mm
to 4.71 ± 0.27 mm. Quarter crack specimens were the weakest with an average maximum
force of 31.12 ± 0.22 kN followed by the through-hole specimens with an average
maximum force of 38.01 ± 0.71 kN. During testing, the quarter crack specimens had an
audible ‘pop’ when the quarter crack opening up and a drop in force was measured. The
overall decrease in elongation to failure of samples containing these two flaws were
significant compared to the pristine case and ranged between 3 to 4 mm. Overall,
intentionally manufactured defects decreased the strength and ductility in AM SS 316L
tubular tensile specimens. The reduced strength and ductility correlated to a reduction in
cross-sectional area from each defect starting with pristine, internal void, through hole and
quarter crack which was the weakest and least ductile.
22
4.1.2 AlSi10Mg Tubular Tensile Specimen Results
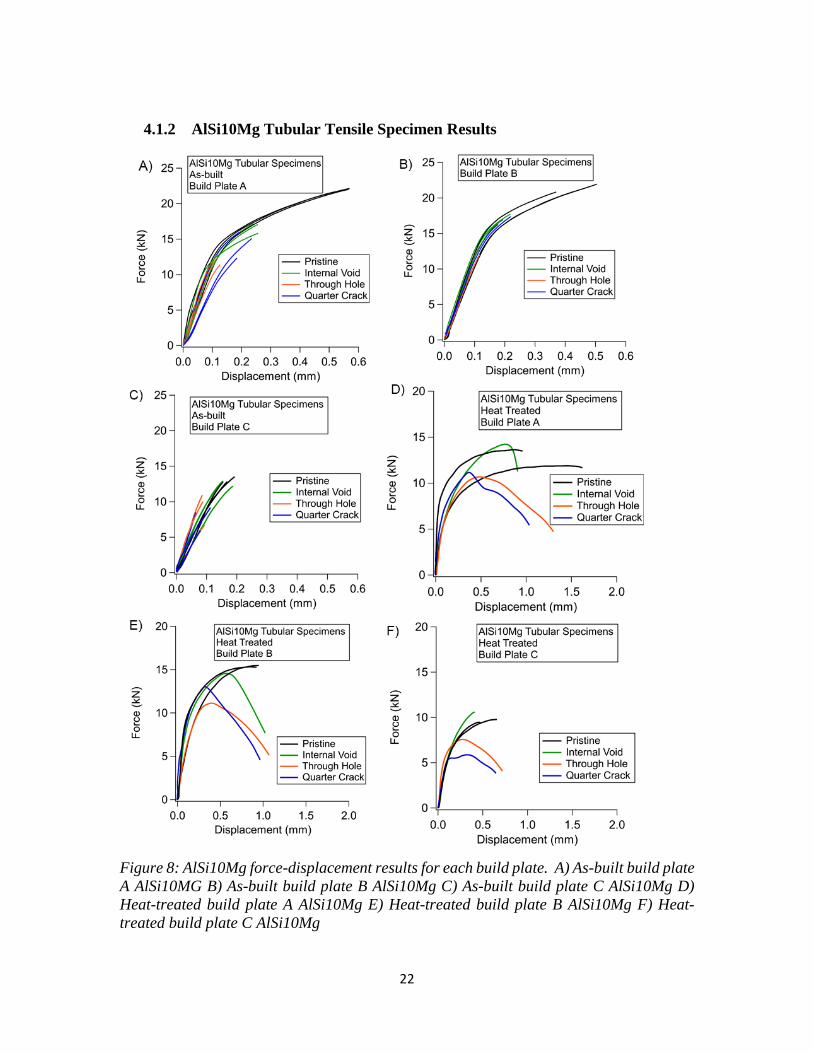
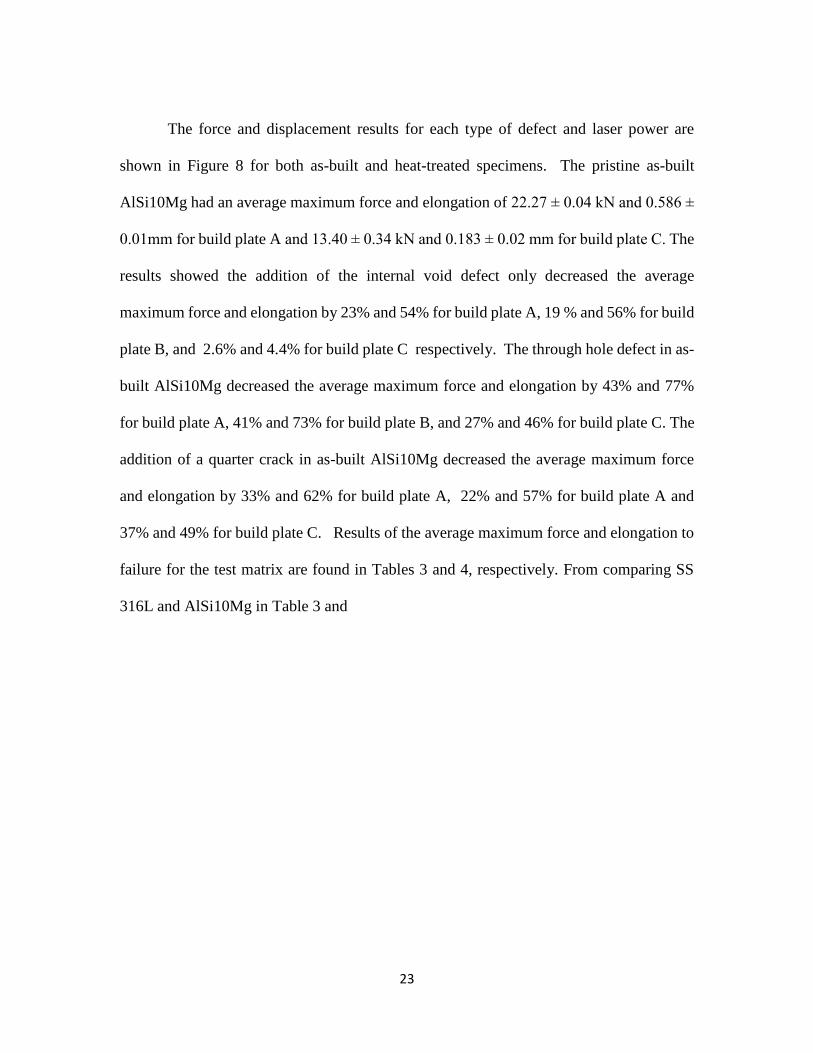
Figure 8: AlSi10Mg force-displacement results for each build plate. A) As-built build plate
A AlSi10MG B) As-built build plate B AlSi10Mg C) As-built build plate C AlSi10Mg D)
Heat-treated build plate A AlSi10Mg E) Heat-treated build plate B AlSi10Mg F) Heat-
treated build plate C AlSi10Mg
23
The force and displacement results for each type of defect and laser power are
shown in Figure 8 for both as-built and heat-treated specimens. The pristine as-built
AlSi10Mg had an average maximum force and elongation of 22.27 ± 0.04 kN and 0.586 ±
0.01mm for build plate A and 13.40 ± 0.34 kN and 0.183 ± 0.02 mm for build plate C. The
results showed the addition of the internal void defect only decreased the average
maximum force and elongation by 23% and 54% for build plate A, 19 % and 56% for build
plate B, and 2.6% and 4.4% for build plate C respectively. The through hole defect in as-
built AlSi10Mg decreased the average maximum force and elongation by 43% and 77%
for build plate A, 41% and 73% for build plate B, and 27% and 46% for build plate C. The
addition of a quarter crack in as-built AlSi10Mg decreased the average maximum force
and elongation by 33% and 62% for build plate A, 22% and 57% for build plate A and
37% and 49% for build plate C. Results of the average maximum force and elongation to
failure for the test matrix are found in Tables 3 and 4, respectively. From comparing SS
316L and AlSi10Mg in Table 3 and

24
Table 4, the as-built AlSi10Mg specimens were more negatively affected by defects
compared to the SS 316L specimens.
Heat-treatment of AlSi10Mg pristine specimens decreased the average maximum
force and increased the average elongation by 42% and 125% for build plate A, 31% and
103 % for build plate B, and 23% and 253% for build plate C, respectively. The addition
of an internal void in the heat-treated AlSi10Mg changed the maximum force and the
elongation by +12% and -28% for build plate A and -2.3% and +18 % for build plate B,
and +3.9% and -33% for build plate C. The through hole in the heat-treated AlSi10Mg
changed the maximum force and the elongation by -19% and +2.2% for build plate A, -
33% and +17% for build plate B, and by -33% and +24% for build plate C. The quarter
crack in the heat-treated AlSi10Mg changed the maximum force and the elongation by -
10% and -18% for build plate A, -10% and +4% for build plate B, and by -41% and +10%
for build plate C. During the quarter crack specimen experiments, the crack opened with
an audible ‘pop’ and a drop in force was observed, similar to the SS 316L quarter crack
specimens.
Table 3: Average maximum force of AlSi10Mg and SS 316L tubular tensile specimens
with intentionally manufactured defects in the sidewall
Specimen Average Maximum Force (kN)
Pristine Internal Void Through Hole Quarter Crack
AlSI10Mg Build
Plate A
22.27 ±0.04 17.10 ± 0.65 12.74 ± 0.63 14.93 ± 1.54
AlSI10Mg Build
Plate B
21.75 ± 0.43 17.61 ± 0.35 12.92 ± 0.85 16.89 ± 0.58
AlSI10Mg Build
Plate C
13.40 ± 0.34 13.10 ± 0.17 9.78 ± 1.83 8.36 ± 1.40
25
SS 316L 42.90 ±0.43 43.47 ± 0.15 38.01 ± 0.71 31.12 ± 0.22
Table 4: Average elongation of AlSi10Mg and SS 316L tubular tensile specimens with
intentionally manufactured defects in the sidewall
Specimen Average Elongation (mm)
Pristine Internal Void Through Hole Quarter
Crack
AlSI10Mg Build
Plate A
0.586 ±
0.01
0.278 ± 0.01 0.136 ± 0.009 0.220 ±
0.024
AlSi10Mg Build
Plate B
0.474± 0.06 0.209 ± 0.02 0.127 ± 0.01 0.201 ± 0.03
AlSI10Mg Build
Plate C
0.183 ±
0.02
0.175 ± 0.02 0.099 ± 0.004 0.093 ±
0.022
SS 316L 5.01 ± 0.22 4.71 ± 0.27 3.76 ± 0.27 3.68 ± 0.22
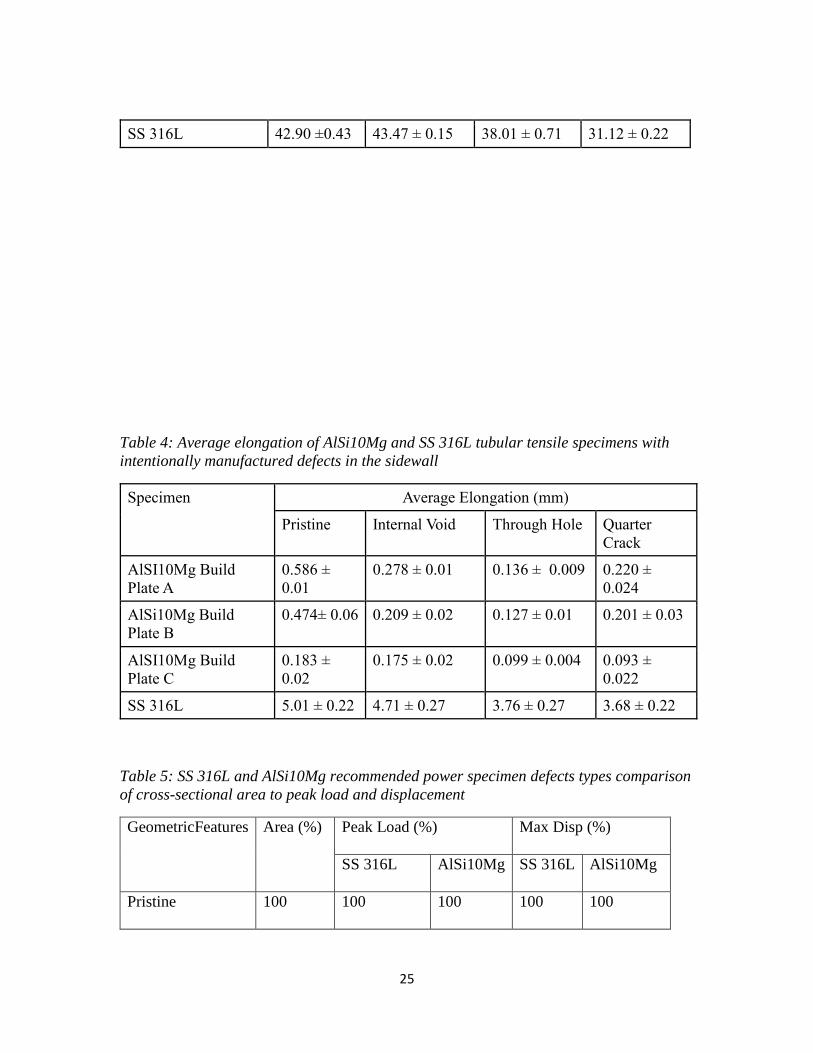
Table 5: SS 316L and AlSi10Mg recommended power specimen defects types comparison
of cross-sectional area to peak load and displacement
GeometricFeatures Area (%) Peak Load (%) Max Disp (%)
SS 316L AlSi10Mg SS 316L AlSi10Mg
Pristine 100 100 100 100 100
26
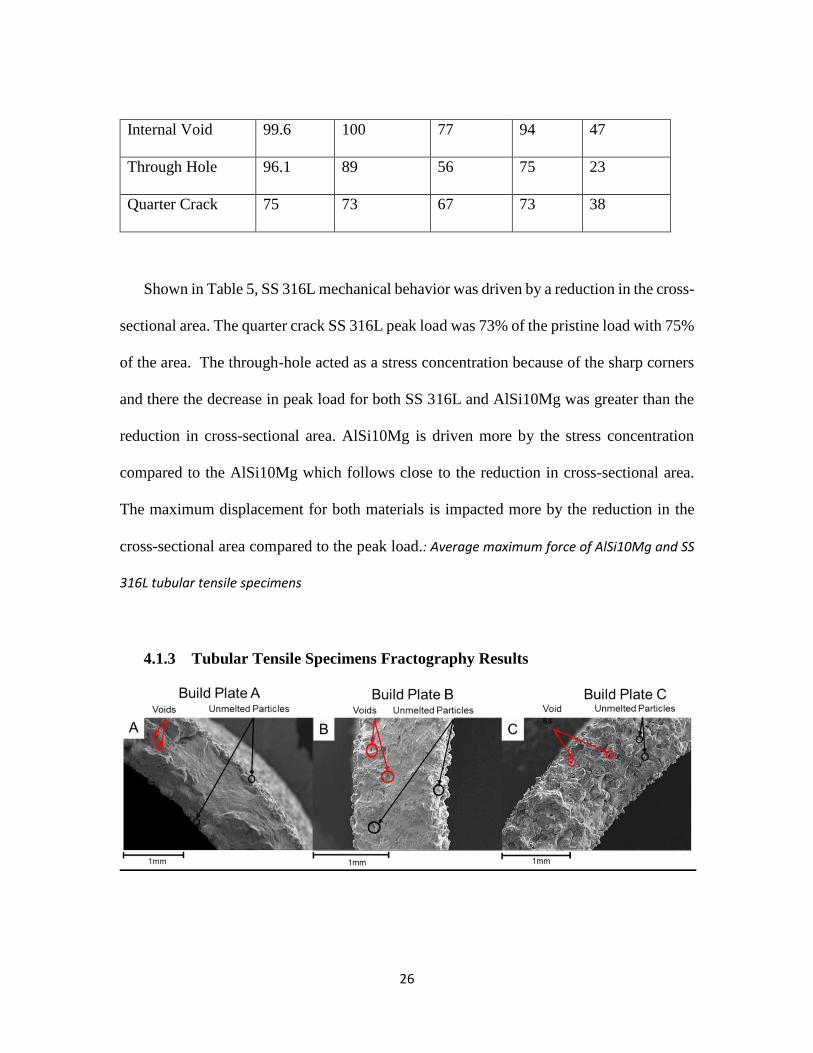
Internal Void 99.6 100 77 94 47
Through Hole 96.1 89 56 75 23
Quarter Crack 75 73 67 73 38
Shown in Table 5, SS 316L mechanical behavior was driven by a reduction in the cross-
sectional area. The quarter crack SS 316L peak load was 73% of the pristine load with 75%
of the area. The through-hole acted as a stress concentration because of the sharp corners
and there the decrease in peak load for both SS 316L and AlSi10Mg was greater than the
reduction in cross-sectional area. AlSi10Mg is driven more by the stress concentration
compared to the AlSi10Mg which follows close to the reduction in cross-sectional area.
The maximum displacement for both materials is impacted more by the reduction in the
cross-sectional area compared to the peak load.: Average maximum force of AlSi10Mg and SS
316L tubular tensile specimens
4.1.3 Tubular Tensile Specimens Fractography Results

27
Figure 9: Fractography images of the fracture surface of the as-built AlSi10Mg pristine
specimens build plate A, B, and C
In Figure 9A, there was a brittle fracture in the build plate A AlSi10Mg and a few
identified internal voids and unmelted particles in the interior of the fracture surface. In
build plate C in Figure 9C, the fracture surface was comprised of voids and unmelted
particles. The increase of voids and unmelted particles was seen in all build plate C
AlSi10Mg tubular tensile specimens. Reducing the manufacturing laser power resulted in
an increase in porosity with a relative density of 94.9% and a decrease in average maximum
force by 40% of the recommended power pristine specimens. The increase in porosity in
the reduced power negatively affected the strength and ductility of the AlSi10Mg
specimens. Build plate B had a relative density of 99.2% and has similar strength to build
plate A.
28
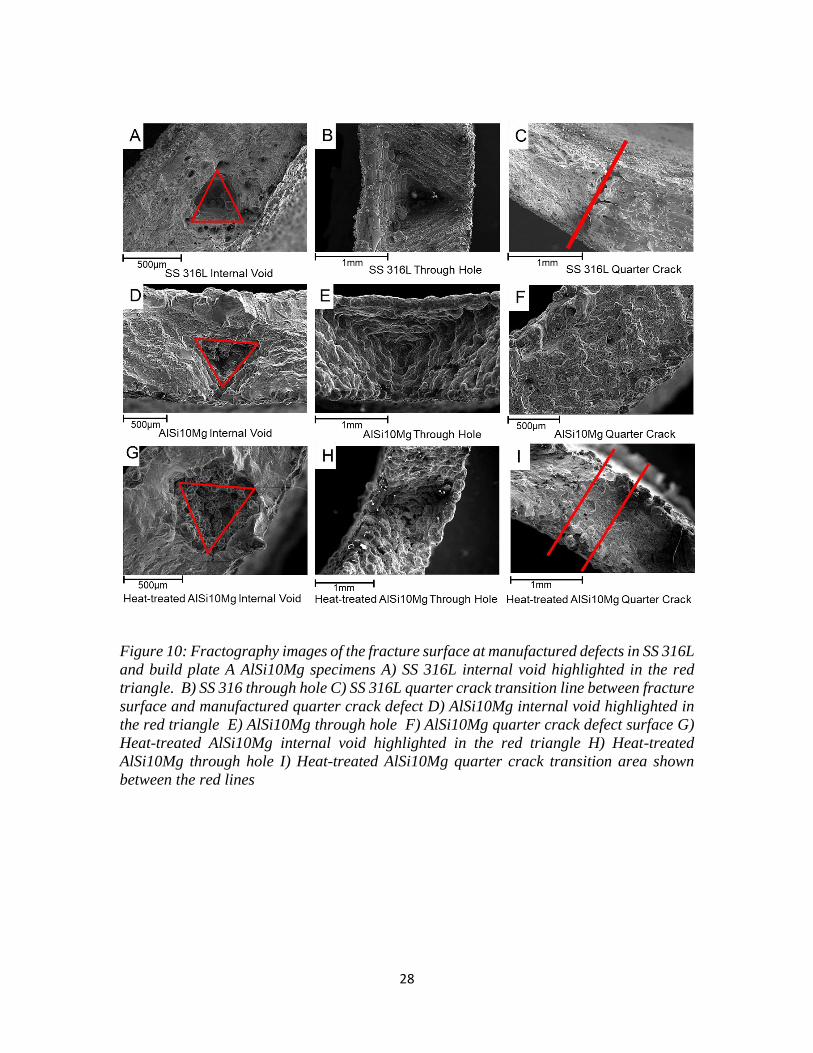
Figure 10: Fractography images of the fracture surface at manufactured defects in SS 316L
and build plate A AlSi10Mg specimens A) SS 316L internal void highlighted in the red
triangle. B) SS 316 through hole C) SS 316L quarter crack transition line between fracture
surface and manufactured quarter crack defect D) AlSi10Mg internal void highlighted in
the red triangle E) AlSi10Mg through hole F) AlSi10Mg quarter crack defect surface G)
Heat-treated AlSi10Mg internal void highlighted in the red triangle H) Heat-treated
AlSi10Mg through hole I) Heat-treated AlSi10Mg quarter crack transition area shown
between the red lines
29
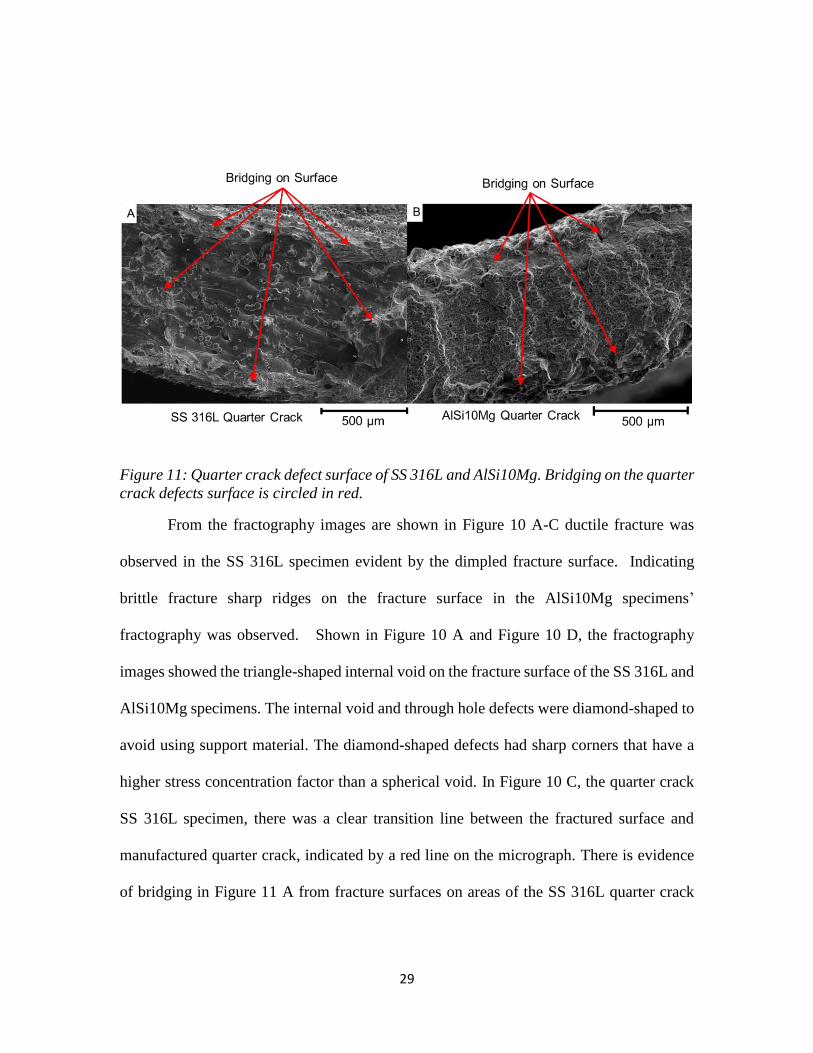
Figure 11: Quarter crack defect surface of SS 316L and AlSi10Mg. Bridging on the quarter
crack defects surface is circled in red.
From the fractography images are shown in Figure 10 A-C ductile fracture was
observed in the SS 316L specimen evident by the dimpled fracture surface. Indicating
brittle fracture sharp ridges on the fracture surface in the AlSi10Mg specimens’
fractography was observed. Shown in Figure 10 A and Figure 10 D, the fractography
images showed the triangle-shaped internal void on the fracture surface of the SS 316L and
AlSi10Mg specimens. The internal void and through hole defects were diamond-shaped to
avoid using support material. The diamond-shaped defects had sharp corners that have a
higher stress concentration factor than a spherical void. In Figure 10 C, the quarter crack
SS 316L specimen, there was a clear transition line between the fractured surface and
manufactured quarter crack, indicated by a red line on the micrograph. There is evidence
of bridging in Figure 11 A from fracture surfaces on areas of the SS 316L quarter crack
30
defect surface, and this aligns with the test results. Individual layers from the additive
manufacturing process were seen at the fracture surface of the internal void and through
hole defects, in Figure 10 A, B, D, E, G, H. Unmelted particles were seen on all of the
defect fracture surfaces in both SS 316L and AlSi10Mg. The image shown in Figure 10 F
specifically showed the unmelted particles on the quarter crack defect, and there is
evidence of bridging in Figure 11 B from fracture surfaces on areas of the AlSi10Mg
quarter crack defect surface.
Figure 12: SEM secondary electron micrographs of a quarter crack sample for the (a,b)
stainless steel and (c,d) AlSi10Mg build plate A The white line in the left column
approximates the end of the printed flaw. Insets in the printed flaw region are highlighted
in the boxes of the right column which are shown in detail in the left column. (Images were
taken by Sandia National Laboratories)
31
The introduction of the quarter crack was effective in the SS 316L with minor bridging
seen in the flat regions in Figure 12A and B. Shown in Figure 12C and D, the quarter crack
in the recommended power AlSi10Mg had a significant amount of bridging between the
layers. Shown in Figure 12D, AlSi10Mg appeared to have an increase in gas bubbles on
the surface compared to the SS 316L. Gas bubbles are usually formed internally below the
surface when there is a high solidification rate and there is not enough time for the gas
bubble to rise and escape from the surface [50,51]. The gas bubbles on the quarter crack
defect surface indicate the gas could not escape and the surface was bridged between layers.
The increases in the bridging of the AlSi10Mg quarter crack could help explain why the
quarter crack specimens were stronger than the through hole specimens.
The bridging in the AlSi10Mg quarter crack became more apparent with the
increased ductility from the heat treatment. During testing of the heat-treated AlSi10Mg
and SS 316L, there was a decrease in force and noticeable noise from the quarter crack
opening. The results of the as-built AlSi10Mg did not see a drop in force and the quarter
crack did not open before failure. There was bridging in all of the quarter crack specimens.
Images in Figure 12 shown there was more bridging on the quarter crack defect surface of
AlSi10Mg compared to SS 316L. The difference in bridging effects in AlSi10Mg and SS
316L was due to different material properties and the amount of bridging from the
manufacturing.
32
Figure 13: Fractography images of AlSi10Mg build plate C comparing internal void and
pristine specimens.
The internal void in Figure 13 A was surrounded by unmelted particles and voids. The
fracture surface in Figure 13 B of the pristine build plate C showed a fracture surface
abundant with voids and unmelted particles similar to the internal void defects in the
reduced power. The fractography in Figure 13 highlights that increased porosity in AM
materials can start to dominate the material structure over other types of defects. The
increased porosity in build plate C AlSi10Mg decreased the impact of the interval void
defect. Shown in Table 3 and

33
Table 4, the introduction of geometric defects in the build plate C AlSi10Mg build plate
had a smaller percentage decrease in average maximum force and elongation compared to
the recommended power AlSi10Mg build plate.
4.2 Fracture Toughness Results
Table 6: AM SS316L Fracture Toughness Results (Results from Jody Bartanus [49])
AM SS316L Fracture Toughness Tests
Experiment # of Specimens KIC
(MPa-m1/2
)
Diamond Saw Notch, No Pre-
cracking
1 85.80
Diamond Saw Notch, Pre-
cracking
3 108.73-110.83
AM Notch, No Pre Cracking 1 79.61
AM Notch Pre-cracking 1 126.12
The fracture toughness was calculated using a stress intensity factor for a single
edge notch in tension from the equations below [52].
34
( ) , I I
aK a F
W , where a is total notch and crack length, W is width
2 3 4( ) 1.12 0.231 10.55 21.72 30.39IF
Shown in Table 6 pre-cracking the SS 316L resulted in higher fracture toughness.
AM and diamond saw notches for SS 316L had similar fracture toughness.
Table 7: AM AlSi10Mg Fracture Toughness Results Heat Treated
AM AlSi10Mg Fracture Toughness Heat Treated
Build Plate Notch
Type
# of
Specimens K
IC (MPa-m
1/2
)
Build Plate A AM 1 31.75
Build Plate A DS 2 26.21 - 26.68
Build Plate A, no pre-cracking DS 1 23.41
Build Plate B AM 1 30.26
Build Plate B, no pre-cracking AM 1 28.21
Build Plate B DS 2 27.49 - 29.85
Build Plate C AM 2 22.80-23.23
Build Plate C DS 2 22.01-23.47
The diamond saw notch and AM notch for heat-treated AlSi10Mg shown in Table
7 had similar fracture toughness when comparing each build plate separately. The
35
increased porosity with AlSi10Mg build plate C had a negative impact on the fracture
toughness. AlSi10Mg build plate A and B for both diamond saw and AM notch had similar
fracture toughness.
Table 8: AM AlSi10Mg Fracture Toughness As-Built Results
AM AlSi10Mg Fracture Toughness As-Built
Build Plate Notch Type # of
Specimens K
IC (MPa-m
1/2
)
Build Plate A AM 2 27.93 - 30.13
Build Plate A DS 2 29.58 - 30.94
Build Plate B AM 2 31.01 - 31.72
Build Plate B DS 2 28.25 – 32.68
Build Plate C AM 2 21.11 - 22.83
Build Plate C DS 2 20.37 - 22.26
The heat treatment of AlSi10Mg appeared to not have a significant impact on the
fracture toughness for all three build plates. For both the heat-treated and as-built
AlSi10Mg fracture specimen the AM notch and DS notch had similar results. Shown in
Table 7 and Table 8 there was a decrease in the fracture toughness from build plate A to
36
build plate C in both the as-built and heat-treated. With an increase in porosity and the
fracture toughness decreased.
4.3 Compression Results
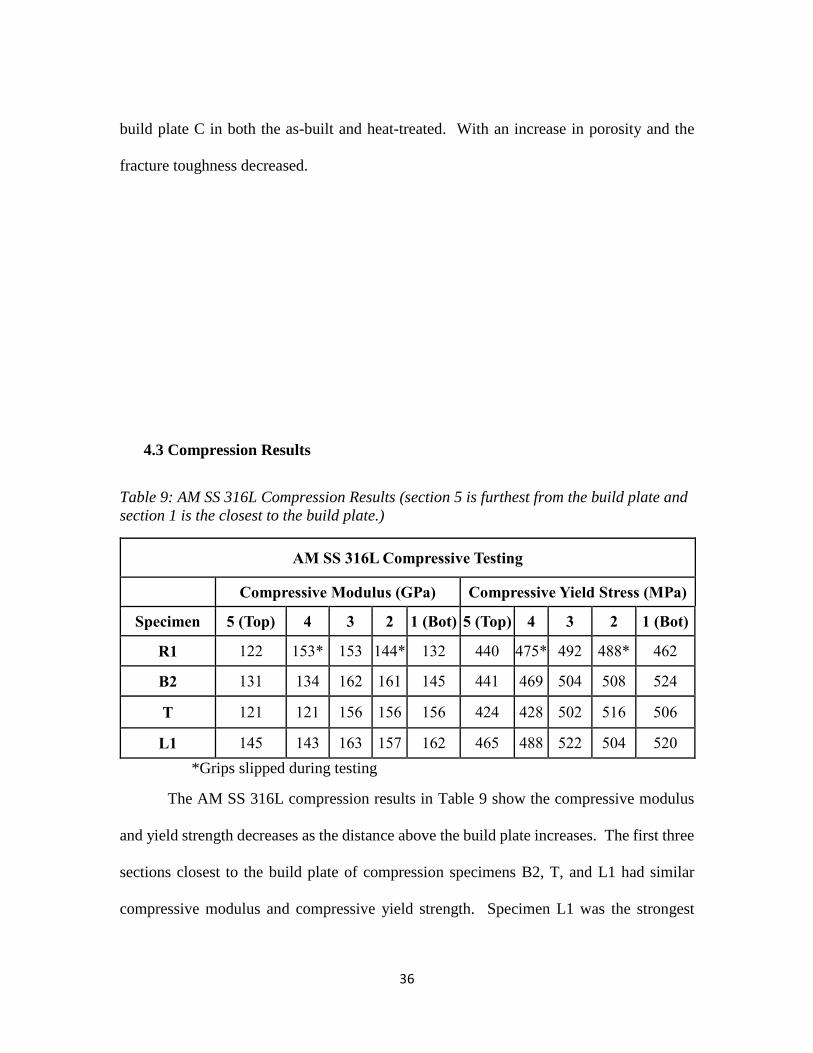
Table 9: AM SS 316L Compression Results (section 5 is furthest from the build plate and
section 1 is the closest to the build plate.)
AM SS 316L Compressive Testing
Compressive Modulus (GPa) Compressive Yield Stress (MPa)
Specimen 5 (Top) 4 3 2 1 (Bot) 5 (Top) 4 3 2 1 (Bot)
R1 122 153* 153 144* 132 440 475* 492 488* 462
B2 131 134 162 161 145 441 469 504 508 524
T 121 121 156 156 156 424 428 502 516 506
L1 145 143 163 157 162 465 488 522 504 520
*Grips slipped during testing
The AM SS 316L compression results in Table 9 show the compressive modulus
and yield strength decreases as the distance above the build plate increases. The first three
sections closest to the build plate of compression specimens B2, T, and L1 had similar
compressive modulus and compressive yield strength. Specimen L1 was the strongest

37
specimen with an average compressive yield strength of 500 MPa compared to R1, B2, and
T with 465 MPa, 489 MPa, and 475 MP.
Table 10: AM AlSi10Mg Compression Results (Section 5 is the furthest from the build
plate and section 1 is the closest to the build plate) All specimens heat-treated at 300 °C
for 2 hours
AM AlSi10Mg Compressive Testing
Compressive Modulus (GPa) Compressive Yield Stress (MPa)
Specimen 5 (Top) 4 3 2 1 (Bot) 5
(Top) 4 3 2 1(Bot)
20-A 66.3 77.7 72.3 79.4 79.1 189 187 184 189 191
23-A 72.7 80.9 69.4 67.6 82.2 193 188 187 186 193
25-A 69.5 76.3 69.3 69.6 68.5 160 168 164 165 165
27-A 74.7 77.6 66.2 65.9 79.3 168 164 163 162 166
19-B 84.8 68.1 70.8 78.8 65.6 191 192 191 189 197
22-B 63.4 65.2 68.3 72.4 57.1 174 171 170 172 173
24-B 73.1 66.7 66.5 67.1 59.3 172 168 173 164 166
26-B 69.5 65.6 62.3 79.3 66.3 175 170 170 170 169
In Table 10, Specimen 20-A and 23-A were significantly stronger than 25-A and 27-
A. The yield strength of the AlSi10Mg remained consistent across all the AlSi10Mg
compression sections regardless of build height. The compressive yield modulus for the
38
AlSi10Mg compression specimens fluctuated from each section. There was not a clear
trend of certain sections in AlSi10Mg having increased material properties. Specimen 19-
B had an average compressive yield strength of 192 MPa and was significantly stronger
than 22-B, 24-B, and 26-B with an average yield stress of 172 MPa, 169 MPa, and 171MPa.
Specimen 25-A and 27-A had similar strength to specimens 22-B, 24-B, and 26-B. Build
plate A and B had similar compression properties.
5. Chapter 5: Discussion
5.1 Relationship of Defects and Ductility
Ductile fracture was seen in the fracture surface of the SS 316L specimens and
brittle fracture was seen in the as-built AlSi10Mg specimens. The internal void defects had
a larger impact on the mechanical properties of as-built AlSi10Mg compared to SS 316L.
As the ductility of the AM metals increased, the impact of the geometric defects decreased.
The heat treatment of AlSi10Mg begins to shift the defect dependence from geometry to
cross-sectional area dependence. This relationship between ductility and stress
concentrations is outlined in literature for traditional metals and can be applied also AM
materials [11]. Brittle materials are generally more sensitive to crack growth and are more
negatively affected by geometric defects compared to ductile materials [11,53].
The through hole was weaker than the quarter crack for the as-built AlSi10Mg
specimens. This was most likely due to the through hole, acting as a stress concentrator,
having sharp corners and the brittle materials having increased sensitivity because of their
lack of hardenability. With a higher ductility, such as in the SS 316L, the reduction in the
39
cross-sectional area becomes the driving factor and the quarter crack becomes weaker than
the through hole.
SS 316L and heat-treated AlSi10Mg both exhibited ductile failure. When the
quarter cracks opened during testing the SS 316L and heat-treated AlSi10Mg specimens,
the specimens plastically deformed, stain hardened and continued to support loading. In
comparison, the as-built AlSi10Mg specimens fractured when the quarter crack opened.
Gas bubbles, which are usually only seen below the surface, were seen in the AlSi10Mg
quarter crack defect surface and are an indicator of bridging. The combination of bridging,
sharp corners in the through hole, and a defect transition region is likely the reason the
through hole was weaker than the quarter crack in the AlSi10Mg as-built components.
From this study, AM AlSi10Mg and SS 316L follow traditional knowledge on
mechanical behavior with stress concentration and ductility. An increase in the ductility
of an AM metal decreases the influenced of geometric defects. A previous study
characterizing the effect of pore size on tensile properties of AM SS 316L aligned well
with the AM SS 316L internal void results in the present study [54]. The internal void saw
similar strength to the pristine specimen, but a small decrease in elongation. The results for
both SS 316L and AlSi10Mg tubular specimens agree with the findings of the elongation
to failure is more sensitive than strength with respect to the size of the defect. In Error!
Reference source not found., the SS 316L peak load was driven by a significant reduction
in the cross-sectional area again agree with Wilson-Heid et al. [54].
40
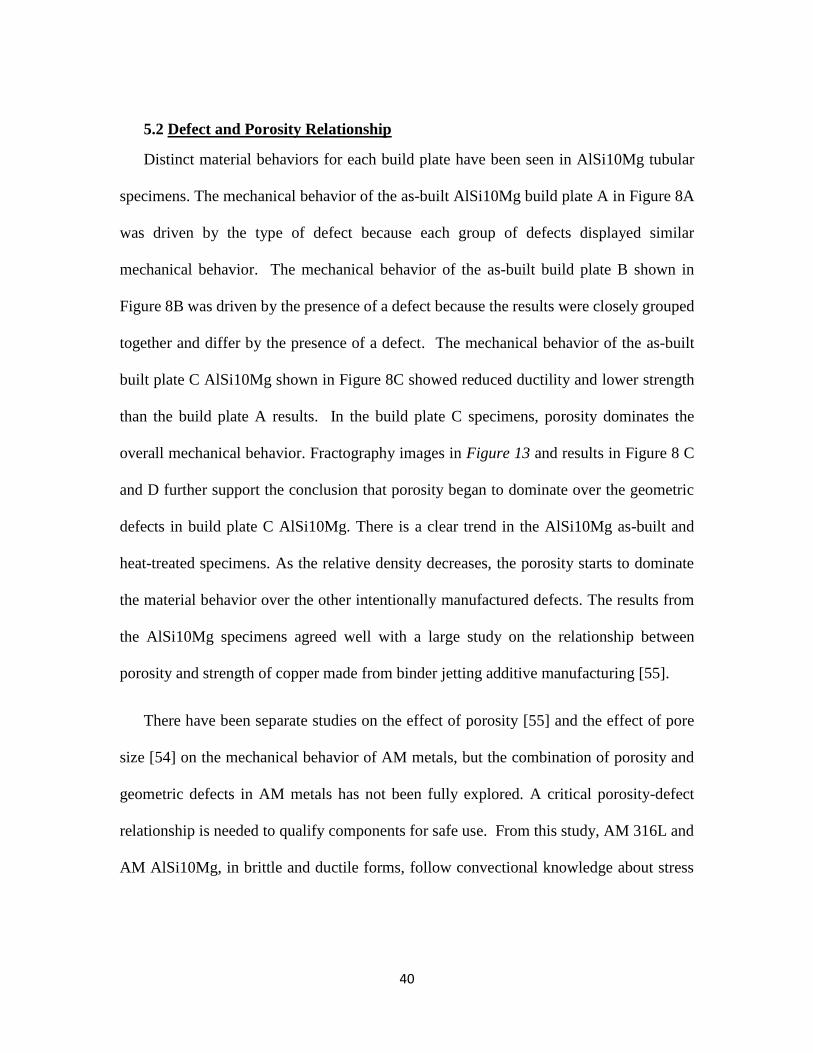
5.2 Defect and Porosity Relationship
Distinct material behaviors for each build plate have been seen in AlSi10Mg tubular
specimens. The mechanical behavior of the as-built AlSi10Mg build plate A in Figure 8A
was driven by the type of defect because each group of defects displayed similar
mechanical behavior. The mechanical behavior of the as-built build plate B shown in
Figure 8B was driven by the presence of a defect because the results were closely grouped
together and differ by the presence of a defect. The mechanical behavior of the as-built
built plate C AlSi10Mg shown in Figure 8C showed reduced ductility and lower strength
than the build plate A results. In the build plate C specimens, porosity dominates the
overall mechanical behavior. Fractography images in Figure 13 and results in Figure 8 C
and D further support the conclusion that porosity began to dominate over the geometric
defects in build plate C AlSi10Mg. There is a clear trend in the AlSi10Mg as-built and
heat-treated specimens. As the relative density decreases, the porosity starts to dominate
the material behavior over the other intentionally manufactured defects. The results from
the AlSi10Mg specimens agreed well with a large study on the relationship between
porosity and strength of copper made from binder jetting additive manufacturing [55].
There have been separate studies on the effect of porosity [55] and the effect of pore
size [54] on the mechanical behavior of AM metals, but the combination of porosity and
geometric defects in AM metals has not been fully explored. A critical porosity-defect
relationship is needed to qualify components for safe use. From this study, AM 316L and
AM AlSi10Mg, in brittle and ductile forms, follow convectional knowledge about stress

41
concentrations and the results have an agreement with other studies on porosity and pores
size for AM metals.
5.3 AM and DS Notch Fracture Toughness
For both AlSi10Mg and SS 316L, there was no significant difference in fracture
toughness between the AM and DS notch for the single edge notch tensile specimens. The
fracture toughness of a notch manufactured during SLM was similar to a notch made in a
post-manufacturing process. In the AlSi10Mg build plate, C the increase in porosity
decreased the fracture toughness. This reinforces the conclusion of increased porosity will
start to dominate the mechanical behavior.
The fracture toughness of die-cast AlSi7Mg ranges from 18 29 MPa m depending
on heat treatment composition [56]. The results of AlSi10Mg are on the upper range to the
fracture toughness of die-cast AlSi7Mg. The fracture toughness of the die-cast AlSi7Mg
was calculated for a plane strain case. Apparent fracture toughness is dependent on the
thickness of the specimen[11]. As the thickness decreases, the apparent fracture toughness
increases and becomes closer to a plane stress case.. The AlSi10Mg results at agrees with
literature that apparent fracture toughness increases with a decrease in thickness. For a
ductile fracture of metals, the crack grows through the center of the specimens. The crack
growth of the edges lags behind the center and occurs at a 45° angle to the applied load.
The fracture surface has a flat surface in the middle and 45° shear lips on the edges[11].
With thinner ductile specimens, the shear lips make up a larger area of the fracture surface
42
and have an impact on the apparent fracture toughness [11]. Understanding fracture
toughness for thin AM components is important because thin and complex sections can be
made using AM to save weight, cost, and manufacturing time Further research will be
needed to fully understand the fracture toughness of thin AM components
. .
5.4 Effect of Build Plate Height and Location
The SS 316L compression results show that as the distance from the build plate
increased the compressive modulus and compressive yield strength decreased. This occurs
because as the distance from the build height increased the grain size increase [30,31]. The
Hall-Petch relationship defines an inverse relationship between grain size and yield
strength[10,53,57]. Observation from a study on AM SS 304 [10] showed large grain sizes
near the build plate, resulting in increased material properties following the Hall-Petch
relationship.
The AlSi10Mg compression results did not show an increase in material properties at
the sections closet to the build plate. The compression material properties of AlSi10Mg
shown in Table 10 were constant across the sections of each compression column.
Compression specimens in build plates A and B had similar material properties. The
material properties of SS 316L were clearly dependent on the distance from the build plate,
compared to AlSi10Mg, which has similar material properties as each distance. A study
[9] on the build height on Inconel 718 produced by SLM observed there was no obvious
changing trend along the build heights of the components. From the results of the SS 316L
43
and AlSi10Mg compression specimens, the effect of build height is material dependent and
this aligns with findings in literature for various materials [9,10].
The material properties of the AlSi10Mg and SS 316L compression specimens also
varied by the location on the build plate. Specimens 20A and 23A were significantly
stronger than 25A and 27A. Specimen 19B was significantly stronger than 22B, 24B, and
26B. Looking at the build plate locations of the AlSi10Mg compression specimens shown
in Figure 2 B, specimen 19B and 20A are on the opposite side of the build plate from other
compression specimens. Specimen 23A near the other compression specimen but had
similar material properties as 20A. Compressive material properties varied by build plate
location, but there is not a clear trend between build plate location and increased material
properties.
6. Chapter 6: Conclusions
Three distinct structural behaviors were observed in the AM AlSi10Mg build
plates. As porosity increased in the AlSi10MG tubular specimens, the mechanical behavior
changed from being driven by the type of geometric defect to being driven by the increased
porosity. Porosity in the build plate C AlSi10Mg build plate overwhelmed the intentionally
manufactured flaws. Heat treatment of AlSi10Mg increased the ductility, thus reduced the
effect of the defects on material behavior. Heat-treated AlSi10Mg and SS 316L both
exhibited ductile failures that are seen with typical ductile metals. In all material testing
conducted in this study, intentionally manufactured defects decrease the strength and
44
ductility. As-built AM AlSi10Mg was more sensitive to defects compared to AM SS 316L
and saw a larger decrease in strength in ductility. Materials behavior for a ductile AM SS
316L and a brittle AM AlSi10Mg were similar when compared to brittle and ductile
wrought metals.
The mechanical behavior of the brittle AM as-built AlSi10Mg was driven by
geometric defects acting as stress concentrations. The mechanical behavior of the ductile
AM SS316L was driven by geometric defects reducing the cross-sectional area. From this
study, AM AlSi10Mg and AM SS 316L followed traditional facts about stress
concentrations and ductility for metals. The results from this study give the initial steps to
determining a critical porosity-defect relationship of AM metals for safe use. Interaction
between natural flaws and the intentionally manufacture flaws could have had a negative
impact on the structural behavior on the AM components.
7. Chapter 7: Future Works
From this study, AM SS 316L and AM AlSi10Mg, in brittle and ductile forms, follow
convectional knowledge about stress concentrations and the results have agreement with
other studies on porosity and pores size for AM metals. Further testing and analysis with
other AM metals, defects sizes, and porosity levels will be needed to fully define the
relationship between defects and porosity, but these results can assist in the initial steps.
Beyond this study, the shape and network of the pores may prove to be just as important.
Uneven porosity near geometric defects can affect the mechanical behavior and could have
been a contributing factor in this study. This study is the first step to establish a defect-
porosity relationship to qualify AM components for safe-use.
45
AlSi10Mg build plate A and B had very similar strength and ductility compared to
build plate C. A future investigation to laser power levels between build plates B and C
would help define the porosity level when the mechanical behavior starts to be dominated
by the decrease in relative density.
Three distinct behaviors were observed in AlSi10Mg. SS 316L could be tested at these
increased porosity levels to determine if these behaviors are seen in another material that
is more ductile. Further exploration into the grain structure could explain why build plate
B was slightly stronger than build plate A.
Additional testing of thickener AM specimens will help further define the relationship
for fracture toughness of thick and thin AM components. The focus of a further fracture
study would be investigating the influence of the specimen thickness on the apparent
fracture toughness. The microstructure of thick and thin AM parts is different because of
the rate of cooling and the manufacturing process.
The compression tests reveal the build height affects the material behavior. A further
studied investigating the on the microstructure and grain size using electron backscatter
diffraction at each build height and location would help determine why SS 316L showed
an increase in material properties while AlSi10Mg was constant across all the sections.
REFERENCES
[1] Tofail SAM, Koumoulos EP, Bandyopadhyay A, Bose S, O’Donoghue L,
Charitidis C. Additive manufacturing: scientific and technological challenges,
market uptake and opportunities. Mater Today 2018;21:22–37.
doi:10.1016/j.mattod.2017.07.001.
[2] Liu B, Kuai Z, Li Z, Tong J, Bai P, Li B, et al. Performance Consistency of
AlSi10Mg Alloy Manufactured by Simulating Multi Laser Beam Selective Laser
46
Melting (SLM): Microstructures and Mechanical Properties. Materials (Basel)
2018. doi:10.3390/ma11122354.
[3] Wohlers Associates 2019 state of 3D printing report published - 3D Printing
Industry n.d. https://3dprintingindustry.com/news/wohlers-associates-2019-state-
of-3d-printing-report-published-152117/ (accessed October 9, 2019).
[4] Leach RK, Bourell D, Carmignato S, Donmez A, Senin N, Dewulf W. Geometrical
metrology for metal additive manufacturing. CIRP Ann - Manuf Technol 2019.
doi:10.1016/j.cirp.2019.05.004.
[5] ASTM F3049 Standard Guide for Characterizing Properties of Metal Powders
Used for Additive Manufacturing Processes. n.d. doi:10.1520/F3049-14.
[6] ASTM F3184 Standard Specification for Additive Manufacturing Stainless Steel
Alloy (UNS S31603) with Powder Bed Fusion 1 n.d. doi:10.1520/F3184-16.
[7] ASTM F3318 Standard for Additive Manufacturing-Finished Part Properties-
Specification for AlSi10Mg with Powder Bed Fusion-Laser Beam 1 n.d.
doi:10.1520/F3318-18.
[8] Fitzgerald E, Everhart W. The Effect of Location on the Structure and Mechanical
Properties of Selective Laser Melted 316L Stainless Steel. Proc 27th Annu Int
Solid Free Fabr Symp 2016:574–83.
[9] Wang X, Keya T, Chou K. Build Height Effect on the Inconel 718 Parts Fabricated
by Selective Laser Melting. Procedia Manuf 2016;5:1006–17.
doi:10.1016/j.promfg.2016.08.089.
[10] Wang Z, Palmer TA, Beese AM. Effect of processing parameters on
microstructure and tensile properties of austenitic stainless steel 304L made by
directed energy deposition additive manufacturing. Acta Mater 2016;110:226–35.
doi:10.1016/j.actamat.2016.03.019.
[11] Anderson TL. Fracture Mechanics - Fundamentals and Applications. Thrid. 2005.
doi:10.1007/978-1-4612-1740-4.
[12] Ibrahim Y, Li Z, Davies CM, Maharaj C, Dear JP, Hooper PA. Acoustic resonance
testing of additive manufactured lattice structures. Addit Manuf 2018;24:566–76.
doi:10.1016/j.addma.2018.10.034.
[13] Karme A, Kallonen A, Matilainen V-P, Piili H, Salminen A. Possibilities of CT
Scanning as Analysis Method in Laser Additive Manufacturing. Phys Procedia
2015;78:347–56. doi:10.1016/j.phpro.2015.11.049.
[14] Jiang R, Kleer R, Piller FT. Predicting the future of additive manufacturing: A
Delphi study on economic and societal implications of 3D printing for 2030.
Technol Forecast Soc Change 2017;117:84–97.
doi:10.1016/j.techfore.2017.01.006.

47
[15] Castañón AA& AQ& MAG. Effect of manufacturing parameters on the
microstructure and mechanical properties of metal laser sintering parts of
precipitate hardenable metals. Int J Adv Manuf Technol 2018.
[16] Frazier WE. Metal Additive Manufacturing: A Review n.d. doi:10.1007/s11665-
014-0958-z.
[17] Kempen K, Thijs L, Van Humbeeck J, Kruth J-P. Mechanical Properties of
AlSi10Mg Produced by Selective Laser Melting. Phys Procedia 2012;39:439–46.
doi:10.1016/j.phpro.2012.10.059.
[18] Zyguła K, Nosek B, Pasiowiec H, Szysiak N. Mechanical properties and
microstructure of AlSi10Mg alloy obtained by casting and SLM technique. World
Scirntific News n.d.;104:462–72.
[19] Herzog D, Seyda V, Wycisk E, Emmelmann C. Additive manufacturing of metals.
Acta Mater 2016;117:371–92. doi:10.1016/j.actamat.2016.07.019.
[20] Sames WJ, List FA, Pannala S, Dehoff RR, Babu SS. The metallurgy and
processing science of metal additive manufacturing. Int Mater Rev 2016.
doi:10.1080/09506608.2015.1116649.
[21] Olakanmi EO, Cochrane RF, Dalgarno KW. A review on selective laser
sintering/melting (SLS/SLM) of aluminium alloy powders: Processing,
microstructure, and properties. Prog Mater Sci 2015;74:401–77.
doi:10.1016/j.pmatsci.2015.03.002.
[22] Taheri H, Rashid Bin M, Shoaib M, Koester L, Bigelow T, Collins PC. Powder-
based additive manufacturing – a review of types of defects, generation
mechanisms, detection, property evaluation and metrology. Int J Addit Subtractive
Mater Manuf 2017. doi:10.1504/IJASMM.2017.088204.
[23] DebRoy T, Wei HL, Zuback JS, Mukherjee T, Elmer JW, Milewski JO, et al.
Additive manufacturing of metallic components – Process, structure and
properties. Prog Mater Sci 2018;92:112–224. doi:10.1016/j.pmatsci.2017.10.001.
[24] Maamoun AH, Xue YF, Elbestawi MA, Veldhuis SC. Effect of selective laser
melting process parameters on the quality of al alloy parts: Powder
characterization, density, surface roughness, and dimensional accuracy. Materials
(Basel) 2018;11. doi:10.3390/ma11122343.
[25] Read N, Wang W, Essa K, Attallah MM. Selective laser melting of AlSi10Mg
alloy: Process optimisation and mechanical properties development. Mater Des
2015;65:417–24. doi:10.1016/j.matdes.2014.09.044.
[26] Aboulkhair NT, Everitt NM, Ashcroft I, Tuck C. Reducing porosity in AlSi10Mg
parts processed by selective laser melting. Addit Manuf 2014;1–4:77–86.
doi:10.1016/j.addma.2014.08.001.
48
[27] King WE, Barth HD, Castillo VM, Gallegos GF, Gibbs JW, Hahn DE, et al.
Observation of keyhole-mode laser melting in laser powder-bed fusion additive
manufacturing. J Mater Process Technol 2014;214:2915–25.
doi:10.1016/j.jmatprotec.2014.06.005.
[28] Bourell D, Kruth JP, Leu M, Levy G, Rosen D, Beese AM, et al. Materials for
additive manufacturing. CIRP Ann - Manuf Technol 2017;66:659–81.
doi:10.1016/j.cirp.2017.05.009.
[29] Saint John D, Joshi S, Simpson T, Qu M, Rowatt J, Lou Y. A Preliminary
Examination of Variability Due to Build Location and Powder Feedstock in
Additive Manufacture of Inconel 718 using Laser-Based Powder Bed Fusion. Proc
27th Annu Int Solid Free Fabr Symp – An Addit Manuf Conf 2016:542–57.
[30] Johnson KL, Rodgers TM, Underwood OD, Madison JD, Ford KR, Whetten SR, et
al. Simulation and experimental comparison of the thermo-mechanical history and
3D microstructure evolution of 304L stainless steel tubes manufactured using
LENS. Comput Mech 2018;61:559–74. doi:10.1007/s00466-017-1516-y.
[31] Carroll BE, Palmer TA, Beese AM. Anisotropic tensile behavior of Ti–6Al–4V
components fabricated with directed energy deposition additive manufacturing.
Acta Mater 2015;87:309–20. doi:10.1016/j.actamat.2014.12.054.
[32] Mugica GW, Tovio DO, Cuyas JC, César González A. Effect of Porosity on the
Tensile Properties of Low Ductility Aluminum Alloys. Mater Res 2004;7:221–9.
[33] Hardin RA, Beckermann C. Effect of Porosity on Deformation, Damage, and
Fracture of Cast Steel. Metall Mater Trans A 2013;44:5316–5332.
doi:10.1007/s11661-013-1669-z.
[34] Direct Metal Laser Sintering [DMLS] Parts On Demand n.d.
https://www.stratasysdirect.com/technologies/direct-metal-laser-sintering
(accessed October 9, 2019).
[35] ASTM B311 Standard Test Method for Density of Powder Metallurgy (PM)
Materials Containing Less Than Two Percent Porosity 1 n.d. doi:10.1520/B0311-
17.
[36] EOS GmbH - Electro Optical Systems. EOS Aluminium AlSi10Mg. GPI Prototype
Manuf Serv 2014;49:1–5.
https://gpiprototype.com/pdf/EOS_Aluminium_AlSi10Mg_en.pdf.
[37] Renishaw. SS 316L-0407 powder for additive manufacturing 2018:1–2.
https://resources.renishaw.com/en/details/data-sheet-ss-316l-0407-powder-for-
additive-manufacturing--90802.
[38] Yang P, Deibler LA, Bradley DR, Stefan DK, Carroll JD. Microstructure evolution
and thermal properties of an additively manufactured, solution treatable AlSi10Mg

49
part. J Mater Res 2018. doi:10.1557/jmr.2018.405.
[39] Finfrock CB, Exil A, Carroll JD, Deibler L. Effect of Hot Isostatic Pressing and
Powder Feedstock on Porosity, Microstructure, and Mechanical Properties of
Selective Laser Melted AlSi10Mg. Metallogr Microstruct Anal 2018;7:443–56.
doi:10.1007/s13632-018-0456-z.
[40] Zakay A, Aghion E. Effect of Post-heat Treatment on the Corrosion Behavior of
AlSi10Mg Alloy Produced by Additive Manufacturing. J Miner Met Mater Soc
n.d. doi:10.1007/s11837-018-3298-x.
[41] Brandl E, Heckenberger U, Holzinger V, Buchbinder D. Additive manufactured
AlSi10Mg samples using Selective Laser Melting (SLM): Microstructure, high
cycle fatigue, and fracture behavior. Mater Des 2012;34:159–69.
doi:10.1016/j.matdes.2011.07.067.
[42] Li W, Li S, Liu J, Zhang A, Zhou Y, Wei Q, et al. Effect of heat treatment on
AlSi10Mg alloy fabricated by selective laser melting: Microstructure evolution,
mechanical properties and fracture mechanism. Mater Sci Eng A 2016;663:116–
25. doi:10.1016/j.msea.2016.03.088.
[43] Uzan NE, Shneck R, Yeheskel O, Frage N. Fatigue of AlSi10Mg specimens
fabricated by additive manufacturing selective laser melting (AM-SLM). Mater Sci
Eng A 2017;704:229–37. doi:10.1016/j.msea.2017.08.027.
[44] Yang P, Rodriguez MA, Deibler LA, Jared BH, Griego J, Kilgo A, et al. Effect of
thermal annealing on microstructure evolution and mechanical behavior of an
additive manufactured AlSi10Mg part 2019. doi:10.1557/jmr.2018.82.
[45] Han Q, Jiao Y. Effect of heat treatment and laser surface remelting on AlSi10Mg
alloy fabricated by selective laser melting n.d. doi:10.1007/s00170-018-03272-y.
[46] Zhuo L, Wang Z, Zhang H, Yin E, Wang Y, Xu T, et al. Effect of post-process
heat treatment on microstructure and properties of selective laser melted
AlSi10Mg alloy. Mater Lett 2019;234:196–200. doi:10.1016/j.matlet.2018.09.109.
[47] ASTM. ASTM E399 Standard Test Method for Linear-Elastic Plane-Strain
Fracture Toughness KIc of Metallic Materials1 2019:1–34. doi:10.1520/E0399-
09E02.2.
[48] ASTM. Standard Test Methods of Compression Testing of Metallic Materials at
Room Temperature n.d. https://compass.astm.org/download/E9.30253.pdf
(accessed September 25, 2019).
[49] Bartanus JB. An Experimental Study of Geometric Defects and Their Significance
on Material Properties and Behavior. Clemson University, 2018.
[50] Gong H, Rafi K, Gu H, Starr T, Stucker B. Analysis of defect generation in Ti–
6Al–4V parts made using powder bed fusion additive manufacturing processes.

50
Addit Manuf 2014;1–4:87–98. doi:10.1016/j.addma.2014.08.002.
[51] Zhang B, Li Y, Bai Q. Defect Formation Mechanisms in Selective Laser Melting:
A Review. Chinese J Mech Eng (English Ed 2017;30:515–27.
doi:10.1007/s10033-017-0121-5.
[52] Murakami, Y., Aoki, S. Hasebe, N. Itoh, Y., Miyata, H., Miyazaki, N., Terada, H.
Tohgo, K., Toya , M., Yuuki R. Stress Intensity Factors Handbook Vol 1. 1990.
[53] William D. Callister J, David G. Rethwisch. Material Science And Engineering An
Introduction. 2009. doi:doi:10.4324/9780203478981.ch3.
[54] Wilson-Heid AE, Novak TC, Beese AM. Characterization of the Effects of
Internal Pores on Tensile Properties of Additively Manufactured Austenitic
Stainless Steel 316L. Exp Mech 2019:793–804. doi:10.1007/s11340-018-00465-0.
[55] Yegyan Kumar A, Wang J, Bai Y, Huxtable ST, Williams CB. Impacts of process-
induced porosity on material properties of copper made by binder jetting additive
manufacturing. Mater Des 2019;182:108001. doi:10.1016/j.matdes.2019.108001.
[56] Drahansky M, Paridah M., Moradbak A, Mohamed A., Owolabi F abdulwahab
taiwo, Asniza M, et al. Fracture Toughness of Metal Castings. Sci. Technol. Cast.
Process. Fig., 2016, p. 285–312. doi:http://dx.doi.org/10.5772/57353.
[57] Hall EO. The deformation and ageing of mild steel: II Characteristics of the Lüders
deformation. Proc Phys Soc Sect B 1951;64:742–7. doi:10.1088/0370-
1301/64/9/302.


![[PPT]Welding Defects · Web viewWelding Defects Wanda S. Benton Florence-Darlington Technical College UNDERCUT POROSITY INCOMPLETE FUSION OVERLAP UNDERFILL SPATTER EXCESSIVE CONVEXITY](https://static.fdocuments.in/doc/165x107/5aa480e17f8b9a7c1a8c3a3a/pptwelding-defects-viewwelding-defects-wanda-s-benton-florence-darlington-technical.jpg)