The Effect of Foreign Direct Investment on Food Security ...
46
University of Arkansas, Fayeeville ScholarWorks@UARK Agricultural Economics and Agribusiness Undergraduate Honors eses Agricultural Economics and Agribusiness 5-2019 e Effect of Foreign Direct Investment on Food Security: A Case Study from Rural Mozambique Kali Fleming Follow this and additional works at: hps://scholarworks.uark.edu/aeabuht Part of the Agribusiness Commons , Food Security Commons , and the Service Learning Commons is esis is brought to you for free and open access by the Agricultural Economics and Agribusiness at ScholarWorks@UARK. It has been accepted for inclusion in Agricultural Economics and Agribusiness Undergraduate Honors eses by an authorized administrator of ScholarWorks@UARK. For more information, please contact [email protected]. Recommended Citation Fleming, Kali, "e Effect of Foreign Direct Investment on Food Security: A Case Study from Rural Mozambique" (2019). Agricultural Economics and Agribusiness Undergraduate Honors eses. 11. hps://scholarworks.uark.edu/aeabuht/11
Transcript of The Effect of Foreign Direct Investment on Food Security ...

University of Arkansas, FayettevilleScholarWorks@UARKAgricultural Economics and AgribusinessUndergraduate Honors Theses Agricultural Economics and Agribusiness
5-2019
The Effect of Foreign Direct Investment on FoodSecurity: A Case Study from Rural MozambiqueKali Fleming
Follow this and additional works at: https://scholarworks.uark.edu/aeabuhtPart of the Agribusiness Commons, Food Security Commons, and the Service Learning
Commons
This Thesis is brought to you for free and open access by the Agricultural Economics and Agribusiness at ScholarWorks@UARK. It has been acceptedfor inclusion in Agricultural Economics and Agribusiness Undergraduate Honors Theses by an authorized administrator of ScholarWorks@UARK. Formore information, please contact [email protected].
Recommended CitationFleming, Kali, "The Effect of Foreign Direct Investment on Food Security: A Case Study from Rural Mozambique" (2019).Agricultural Economics and Agribusiness Undergraduate Honors Theses. 11.https://scholarworks.uark.edu/aeabuht/11

The Effect of Foreign Direct Investment on Food Security:
A Case Study from Rural Mozambique
Kali Fleming
Mentor: Dr. Lanier Nalley
University of Arkansas

1
Table of Contents
1. Abstract…………………………………………………………………………………...2
2. Introduction and Literature Review …………………………………………………..….3
3. Methods …………………………………………………………………………..……..13
4. Results and Discussion………………………………………………………………......16
a. Table 1. Variable Names and Definitions ……………………………………….17
b. Table 2. Model specifications…………………………………………………....18
c. Table 3. Overview statistics ………………………………………………....…..19
d. Table 4. Estimated logit coefficients………………………………………....….20
e. Table 5. Estimated marginal effects…………………………………….………..24
f. Figure 1. Estimated probabilities…………………………………….…………..25
5. Conclusions …………………………………………………………………..………….28
6. References……………………………………………………………………….……….31
7. Appendix A…………………………………………………………………..…………..35

2
Abstract
Poverty and food insecurity in the sub-Saharan African region have been exacerbated by
the worst drought in 23 years, which impacted 25 countries in Southern and Eastern Africa from
2015-2016. In Mozambique alone it was estimated that the 2015-2016 drought resulted in over
1.5 million people becoming food insecure (FAO, 2016). To mitigate the increasing problem of
household food insecurity in sub-Saharan Africa, the World Food Program recommends job
creation to target the most vulnerable populations. Job creation is often the result of Foreign
Direct Investment (FDI). However, critics of FDI often cite concerns of human rights abuses,
inadequate working conditions, pollution, sourcing, and revenue flows back to the multinational
firm that hinder the sustainable, equitable economic development of the host community. This
study analyzed increases in behavioral indicators of household food security amongst employees
of an agricultural FDI (New Horizons) in Nampula, Mozambique. The data reveals
improvements in financial security and several behavioral markers of household food security
amongst employees of the FDI over time. While there is no silver bullet to improving economic
development and food security in sub-Saharan Africa, socially responsible, agriculturally-based
FDIs like New Horizons could be a missing piece to the puzzle.

3
Introduction and Literature Review
According to the Food and Agriculture Organization (FAO) of the United Nations, 224
million people in sub-Saharan Africa (SSA) suffered from undernourishment, or a lack of access
to a sufficient number of calories and nutrients in 2016 (FAO, 2015). According to a World Food
Program study, the main causes of undernourishment globally are low-income levels and food
insecurity (WPF, 2016). Poverty and food insecurity, which is a function of the supply of food
and the income available for households to purchase their requirements, in sub-Saharan Africa
have been exacerbated by the worst drought in that region in the last 23 years, which impacted
25 countries in Southern and Eastern Africa peaking in 2015-2016. Globally, the food security
effects of droughts are difficult to mitigate, but sub-Saharan African countries are particularly
susceptible to suffering the worst effects of drought due to the large concentration of
undiversified economies, which primarily consist of rain-fed agriculture and livestock, with
limited infrastructure, and low levels of disposable income (Benson & Clay, 1998). Drought hits
the rural poor in Africa the hardest as nearly 90% of sub-Saharan Africa’s agricultural products
are the result of rain-fed agriculture, which is problematic for ensuring food security and price
stability (Rosegrant, Cai, Cline, & Nakagawa, 2002). Mitigating poverty and food insecurity in
sub-Saharan Africa is increasingly important because climate scientists have found that droughts
in sub-Saharan Africa have intensified in their frequency, severity, and geographical dispersion
since 1990 (Masih, Maskey, Mussá,& Trambauer, 2014). Thus food insecurity could increase as
function of climate change given its potential to increase food supply and thus food price
volatility.
When yields in an agriculturally-based economy are diminished because of a natural
disaster like a drought, a region can experience economic shocks, such as fluctuations in the
4
supply and price of staple crops, such as maize in Sub-Saharan Africa. Given that more than
46.1% of people in sub-Saharan Africa live below the poverty line, at less than $1.90 per day
(CIA Factbook, 2018), even a marginal increase in staple food prices can exacerbate food
insecurity both locally and regionally. The combination of drought and its subsequent economic
shocks in SSA was estimated to increase the number of food insecure individuals from 11.0
million in 2015 to 23.4 million in 2016 (GC-RED, 2017). FAO released a list of the most food
insecure nations resulting from the 2015 drought as Angola, Zimbabwe, Malawi, Madagascar,
Lesotho, Swaziland, and Mozambique, all of which have diets which rely on rain-fed maize as
their staple crop (GC-RED, 2017).
South Africa, an upper-middle income country was also afflicted by the 2015-2016
drought. The 2015-2016 drought, paired with urban migration and a lack of urban infrastructure
in South Africa, has led to increasing stress on water systems (Tatlock, 2006). In South Africa, a
reported 22% of the population ran out of money to buy food in 2014 because of the drought
(Statistics South Africa, 2016). In the Northwest province, which is agriculturally based, 41% of
households ran out of money to purchase food. These numbers independently are concerning but
looking at a regional context they are alarming given that South Africa is the wealthiest country
in SSA and a food exporter. As such, future droughts in more marginalized areas could have
deeper and wider impacts for poverty and food security.
The 2014-2015 drought created two distinct problems for food security in South Africa.
First, subsistence farmers produced lower yields due to water shortages and a lack of irrigation
so supply decreased. Second, the supply shortage caused prices of agricultural goods to rise
markedly, making what food was produced to be out of the economic reach of the poorest of the
poor. For example, in 2015 grain prices in South Africa rose by 19.7%. A near 20% increase in

5
staple food prices in areas which already struggle with food insecurity can push millions into
food insecurity, because low-income populations are much more responsive to changes in prices
(Braun, 2007). The price of yellow maize more than doubled from 2010 to 2015 when the
drought began. The price in 2010 was approximately 1100 rand per ton (approximately 80 USD
per ton), which rose to approximately 2250 rand per ton (165.50 USD per ton) in 2015 (AFF,
2016). The very poor in South Africa rely on maize as their staple crop. Food insecurity is a
function of the supply of food and the income of households to purchase their requirements. As
food prices doubled, and income regionally remained stagnant, food insecurity worsened.
The 2014-2015 drought forced food, specifically maize, which the average South African
consumes 222 grams a day of (Ranum, Pena-Rosas, & Garcia-Casal, 2014), prices to
substantially increase. Between 2014 and 2015, the drought resulted in maize prices increasing
by 41% in the Free State’s urban areas and 38% in the North West’s urban areas, leading to
widespread food shortages because people did not have adequate economic resources or capital
to purchase enough food (Yende, 2015). Price increases, specifically on staple crops, have the
greatest impact on those already experiencing hunger and poverty (FAO, 2016). If people have
sufficient amounts of disposable income from employment, they can lessen the impacts of
drought by being able to afford elevated food prices. Over 70 percent of people in sub-Saharan
Africa face poor employment opportunities, with over 60-80% of employment in the region
originating from the informal market with little to no regulation on compensation, workers’
rights, etc. (ILO, 2016).
Drought, such as that experienced in SSA in 2015, contributes to poverty and food
insecurity through its effect on agricultural commodity prices. This ultimately leads to lower
consumption of staple goods (Zimmerman & Carter, 2003; Holden & Shiferaw, 2004). Increased

6
commodity prices with no additional increase in per capita income levels identifies the root of
food insecurity at the household level during the 2015-2016 drought.
To help solve the increasing problem of household food insecurity in sub-Saharan Africa,
the WFP has identified job creation as method to assist the most vulnerable populations
persevere through climatic shocks such as droughts. Job creation attempts to provide a stable
source of income, which improves household welfare and food security during the highs and
lows (shocks) of economic and food production cycles. Job creation in low income countries is
often the result of Foreign Direct Investment (FDI).
Foreign, financial investments in low-income countries totaled 1.4 billion US dollars in
1980 (Owusu-Sekyere, Eyden, & Kemengue, 2014). This number grew to 59 billion US dollars
in low-income countries by 2016 (UNCTAD, 2017). The World Bank classifies a low-income
country as having an annual, per capita income level below roughly $2.75 per day. A low per
capita income level signals that a country may have relatively lower wage rates, and often other
attractive characteristics that lower production costs such as relaxed environmental standards for
multinational companies which makes foreign investments (OECD, 2002). However, FDI can
also be valuable to a host nation in that it has the potential to increase a country’s overall Gross
Domestic Product (GDP) via job and income creation. Whereas, currently 50-80% of GDP in
sub-Saharan Africa originates in the informal market (ILO, 2016), FDI’s development of the
formal market has the potential to accelerate economic activity and growth by creating jobs,
increasing trade, building capital, and introducing new technology (Delay, 2017). However,
while FDI can potentially increase a country’s GDP in this way, it can also hinder sustainable,
equitable economic development if the FDI acts in self-interest and seeks to maximize profits

7
with most profits flowing out of the host country and back to multinational firms (Dele&
Olufemi2016).
In this sense, some cases of FDI relationships in low-income countries are not symbiotic.
A multinational firm will invest money in a host country to benefit their business (often to lower
production costs), and other sectors of the economy are neglected by the host government in this
process. Also known as Dutch Disease, the inflow of foreign investment into one sector of an
economy can lead to currency appreciation, decreasing export competitiveness, and a decline in
production within other sectors (Owusu-Sekyere et al., 2014). Low/lower-middle-income
countries which find new deposits of oil or minerals often have a large inflow of FDI and, if not
carefully monitored, can experience Dutch Disease. Thus once the natural resources are mined to
depletion and the FDI leaves, the host country is often left with little to show for their mineral
extraction. Furthermore, often LIC’s will focus the majority of their economic efforts on mineral
extract and neglect other parts of the economy such as agricultural production. As such, when the
jobs created from the FDI leave the citizens of the host country can be as food insecure as they
were prior to the FDI.
Extracting or exploiting resources is often done with little to no regard to the well-being
of the native population of the host country. As funds and resources are diverted into the FDI’s
sector, funds and resources are taken from other sectors which are pivotal to development. When
the FDI withdraws from the host country, there can oftentimes be little to show in regards to
development improvements (Vissak & Roolaht, 2014). When economic growth through FDI is
not positively correlated with improved economic and community development for citizens of
the host country, it leads to positive financial investments that are not beneficial to natives of the
host country. As such, economic growth (an increase in GDP) can fail to enhance economic

8
development (improving quality of life) (Delay, 2017). Thus, from a balance sheet standpoint,
FDI looks attractive as per capita GDP increases. However; in reality the average citizen of the
host country is no better off than prior to the FDI. Both growth (increases in per capita GDP) and
development (increases in quality of life) are needed in low-income countries so that the benefits
are spread over the many instead of the few. If political elites and oligarchs are the only
benefactors of FDI, then one has to question if it was actually beneficial to have hosted the FDI.
Not all FDI negatively impacts host country populations. Global Trade Analysis and
Policy (GTAP) simulations reveal that foreign agricultural investments can be beneficial to host
country populations in sub-Saharan Africa. Over a span of 2001 to 2011, data were analyzed
revealing that foreign agricultural investments resulted in a decline in local food supply due to
increased exports, which would lead to an increase in local food prices. However, the loss from
higher food prices would be offset by employment and imports would increase as a result
(Rakotoarisoa, 2011). Thus, domestically produced food prices may have increased but not as
fast as the rate of wage increases from new employment opportunities. In a country with an
economy that is primarily agriculturally-based, jobs, resources, and infrastructure provided by an
FDI project could be the catalyst for economic growth and development.
Mozambique, which was one of the worst affected countries in the 2015-2016 drought, is
a low-income country on the eastern coast of Africa with an economy centered on subsistence
agriculture and an emerging mining industry (CIA Factbook, 2018). In Mozambique more than
46.1% of people were living below the national poverty line of 18.40 Metacais per day in 2016,
which is the equivalent of $0.31 USD (CIA Factbook, 2018). As a result of the country’s low per
capita income levels, 80% of Mozambicans were unable to obtain a nutritionally adequate diet in
2015 (WFP, 2015), meaning they were undernourished. In Mozambique alone, it was estimated

9
that the 2015-2016 drought resulted in over 1.5 million people becoming food insecure (FAO,
2016). In parts of Mozambique, namely the Nampula and Zambezia, the two poorest provinces
of the country, the drought was so severe that it was estimated that more than 10% of subsistence
farmers abandoned their harvest of cereals in the 2015 growing season due to low yields (UNDP,
2016).
Mozambique has also recently seen an influx of FDI. In 2017, 48% of Mozambique’s
GDP was attributed to FDI (The Global Economy, 2017). However, these FDI firms have been
seen as a hindrance to sustainable economic growth. Based on an in-depth analysis of South
African investments in Mozambique, it appears that investments have been concentrated in the
Maputo region due to influence from self-interested agents (Castel-Branco, 2004). These agents
appear to be focused on oligopolistic strategies, competition, and globalization for business
growth. This sheds light on the potential inequitable spread of resources from investments in
Mozambique, in that few may really be benefitting from investments. Castel-Branco found a
need for social, sectoral, and regional expansions in investments to include more groups within
the spread of investments and link investments with opportunities to reduce economic, working,
and social conditions for the majority of the population (Castel-Branco, 2004).
Evidence from The Club of Mozambique, a well-known news source, also reveals that
Mozambique is experiencing the effects of Dutch Disease. As previously mentioned, this
phenomenon allows FDI operations to leave the country after extracting resources, human
capital, and other invaluable resources that negatively impacts the potential for sustainable
development within a country. According to the author, who cites an Investment Report from the
United Nations Conference on Trade and Development, foreign investment fell by 26% in 2018
due to a national debt crisis (UNCTAD, 2018). The declining rate of foreign investment in

10
Mozambique is likely due to the country’s economic dependence on coal, natural gas, and oil
coupled with falling prices for oil in 2018 (The Club of Mozambique, 2018).
An example of an agriculturally-based, holistic FDI approach in Mozambique is New
Horizons poultry farm in Mozambique. The farm was founded by Andrew Cunningham of
Zimbabwe in 2005. The company is for-profit, and seeks to, “nurture fruitful work through
integrating markets, supplies, holistic training and support” (Novos Horizontes, 2019). Since its
founding, New Horizons has expanded to partner with three other companies: Eggs for Africa,
Frango King, and Mozambique Fresh Eggs to increase its protein offerings in a region which is
protein deficient. The farm has provided employment to approximately 500 Mozambicans in the
fields of construction, veterinary practice, egg selecting and packaging, as well as managerial
positions. Cunningham also employees other local families offsite through an outgrower program
which contracts farmers to raise chicks to maturity for the company. New Horizons is unique
because the organization is led by business-minded individuals who promote sustainable
development of economic, social, and spiritual aspects of the individual employee, his/her
family, and the community (VerSteeg, 2010).
To gauge the effectiveness of New Horizons in promoting the sustainable development of
economic, social, and spiritual aspects of employees and the community, this study analyzes
improvements in food security among employees relative to the length of time employed at New
Horizons. A standard instrument of measuring food insecurity levels is the USDA Household
Food Security Survey Module (HFSSM), which is an 18-item, three stage design that allows
families to self-report experiences and behaviors related to food insecurity due to limited
financial resources. It also accounts for other possible reasons for reduced food consumption by
specifying “because of a lack of money or the ability to afford food” in each question prompt.

11
Researchers have since adapted the HFSSM module to fit international communities,
such as a study conducted in Bolivia, Burkina Faso, and the Philippines (Quinonez-Melgar,
2006). A team from Ohio State University modified the module to contain questions that gauge
the potential reduction of the quantity and quality of their household food consumption. An
overall negative correlation in food consumption levels and food insecurity was found in Bolivia.
This correlation was found in all food groups, including oils and fats, animal products, and grains
and cereals (Quinonez-Melgar, 2006).
A similar study conducted by the International Food Policy Research Institute (IFPRI)
addresses methods utilized by development agencies to gauge household food security in
globally. The author, Hoddinott, compares measuring individual food intake, household caloric
acquisition, dietary diversity, and indices of household coping strategies. The study reveals that
the most feasible, low-cost options for measuring household food security are dietary diversity
and indices of coping strategies (Hoddinott, 1999). Dietary diversity can be measured through
cataloging the number of different foods eaten within a household over time; while coping
strategies can be calculated by counting the number of coping strategies used by a household.
Coping strategies are outlined in the USDA HFSSM as consuming less of a preferred food,
reducing the quantity of food consumed, and skipping meals (Hoddinott, 1999). Due to time
restraints and language barriers, coping strategies and indicators of food insecurity were the
focus of this study. By measuring indicators of food insecurity amongst employees, we are able
to better understand and quantify the impact of FDI on determinants of well-being (in this case,
food security) in the host country population to reveal the strength of FDI as a catalyst for
development against concerns of exploitation of native populations. If food security is improved

12
among host country citizens, the case could be made for FDI as a method of sustainable,
equitable development amongst New Horizons employees.
This study is timely because it took place at the height of the 2014-2015 drought, when
local food prices were at their peak in the Nampula province of Mozambique. The specific study
objectives were to observe the relationship between a steady income source, and how that
relationship changed as length of employment increased, of income and common coping
strategies for food insecure households, as established by the USDA through the HFSSM. Prior
research on New Horizons found that before becoming employed by New Horizons, only 21% of
employees said they were confident in providing for their families, whereas 95% of employees
said they were confident after obtaining a job at New Horizons (Hansen, 2016). However, while
some New Horizon employees now feel they can meet their family's overall needs, it has yet to
be determined whether or not they have an adequate level of food security across time and during
extreme food price shocks such as drought. That is, just because someone can provide basic
needs most of the time does not indicate they have sufficient food supply when food prices spike,
like in time of drought. The nexus of this project is a case study gauging how foreign
agricultural direct investments can raise household incomes, which can provide more stable food
consumption even in the face of suddenly increased food prices. Results from this study can be
used to give development agencies, NGOs, and local and federal governments information as to
how promoting foreign agricultural investments can improve people’s financial conditions and
food security levels.

13
Methods
A survey aimed at eliciting food security and its relationship with New Horizons was
created by four University of Arkansas students in May of 2016. The survey instrument was
based on a modified version of the USDA Household Food Security Survey Module (HFSSM).
The HFSSM was developed to gauge the severity of various indicators of food insecurity. The
survey module combined a variety of factors to gauge the presence of food insecurity including
household conditions, events, behaviors, and subjective reactions. Examples of this include
anxiety related to insufficient food consumption, the experience of not having food, substituting
fewer or cheaper foods than usual, and instances of reduced food intake (Bickel, Nord, Price,
Hamilton, & Cook, 2000).
The survey was developed using Qualtrics software. Qualtrics was chosen due to its
capability to work and save responses while in “offline” mode, meaning it could be used in rural
areas with no access to the internet. The survey was distributed in May and June of 2016 to New
Horizons employees in the Nampula province of Mozambique. The official language of
Mozambique is Portuguese, but many people in rural communities of Nampula speak a local
dialect Makhuwa, which required using two translators. The team collected 127 responses related
to improvements in quality of life, food security, financial stability, and access to medical care
over the course of three weeks. The questions and results were then split into three topics:
economic improvement, food security, and healthcare since the employees started working at
New Horizons.
The purpose of the survey was to determine if food security had improved amongst
employees of New Horizons, even during times of high food prices which resulted from the
drought, based on the number of years of employment, defined as:

14
1) Increased percentage of income spent on food. Ideally, this would decrease as time
employed at New Horizons increased. As total, proportionate expenditures on food
decreases, the better a household is at absorbing shocks in food prices.
2) Increased number of people supported. As income increases in SSA, a confounding factor
to food security can often unfold, households begin caring for extended families and
neighbors. Thus, income can increase and food security could remain stagnant if a
household starts providing food for additional people.
3) Decreased percentage of skipped meals due to lack of money. Ideally, this would
decrease as time employed at New Horizons increased. This could be attributed to
increased income or increased savings.
These questions were derived from the USDA’s Household Food Security Survey
Module in conjunction with the aforementioned modified international studies conducted by
Bickel (2000), Quinonez-Melga (2006), and Hoddinott (1999), to elicit the conditions, events,
behaviors, and subjective reactions common in food insecure households (Bickel et al, 2000).
Survey questions specific to this study (found in Appendix 1) included the amount of income
spent on food, the types of food consumed, and potential coping strategies for food insecurity.
The survey in its entirety, including information on household demographics, financial stability,
and healthcare can be found in Appendix 1.
Three models were specified from the survey questions to test the implied hypotheses in
the three objectives listed above: (1) the potential increase in income spent on food relative to the
number of years worked at New Horizons, (2) the probability of providing food for more people
relative to the number of years worked at New Horizons, and (3) the probability of decreasing
the size/skipping meals relative to the number of years employed at New Horizons.

15
Four independent variables are used in the modeling of the three objectives: (1)
lnyearsnhi represents the natural log of the number of years employee i worked at New Horizons,
numchildreni represents the number of children in household i, female is a dummy variable
which represents gender of responder i (1=female, 0=male), and numhousei represents the total
number of people in household i.
These models used the independent variable lnyearsnhi to measure the number of years
(estimated as the natural log of number of years) respondent i worked at New Horizons. The
number of years employed at New Horizons is used to estimate how indicators of food insecurity
are impacted relative to the number of years the employee has worked for New Horizons. The
estimated models indicate how income levels and food insecurity are affected relative to years
formally employed.
Three logit regression models were estimated measure the impact of determinative
factors on the three objectives. The models are:
P(y = 1|X) = 1/(1+EXP(-1*(c1 + β2 lnyearsnhi + β3 numchildreni + β4 femalei +
β5 numhousei))
where β is a vector of parameters to be estimated. Table 1 defines the dependent and independent
variables. Table 2 gives the specification of each model. Table 3 displays the estimated
coefficients which were estimated using Eviews© 8.0 software. Table 4 displays the marginal
effects from each model which can be interpreted as the estimated change in probability for a
one-unit increase of each independent variable.

16
Results and Discussion
Table 1 and Table 2 introduce the models that were utilized, with Table 1 being Variable
Names and Definitions and Table 2 being Model Specifications. As such, Table 1 and Table 2
can be used to better understand the models that were designed within the study. More
specifically, Model 1 measures the likelihood that employees purchased greater quantities of
food with income generated from employment at New Horizons. Model 2 determines if
employees could provide food for additional people in their household after obtaining
employment at New Horizons. Model 3 estimated the likelihood families were skipping or
cutting the size of meals.
Table 3 introduces the overview statistics, while Table 4 and Table 5 introduce results
from the logit model and the marginal effects, respectively. Figure 1 displays a slightly more
intuitive overview and discussion of the results. Figure 1 shows the estimated probability of the
increase in income from formal employment at New Horizons being spent on food items;
estimated probability of an increase in the number of people provided for as a result of formal
employment at New Horizons; and probability of a change in frequency of the reduction in size
of meals or skipping meals altogether after becoming employed at New Horizons.
17
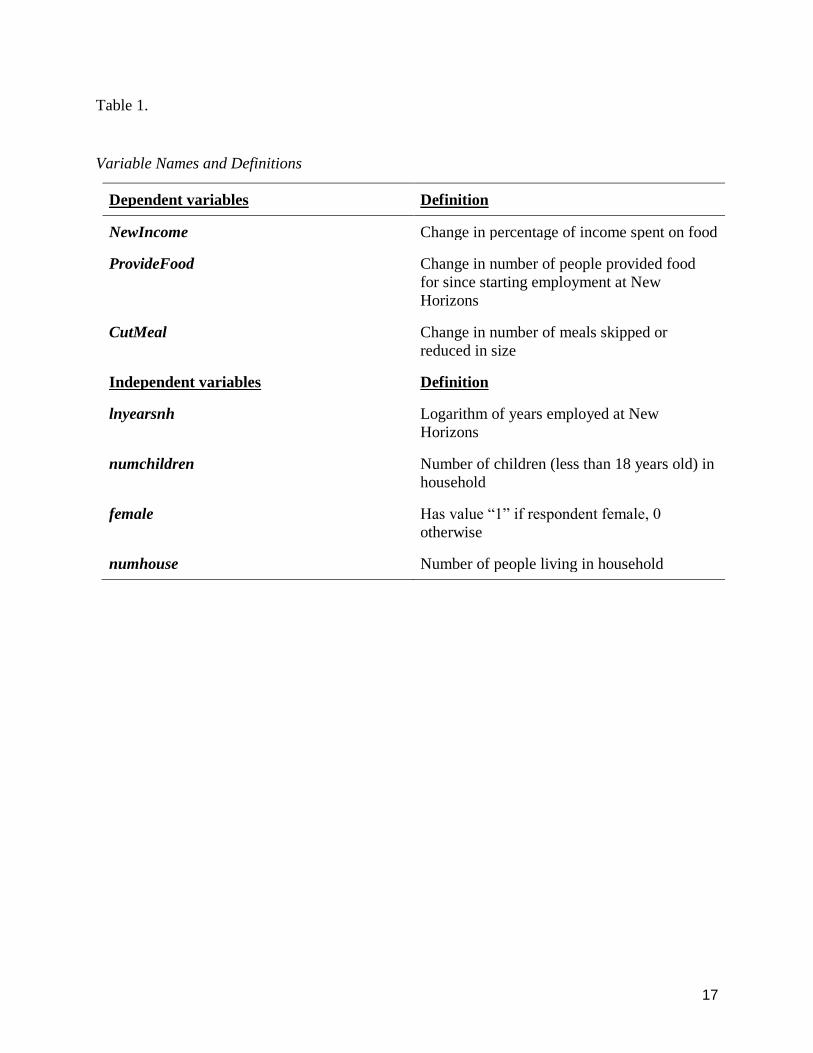
Table 1.
Variable Names and Definitions
Dependent variables Definition
NewIncome Change in percentage of income spent on food
ProvideFood Change in number of people provided food
for since starting employment at New
Horizons
CutMeal Change in number of meals skipped or
reduced in size
Independent variables Definition
lnyearsnh Logarithm of years employed at New
Horizons
numchildren Number of children (less than 18 years old) in
household
female Has value “1” if respondent female, 0
otherwise
numhouse Number of people living in household

18
Table 2.
Model Specifications
Model # Dependent Variable Independent Variables
Dependent Variable Names
Model 1
Amount of Income
Spent on Food
Increased
lnyearsnh, numchildren,
female, numhouse
NewIncome
Model 2
Number of People
Provided For
Increased
lnyearsnh, numchildren,
female, numhouse
ProvideFood
Model 3
Number Skipped
Meals Increased
lnyearsnh, numchildren,
female, numhouse
CutMeal

19
Table 3.
Overview Statistics

20
Table 4.
Estimated Logit Coefficients for Models 1, 2, and 3 (no intuitive interpretations, other than the
signs)
Variable NewIncome ProvideFood CutMeal
Constant 0.00697 0.171 -1.37*
lnyearsnh -0.779* 1.22 0.117
numchildren -0.137 -0.0306** -1.20
female 0.0929 -0.275 0.392
numhouse 0.139 0.233 0.118
*indicates a statistically significant result at P<.05
**indicates a statistically significant result at P<0.01

21
Table 4 provides the estimated change in probability of increasing the amount of food
purchased for a one unit increase in lnyearsnh Model 1; the estimated change in probability of
providing for more people as a function of time employed at New Horizons for Model 2, and the
estimated change in probability of not skipping or cutting the size of meals as a function of time
employed at New Horizons for Model 3. These estimated marginal effects are evaluated at the
sample means of years worked at New Horizons from each logit model. All models measure the
responses of all 125 participants.
Model 1 measures the likelihood that employees purchased greater quantities of food
with income generated from employment at New Horizons. That is, when people became
employed at New Horizons, did they use this new income to purchase food? Further, we wanted
to analyze how that probability changed as employees years at New Horizons increased. That is,
would an employee who worked at New Horizons 10 years use the same percentage of his/her
money to purchase food as someone who had been working at New Horizons just one year? The
sample revealed a significant (P < 0.05) negative relationship between years worked at New
Horizons and increased spending on food. We can infer that as the number of years worked at
New Horizons increases, the percentage of income spent on food decreases. This implies that
once employees are established at New Horizons, their basic food requirements are being met
and they are using their disposable income on other things, possibly home improvements or
schooling for their children. This inverse relationship could also indicate that as food price
shocks (increases) occur (attributed to drought or exogenous policies), those who have had
formal employment longer would be better able to absorb these shocks.
The marginal effects for the variable lnyrsnh in Model 1 was estimated to be -0.194,
which implies that there is a strong negative relationship between a one-year increase in the

22
independent variable (the number of years employed at New Horizons) and a probability of
increased spending on food1. This marginal effect is significant at the (P < 0.05) level. This
finding could be explained by many factors. For instance, if income changes, food consumption
may not. If income goes up, the relative proportion of income spent on food would go down but
the absolute amount would not.
Model 2 determines if employees could provide food for additional people in their
household after obtaining employment at New Horizons. This is a common behavior of families
with stable income and increased food security in sub-Saharan Africa (Bickel, G. et al., 2000).
All independent variables (lnyearsnh, female, numhouse) besides numchildren, or the number of
children living in the household, were found to be insignificant (P > 0.10). Marginally significant
results (P < 0.10), although negative, were found for the number of kids living in the household
relative to the number of years worked at New Horizons. An intuitive interpretation is difficult
to obtain. Other than the negative relationship, it appears to suggest that as the number of
children in a household increases, the number of people provided for outside of the family
decreases. However, this finding in Model 2 has little significance with a marginal effect of only
-0.00369, meaning that only a very small change in probability occurs with the addition of one
more child. Also for Model 2, as seen in Table 4, the marginal effects for independent variable
lnyearsnh were significant (P < 0.10) with a value of 0.147. Our results indicate a significant (P
< 0.05), positive relationship between the increase in years worked at New Horizons and number
1 We cannot interpret -0.194 as the marginal increase of an additional year because the independent
variable, lnyearsnh, is in logarithms. At the mean number of years, 3.7, the marginal effect for new
income would be -0.194/3.693 -= -0.0525. Similar computations could be done for the coefficients of
lnyearsnh in Models 2 and 3.

23
of people provided for. This finding is a positive indicator for FDI’s ability to improve overall
food security among members of rural communities as the result of spillover effects from a
family member or friend becoming formally employed as a result of FDI.
Model 3 estimated the likelihood families were skipping or cutting the size of meals
(dependent variable cutmeal) which is a common coping mechanism in food insecure households
(Hoddinott, J., 1999). The independent variables were insignificant meaning that none of the
defined variables (lnyearsnh, numchildren, female, numhouse) influenced employee’s decision to
cut or reduce the size of meals. However, the constant variable is significant at -1.37, which
indicates a significant (P < 0.05) indication that something changed in the frequency of
employees cutting or reducing the size of meals. Given that the percentage of employees cutting
meals declined from 52% to 26% at (P < 0.01), it is apparent that food security amongst
employees has improved but we failed to identify the root cause of improvements.
24
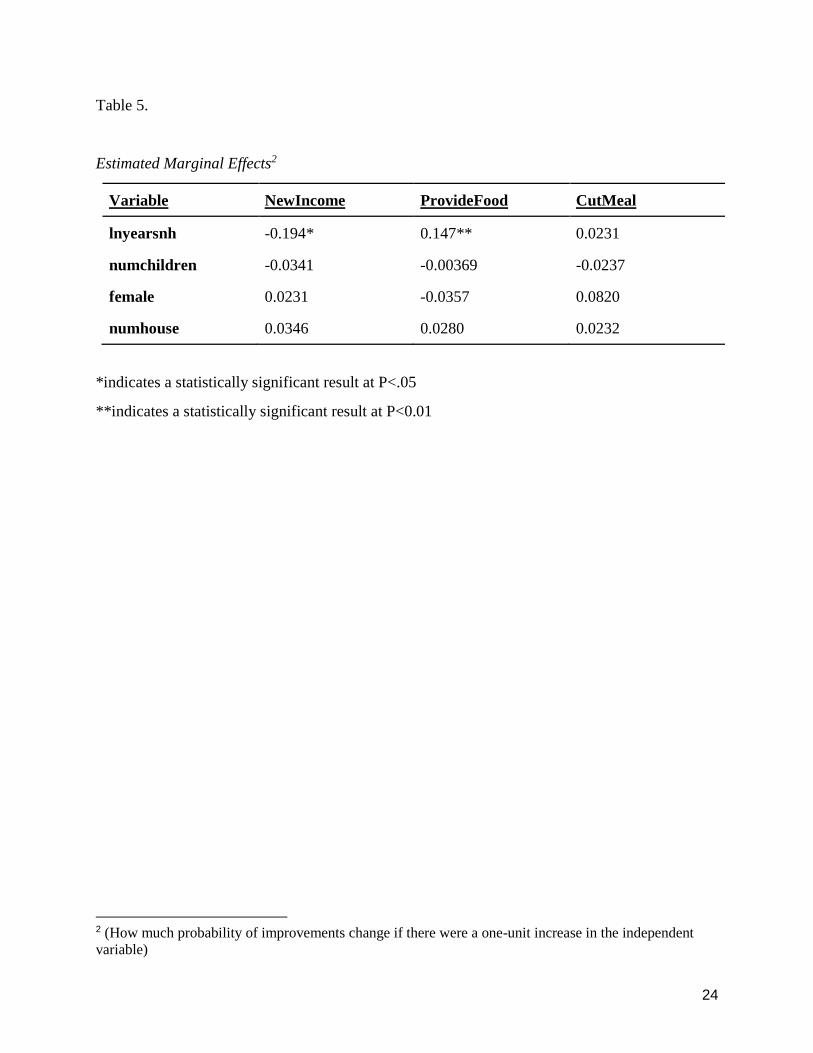
Table 5.
Estimated Marginal Effects2
Variable NewIncome ProvideFood CutMeal
lnyearsnh -0.194* 0.147** 0.0231
numchildren -0.0341 -0.00369 -0.0237
female 0.0231 -0.0357 0.0820
numhouse 0.0346 0.0280 0.0232
*indicates a statistically significant result at P<.05
**indicates a statistically significant result at P<0.01
2 (How much probability of improvements change if there were a one-unit increase in the independent
variable)

25
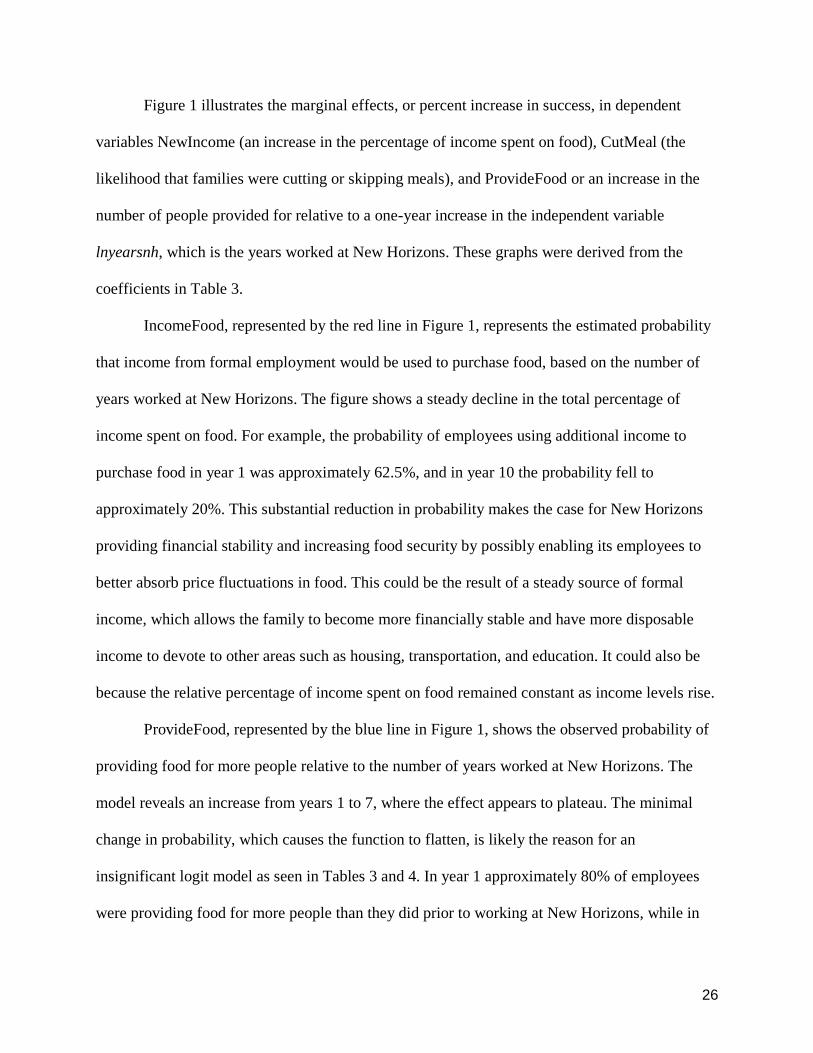
Figure 1. Estimated probability of the increase in income from formal employment at New Horizons
being spent on food items (shown in red). Estimated probability of an increase in the number of people
provided for as a result of formal employment at New Horizons (shown in blue). Estimated probability of
a change in frequency of the reduction in size of meals or skipping meals altogether after becoming
employed at New Horizons (shown in green).
26
Figure 1 illustrates the marginal effects, or percent increase in success, in dependent
variables NewIncome (an increase in the percentage of income spent on food), CutMeal (the
likelihood that families were cutting or skipping meals), and ProvideFood or an increase in the
number of people provided for relative to a one-year increase in the independent variable
lnyearsnh, which is the years worked at New Horizons. These graphs were derived from the
coefficients in Table 3.
IncomeFood, represented by the red line in Figure 1, represents the estimated probability
that income from formal employment would be used to purchase food, based on the number of
years worked at New Horizons. The figure shows a steady decline in the total percentage of
income spent on food. For example, the probability of employees using additional income to
purchase food in year 1 was approximately 62.5%, and in year 10 the probability fell to
approximately 20%. This substantial reduction in probability makes the case for New Horizons
providing financial stability and increasing food security by possibly enabling its employees to
better absorb price fluctuations in food. This could be the result of a steady source of formal
income, which allows the family to become more financially stable and have more disposable
income to devote to other areas such as housing, transportation, and education. It could also be
because the relative percentage of income spent on food remained constant as income levels rise.
ProvideFood, represented by the blue line in Figure 1, shows the observed probability of
providing food for more people relative to the number of years worked at New Horizons. The
model reveals an increase from years 1 to 7, where the effect appears to plateau. The minimal
change in probability, which causes the function to flatten, is likely the reason for an
insignificant logit model as seen in Tables 3 and 4. In year 1 approximately 80% of employees
were providing food for more people than they did prior to working at New Horizons, while in

27
year 7 at the plateau approximately 95% of employees were providing for a larger number of
people. This increase in providing food for more people within the first seven years of formal
employment allows us to infer—at least in this case study—foreign direct investment can have
spillover effects on employees’ abilities to provide for their families and communities.
Lastly CutMeal, represented by the green line in Figure 1, displays the almost constant
estimated probability of employees reducing the size of meals for themselves or their families, or
skipping meals altogether after becoming employed at New Horizons. This result was surprising,
in that there was a slight increase in the probability of cutting and skipping meals within the first
two years of employment followed by a plateau around 30%. In year 1, approximately 25% of
employees were cutting the size of meals, which increases slightly in years 2 and 3 to the 30%
level. While this is a nominal increase in percentage, this figure points to the existence of food
insecurity in the community even amongst those with formal employment. The existence of food
insecurity amongst those with employment opportunities reveals the need for further assistance
and development in the Nampula region, which could be done through more FDIs. This
counterintuitive result could also be a function of the fact that it was found that New Horizons
employees also provided for additional family members at an increasing rate as time of
employment increased. Thus, while food intake per capita decreased those who were provided
food increased. We also caution that the coefficients of lnyearsnh is statistically insignificant so
that these findings could be due to nothing more than random fluctuations.

28
Conclusions
One of the most pressing issues related to international development efforts in sub-
Saharan Africa is improving household food security. International agencies and governments
use a variety of approaches to reduce food insecurity levels. Activities range from subsidizing
staple food products, to funding agricultural research and development, and to education
initiatives. This study analyzed the utilization of a Foreign Direct Investment to increase food
security in a region through economic development via job creation, formal employment, and
consistent income. The goal of the FDI, New Horizons, was to enhance financial wellbeing of
the community in province of Nampula, Mozambique. Our results reveal there is a significantly
(P < 0.05) increased probability of employees providing food for more people within the first
two years, with almost 100% of employees providing for more people after two years of formal
employment. This seems to indicate there are spillover benefits from employment. Given that
providing for more people in the community is an indicator for food security in sub-Saharan
Africa. This increased probability suggests that the longer a person is formally employed by an
FDI in the low-income world, the more likely they are to be food secure.
Another behavioral measure of household food security is the frequency of skipping or
reducing the size of meals so that everyone has a portion of food to consume within the
household. This is common amongst parents who do not have access to enough food for the
entire family. The results show that employees of New Horizons are skipping or cutting the size
of meals less often than before they obtained employment, with the percentage falling from 52%
to 26% before and after obtaining employment at New Horizons. However, all the independent
variables were insignificant, as seen in Table 2, meaning we failed to identify the cause of

29
reductions amongst employees. As such, it can be assumed FDI has a positive effect on food
security in rural communities, but the reason is yet to be identified.
There are several other measures of household food security available: the percentage of
income spent on food over the range of observed years employed at New Horizons was also
measured. Our results indicate a steady decline in the percentage of income spent on food. This
indicates that as employees stay with New Horizons, over time their basic food needs are being
met and their disposable income is being spent on other goods potentially things such as housing
improvements or schooling for their children. However, given that employees’ income levels
either stayed the same or increased over time, it can be assumed that the relative percentage of
income spent on food remained the same or declined due to an increase in disposable income.
This study could be improved by modifying the survey to include a subset of people in
the community who were unaffiliated with New Horizons. The changes in people’s lives outside
of New Horizons were not accounted for, so it is not known whether there were other, external
forces that may have improved food security within the community. Ideally, we would have
access to accurate census data from the Nampula region to compare the average population to
our sample.
These results appear to show that people who worked for New Horizons experienced a
rapid improvement in food security over the first few years of employment. This is likely
because FDIs provide an avenue for formal employment within a community, which many
people in sub-Saharan Africa currently cannot access. Over time, as revealed in this study,
formal employment can improve financial security and several behavioral markers which point
to increased household food security amongst employees. While there is no silver bullet to
improving overall food security in sub-Saharan Africa, holistic, agriculturally-based FDIs like

30
New Horizons could be a missing piece to the puzzle. As such, New Horizons serves as a case
study for international institutions, governments, and agencies looking to employ a less common
method of improving international food security in rural communities.

31
References
AFF. (2012). A Profile of the South African Maize Market Value Chain. Retrieved from
http://www.nda.agric.za/doaDev/sideMenu/Marketing/Annual%20Publications/Commodi
ty%20Profiles/field%20crops/Maize%20Market%20value%20Chain%20Profile%202016
.pdf.
Benson, C. & Clay, E. (1998). The impact of drought on sub-Saharan African economies - a
preliminary examination (English). World Bank technical paper ; no. WTP 401.
Washington, D.C. : The World Bank.
http://documents.worldbank.org/curated/en/178421468760546899/The-impact-of-
drought-on-sub-Saharan-African-economies-a-preliminary-examination.
Bickel, G., Nord, M., Price, C., Hamilton, W., & Cook, J. (2000). Guide to Measuring
Household Food Security. United States Department of Agriculture. Retrieved from
https://fns-prod.azureedge.net/sites/default/files/FSGuide.pdf
Braun, J. V. (2007). The world food situation: New driving forces and required action.
International Food Policy Research Institute. Retrieved from
https://books.google.com/books?hl=en&lr=&id=ZAjRFUN2cKcC&oi=fnd&pg=PR6&dq
=increase+in+food+price+and+food+insecurity&ots=8y8fB9NO6i&sig=O-
wUMFdOMRDkNpLiuehwworzSfQ#v=onepage&q=increase%20in%20food%20price%
20and%20food%20insecurity&f=false.
Castel-Branco, C. N. (2004). What is the Experience and Impact of South African Trade
and Investment on Growth and Development of Host Economies? A View from
Mozambique. Retrieved from
http://www.open.ac.uk/technology/mozambique/sites/www.open.ac.uk.technology.moza
mbique/files/pics/d97816.pdf.
Club of Mozambique (2018). “Mozambique: FDI falls by 25% on debt crisis, UN says”.
Retrieved from https://clubofmozambique.com/news/mozambique-fdi-falls-by-26-on-
debt-crisis-un-says/
Delay, S. B. (2016). Enhancing Quality of Life Through Foreign Direct Investment in Northern
Mozambique. Retrieved from
http://scholarworks.uark.edu/cgi/viewcontent.cgi?article=1010&context=aeabuht.
Dele, A. O. & Olufemi, A. (2016). Impact of foreign direct investment on economic growth in
Africa. Problems in Perspectives Management, June 2016. Retrieved from
http://www.academia.edu/27497668/Impact_of_foreign_direct_investment_on_economic
_growth_in_Africa
FAO. (2015). Regional Overview of Food Insecurity: Africa. Retrieved from
http://www.fao.org/3/a-i4635e.pdf.

32
FAO. (2015). The state of food insecurity in the world. Food and Agriculture Organization.
Retrieved from http://www.fao.org/3/a-i4646e.pdf.
FAO. (2016). The state of food and agriculture: climate change, agriculture, and food security.
Food and Agriculture Organization. Retrieved from:
https://www.compassion.com/multimedia/state-of-food-and-agriculture-fao.pdf.
GC-RED. (2017). Africa Asia Drought Risk Management Peer Assistance Network, February
2017 Newsletter. United Nations Development Programme. Retrieved from
http://www.undp.org/content/dam/undp/library/Environment%20and%20Energy/sustaina
ble%20land%20management/Newsletters/AADP%20Newsletter%20-
%20February%202017.pdf.
Hansen, M. J. (2016). “Nutritional Deficiencies During the Harvest Season According to
Household Consumption and Level of Nutritional Knowledge: A Case Study of Northern
Mozambique” Theses and Dissertations. 1553.
Hoddinott, J. (1999). Choosing Outcome Indicators of Household Food Security. Technical
Guide #7, International Food Policy Research Institute. Retrieved from
http://citeseerx.ist.psu.edu/viewdoc/download?doi=10.1.1.502.9519&rep=rep1&type=pd.
Holden, S. & Shiferaw, B. (2004). Land degradation, drought and food security in a less-favored
area in the Ethiopian Highlands: a bio-economic model with market imperfections.
Agricultural Economics 30 (2004) 31-49. Retrieved from
https://ageconsearch.umn.edu/bitstream/178250/2/agec2004v030i001a003.pdf.
ILO. (2016). Facing the Global Unemployment Challenges in Africa. Retrieved from
https://www.ilo.org/addisababa/media-centre/pr/WCMS_444474/lang--en/index.htm.
Masih, I., Maskey, S., Mussá, F. E. F., & Trambauer, P. (2014). A review of droughts on the
African continent: a geospatial and long-term perspective, Hydrol. Earth Syst. Sci., 18,
3635-3649, https://doi.org/10.5194/hess-18-3635-2014, 2014.
Novos Horizontes. (2019). Vision and Mission. Retrieved from
https://www.novoshorizontes.net/vision-and-mission.
OECD. (2002). Environmental Impacts of Foreign Direct Investment in the Mining Sector in
Sub-Saharan Africa. https://www.oecd.org/env/1819582.pdf
Owusu-Sekyere, E., Eyden, R. v., & Kemengue, F. M. (2014). Remittances and the dutch disease
in sub-saharan Africa: A dynamic panel approach. Contemporary Economics, 8(3), 289-
298. Doi:http://0-dx.doi.org.library.uark.edu/10.5709/ce.1897-9254.146
Rakotoarisoa, M. (2011). A Contribution to the Analyses of the Effects of Foreign Direct
Investment on the Food Sector and Trade in Sub-Saharan Africa. Retrieved from
https://www.gtap.agecon.purdue.edu/resources/download/5619.pdf

33
Ranum, P., Pena-Rosas, J. P., & Garcia-Casal, M. N. (2014). Global maize production,
utilization, and consumption. Retrieved from
https://nyaspubs.onlinelibrary.wiley.com/doi/abs/10.1111/nyas.12396
Rosegrant, M., Cai, X., Cline, S., & Nakagawa, N. (2002). The Role of Rainfed Agriculture in
the Future of Global Food Protection. Environment and Production Technology Division,
International Food Policy Research Institute. Retrieved from
https://pdfs.semanticscholar.org/e39e/8a572af5bf16a1cfb0337d4f690ad136532c.pdf.
Quinonez-Melgar, H.R. (2006). Advances in developing country food insecurity measurement:
household food insecurity and food expenditure in Bolivia, Burkina Faso, and the
Philippines. The Journal of Nutrition, Volume 136, Issue 5, 1 May 2006, Pages 1431S–
1437S. Retrieved from https://academic.oup.com/jn/article/136/5/1431S/4670070.
Statistics South Africa. (2016). Rising food prices: where are the most vulnerable? Statistics
South Africa. Retrieved from http://www.statssa.gov.za/?p=6135.
Tatlock, Christopher W. (2006). Water Stress in Sub-Saharan Africa. Council on Foreign
Relations. Retrieved from https://www.cfr.org/backgrounder/water-stress-sub-saharan-
africa.
UNCTAD. (2010). Best Practices in Investment for Development: Case Studies in FDI: How
Post-Conflict Countries Can Attract and Benefit From FDI: Lessons from Croatia and
Mozambique. New York: United Nations Publications.
UNCTAD. (2018). World Investment Report. Retrieved from
https://clubofmozambique.com/wp-content/uploads/2018/06/wir2018_en-2.pdf.
UNDP. (2016). Over 1.5 million Mozambicans face food insecurity caused by severe drought.
United Nations Development Programme. Retrieved from
http://www.mz.undp.org/content/mozambique/en/home/presscenter/articles/2016/04/04/o
ver-1-5-million-mozambicans-face-food-insecurity-caused-by-severe-drought-.html.
UNFPA. (2011). PAPP101 - S01: Demography on the world stage. United Nations Population
Fund. Retrieved from
http://papp.iussp.org/sessions/papp101_s01/PAPP101_s01_090_010.html.
VerSteeg, J. (2010). “Chicken, Eggs, in Mozambique”. Christian Reformed Church, news
publication. Retrieved from https://www.crcna.org/news-and-views/chicken-eggs-
mozambique.
Vissak, T. & Roolaht, T. (2014). The Negative Impact of Foreign Direct Investment on
the Estonian Economy. Problems of Economic Transition, Volume 48, Number 2, June
2005. Retrieved from
34
https://www.tandfonline.com/doi/abs/10.1080/10611991.2003.11049974?journalCode=m
pet20.
WFP. (2016). Year in Review. Retrieved from
https://documents.wfp.org/stellent/groups/public/documents/communications/wfp284681
.pdf?_ga=2.201599569.1905210606.1542154554-895163974.1542154554
World Bank Group. (2016). Accelerating Poverty Reduction in Mozambique: Challenges and
Opportunities. Retrieved from
http://documents.worldbank.org/curated/en/383501481706241435/pdf/110868-
ENGLISH-PUBLIC-Final-Report-for-Publication-English.pdf
Yende, S. S. (2015). The high cost of SA’s worst drought in 23 years. City Press. Retrieved
https://city-press.news24.com/News/The-high-cost-of-SAs-worst-drought-in-23-years-
20150708
Zimmerman, F. J. & Carter, M. (2003). Asset smoothing, consumption smoothing, and the
reproduction of inequality under risk and subsistence constraints. Journal of Development
Economics, 2003, vol. 71, issue 2, 233-260. Retrieved from
https://econpapers.repec.org/article/eeedeveco/v_3a71_3ay_3a2003_3ai_3a2_3ap_3a233-
260.htm.

35
Appendix A
Survey
Q1. Are you willing to participate in a survey assessing food security and economic wellbeing in
Northern Mozambique?
● Yes (1)
● No (2)
If No Is Selected, Then Skip To End of Survey.
Q2. We are interested how your economic well-being and food security has changed since
starting employment at New Horizons. The information collected here will be used to evaluate
the effect of job creation in Northern Mozambique. Confidentiality: all information will be
recorded anonymously with use of an assigned number. Right to withdraw: you are free to refuse
in the research or stop the s at any time. If you have questions or concerns about this study, you
may contact [email protected]. For questions or concerns about your rights as a research
participant, please contact Ro Windwalker, the University’s Compliance Coordinator, at 1+
(479) 575-2208 or by email at [email protected]. Thank you for your participation!
Q3. What is your gender?
● Male (1)
● Female (2)
Q4. Are you over 18?
● Yes (1)
● No (2)
Q14. Do you work for New Horizons?
● Yes (1)
● No (2)
If No Is Selected, Then Skip To End of Survey
Q5. Where do you live?
● Nampula (1)
● Rapale (2)

36
● Nicala (3)
● Other (4)
Q6. Were you born in Mozambique?
● Yes (1)
● No (2)
Q86. If not, where were you born?
● Zimbabwe (1)
● Congo (2)
● Tanzania (3)
● Rwanda (4)
● Burundi (5)
● Other (6)
Q7. If you are not from Mozambique, why did you leave?
● War (1)
● Money (2)
● Better economic opportunity (3)
● Education (4)
● Political instability at home (5)
● Obtained a job here before leaving (6)
Q91. How much formal schooling have you received?
● None (1)
● Some Primary Education (2)
● Primary Education (3)
● Secondary Education (4)
● Higher Education (5)
Q8. How many people live in your household?
Q9. How many children do you have?
If How many children do you have? Is Equal to 0, Then Skip To Do you work for New
Horizons?

37
Q10. If you have children, how many of them go to school?
If If you have children, how m... Is Equal to 0, Then Skip To Would you like to see your children
r...
Q11. Do your kids have knowledge about health?
● Yes (1)
● No (2)
Q15. How many years have you worked for New Horizons?
Q16. Did you have a formal job and income before coming to work for New Horizons?
● Yes (1)
● No (2)
Q17. Did you feel confident in the ability to provide food for your family before working for
New Horizons?
● Definitely yes (1)
● Probably yes (2)
● Might or might not (3)
● Probably not (4)
● Definitely not (5)
Q18. Do you feel confident in the ability to provide food for your family now?
● Definitely yes (1)
● Probably yes (2)
● Might or might not (3)
● Probably not (4)
● Definitely not (5)
Q19. Do you currently provide for more friends/family since working for New Horizons?
● Yes (1)
● No (2)
If No Is Selected, Then Skip To Have you made improvements to your ho...

38
Q20. If so, how many additional people?
Q89. If so, what do you provide to these people?
● Food (1)
● Shelter (2)
● Education (3)
Q21. Have you made improvements to your home since you started working for New Horizons?
● Yes (1)
● No (2)
If No Is Selected, Then Skip To Since working at New Horizons have yo...
Q22. If yes, select all that apply:
● Concrete Wall (1)
● Tin Roof (2)
● New House (3)
● New Rooms (4)
● Built a Well (5)
● Electricity (6)
Q23. Since working at New Horizons have you changed your mode of transportation?
● Yes (1)
● No (2)
If No Is Selected, Then Skip To Were you able to save money before wo...
Q24. If yes, select what you for transportation use now:
● Bike (1)
● Walk (2)
● Car (3)
● Carpool (4)
● Motorcycle (5)
● Bus (6)
Q25. What type of transportation did you use before?
● Bike (1)

39
● Walk (2)
● Car (3)
● Carpool (4)
● Motorcycle (5)
● Bus (6)
Q26. Were you able to save money before working at New Horizons?
● Yes (1)
● No (2)
Q27. Are you able to save money now?
● Yes (1)
● No (2)
Q28. Do you think you are more likely to send your children to school now that you work for
New Horizons?
● Yes (1)
● No (2)
Q29. Since you began working for New Horizons, where has the majority of your newly
acquired income gone to?
● House (1)
● Increase in Food (2)
● Education (3)
● Transportation (4)
● Reinvest in the Farm (5)
Q92. Do you always get the types of food that you want to eat?
● Yes (1)
● No (2)
Q35. If not, why do you not get the types of food that you want to eat?
● Not enough money for the kinds of food we want (1)
● Too hard to get to the store (2)
● On a diet (3)

40
● The kinds of food we want aren't available (4)
● Good quality food isn't available (5)
Q42. Before working for New Horizons, what was the main part of diet?
● Meat (1)
● Produce (3)
● Cassava (4)
● Rice (5)
● Meal (6)
Q43. After working for New Horizons did you ever rely on foods that are low in nutritional value
to feed your family because you were running out of money to buy food?
● Meat (1)
● Produce (2)
● Cassava (3)
● Rice (4)
● Meal (5)
Q44. On average, before working for New Horizons how many meals per day did you eat?
● 1 (1)
● 2 (2)
● 3 (3)
● 4+ (4)
Q45. On average, after working for New Horizons how many meals per day do you eat?
● 1 (1)
● 2 (2)
● 3 (3)
● 4+ (4)
Q46. Does your family consume more meat now that you work for New Horizons?
● Yes (1)
● No (2)

41
Q47. Before working for New Horizons, did you ever cut the size of you or your children's meals
because there wasn’t enough money for food?
● Yes (1)
● No (2)
If No Is Selected, Then Skip To After working for New Horizons, did y...
Q48. If yes, how many times per week did you cut the size of you or your children's meals
because there wasn't enough food?
Q49. After working for New Horizons, did you ever cut the size of you or your children's meals
because there wasn't enough money for food?
● Yes (1)
● No (2)
If No Is Selected, Then Skip To Before working for New Horizons, did ...
Q50. If yes, how many times per week did you cut the size of you or your children's meals
because there wasn't enough food?
Q51. Before working for New Horizons, did you or your children ever skip a meal because there
wasn't enough food?
● Yes (1)
● No (2)
If No Is Selected, Then Skip To After working for New Horizons, how m...
Q52. If yes, how many times per week did you skip a meal because there wasn't enough food?
Q53. After working for New Horizons, did you or your children ever skip a meal because there
wasn't enough food?
● Yes (1)
● No (2)
If No Is Selected, Then Skip To Do you have a budget for food?
Q54. If yes, how many times per week did you or your children skip a meal because there wasn't
enough food?

42
Q55. Do you have a budget?
● Yes (1)
● No (2)
Q56. Where do you get most of your food from?
● Homegrown (1)
● Market (2)
● Other (3)
Q57. If your income increased, would you devote more of it to food?
● Yes (1)
● No (2)
If No Is Selected, Then Skip To Do you always have clean drinking wat...
Q58. If so, what foods would you use the extra money to buy?
● Meat and eggs (1)
● Fruits and vegetables (2)
● Meal (3)
● Cassava (4)
● Rice (5)
Q59. Do you always have clean drinking water available for you and your family year round?
● Yes (1)
● No (2)
Q60. Where do you get your water?
● River (1)
● Bucket Well (2)
● Pump (3)
Q61. Have you been to the doctor more, less, or the same for sickness since you began working
for New Horizons?
● More (1)
● The Same (2)
● Less (3)

43
● Never (4)
Q93. Have you been to the doctor more, less, or the same for checkups since you began working
for New Horizons?
● More (1)
● The Same (2)
● Less (3)
● Never (4)
Q62. Where do you and your family typically go when you are sick?
Q64. Have you or anyone in your family gone to the hospital?
● Yes (1)
● No (2)
If No Is Selected, Then Skip To Where was your last child born?
Q65, If so, why did you go to the hospital?
Q66. Where was your last child born?
● Hospital (1)
● Home (2)
Q67. Have you had a biological child die?
● Yes (1)
● No (2)
If No Is Selected, Then Skip To If you know someone who is sick, has ...
Q68. If so, how many?
Q69. If you are sick, would it affect your ability to go get food?
● Yes (1)
● No (2)
If No Is Selected, Then Skip To End of Block
Q71. What has improved the most since working at New Horizons?

44
● An Increase in Food (1)
● Medical Care (2)
● A Better Home (3)
● Education (4)
● Transportation (5)
Q72. Are you an outgrower?
● Yes (1)
● No (2)
If No Is Selected, Then Skip To End of Survey
Q87. Would you like to see your children raise chickens?
● Yes (4)
● No (5)
Q88. Why?
Q74. How many birds did you start with when you began working for New Horizons?
Q76. What aspect of your farm would you like to improve to make more money?
Q94. What would you improve about New Horizons?
Q77. Does it affect the well being of the crops or chickens when someone in your family is sick?
● Yes (1)
● No (2)