THE EFFECT OF DISSOLVED CHLORINE ON THE ... EFFECT OF DISSOLVED CHLORINE ON THE 0 PITTING BEHAVIOR...
40
c-G r , FILE COPY THE EFFECT OF DISSOLVED CHLORINE ON THE 0 PITTING BEHAVIOR OF 304L STAINLESS STEEL 00 IN A 0.5 N NaCl SOLUTION SBH.H. Lu and D.J. Duquette Rensselaer Polytechnic Institute Materials Engineering Department OCTOBER 1989 Technical Report to the Office of Naval Research Contract No. U00014-89-J-1125 Reproduction in whole or in part for any purpose of the U.S. Government is permitted. Distribution of this document is unlimited. DTIC FLECTE 5OAT 301989L 29 092
Transcript of THE EFFECT OF DISSOLVED CHLORINE ON THE ... EFFECT OF DISSOLVED CHLORINE ON THE 0 PITTING BEHAVIOR...
c-G r , FILE COPY
THE EFFECT OF DISSOLVED CHLORINE ON THE
0 PITTING BEHAVIOR OF 304L STAINLESS STEEL
00 IN A 0.5 N NaCl SOLUTION
SBH.H. Lu and D.J. DuquetteRensselaer Polytechnic InstituteMaterials Engineering Department
OCTOBER 1989
Technical Report to the Office of Naval Research
Contract No. U00014-89-J-1125
Reproduction in whole or in part for any purpose of the U.S.Government is permitted. Distribution of this document isunlimited.
DTICFLECTE
5OAT 301989L
29 092
The Iffect of Dissolved Chlorine am the
Fitting lehaviur of 304L Stainless Steel 0in a 0.5 3 MCa Solution
H.H. Lu and D.J. DuquetteDepartment of Materials EngineeringRensselaer Polytechnic Institute
Troy. New York 12180-3590
&*@@toole Foran S DAiuSCIO TAIUlnnounee d 3Jaatltl•oatieel_ ,
Avallability C0E4o
Dl •t( and/opDist S pe0tLL

Tb.. Effect of Dissolved Chlorine on the
Pitting Behavior of 3041. Stainless Steel
in a 0.5 V ladl Solution
N.H. Lu and D.J. DuquetteýDepartment of Materials EngineeringRensselaer Polytechnic Institute
Troy, Now York 12180-3590
~Q r
Zi.Electrochemical vzperiments were performed on a 304L stainless ste'el
alloy in a 0.5 Nii¶5 -1>solution as a function of chlorine content (0-180
mg/l). Experiments performed included a measurement of the corrosion
potential as a function of time, the determination of the breakdown
potential, and of the repassivation potential, utilizing cyclic
polarization curves: and the use of a scratching electrode technique-to
measure the kinetic asepects of the breakdown of passivity. The addition
of chlorine to' a'solution of p!H5 in the concentration range of 20-60 ppmn
chlorine resulted in a significant shift in the corrosion potential in tht
noble direction. At higher concentrations of chlorine the corrosion
potential shifts back toward that observed without chlorine additions.ý
Chlorine also results 'in a monotonic shift in the breakdown potential,
suggesting that the passive film is rendered more stable against the
initiation of localized corrosion. However, the repassivation potential
exhibits a minimum in the chlorine concentration range where the corrosion
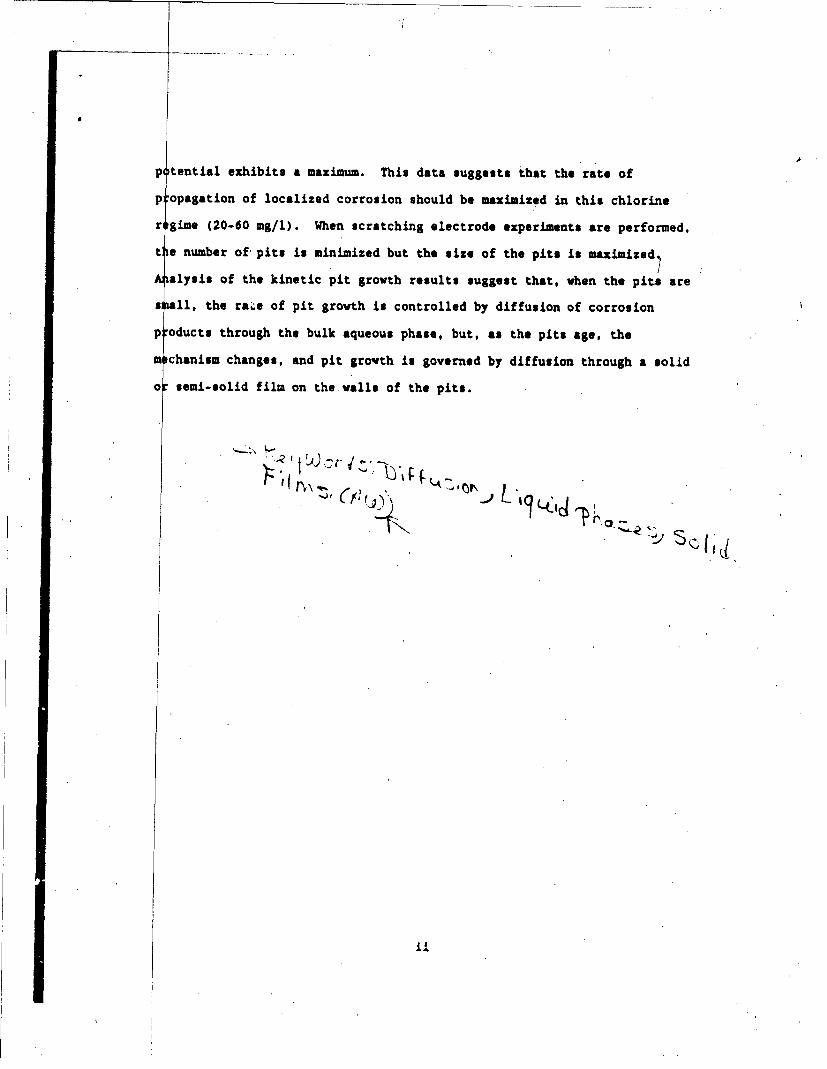
p tential exhibits a maximum. This data suggests that the rate of
p opagation of localized corrosion should be maximized in this chlorine
r gime (20-60 mg/i). When scratching electrode experiments are performed,ti e number of pits is minimized but the size of the pits is maximized.•
alysis of the kinetic pit growth results suggest that, vhen the pits are
s all, the rae of pit growth is controlled by diffusion of corrosion
ploducts through the bulk aqueous phase, but, as the pits age, the
m chanism changes, and pit grovth is governed by diffusion through a solid
o semi-solid film on the walls of the pits.
•r
ij
The Iffect's of Dissolved Chlorine on the
Pitting Behavior of 304L Stainless Steel
In a 0.5N NaCi Solution
H.H. Lu and D.J. DuquetteDepartment of Materials Engineering
Rensselaer Poltechnic InstituteTroy, New York 12180-3590
Introduction
Chlorine added to vater is a potent algaecide and bacteriocide, and
has been used in a number of applications to reduce biofouling and/or
biocorrosion. However, the noble redox potential for the C12 /Cl1
reaction suggests that passive metals or alloys in chlorive containing
solutions may be susceptible to pitting and/or crevice corrosion if
chlorine is dissolved in solutions. which contain chlorides., However, a
literature survey conducted by NACE in 1976 resulted in the discovery of
only 30 publications related to chlorinated water, (most related to wet
chlorine) and only 19 publications related to chlorinated brines. (1)
None of'these studies were directly related to stainless steels.
More recently, Goodman, in a review of the effects of chlorination on
materials for sea water cooling systems concluded that there are few data
availablq related to the effects of chlorine on the corrosion behavior ef
ferrous alloys in.general and still less on the behavior of stainless
alloys.(2) Some recent studies, primarily performed in chlorinated sea
water, have been performed on a number of stainless alloys (3-6), with
mixed results. For example, it has been shown that, for low levels of
chlorine (0O.lppm) the drift of corrosion potential in the noble direction
which is generally observed in sea water for 300 type steels was
inhibited. However, a large, stable shift it the corrosion potential was
measured, and both pitting and crevice corrosion were observed on the free
surfaces of the alloy, although crevice corrosion in an artificial crevice
was no worse than for unchlorinated waters. The accelerated corrosion
phenomenon due to chlorine was shown to be highly temperature dependent,
with corrosion of even highly resistant alloys being observed at 40°C, but
little corrosion being observed at 15.C.( 4' 6 ) Pitting and crevice
corrosion also have been observed in 22Cr-SNi-3Mo uith chlorine levels of
1 mg/l.(3) The noble shift in the corrosion potential has been
attributed to an alternative cathodic reaction due to the reduction of
dissolved oxygen:(4)
OCW + 2e" + H20 Cl" + 20H" -l)
If the shift in the corrosion potential due to surface reaction is
sufficiently electropositive, the pitting potential may be exceeded, and
either pitting or crevice corrosion can be expected. This investigation
examines the pitting tendency of an 18Cr - 8Ni stainless steel in
chlorinated soaium chloride solutions.
Experimental Procedure
Potentiodynamic anodic polarization experiments, as well as scratching
2
electrode experiments, were performed on a vacuum melted 304L stainless
steel in solutions containing 0.5N sodium chloride at room temperature
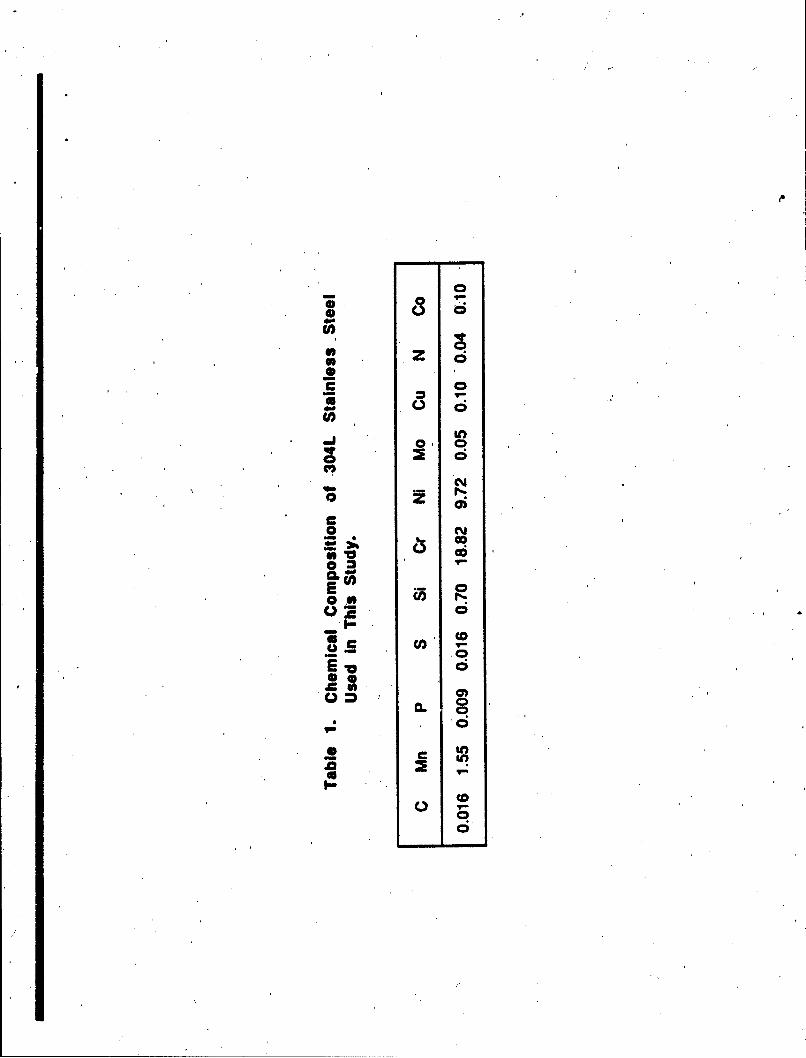
(25t3°C). The alloy composition is shown in Table I. Chlorine
concentrations were controlled between 0 and 180 mg/l by the addition of
sodium hypochlorite (NaOCl), and the pH of the solution was controlled
with the addition of HCl. Chlorine is generated in this system
accordingly to the reactions:
NaOCl + HCl NaCI'+ HOCl (2)
HOCI + El C12 + H20 (3)
The bulk of the experiments conducted were at *a pH of' 5.0. At this pH
the primary species present is HOCI (Figure 1). Specific chlorine
concentrations were measured for each experiment utilizing the standard
DPD method (7). In addition to experiments conducted at pH5, pH for some
experiments was varied between pHl and pH5. An additional variable
included a preliminary study, of the effects of cathodic reduction of the
alloy surface prior to polarization' in order to examine the role of the
stability of the air formed film against localized corrosion.
The specimen geometry was approximately 1 cm x 1 cm~x 0.3 cm.
Polarization samples were mounted in epoxy. Specimen surfaces were wet
ground to 600 grit on SiC paper. For most experiments the specimen was
held at -1.0 V vs SCE for five minutes, and a one hour exposure at the
rest potential followed by an anodic polarization scan. Polarization scan
rates were performed at 10 uar/sec and the breakdown putential, Eb, and
the repassivation potential, Ep. were determined from the polarization
3
scans, performed .'.t in the noble direction followed by a reverse scan
in the active direction.
A limited study of the kinetics of pit growth was performed by fixing
the potential at a value noble to the pit nucleation potential, scratching
the specimen surface, and monitoring the resultant increase in current
density, These experiments were performed at room temperature, in a 0.5 N
NaCl solution of pH5, with 0, 20, and 60 mg/l chlorine.
Results and Discussion
Figure 2 shows anodic and cathodic polarization curves for 304L
stainless steel, cathodically reduced at -1.0 V vs. SCE for 5 minutes, in
0.5 N NaCl solutions containing 20 mg/l and 60 mg/l chlorine, at room
tempezature. Similar data were generated for a chlorine concentration of
180 mg/l but are not shown for clarity. In each solution the alloy shows
a marked hysteresis behavior, indicating that crevice corrosion can be
expected, and be a significant problem in the presence of chlorine.
Additionally, increasing the chlorine concentration of the solution
shifted the corrosion potential in the noble direction by approximately
300-400 my.
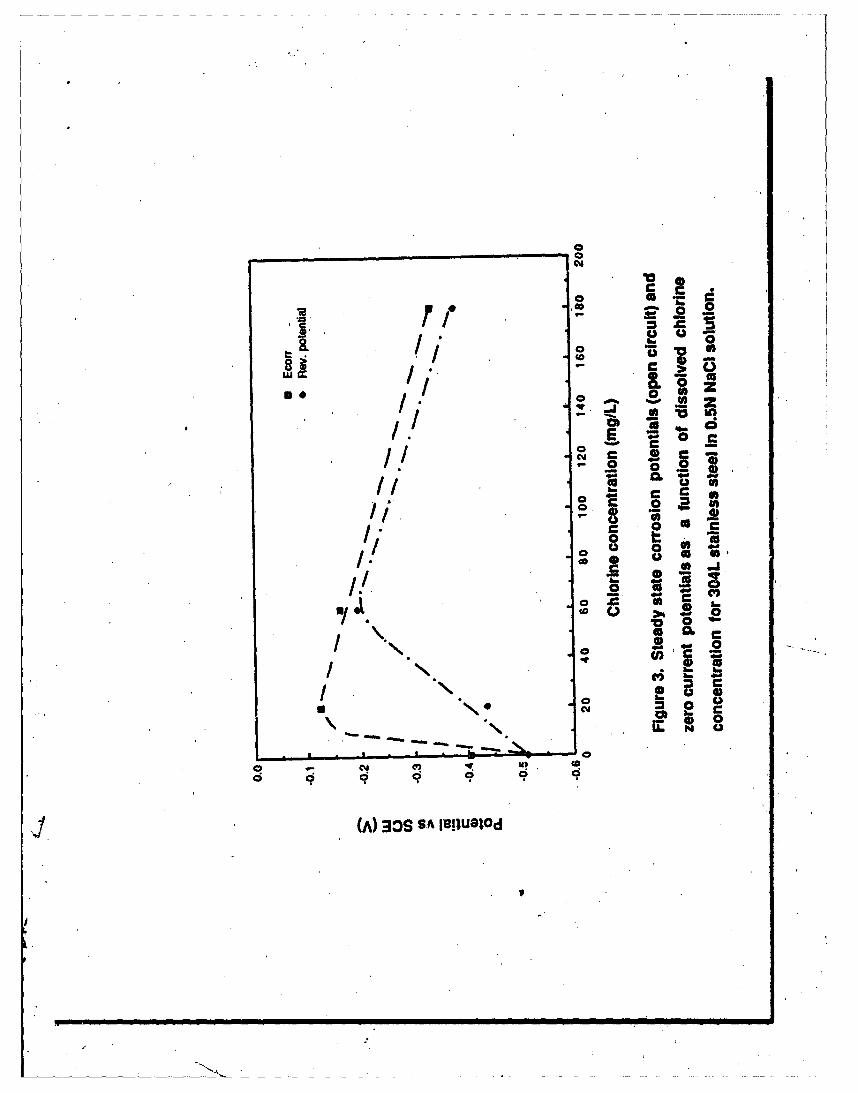
A similar shift in the zero current potential, as derived from the
polarization curves also is observed, although the maximum potential in
this case occurs at 60 rather than 20 mg/1 dissolved chlorine (figure 3).
The scatter in this data. as determined from triplicate tests. is the the
order of ±30 my. The differences is these values are believed to be due
to the relatively short time for the polarization experiment compared to
the measurements of the free corrosion potential. For low concentrations
of chlorine the steady state conditions on the alloy surface are sluggish
.4
compared to the situation for more concentrated chlorine solutions.
Accordingly, the corrosion potential tends to appear to be somewhat more
noble than the zero-current potential for chlorine concentrationq less
than 60 mg/l. At higher chlorine concentrations the values are similar.
The breakdown potential and the repassivation potential as a function
of dissolved chlorine concentration are shown in figure 4. The breakdown
potential increases monotonically'with increasing chlorine concentrations,
from a value of -+ 0.050 mv vs. SCE at 0 mg/1 chlorine to a value of
-÷ 0.400 mv vs. SCE at 180 mg/l dissolved chlorine. The repassivation
potential, on the other hand, exhibits a minimum at approximately 20 mg/l
and increases for larger concentrations of chlorine. If the data of
figures 3 and 4 are plotted on the same diagram, figure 5, it can be seen
that in the chlorine concentration range of 10-60 mg/l, the corrosion
potential is in fact noble to the repassivation potential. In this
chlorine concentration regime then, localized corrosion initiated in
crevices can be expected to freely propagate, although, as the chlorine
concentration is increased, the resistance to the initiation of localized
corrosion is increased. The scatter in these data,,as determined from
triplicate tests is also of the order of t30 mv.
Thus, it is apparent from these data that the effect of dissolved
chlorine on the localized corrosion behavior of 18-8 stainless steels is
more likely to be manifested in a propensity for crevice corrosion in this
chlorine concentration-range of 10-60 mg/l. Accordingly, a series of
experiments was conducted wherein the passive film was mechanically
ruptured by scratching and the resultant current density was measured as a
function of time after scratching. The results of these experiments are
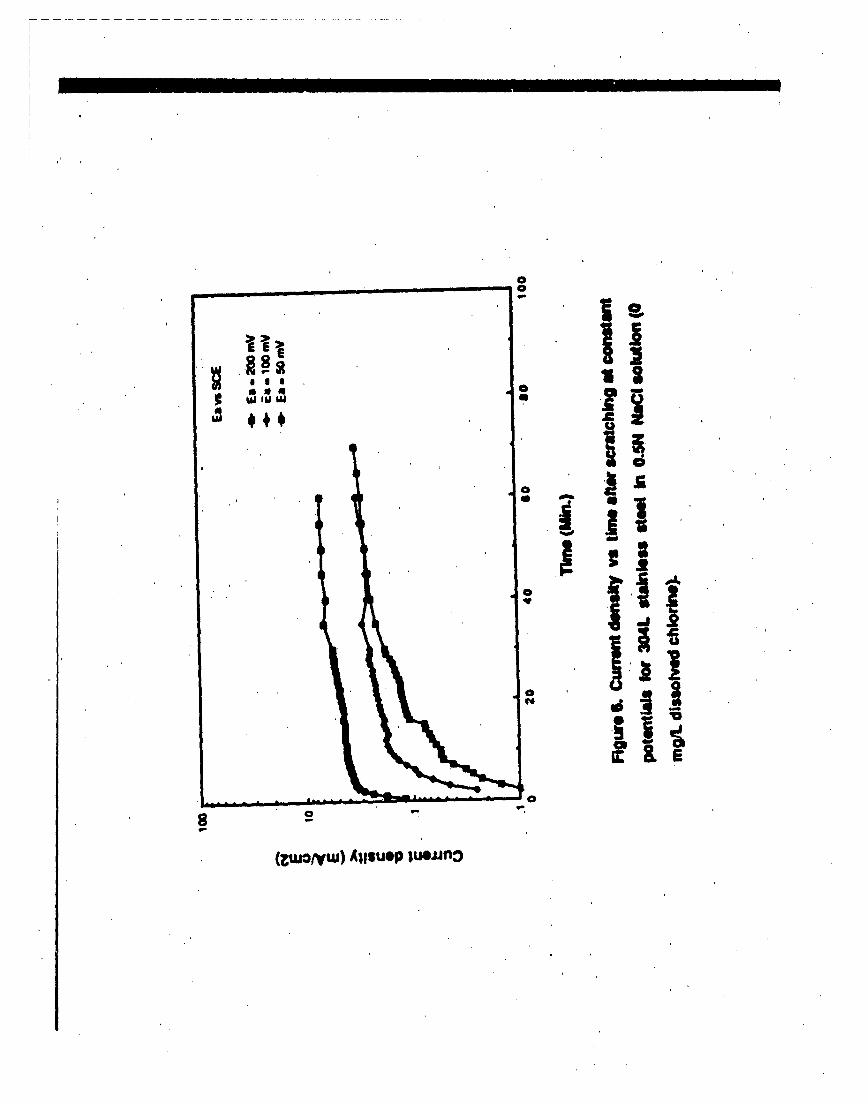
shown in Figures 6-9. For example, figure 6 shows the increase in current
5
density for a specimen held at 50, 100 and 200 my vs. SCR. respectively in
0.5 Na&C solution without chlorine additions (Rb a 0.046 v, Ep W 0.122
v vs. SCE). The data shown here are as expected, and indicate a large
increase in current density shortly after scratching, followed by a region
of steady state corrosion. These data are suggestive of rapid initiation
Zollowed by transport limited pit growth.
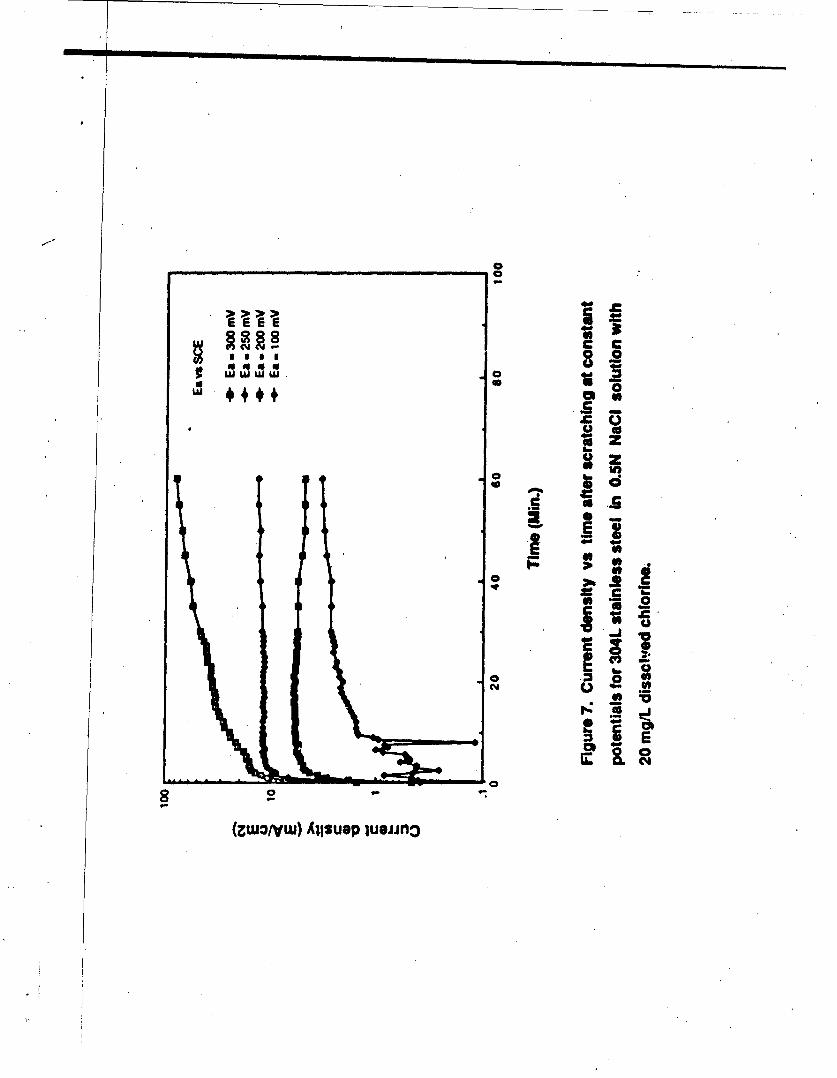
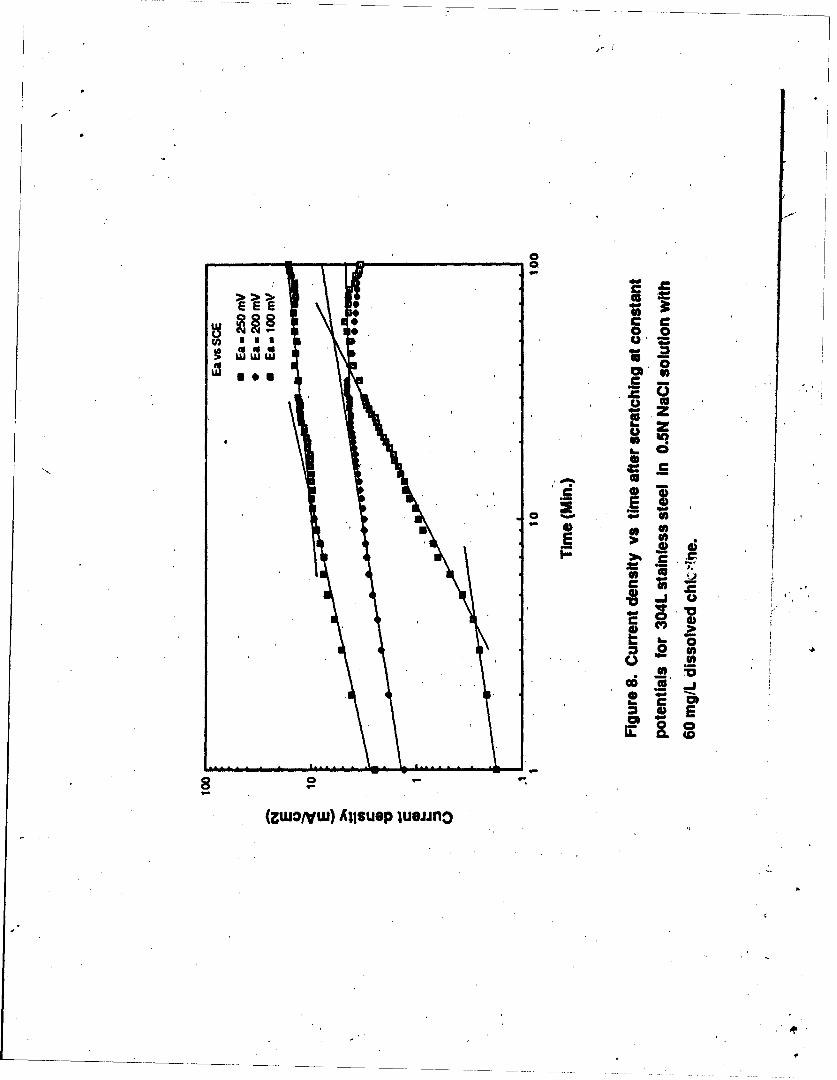
Figures 7, 8, and 9 show these data for 20 and 60 mg/1 dissolved
chlorine and exhibit similar trends. At 20 mq/1 chlorine however. (1b -
0.195 v and Ep a -0.238 v vs. SCE) the initial data at +100 mv vs. SCE
are unstable, suggesting an attempt to repassinate the alloy surface.
(figure 7a) At intermediate applied potentials (200 my and 250 mW vs.
SCE) steady state pit growth is observed immediately after initiation;
while at the highest applied potential, a slight increase in current (or
pit growth) with time is observed. At 60 mg/1 dissolved chlorine (Eb -
0.263 mv vs. Ep W -200 my vs. SCE) a small perterbation in current
occurs for an applied potential of +100 mv vs. SCE. At higher applied
potentials there is a large initial increase in current density followed
by a steady state, virtually constant, current suggesting steady state pit
growth.
It has been suggested that the time dependence of pit initiation and
growth on passive metals and alloys obeys a relationship:s 8 )
it = ip + A(t - t)m (4)
where it - total measured current density
iP - passive current density
t I - incubation time
Am - constants which are a function of transport
conditions and pit geometry.
6
For the experiments described here the passive current density Ca c~n
be assumed to approach zero and. since the surface is scratched to
initiate loczlized corrosion, tj 0. Therefore this equation
simplifies to:
i A t m (5)
or
log i -log A + m log t (6)
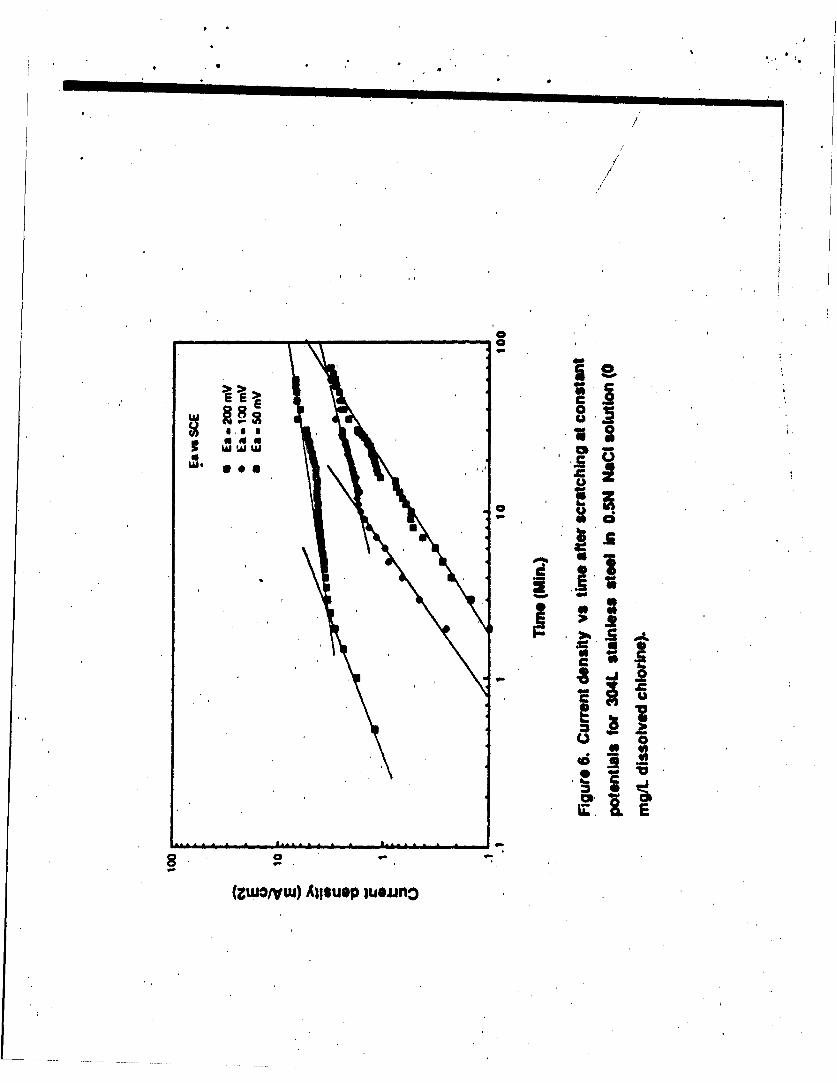
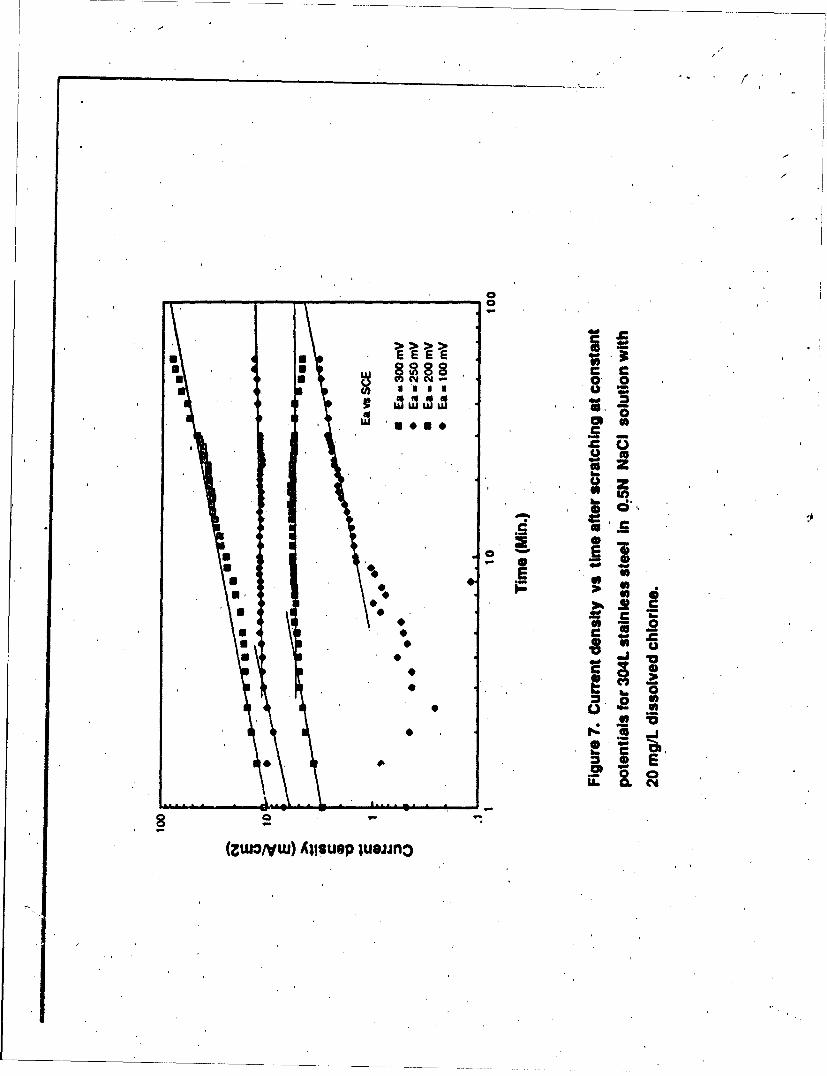
The data of figures 6a - Sa can thus be described on a log-log plot,
and if the equation is valid, the constants A and m can be determined from
the plot. Figures 6b - Sb show this data, and indicate that each of sets
of data for figures 6a - 8a cav be reduced to either one or two slopes;
the first slope related to a transient condition (pit intiation) and the
second to pit propagatioa.
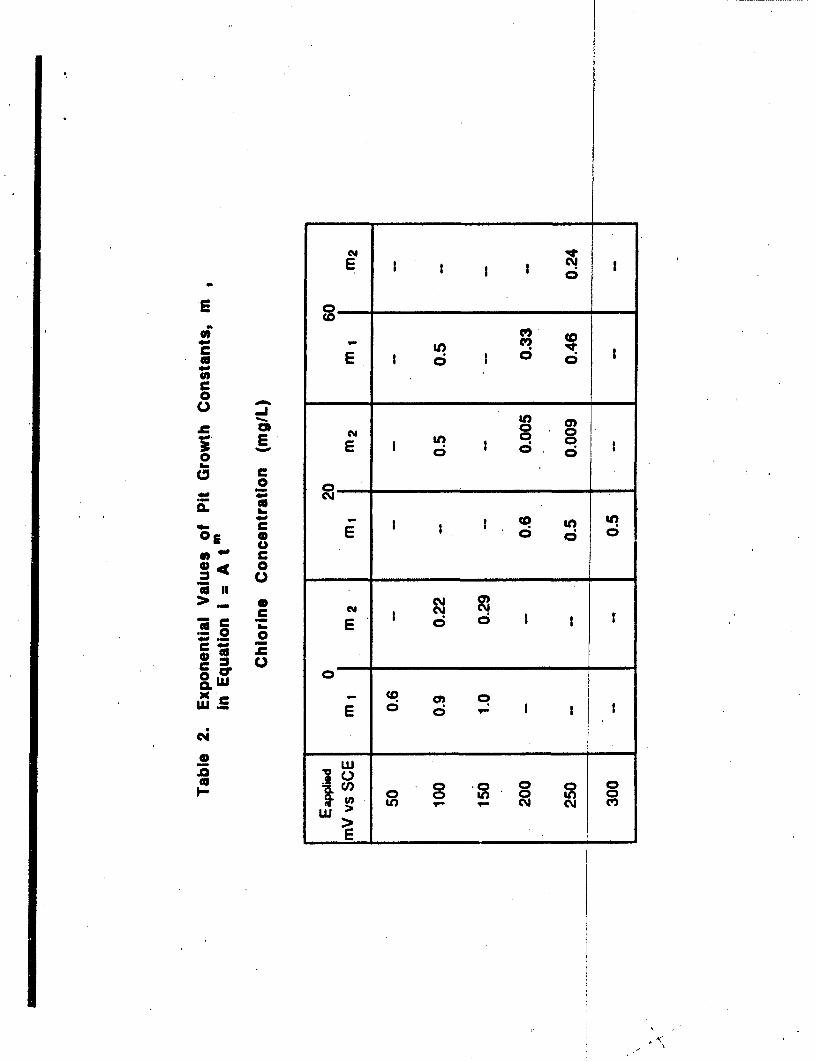
For most of the initial or transient pit growth (with the exception of
a solution containing 60 mg/l chlorine at 100 my vs. SCE), the slopes lie
between 0.5 and 1.0, with a mean value of 0.6 - 0.7. (Table I)
This value can be rationalized by considering the geometry of the pits
(assumed to be circular on initiation and to grow hemispherically) and the
assumptions that the growth of the pits is controlled by transport
processes.
The relationship between the linear growth of a hemispherical pit. and
time can be expressed as (8):
r -c 3 VA t2 (7.)
7
/and, for transport control
r C3 i""(8r- Z
where3•
13VmS- (9)'
8SrF
In these equations, r is the pit radius, V. is the specific volume
of the metal, F As Faraday's constant, and Z is the utber of pits.
It can be shown from simple meastirements and calculations that for
each of these cases considered here Z-r 2 is equal toa constant (Tabae
I11) and thus the current density should scale as r2/C0, and the slope
of log i vs. time should have a slop* of 2/3. It is assumed that the
deviation of some of the measured slopes from.2/3 is a result of the
absence of purely hemiopherical pits (a geometric factcr) and the
assumption that all pits are of the same size. In any case it can be
concluded that initial pit growth is essentially the em for both
unchlorinated and chlorinated sodium c.hloride solutions, is diffusion
controlled through the liquid phase, and initially is not influenced by
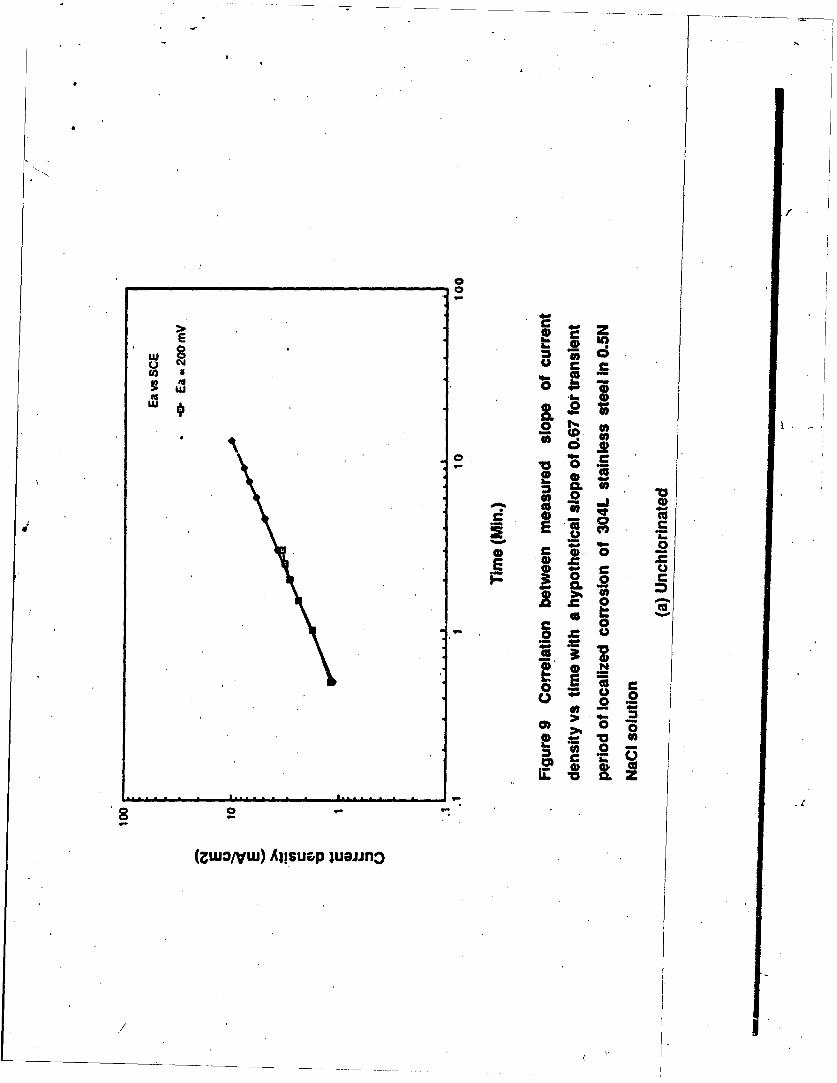
the age of the pits. Figure 9a acid Ob show a slope of 0.67 superimposed
on the transient current data from figures 6b and (unchlorinated,, +200 mv
Svs. SCE) and 7b (20 nmg/l chlorine, + 200 my w. SCE) and show the
excellent fit of the data for potentials noble to the breakdown potential.
However, the second slope obtained for each set of experiments, which
generally approaches zero (Table II), indicated that the pits approach a
steady state growth rate, where transport control through a solid or
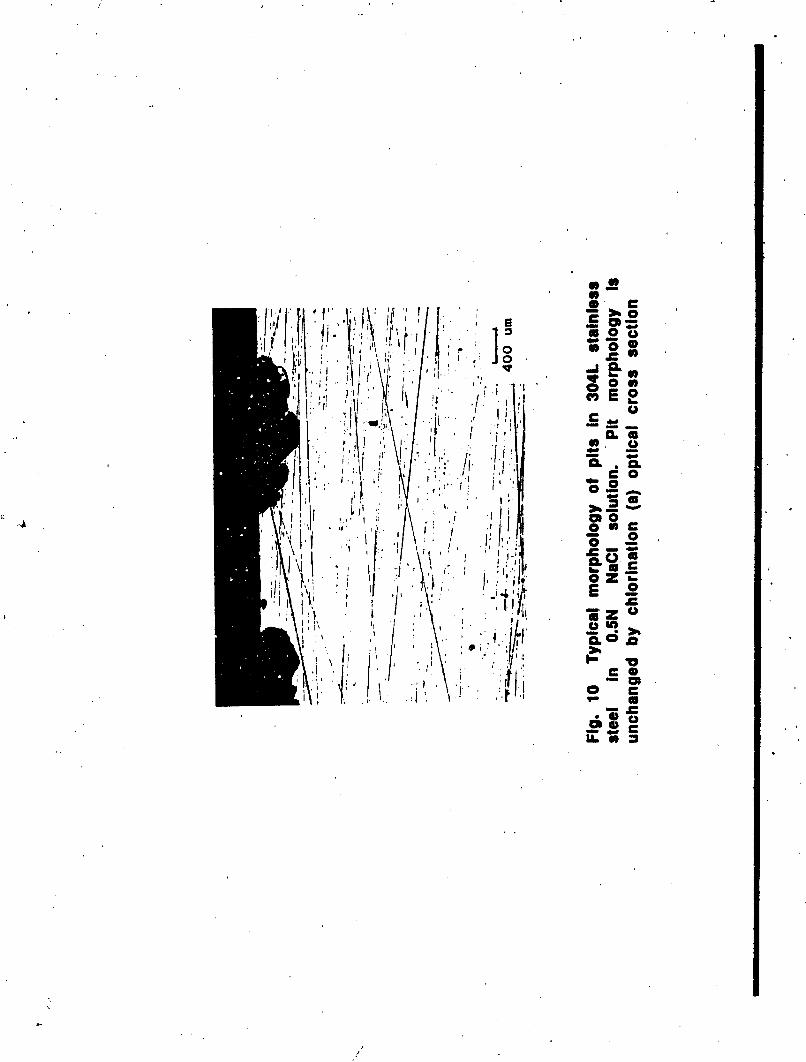
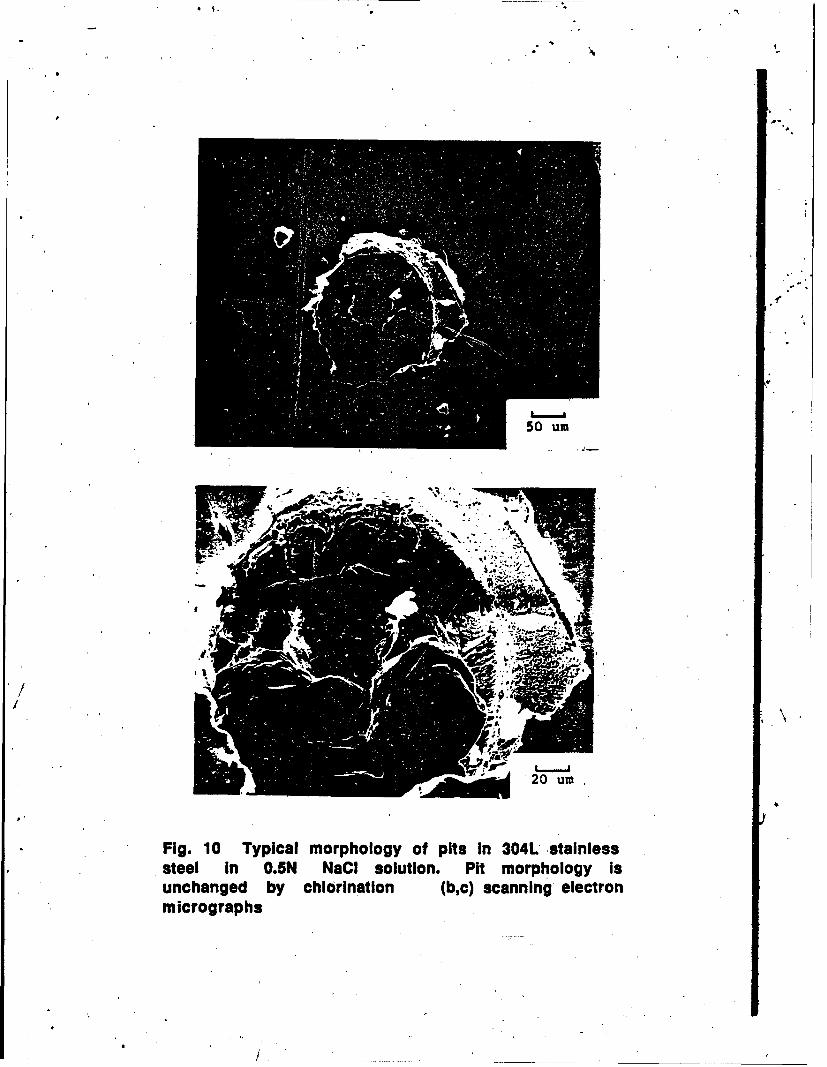
semi-solid film governs the process. Further evidence of this type of
behavior as the pits age is the faceted appearance of the pits

as shown in Figure 10. This faceted appearance is indicative of slow
transport through a.solid or semiesolid film.
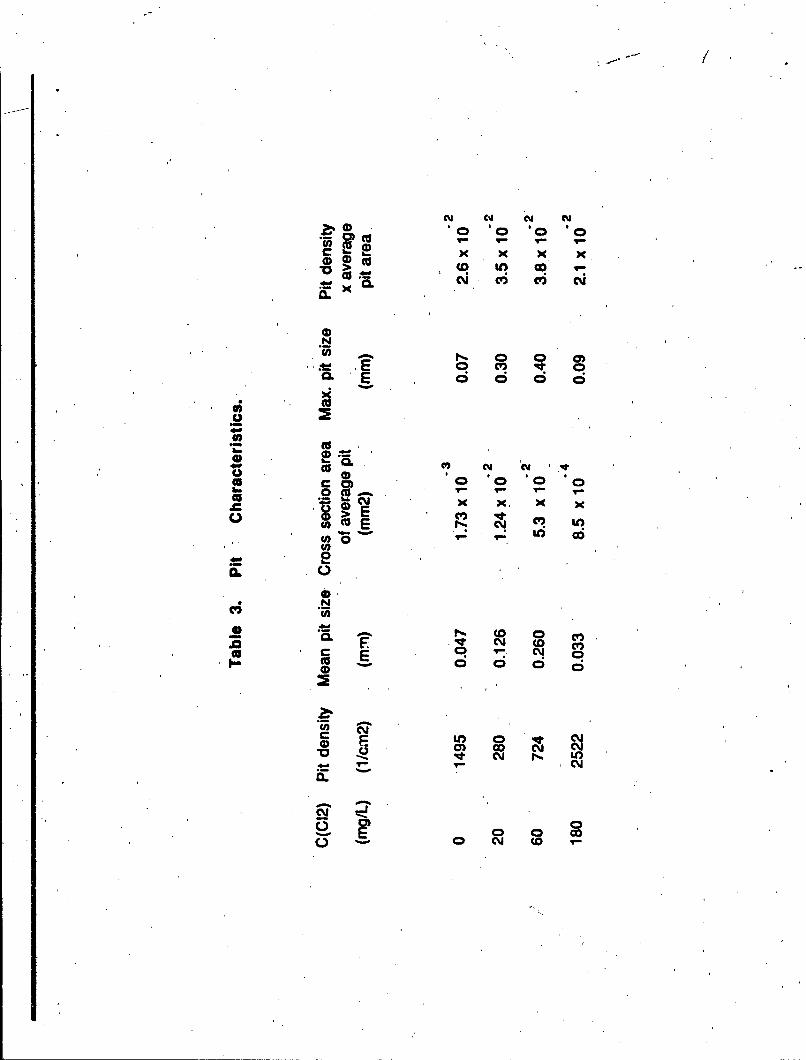
Pit Distribution and Morphologies
Although the kinetic values of-pit growth are virtually independent of
the chlorine concentration of the solution, the interaction between pit
initiation and growth are quite different, depending on the chlorine
concentration. Table III shows the average pit density for samples
measured at the conclusion of the polarization experiments, as well as the
mean pit size and the maximum pit size measured in a 1 cm2 area. These
data indicate that the number of pits per urit area is large with no
dissolved chlorine, but that the mean pit size is small and correlates
well with the maximum pit diameter. At 20 mg/l dissolved chlorine (the
most active repassivation potential and the most noble corrosion
potential) the pit density is at a minimum, while the pit diameter is a
maximum. As the amount of chlorine in solt%:ion is increased, the pit
density inpreases an.o, in general the pit size decreases. Thus, the pit
size, and the pit densfty correlate with the differences between the
repassivation potential and the corrosion potential. At values of 20 to
60 mg/l dissolved chlorine, the number of pits is relatively low and the
pit size is relatively large. This suggests that, at these concentrations
pit growth occurs readily, while initiation of new pits is more
difficult. At lower and higher concentration of chlorine, large numbers
of pits are observed, initiation is easy but growth of the pits is
inhibited. Thus. the morphological characteristics of the pits correlate
well with the differences between the breakdown and repassivation
potentials. These differences, exhibiting a maximum between 20-60 mg/l
9
chlorine, suggest that crevice corrosion (essentially a pit growth
process) can be expected to be a factor in this concentration range. The
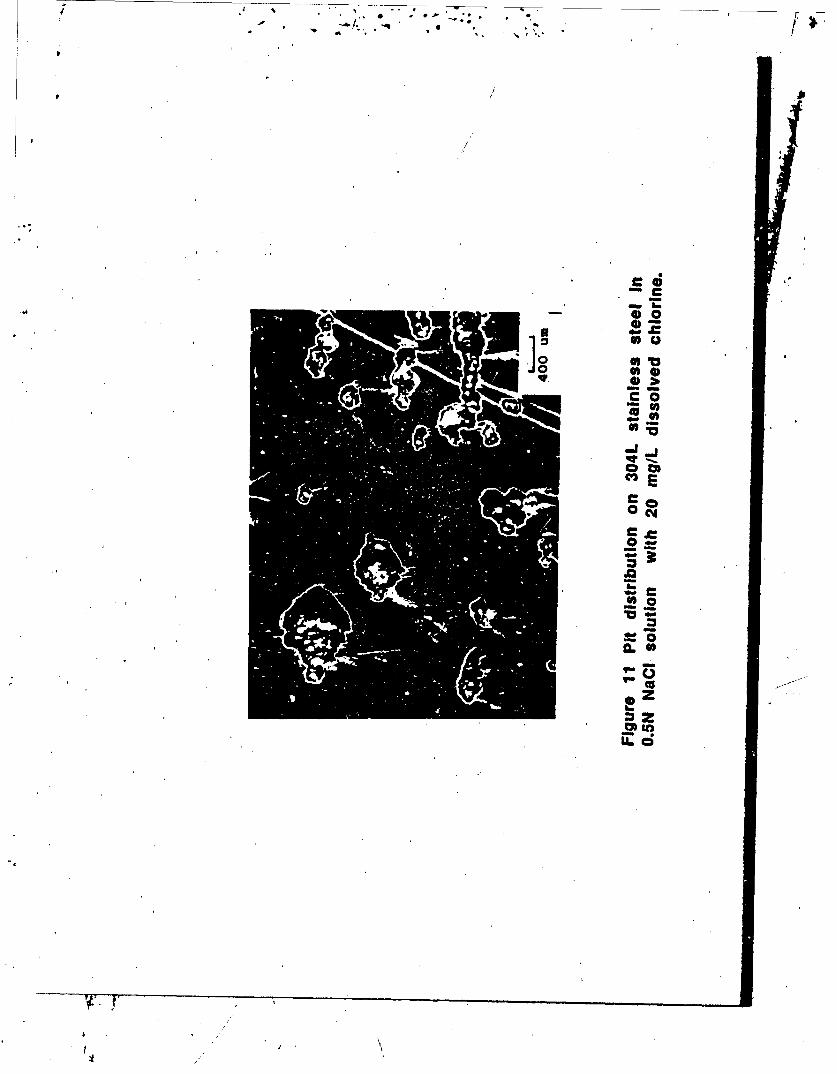
distribution and morphology of pits in a solution containtag 20 mg/l
chlorine is shown in Figure 11.
To summarize, it appears that chlorine, a strong oxidant, stabilizes
the passive film against pit initiation as measured by the breakdown
potential. However, at intermediate concetcrs tions, when breakdown
occurs, pit growth is enhanced. At very high concontratLms the strong
oxidizing potential of the chlorine apparently inhibits pit growth,
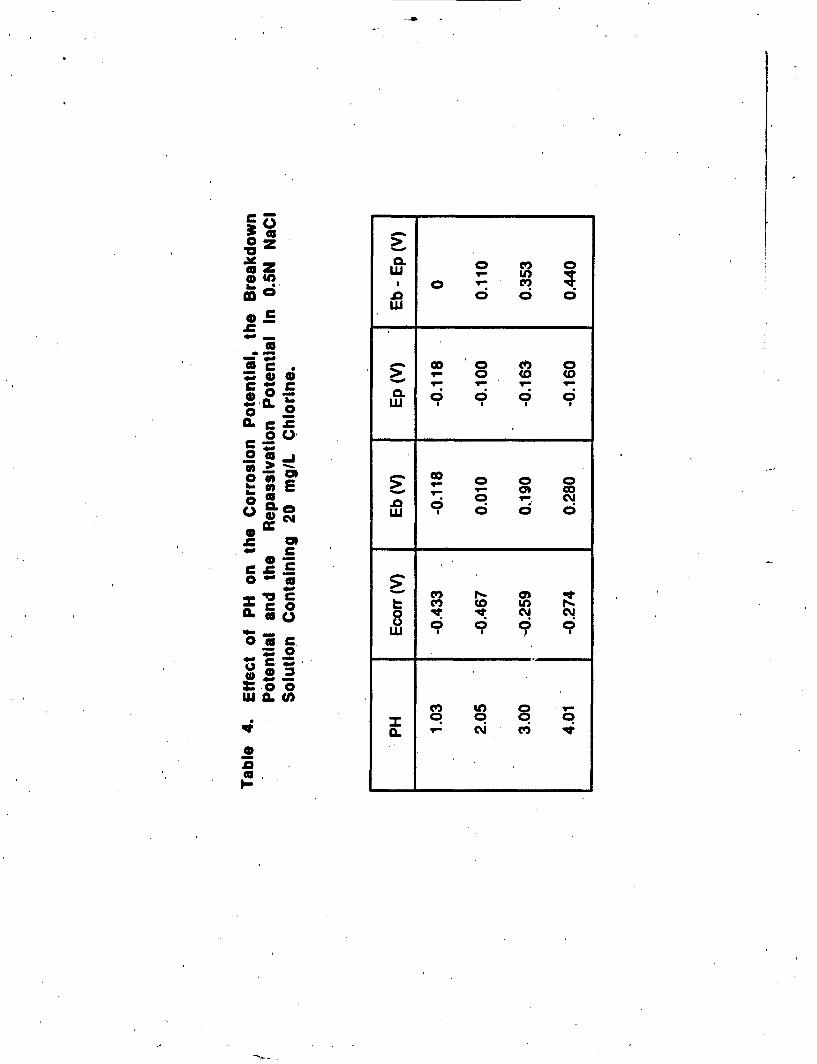
probably due to a repassivation process. Since the inside of a pit can be
expected to be acidified, a series of experuJents was coaducted as- a
function of pH on the corrosion potentiale the breakdown potential, and
the repassivation potentWal at a chlorine concentration of 20 mg/l. The
results of these experiments are shown in Table IV. Thes data Indicate
that, as the pH is re4ticed, the difference betveen the breakdown
potential, and tne ropassivation potential approach &ero, Indicating that
the resistance to pit growth is reduced. Since at these low pH's Cl 2
dominates the dissociation of the hypochlorite, it Is likely that the
C12 is directly reduced to Cl', thus. effactJvely increasing the
chloride concentration in the pits and accordingly inhibiting
repassivation.
1. The addition of chlorine to a 0.5 M& aCl of pHS resulted in a
marked shift in th corrosion potential of the alloy in the noble
direction. This shift is a maximum of -300 mv at a chlor!ne
10
concentration of 20 mg/i, and decreases with further chlorine addition to
only .50 us at 150 Mg/i. A similar shift is observed in the zero
currout potential of a potentiodynamic polarization curve, but the maximum
is observed at -60 mg/i chlorine.
2. The addition of chlorine to achloride solution also results in a
shift of both the breakdown potential and the repassivation potential ia
.the noble direction. While the shift in the noble direction of the
breakdown potential indicates an increased resistance to the initiation of
localised corrosion, there is a cross-over between the corrosion potential
and the repassivation potential in the range 10-60 mg/I chlorine. This
behavior suggests that the propagation of localized corrosion can be
expected to be accelerated. Measurement* of pit density and size confirm
this conclusion in that, in the range of 20.60 mg/i dissolved chlorine,
the pit density is markedly decreased, but the pit size is sharply
inc reased.
3. The results of the pit growth experiments can be interpreted by
the development of a more stable passive film created by the strong
oxidation potential of the chlorine. Thus, while pit Initiation is
inhibited as indicated by the move noble breakdown potential, there can be
expected to be a stronger driving force for pit growthsdue to the larger
potential difference between the more stable passive film and the interior
of an active pit.
4. The mechanism of pit growth and early propagation appears to be
similar, and is believed to be controlled by diffusion of soluble species
from the interior of the pit through the liquid phase in the pits.
However. as the pits become larger, pit propagation rates are reduced.
The rate controlling step for larger pits Is believed torbe due to
diffusion through the solid or semi-solid film on ths surface 6f the pits.
thepi dnstyis•ak~ll dcrasdbu te itele s h1p1

Acknowledam=nt a
The authors gratefully acknowledge the support of the Office of Naval
Research and, in particular, Dr. A.J. Sedricks under contradt number
X00014-86-K-0194.
References
1. MACE TPC Publication No. 4 'A Bibliography of Corrosion by Chlorine*
NACI, Houston, 1976.
2. P.D. Goodman, Dr. Corros. J., 22, 56 (1987).
3. 3.5. Shone and P. Gallagher, Proc., Conf. on High Alloy Steels forCritical Sea Water Applications, Birmingham, Mar. 1985, Society ofChemical Industry, Materials Preservation Group.
4. I.E. Malpas, P. Gallagher and E.B. Shones Proc. Conf. on Chlorinationof Sea Water and Its Effect on Corrosion Behavior, Birmingham, Mar.1986. Society of Chemical Industry, Materials Preservation Group.
5. R. Francis, in Stainless Steels '87. Institute of Metals, London.1986. p. 182.
6. R.I. Malpas, P. Gallagher and E.1. Shone, in Stainless Steels '87,Institute of Metals, London. 1986, p. 253.
7. Standard Methods for the Examination of Water and Waste Water, 15thed., Ed. M.A.H. Franson, Am Health Assoc. Washington, P. 227.
6. J. Tousek, in Theoretical Aspects of the Localized Corrosion ofMetals, Trans. Tcch. Publications, 1985.
9. J.W. Oldfield and B. Todd, Desalination, 1981, f, 233.
12
css
* 0i
CL0
000
ca
Cu
o Ni
C4.E,
0; co
E C; o
E I a
0.
EE 0 c0c
C" N N
-- 0
00 0
.0 Wn 000n cm 0 n
Ný C-A N M
00 x x x
a. CL C v ci CM(L
0
to E 0 0
U 0 ca,0
U 0 '~e
E 0n
00
- .a ( 0 co.0 cm c
*0
h . 0 - 1 00
m0 0 0 0w
.C,
*0 D co coc. 00 'c
. 0 0
00 -
C-O
CL - Da l
cm , N O
0-
0~ 0- 0j 0XCa C'
00I - __ ___ __ __
List of Figure,
Figure 1. Varin ition of chlorine distribution in sea water as a function of
PH (9)
Figure 2. Typi(al cyclic polarization curves for 304L stainless steel in
chlorinated, 0. N NaCI solution at 0, 20, and 60 mgIL dissolved chlorine.
Figure 3. Stea Jy state corrosion potentials (open circuit) and zero current
potentials as i function of dissolved chlorine concentration for 304L
stainless steel r, 0.5N NaCI solution.
Figure 4. Brea down and repassivation potentials as a function of chlorine
concentration for 304L stainless steel in 0.5N NaCI solution.
Figure 5. A momparison of corrosion potential, zero current potential,
breakdown po ential and repassivation potential for stainless steel in 0.5N
NaCI solution s a function of dissolved chlorine concentration.
Figure 6. Curr nt density vs time after scratching at constant potentials
for 304L stainl ss steel in 0.5N NaCI solution (0 mg/L dissolved chlorine).
Figure 7. Curr nt density vs time after scratching at constant potontials
for 304L stain ess steel in 0.5N NaCI solution with 20 mg/L dissolved
chlorine.
Figure 8. Curt ent density vs time after scratching at constant potentials
for 304L stain ess steel in 0.5N NaCI solution with 60 mg/L dissolved
chlorine.

Figure 9 Correlation between measured slope of current density vs time
with a hypothetical slope of 0.67 for transient period of localized
corrosion of 304L stainless steel in 0.5N NaCI solution (a) Unchlorinated
(b) 20 mg/L dissolved chlorine.
Figuro 10. Typical morphology of pits in 304L stainless steel in 0.5N NaCI
solution. Pit morphology is unchanged by chlorination (a) Optical
cross-section (b, c) Scanning electron micrographs
Figure 11. Pit distribution on 304L stainless steel in 0.5N NaCI solution
with 20 mg/L dissolved chlorine.

a
a1� _
001
a,U
am* 0
S.2U
0£5I-
- _0
0U
S
S
* diir0
0 0 0 0 0 0 0I, C'. w w c�1
- - Auo!inq;fls!p SOWSdS
4
/

/
/
r-
400-
U -
E) -
E - .•
0"
U.+1-400
-6,o •_~~~~~~~~~~........ ...... ,.-, •,, • ,L ,,,,L .. ,,. .,-
-SOO 6_1A IIJUN J L I 11d JA UUM .J1 = -1-14 -J AWL. I lý I10-5 10 10e-3 10-2 10-1 i 1s 8 0 103
CU rrant m Dens I t> mFA/c ml
Figure 2. Typical cyclic polarization curves for 304L stainles
steel in chlorinated, 0.5N NaCI solution at 0, 20, and 60 mg/L
dissolved chlorine.
0 .
L'U
1/ CO(00
CL -
ft'.66 0
4 I )6
9j(A) 30 AaBIG~

C4C
0 U
- S --
cm
\M-L-
a~ ~ C4 C. w I
d cs C 0 d s
(A) 3-S U d3 pue q3

*C14
N IL
(A 3SS I fIUO
WIUWue
oUJ n
S a
/
/ I
0a
EE�
��0 5-
(in)
w. 'I
U
0.
U
.� 61
.2F
0
(�wo�yw) A)jsuep �eJJno
E__ _ _ _ _ _ _ _ _ _ _ _ _ _ _ _ E C
c 1LU~~ UUW
Us
II
C1
(ZworVw) Allsuep luoaano
- 0
ml.
Co
U '
4p -
Q.C4~
8.(ao/w Alse luos.

c c0 -
WWU U
0 C
S -
ft-0
(zwo/yw) Apstiep luojjno
LOU Lo Iw
0
Io-
Sx
CoCD
(?,tuo/Vw Al-u lun

cCC>1
E
_; a
C 0 0610 @1
2 J
* C 0
CL _@1 - m
0) )~0 Ec. 0~ @
tm C - 9
(Ewo/Nw) Allsusp 2uOJifl3
EI
0~ U U
8 ~-
(zwo/vw)~~' Also Se
.0 1
CL CL
j0.
it~ zI
OI am.0
I'0
. o
50 UMn
Fig. 10. Typical morphology of pits In 3041 -stainlesssteel In 0.5N NaCI solution. Pit morphology Isunchanged by chlorination (b,c) scanningL electron
microraph
CE;
Co
$V -Za1.0
- a
UnrestrictedSECURITY CLASSIFICATION OF THIS PAGE1
REPORT DOCUMENTATION PAGEI&. RE~PORT SECURITY CLASSIFICATION 1Lb RESTRICTIVE MARKINGS
'Unres~ricted NONE2&. SECURITY CL.ASSIFICATION AUTHORITY 3. OISTORIUTION/AVAI LABILITY OF REPORT
21k OECLASSIPICATIONIOOWNGRADING SCH4EDUL.E
.PERFPORMING ORGANIZATION kREPOT NUMIen(S) S. MONITORING ORGANIZATION REPORT NUMSER(B118
B.NAME OP-PIERFORMING ORGANIZATION IL OFF ICE SYMBOL 7L. NAME OP MONITORING ORGANIZATION
In LORsti(tute S7116d I C*' ADDRESS (City. Stabe and ZIP CadetTroy, NY 12180-3590
I&. NAME OFP UNOINGI4PONSORING Wb OPPFICE SYMBOL 9. PROCUREMENT INSTRUMENT IDENTIFICATION NUMBER
Office of Naval ResearchSe. ADORESS1 (CitY. State aind ZIP codo) 10. SOURCE DO FUF40ING NO$.800 N. Quincy Street PROGRAM fPROJECT TASK WOR4K UNITArlington, VA 22217-5,000' ELEMENTNO. No. NO. No.
111. TITLE fIneiade security Clo@Wittic~toejTHE EFFECT OF DISSOLVED CHLORINE ON THEIPITTINGV"rI}fn t ~TI~~Sp STELI ' C5NIb12. PERSONAL AUTHORMS
H.H. Lu and D.J. Duquette13..TYPE OP REPORT W3.TIME COVERED 14. DATE OP REPORT (Yrn.. Mo.. Z~y) 16. PAGE COUNTTechnical P0R0MJQ10/...TO.JflLB.9. 89 10 15 39if. SUPPLEMENTARY NOTATION
NONE
17. COSATI COOES ISL SUBJECT TERMS ICaeniinu. oa ,raev if .ecitmwy aind idendfy by 6ieck a~number)0IELO GROUP 11U011.G11. Corrosoin, Stainless Steels, Dissolved Chlorine,
Chloride Solutions
19. ABSTRACT (Containue on iovw, it fteeemiy and iden Ify by black numbrPD
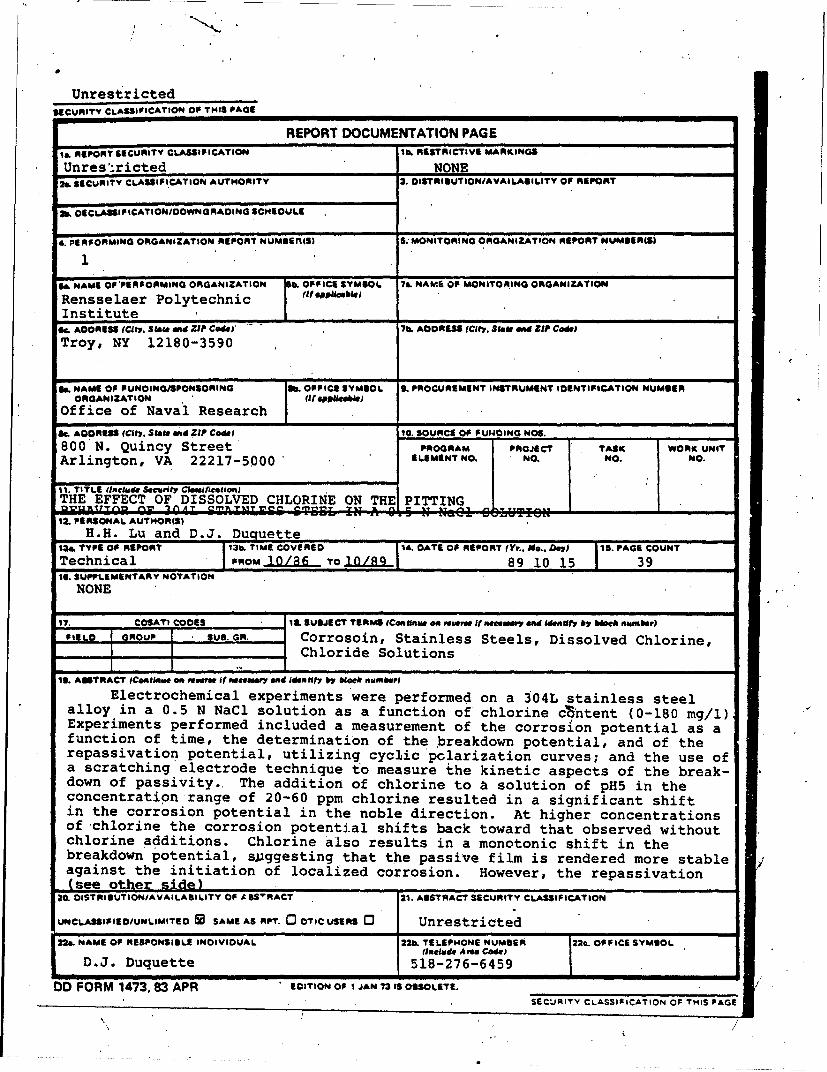
Electrochemical experiments were performed on a 304L stainless steelalloy in a 0.5 N NaCl solution as a function of chlorine c1 h'tent (0-180 mg/l)Experiments performed-included a measurement of the corrosion potential as afunction of time, the determination of the breakdown potential, and of therepassivation potential, utilizing cyclic'polarization curves; and the use ofa scratching electrode technique to measure the kinetic aspects of the break-down of passivity.. The addition of chlorine to a solution of pH5 in theconcentration range of 20-60 ppm chlorine resulted in a significant shiftin the corrosion potential in the noble direction. At higher concentrationsof-chlorine the corrosion potential shifts back toward that observed withoutchlorine additions. Chlorine also results in a mnonotonic shift in thebreakdown potential, siaggesting that the passive film is rendered more stableagainst the initiation of localized corrosion. However, the repassivation
20. DISTRI OUTIONIAVAi LAOSILITY OF £S"AT21. ABSTRACT SECURITY CLASSIFICATION
UNCLASSIFIED/UN LI MITED01 SAME AS APT. 03 OTIC USERS 0 Unrestricted22U NAME OF RESPONSIBLE INDIVIDUAL M2b TELEPHONE NUMBER 22c. OFFICE SYMBOL
D.J. Duquette 582665
DO FORM 1473, 83 APR EDITION OF I JAN 73 IS OBSOLETE.
SECURITY CLASSIFICATION OF THIS PAGE
UnclassifiedSECURITY CLASSIPICATION OP THIS PAGE
potential exhibits a minimum in the chlorine concentration range where thecorrosion potential exhibits a maximum. This data suggests that the rate ofpropagation of localized corrosion should be maximized in this chlorine regime(20-60 mg/l). When scratching electrode experiments are performed, thenumber of pits is minimized but the size of the pits is maximized. Analysisof the kinetic pit growth results suggest that, when the pits are small, therate of pit growth is controlled by diffusion of corrosion products throughthe bulk aqueous phase, but, as the pits age, the mechanism changes, and pitgrolwth is governed by diffusion through a solid or semi-solid film on thewalls of the pits.
-C,..r-, €-., P A