THE EFFECT OF DISPROPORTIONATE PERMEABILITY REDUCERS … › content › dam › dalhousie › pdf...
108
THE EFFECT OF DISPROPORTIONATE PERMEABILITY REDUCERS ON SPONTANEOUS IMBIBITION OF WATER INTO WALLACE SANDSTONE by Olatunde K. Sanni Submitted in partial fulfilment of the requirements for the degree of Master of Engineering at Dalhousie University Halifax, Nova Scotia August 23, 2013 © Copyright by Olatunde K. Sanni, 2013
Transcript of THE EFFECT OF DISPROPORTIONATE PERMEABILITY REDUCERS … › content › dam › dalhousie › pdf...
THE EFFECT OF DISPROPORTIONATE PERMEABILITY REDUCERS ON
SPONTANEOUS IMBIBITION OF WATER INTO WALLACE SANDSTONE
by
Olatunde K. Sanni
Submitted in partial fulfilment of the requirements
for the degree of Master of Engineering
at
Dalhousie University
Halifax, Nova Scotia
August 23, 2013
© Copyright by Olatunde K. Sanni, 2013

i
DALHOUSIE UNIVERSITY
PETROLEUM ENGINEERING
The undersigned hereby certify that they have read and recommend to the Faculty of Engineering
for acceptance a project entitled “THE EFFECT OF DISPROPORTIONATE PERMEABILITY
REDUCERS ON SPONATNEOUS IMBIBITION OF WATER INTO WALLACE
SANDSTONE” by Olatunde K. Sanni in partial fulfillment of the requirements for the degree of
Master of Engineering.
Dated: August 23rd, 2013
Supervisor: ________________________
Dr. Michael Pegg
Readers: ________________________
Dr. Darell Doman

ii
DALHOUSIE UNIVERSITY
DATE: August 23, 2013
AUTHOR: Olatunde K. Sanni
TITLE: THE EFFECT OF DISPROPORTIONATE PERMEABILITY
REDUCERS ON SPONTANEOUS IMBIBITION OF WATER INTO
WALLACE SANDSTONE
DEPARTMENT OR SCHOOL: Petroleum Engineering
DEGREE: MEng. CONVOCATION: October YEAR: 2013
Permission is herewith granted to Dalhousie University to circulate and to have copied for non-
commercial purposes, at its discretion, the above title upon the request of individuals or
institutions.
The author reserves other publication rights and neither the thesis nor extensive extracts from it
may be printed or otherwise reproduced without the author’s written permission.
The author attests that permission has been obtained for the use of any copyrighted material
appearing in the thesis (other than the brief excerpts requiring only proper acknowledgement in
scholarly writing), and that all such use is clearly acknowledged.
_______________________________
Signature of Author

iii
DEDICATION
Dedicated to the Sanni’s family.
iv
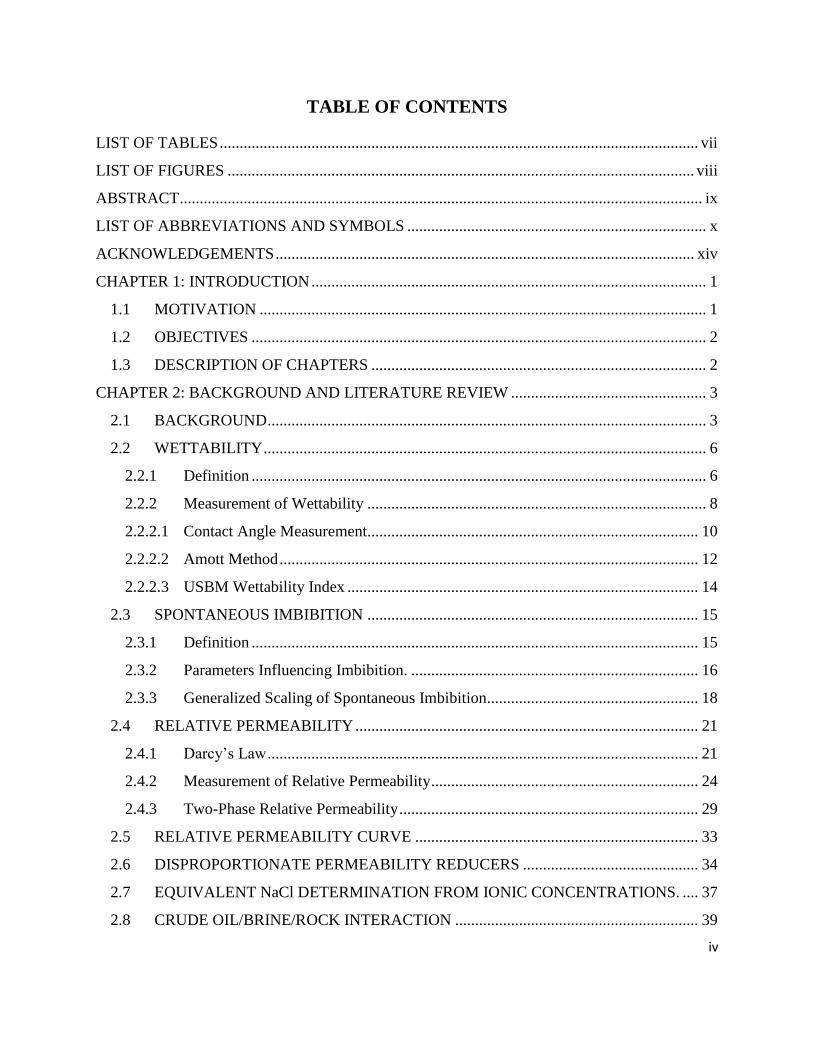
TABLE OF CONTENTS
LIST OF TABLES ........................................................................................................................ vii
LIST OF FIGURES ..................................................................................................................... viii
ABSTRACT ................................................................................................................................... ix
LIST OF ABBREVIATIONS AND SYMBOLS ........................................................................... x
ACKNOWLEDGEMENTS ......................................................................................................... xiv
CHAPTER 1: INTRODUCTION ................................................................................................... 1
1.1 MOTIVATION ................................................................................................................ 1
1.2 OBJECTIVES .................................................................................................................. 2
1.3 DESCRIPTION OF CHAPTERS .................................................................................... 2
CHAPTER 2: BACKGROUND AND LITERATURE REVIEW ................................................. 3
2.1 BACKGROUND .............................................................................................................. 3
2.2 WETTABILITY ............................................................................................................... 6
2.2.1 Definition .................................................................................................................. 6
2.2.2 Measurement of Wettability ..................................................................................... 8
2.2.2.1 Contact Angle Measurement................................................................................... 10
2.2.2.2 Amott Method ......................................................................................................... 12
2.2.2.3 USBM Wettability Index ........................................................................................ 14
2.3 SPONTANEOUS IMBIBITION ................................................................................... 15
2.3.1 Definition ................................................................................................................ 15
2.3.2 Parameters Influencing Imbibition. ........................................................................ 16
2.3.3 Generalized Scaling of Spontaneous Imbibition..................................................... 18
2.4 RELATIVE PERMEABILITY ...................................................................................... 21
2.4.1 Darcy’s Law ............................................................................................................ 21
2.4.2 Measurement of Relative Permeability ................................................................... 24
2.4.3 Two-Phase Relative Permeability ........................................................................... 29
2.5 RELATIVE PERMEABILITY CURVE ....................................................................... 33
2.6 DISPROPORTIONATE PERMEABILITY REDUCERS ............................................ 34
2.7 EQUIVALENT NaCl DETERMINATION FROM IONIC CONCENTRATIONS. .... 37
2.8 CRUDE OIL/BRINE/ROCK INTERACTION ............................................................. 39

v
CHAPTER 3: MATERIALS AND EXPERIMENTAL PROCEDURE ...................................... 42
3.1 MATERIAL ................................................................................................................... 42
3.1.1 Aqueous Phases ...................................................................................................... 42
3.1.2 Disproportionate Permeability Reducers Polymer.................................................. 42
3.1.3 Rocks....................................................................................................................... 45
3.1.4 Kerosene ................................................................................................................. 48
3.2 PROCEDURES AND EQUIPMENT ............................................................................ 48
3.2.1 Core Preparation ..................................................................................................... 48
3.2.2 Core Characterization ............................................................................................. 49
3.2.2.1 Permeability ............................................................................................................ 49
3.2.2.2 Porosity ................................................................................................................... 50
3.2.2.3 Specific Surface Area per unit Bulk Volume ......................................................... 50
3.2.2.4 Specific Surface Area per unit Pore Volume .......................................................... 51
3.2.2.5 Specific Surface Area per unit Mass ....................................................................... 51
3.2.3 Core Saturation ....................................................................................................... 52
3.2.4 Core Flooding Set Up ............................................................................................. 52
3.2.5 Core Flooding Procedure ........................................................................................ 53
3.2.6 Spontaneous Imbibition .......................................................................................... 55
CHAPTER 4: RESULTS AND DISCUSSIONS ......................................................................... 58
4.1 PETROPHYSICAL PROPERTIES OF CORE SAMPLES .......................................... 58
4.2 MEASUREMENT OF WETTABILITY OF RESERVOIR CORE .............................. 58
4.2.1 Amott-Harvey Wettability Index ............................................................................ 59
4.3 SPONTANEOUS IMBIBITION TEST RESULTS ....................................................... 63
4.4 GENERAL DISCUSSION ............................................................................................. 66
CHAPTER 5: CONCLUSIONS AND FUTURE WORK ............................................................ 71
5.1 CONCLUSIONS ............................................................................................................ 72
5.1.1 Wettability of Wallace Sandstone Reservoir Rock ................................................. 72
5.1.2 Effect of Disproportionate Permeability Reducers on Spontaneous Imbibition ..... 72
5.2 FUTURE WORK ........................................................................................................... 72
BIBLIOGRAPHY ......................................................................................................................... 73

vi
APPENDIX A: Measured Versus Calculated Equivalent NaCl Concentrations ...................... 81
APPENDIX B: Wallace Quarries – Test Data. ......................................................................... 84
APPENDIX C: Benchtop Relative Permeameter Detailed Part List (BRP-350) ...................... 85
APPENDIX D: Benchtop Relative Permeameter Process Flow Diagram (BRP-350) ............. 87
APPENDIX E: Spontanoeus imbibition test results ................................................................ 88
APPENDIX F: Details of Instruments Used in this Experiment .............................................. 93
vii
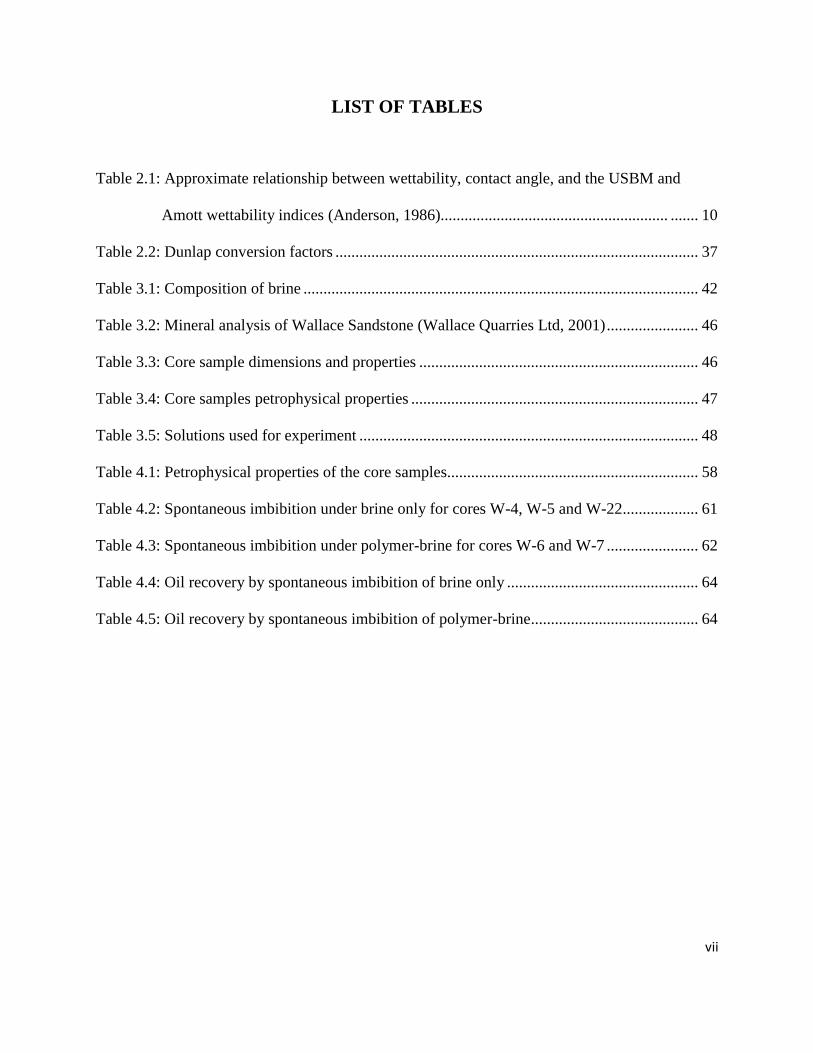
LIST OF TABLES
Table 2.1: Approximate relationship between wettability, contact angle, and the USBM and
Amott wettability indices (Anderson, 1986)......................................................... ....... 10
Table 2.2: Dunlap conversion factors ........................................................................................... 37
Table 3.1: Composition of brine ................................................................................................... 42
Table 3.2: Mineral analysis of Wallace Sandstone (Wallace Quarries Ltd, 2001) ....................... 46
Table 3.3: Core sample dimensions and properties ...................................................................... 46
Table 3.4: Core samples petrophysical properties ........................................................................ 47
Table 3.5: Solutions used for experiment ..................................................................................... 48
Table 4.1: Petrophysical properties of the core samples............................................................... 58
Table 4.2: Spontaneous imbibition under brine only for cores W-4, W-5 and W-22 ................... 61
Table 4.3: Spontaneous imbibition under polymer-brine for cores W-6 and W-7 ....................... 62
Table 4.4: Oil recovery by spontaneous imbibition of brine only ................................................ 64
Table 4.5: Oil recovery by spontaneous imbibition of polymer-brine .......................................... 64
viii
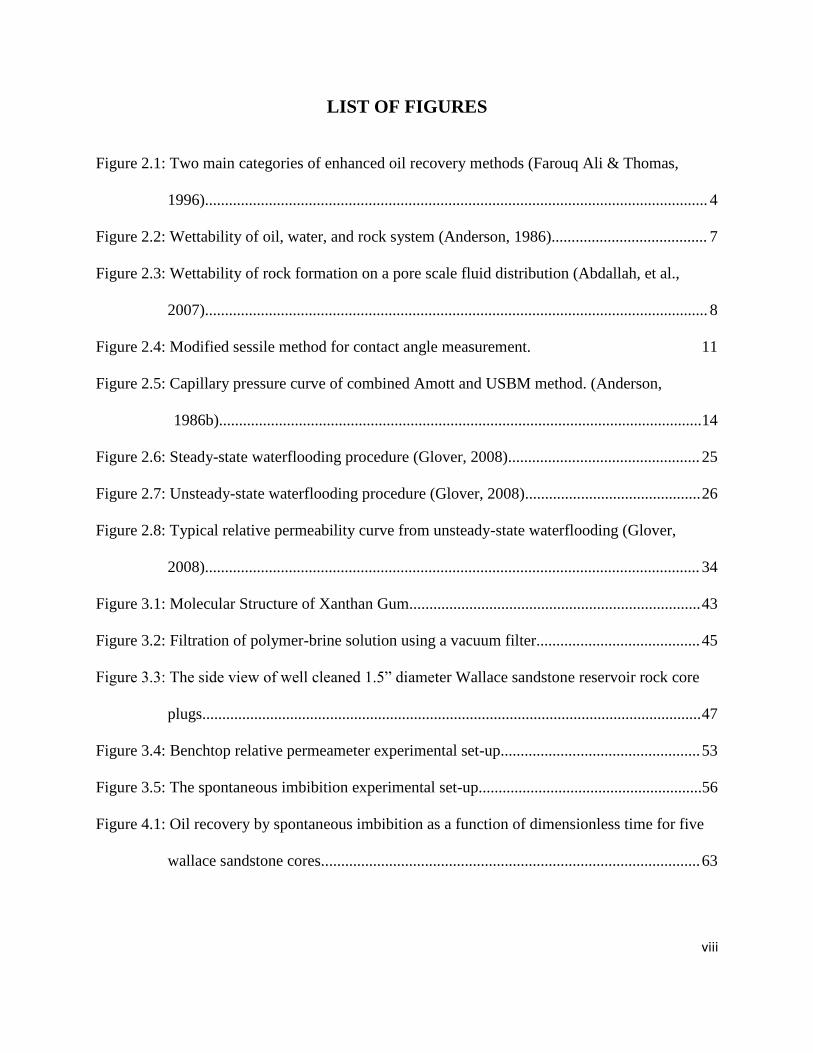
LIST OF FIGURES
Figure 2.1: Two main categories of enhanced oil recovery methods (Farouq Ali & Thomas,
1996).............................................................................................................................. 4
Figure 2.2: Wettability of oil, water, and rock system (Anderson, 1986)....................................... 7
Figure 2.3: Wettability of rock formation on a pore scale fluid distribution (Abdallah, et al.,
2007).............................................................................................................................. 8
Figure 2.4: Modified sessile method for contact angle measurement. 11
Figure 2.5: Capillary pressure curve of combined Amott and USBM method. (Anderson,
1986b).........................................................................................................................14
Figure 2.6: Steady-state waterflooding procedure (Glover, 2008)................................................ 25
Figure 2.7: Unsteady-state waterflooding procedure (Glover, 2008)............................................ 26
Figure 2.8: Typical relative permeability curve from unsteady-state waterflooding (Glover,
2008)............................................................................................................................ 34
Figure 3.1: Molecular Structure of Xanthan Gum......................................................................... 43
Figure 3.2: Filtration of polymer-brine solution using a vacuum filter......................................... 45
Figure 3.3: The side view of well cleaned 1.5” diameter Wallace sandstone reservoir rock core
plugs............................................................................................................................. 47
Figure 3.4: Benchtop relative permeameter experimental set-up.................................................. 53
Figure 3.5: The spontaneous imbibition experimental set-up........................................................56
Figure 4.1: Oil recovery by spontaneous imbibition as a function of dimensionless time for five
wallace sandstone cores............................................................................................... 63
ix
ABSTRACT
Sandstone reservoirs predominantly are half of the world hydrocarbon reserves. Studies have
shown that nearly half of all sandstone oil reservoirs are originally water-wet by nature but crude
oil/brine/rock (COBR) interactions altered their wettability to neutral-wet or oil-wet. Other studies
demonstrated that crude oils are readily absorbed at solid-liquid interfaces due to oils containing
natural surface-active agents, and this renders the solid surface oil-wet. It is well agreed that
spontaneous imbibition is the most important phenomenon in oil recovery from fractured
reservoirs. This study was focused on determining the effects of disproportionate permeability
reducers (DPR) in spontaneous imbibition of brine into Wallace Sandstone containing oil.
Many investigations have showed that DPRs selectively reduce water permeability without
significant effect on oil or gas permeability. DPRs are chemicals that plug pores, however, they do
not swell or viscosify when in contact with hydrocarbons as they do in a water environment. The
wettability of Wallace Sandstone reservoir rocks were measured using Amott wettability test, and
a comparative study was carried out for spontaneous imbibition under synthetic brine and DPR
polymer-brine solution using five fresh Wallace Sandstone core samples under laboratory
conditions. Results obtained showed alteration of wettability of the core samples from water-wet
to neutral-wet conditions due to COBR interactions during spontaneous imbibition under brine
and wettability of the cores were strongly water-wet when exposed to spontaneous imbibition
under polymer-brine due to the adsorption of the DPR polymer on the pore surfaces of the Wallace
Sandstone cores. Increase in the rate and ultimate volume of oil recovery from imbibition under
DPR polymer-brine was also observed.

x
LIST OF ABBREVIATIONS AND SYMBOLS
A Cross-sectional Area of the Core [cm²]
𝐴1 Area for Oil displacing Brine Capillary Pressure Curve [cm²]
𝐴2 Area for Brine displacing Oil Capillary Pressure Curve [cm²]
𝐴𝑖 Area Open to Imbibition with respect to ith Direction [cm²]
BRP Benchtop Relative Permeameter
BC Amount of oil displaced by spontaneous imbibition of water alone
BD Total amouint of oil displaced by water imbibition and centrifugal displacement
C Conversion Factor for Time
COBR Crude Oil/Brine/Rock
DB Total amount of water displaced by oil imbibition and forced displacement
DE Amount of water displaced by spontaneous imbibition of oil alone
DI De-Ionized Water
DPR Disproportionate Permeability Reducers
EOR Enhanced Oil Recovery
𝐹𝑆 Shape Factor
𝑓(𝜃) Wettability Factor
𝑓𝑤2 Fraction of Water in the Outlet Stream
𝑓𝑜2 Fraction of Oil in the Outlet Stream
HPAM Hydrolyzed Polyacrylamides
IFT Interfacial Tension [dynes/cm]
I Amott-Harvey Wettability Index
𝐼𝑟 Relative Injectivity

xi
IWS Irreducible Water Saturation
K Constant
k Permeability [mD]
𝑘𝑟𝑜 Oil Relative Permeability
𝑘𝑟𝑤 Water Relative Permeability
L Characteristic Length [cm]
𝐿𝐶 Modified Characteristic Length [cm]
𝐿𝐻 Vertical Height of the Sample [cm]
𝐿𝑠 Characteristic Length corresponding to Shape Factor
m Mass of water imbibed
MB Marlim Formation Brine Solution
MPB Injected Polymer-Brine Solution
𝑁𝐵 Bond Number
OOIP Original Oil in Place
𝑃𝑐 Drainage Capillary Pressure [psi]
𝑄𝑤 Cumulative Water Injected
q Flowrate [m³·s−1]
𝑞𝑡 Superficial Velocity
𝑞𝑠𝑐 Gas Volumetric Flowrate
ROS Residual Oil Saturation
RPM Relative Permeability Modifiers
S Distance in the Direction of Flow
𝑆𝐴𝑖 Distance from 𝐴𝑖 to the Corner of the Matrix
𝑆𝑏 Surface area per unit bulk volume [cm²/cm³]

xii
𝑆𝑝 Specific surface area per unit pore volume
𝑆𝑔 Specific surface area per unit mass
𝑆𝑚 Minimum Irreducible Saturation of the Wetting Phase
𝑆𝑤,𝑎𝑣 Average Water Saturation
𝑆𝑤 Water Saturation
𝑆𝑤𝑡 Saturation of the Wetting Phase
t Imbibition Time [minutes]
𝑡𝐷(𝑐 + 𝘨) Dimensionless Time that Includes Capillary and Gravity Forces
𝑡𝐷,𝑀𝐾 Dimensionless Time
USBM United States Bureau of Mines
VSWW Very Strongly Water-Wet
𝑉𝑏 Bulk Volume [cm³]
𝑉𝑠 Volume of Flux [cm³]
W Wettability
𝑊𝑑 Weight of Dry Core [grams]
𝑊𝑤 Weight of 100% Saturated with Brine Core [grams]
𝛿𝑜𝑠 Oil-Solid IFT [dynes/cm]
𝛿𝑤𝑠 Water-Solid IFT [dynes/cm]
𝛿𝑜𝑤 Oil-Water IFT [dynes/cm]
𝜃 Angle between Displacing ad Displaced Fluids [Degrees]
𝜃𝑐 Contact Angle [Degrees]
Φ Porosity [%]
σ Interfacial Tension [dynes/cm]
μ Viscosity [cP]

xiii
𝜇𝑜 Oil Viscosity [cP]
𝜇𝑤 Water Viscosity [cP]
ρ Density of Fluid [kg/m³]
𝜌𝑔 Density of grain [g/cm³]

xiv
ACKNOWLEDGEMENTS
I use this medium to thank Dr. Micheal J. Pegg for allowing me to carry out this study as part of
the fulfillment of my master’s program. I also want to thank Dr. Darell Doman for accepting to be
my project reader and for his technical support to this work. My gratitude goes to Mr. Mumuni
Amadu for his technical advice and support throughout this work. The same appreciation goes to
Mr. Matt Kujath for his technical support during the experimental stage of this project.
Thanks to my friends for their encouragement and support throughout this project. My deepest
gratitude goes to my brother, El-hadj Mohammed Kola Sanni and his family for their moral and
financial support through this study. I am also thankful to my darling wife, Ganiyat Tomi Toye for
her support throughout this project. My appreciation goes to my Sheikh, Alhaji Sayyid Musa Aloba
and Alhaji Wasiu Mohammed for their support throughout my study.
Lastly I like to acknowledge the Faculty of Engineering and Faculty of Graduate studies for giving
me the sole opportunity to do my graduate studies at Dalhousie University.
1
CHAPTER 1: INTRODUCTION
1.1 MOTIVATION
Worldwide, crude oil demand is unceasingly increasing. As a response to this demand, enhanced
oil recovery (EOR) processes have gained interest and focus from the research and development
phases to the oilfield EOR implementation stage. This interest has been also furthered by the
current high oil prices, maturation of oilfields worldwide and few newly discovered hydrocarbon
deposits.
Sandstones reservoirs predominantly are half of the world hydrocarbon reserves. Literatures have
proved that close to half of all sandstone oil reservoirs are neutrally-wet to oil-wet (Bennion,
Thomas, & Sheppard, 1992). Other studies demonstrated that crude oils are readily absorbed at
solid-liquid interfaces due to the oils containing natural surface-active agents, and this render the
solid surface oil-wet (Treiber & Owens, 1972). Primary and secondary oil recovery methods
leave behind two thirds of the original oil in place (OOIP). The unrecovered regions of the
reservoir which are characterized with high oil saturation are the interest zones for enhanced oil
recovery methods.
In this study the formation of interest is Wallace Sandstone. The poor performance of
conventional secondary oil recovery in such oil reservoir is due to the combination of low sweep
efficiency and the formation exhibiting its oil-wet preference during imbibition.
Chemical enhanced oil recovery in sandstone reservoirs has been studied for years now due to
high oil prices. Disproportionate permeability reducers’ water control has been focus of many

2
researches recently for enhanced oil recovery. This project investigated the effect of
disproportionate permeability reducers’ formulation for oil-wet sandstone reservoirs. This study
aims to use disproportionate permeability reducers which have been proved to selectively reduce
the permeability to the water phase rather than the permeability of oil phase of the formation
which is oil-wet and recover more oil during spontaneous imbibition of brine into sandstone
porous rock due to favorable capillary action.
1.2 OBJECTIVES
The objectives of this study were to measure the wettability of Wallace Sandstone reservoir rock
using Amott-Harvey Index. Also, to investigate the effect of disproportionate permeability
reducers on ultimate oil recovery in reservoir conditions using spontaneous imbibition method.
1.3 DESCRIPTION OF CHAPTERS
This chapter provides the introduction and objective of this project. Chapter 2 gives the
background information of concepts used in this work. Understanding of topic is concisely
reviewed in the Literature review part of this project. Chapter 3 details the equipment, experimental
materials and procedures used in this paper. Chapter 4 showcases the results and discussion as
regards the experimental results arrived at. Chapter 5 main focus is the conclusion derived from
this work and suggestions on related future works.
3
CHAPTER 2: BACKGROUND AND LITERATURE REVIEW
2.1 BACKGROUND
Hydrocarbon recovery occurs through three main processes: primary, secondary and tertiary
recovery. Primary recovery is the volume of hydrocarbon produced by the natural energy
prevailing in the reservoir (this energy includes dissolved gas drive, or natural water drive from an
aquifer). The reservoir natural energy depends on the fluid and rock properties, reservoir geometry
and geology of the porous rock. In primary oil recovery stage of reservoir production, the recovery
factor is 5-20% original oil in place. As the reservoir is depleted, the natural pressure differential
available to produce oil drops with the life span of the reservoir. At a certain period in the life of
the producing reservoir, the natural energy prevailing in the reservoir is insufficient to produce oil
to the surface facilities.
Secondary recovery methods refer to the volume of hydrocarbon produced as a result of the
addition of external energy into the reservoir, such as fluid injection to supplement or increase the
initial reservoir drive. This is achieved by an immiscible process of waterflooding, gas injection
and gas lift, which involves injection of air, nitrogen, carbon dioxide or other useable gas into the
reservoir. However the common fluid used in secondary oil recovery method is water sequel to its
availability, high specific gravity and low cost. After secondary recovery, hydrocarbon that
remains unrecovered in the reservoir (residual oil) can reach 50% of the original oil in place due
to some factors such as wettability and heterogeneity of the reservoir (Farouq Ali & Thomas,
1996).
4
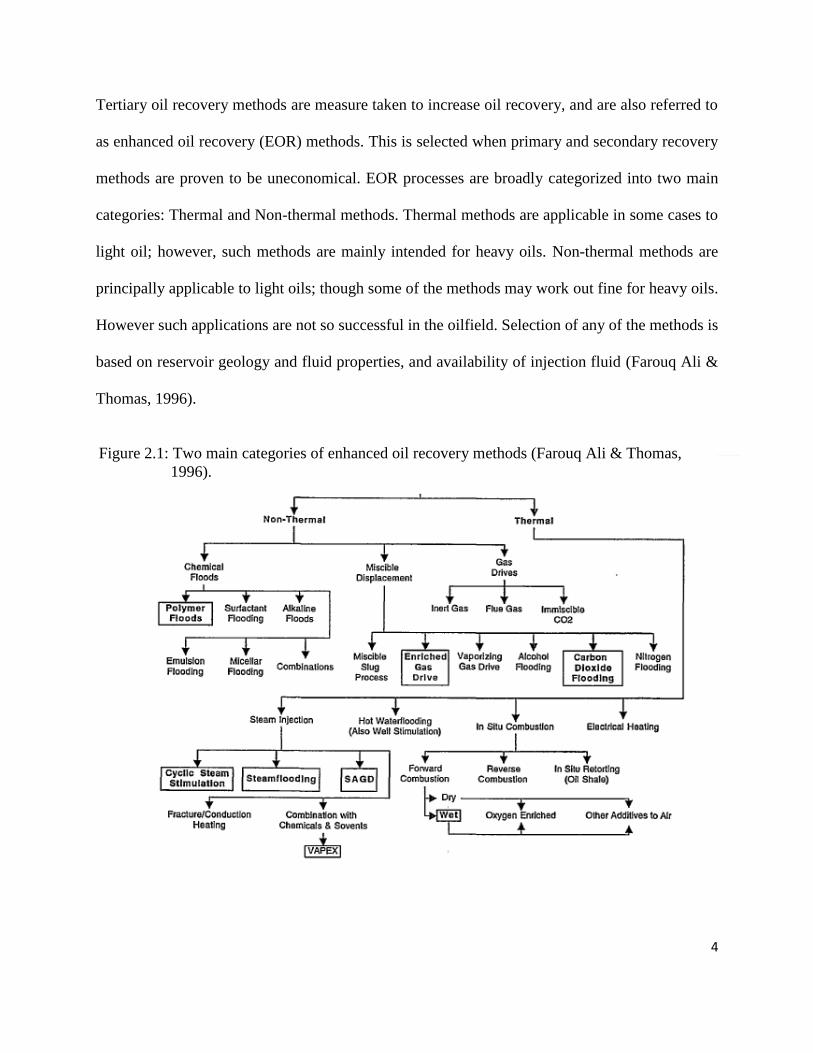
Tertiary oil recovery methods are measure taken to increase oil recovery, and are also referred to
as enhanced oil recovery (EOR) methods. This is selected when primary and secondary recovery
methods are proven to be uneconomical. EOR processes are broadly categorized into two main
categories: Thermal and Non-thermal methods. Thermal methods are applicable in some cases to
light oil; however, such methods are mainly intended for heavy oils. Non-thermal methods are
principally applicable to light oils; though some of the methods may work out fine for heavy oils.
However such applications are not so successful in the oilfield. Selection of any of the methods is
based on reservoir geology and fluid properties, and availability of injection fluid (Farouq Ali &
Thomas, 1996).
Figure 2.1: Two main categories of enhanced oil recovery methods (Farouq Ali & Thomas,
1996).

5
Figure 2.1 illustrates the processes that falls under thermal and non-thermal EOR methods. The
commercial processes are highlighted in the figure while some of the processes are at the
laboratory scale. Several other recovery methods not shown in figure 2.1 have been proposed,
which are mostly combination of other methods, like alkaline-surfactant-polymer flooding.
Implementation phase of EOR in the oilfield is expensive, and time-consuming. The costs of
implementing EOR are mostly from reservoir characterization, the potential amount of oil
recoverable from the reservoir, laboratory work related to EOR process (Taber, 1983).
Non-thermal EOR methods consist of chemical and miscible processes. The chemical methods
used in flooding include polymer, surfactant, micellar/emulsion floods, caustic and combinations
of such chemicals as suggested by Farouq Ali and Thomas (1996). After primary and secondary
oil recovery, residual oil that remains in the reservoir could be displaced by the wetting phase in a
water-wet rock if the pressure gradient (velocity) is high enough. The amount of oil recovery with
EOR depends on how much of the wetting phase has been injected, the velocities and mobility
ratio.
The principle of chemical methods is to ultimately improve reservoir volumetric sweep efficiency,
this methods success depends on the volume of reservoir impacted by the injected fluid. Surfactant
and alkali flooding are used to create low oil-water interfacial tension or surface tension of oil. The
use of surfactants is widely common due to its availability and low cost of implementation
compared to other chemical EOR processes. The gel-polymer and polymer flooding are injected
to increase the injected water viscosity in order to increase the sweep zones and to shut-off water
or selectively reduce the mobility of water by reducing the relative permeability to the water
without significant effect on the relative permeability to oil phase in the reservoir (Chen, Zhao,

6
Peng, & Pu, 1996). The focus of this study is to select a polymer that has a high selective potential
to reduce the water permeability without affecting oil permeability and its potential to improve oil
recovery for spontaneous imbibition applied in a water-wet sandstone cores.
2.2 WETTABILITY
2.2.1 Definition
Wettability is defined as a term used to depict the relative attraction of one fluid for a solid in the
presence of other immiscible fluids (Honarpour, Koederitz, & Harvey, 1986). It represents a
balance of forces that exist between three phases interface. Microscopic fluid distribution occurs
mainly because of the wettability of the porous media and dictates the amount of residual oil
saturation and the potential for a particular phase to flow. A porous media can be water-wet,
neutrally-wet or oil-wet depending on the relative affinity of the rock formation to hydrocarbon in
the presence of water. The equation describing the balance of forces between three phases was
first developed by Young in 1805 (Adamson, 1982). The equation for oil, water, and solid system,
would be:
cowwsos cos (2-1)
where; 𝛿𝑜𝑠, 𝛿𝑤𝑠, and 𝛿𝑜𝑤, respectively, are oil-solid, water-solid, and oil-water interfacial tensions
(usually measured in dyne/cm); 𝜃𝑐 is the contact angle between oil and water usually measured
through the denser liquid phase, in this case water.
Figure 2.2 shows a microscopic observation of the edge of a liquid that wets a solid surface. A
knife edge shape indicates wetting while a beaded edge shape depicts nonwetting. This is shown
quantitatively in Figure 2.2, which shows a cell containing a drop of water surrounded by oil and
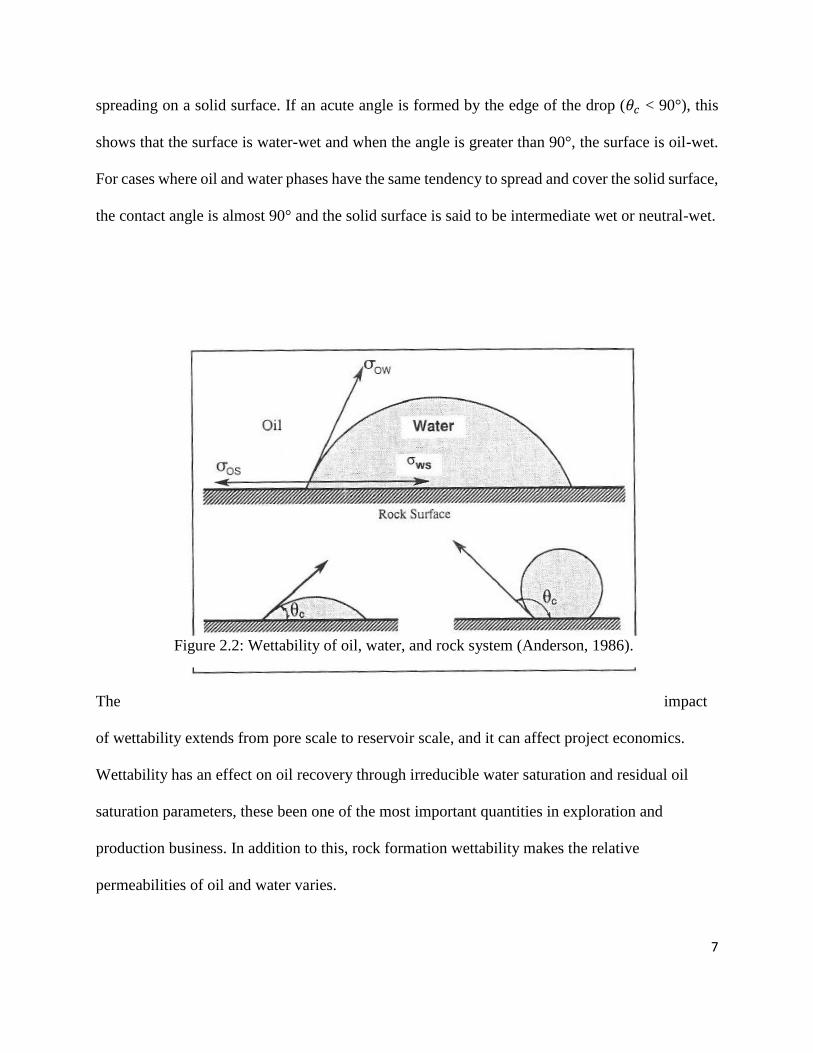
7
spreading on a solid surface. If an acute angle is formed by the edge of the drop (𝜃𝑐 < 90°), this
shows that the surface is water-wet and when the angle is greater than 90°, the surface is oil-wet.
For cases where oil and water phases have the same tendency to spread and cover the solid surface,
the contact angle is almost 90° and the solid surface is said to be intermediate wet or neutral-wet.
The impact
of wettability extends from pore scale to reservoir scale, and it can affect project economics.
Wettability has an effect on oil recovery through irreducible water saturation and residual oil
saturation parameters, these been one of the most important quantities in exploration and
production business. In addition to this, rock formation wettability makes the relative
permeabilities of oil and water varies.
Figure 2.2: Wettability of oil, water, and rock system (Anderson, 1986).
8
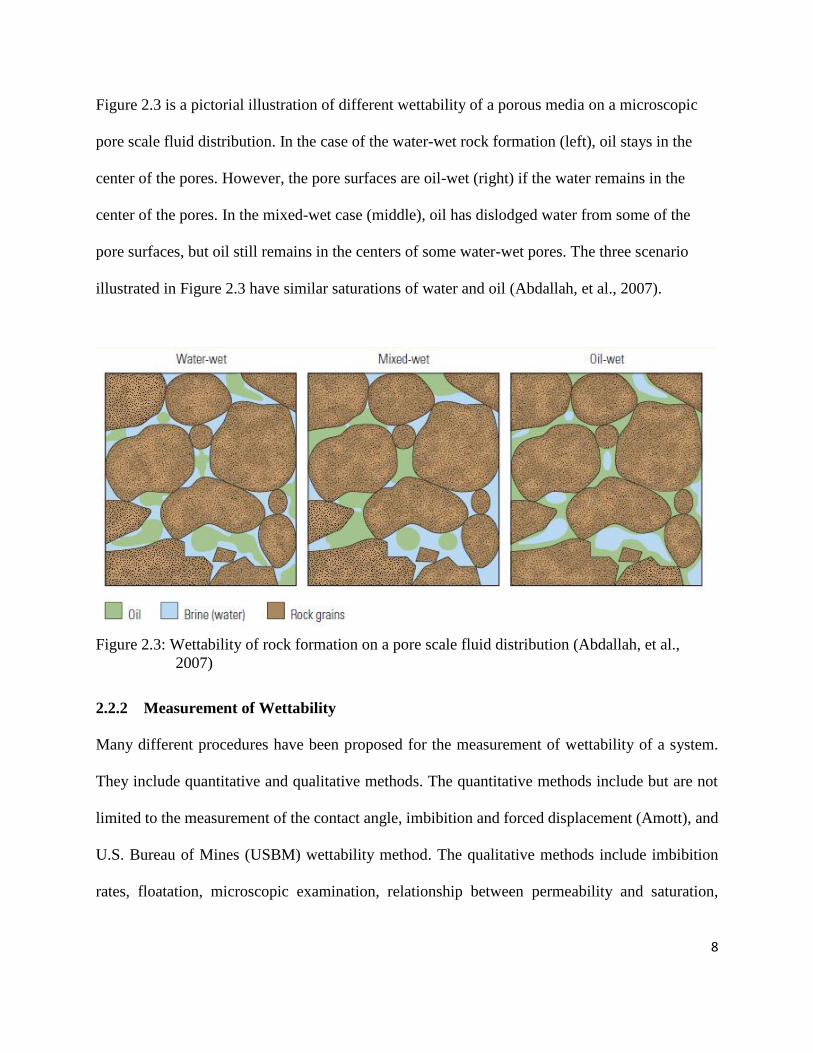
Figure 2.3 is a pictorial illustration of different wettability of a porous media on a microscopic
pore scale fluid distribution. In the case of the water-wet rock formation (left), oil stays in the
center of the pores. However, the pore surfaces are oil-wet (right) if the water remains in the
center of the pores. In the mixed-wet case (middle), oil has dislodged water from some of the
pore surfaces, but oil still remains in the centers of some water-wet pores. The three scenario
illustrated in Figure 2.3 have similar saturations of water and oil (Abdallah, et al., 2007).
2.2.2 Measurement of Wettability
Many different procedures have been proposed for the measurement of wettability of a system.
They include quantitative and qualitative methods. The quantitative methods include but are not
limited to the measurement of the contact angle, imbibition and forced displacement (Amott), and
U.S. Bureau of Mines (USBM) wettability method. The qualitative methods include imbibition
rates, floatation, microscopic examination, relationship between permeability and saturation,
Figure 2.0.3: Wettability of rock formation on a pore scale fluid distribution (Abdallah, et al.,
2007) Figure 2.3: Wettability of rock formation on a pore scale fluid distribution (Abdallah, et al.,
2007)
9
nuclear magnetic resonance, capillary pressure curves, displacement capillary pressure,
cappillarimetric method, reservoir logs, and dye adsorption (Anderson, 1986).
Based on all the methods of wettability measurement stated, no single accepted method exists.
However, three of the quantitative methods are widely used. First method is the measurement of
the contact angle. The second method is the Amott method (Amott, 1959)- the measurement of the
relative amounts of oil and water displaced under similar conditions. The third method for
wettability measurement is the USBM method (Donaldson, Thomas, & Lorenz, 1969).
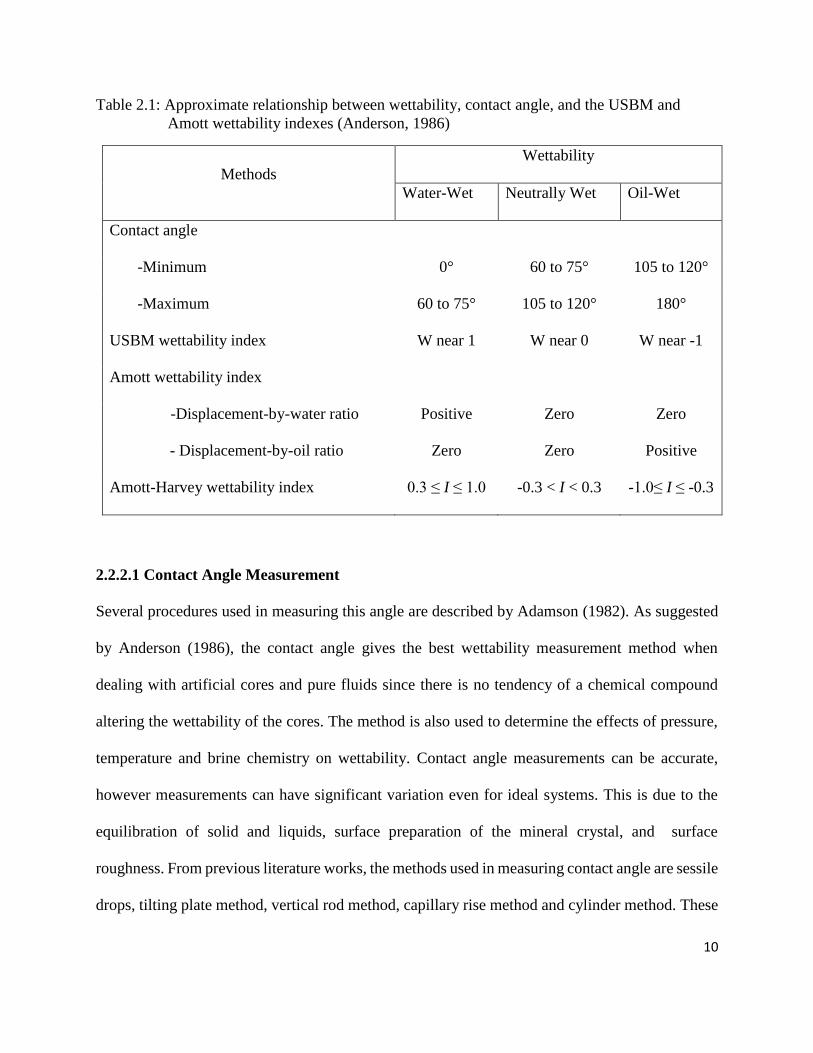
The measurement of the contact angle gives the wettability of a particular surface, while the
average wettability of a core is measured by Amott and USBM methods. Table 2.1 shows the
comparison between the three methods for wettability criteria. Each of the methods has different
criteria to determine the extent of water or oil wetness of the porous rock.
10
Table 2.1: Approximate relationship between wettability, contact angle, and the USBM and
Amott wettability indexes (Anderson, 1986)
Methods
Wettability
Water-Wet Neutrally Wet Oil-Wet
Contact angle
-Minimum 0° 60 to 75° 105 to 120°
-Maximum 60 to 75° 105 to 120° 180°
USBM wettability index W near 1 W near 0 W near -1
Amott wettability index
-Displacement-by-water ratio Positive Zero Zero
- Displacement-by-oil ratio Zero Zero Positive
Amott-Harvey wettability index 0.3 ≤ I ≤ 1.0 -0.3 < I < 0.3 -1.0≤ I ≤ -0.3
2.2.2.1 Contact Angle Measurement
Several procedures used in measuring this angle are described by Adamson (1982). As suggested
by Anderson (1986), the contact angle gives the best wettability measurement method when
dealing with artificial cores and pure fluids since there is no tendency of a chemical compound
altering the wettability of the cores. The method is also used to determine the effects of pressure,
temperature and brine chemistry on wettability. Contact angle measurements can be accurate,
however measurements can have significant variation even for ideal systems. This is due to the
equilibration of solid and liquids, surface preparation of the mineral crystal, and surface
roughness. From previous literature works, the methods used in measuring contact angle are sessile
drops, tilting plate method, vertical rod method, capillary rise method and cylinder method. These

11
methods are not commonly used in the petroleum industry since they are better used for pure fluids
with no adsorption or desorption of surfactants.
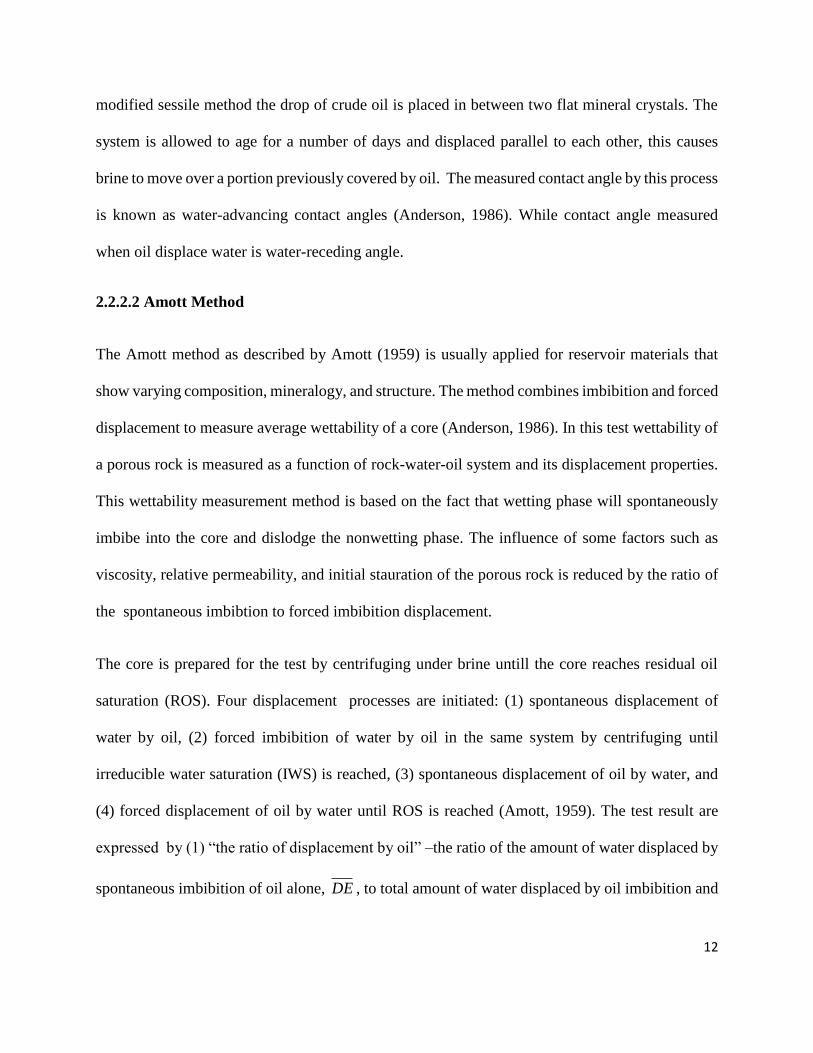
Moreover, the sessile drop method is generally used in the petroleum industry and a modified form
of the sessile drop method (Leach, Wagner, Wood, & Harpke, 1962). The mineral crystal to be
tested in both methods is placed in a laboratory test cell with inert material to prevent
contamination. Sandstones are usually composed of quartz and limestones of calcite, quartz or
calcite crystals are mostly used to depict the pore surface of a porous media. A flat polished mineral
crystal is used in the sessile method (see Figure 2.2) while for the modified sessile method two
polished flat mineral crystals are arranged parallel to each other on stands as illustrated in Figrure
2.4.
The
apparatus to be used for measuring contact angle are well cleaned to remove any trace of
contaminants which can alter the contact angle. The mineral crystal is placed in a cell filled with
brine. For sessile method, a drop crude oil is placed on the flat mineral crystal, while for the
Figure 2.4: Modified sessile method for contact angle measurement.
12
modified sessile method the drop of crude oil is placed in between two flat mineral crystals. The
system is allowed to age for a number of days and displaced parallel to each other, this causes
brine to move over a portion previously covered by oil. The measured contact angle by this process
is known as water-advancing contact angles (Anderson, 1986). While contact angle measured
when oil displace water is water-receding angle.
2.2.2.2 Amott Method
The Amott method as described by Amott (1959) is usually applied for reservoir materials that
show varying composition, mineralogy, and structure. The method combines imbibition and forced
displacement to measure average wettability of a core (Anderson, 1986). In this test wettability of
a porous rock is measured as a function of rock-water-oil system and its displacement properties.
This wettability measurement method is based on the fact that wetting phase will spontaneously
imbibe into the core and dislodge the nonwetting phase. The influence of some factors such as
viscosity, relative permeability, and initial stauration of the porous rock is reduced by the ratio of
the spontaneous imbibtion to forced imbibition displacement.
The core is prepared for the test by centrifuging under brine untill the core reaches residual oil
saturation (ROS). Four displacement processes are initiated: (1) spontaneous displacement of
water by oil, (2) forced imbibition of water by oil in the same system by centrifuging until
irreducible water saturation (IWS) is reached, (3) spontaneous displacement of oil by water, and
(4) forced displacement of oil by water until ROS is reached (Amott, 1959). The test result are
expressed by (1) “the ratio of displacement by oil” –the ratio of the amount of water displaced by
spontaneous imbibition of oil alone, DE , to total amount of water displaced by oil imbibition and
13
forced displacement, DB , and (2) “the ratio of displacement by water” –the ratio of the amount of
oil displaced by spontaneous imbibition of water alone, BC , to the total amouint of oil displaced
by water imbibition and centrifugal displacement, BD .
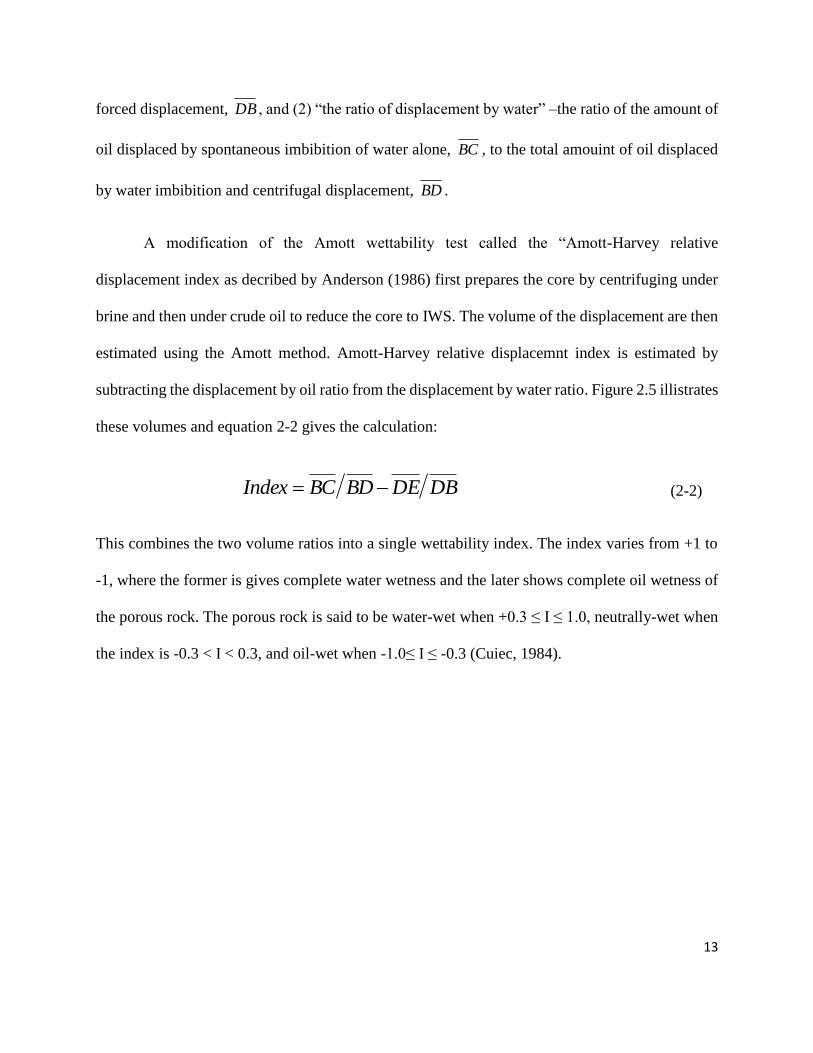
A modification of the Amott wettability test called the “Amott-Harvey relative
displacement index as decribed by Anderson (1986) first prepares the core by centrifuging under
brine and then under crude oil to reduce the core to IWS. The volume of the displacement are then
estimated using the Amott method. Amott-Harvey relative displacemnt index is estimated by
subtracting the displacement by oil ratio from the displacement by water ratio. Figure 2.5 illistrates
these volumes and equation 2-2 gives the calculation:
DBDEBDBCIndex (2-2)
This combines the two volume ratios into a single wettability index. The index varies from +1 to
-1, where the former is gives complete water wetness and the later shows complete oil wetness of
the porous rock. The porous rock is said to be water-wet when +0.3 ≤ I ≤ 1.0, neutrally-wet when
the index is -0.3 < I < 0.3, and oil-wet when -1.0≤ I ≤ -0.3 (Cuiec, 1984).

14
Figure 2.5: Capillary pressure curve of combined Amott and USBM method. (Anderson, 1986b)
2.2.2.3 USBM Wettability Index
The USBM method was developed by Donaldson et al. (1969) for measuring the wettability of a
porous media containing crude oil and brine using capillary pressure curves determined with a
centrifuge. This method considers the work required to achieve the forced displacement which is
estimated from the area under the capillary pressure curve. USBM test is more sensitive to near

15
neutral wettability than the Amott wettability test; however, it is limited to plug size samples since
the samples are expected to be spun in a centrifuge (Anderson, 1986).
The wettability of the plugs is determined from the area obtained from the drainage and imbibition
cycles of the capillary pressure curve to give a numerical representation of wettability. The
wettability (W) of the plug is estimated by the comparison of the log of area (𝐴1) for oil displacing
brine capillary pressure curve and the log of area (𝐴2) for brine displacing oil capillary pressure
curve as shown in figure 2.5. This gives the USBM Index defined as follows:
2
1logA
AW (2-3)
The core is water-wet when the USBM Index is greater than zero, and when it is less than zero,
the core is oil-wet. An index near zero indicates that the core is neutrally wet. The larger the
absolute value of the index, the more the preference of the wettability of the core.
2.3 SPONTANEOUS IMBIBITION
2.3.1 Definition
Spontaneous imbibition is defined by Morrow & Mason (2001) as the process by which a porous
medium imbibes a wetting fluid by capillary action. Imbibition is the process where a nonwetting
fluid is displaced by a wetting fluid (both fluids are immiscible), this is driven by surface energy.
In the past 50 years, a large proportion of literature on spontaneous imbibition has been related to
crude oil recovery from subterranean reservoirs. Oil recovery by spontaneous imbibition of brine
into reservoir rock is important when dealing with a low permeabilityand fractured formation.

16
Two common types of imbibiton process are spontaneous imbibition and dynamic imbibition. In
the spontaneous imbibition, the test core is saturated with oil and immersed in brine in the
imbibition cell. The oil recovered from the test core on the top of the imbibition cell is due to
capillary action. For dynamic (forced) imbibition, brine is injected at one end of the test core with
production at the other end of the core. Countercurrent imibibition occurs as brine is been injected
into the core with brine entering adjacent matrix. Oil in the test core will be pushed by the injected
water as the injection rate increases.
Spotaneous imbibition is a relatively slow process which is vital in the recovery of oil in reservoirs
under water injection or aquifer drive. The rate at which oil is recovered and the extent of oil
displacement from the matrix depends on the crude oil/brine/rock (COBR) interactions, which is
a factor of two phase flow and wetting process, and is controlled by the chemistry and physical
properties of COBR system and pore sturcture of the rock (Morrow and Mason, 2001).
Spontaneous imbibition can be categorized into cocurrent and countercurrent imbibition.
Countercurrent imbibition occurs when water and oil flow in opposite direction through the same
face (only one face is open to flow). Under cocurrent imbibiton, both inlet and outlet faces are
open to fluid flow. The displacing and displaced fluid in cocurrent imbibiiton moves in the same
direction. Both process are important in understanding the porous media imbibition mechanism.
2.3.2 Parameters Influencing Imbibition.
From several literatures, spontaneous imbibition has been found to be affected by several rock and
fluid properties and flow conditions (Mattax & Kyte, 1962; Lefebvre, 1978; Cuiec, Bourbiaux, &
Kalaydjian, 1990). Some of the parameters are permeability, heterogeneity, fluid saturation and
viscosity, density and IFT of the fluid properties.
17
Interfacial tension: Interfacial tension is the measure of the cohesive energy present at an
interface between the liquid phase of one substance and either a liquid, solid, or gas phase of
another substance arising from the imbalance of forces between molecules at the interface. Study
on IFT has shown that a decrease of the IFT may improve or reduce the imbibition rate depending
on the relative contribution of gravity and capillary forces. This ratio of capillary and gravity forces
can be quantified as derived by Schechter et al. (1994) to be the inverse of the Bond number
defined as:
gh
kCN B
1 (2-4)
Where C is a constant for a capillary tube model and the value of C is 0.4. Capillary forces are
dominant in cases when 𝑁𝐵−1 is large, and when 𝑁𝐵
−1 nears zero, gravity forces are dominant in the
flow. Keijzer et al (1993) positively identified that a reduction of IFT has no impact on the final
oil recovery, but affect the imbibition rate. The test indicates that the imbibition process is not
proportional to the IFT between two immiscible fluids.
Temperature: The main parameters such as viscosity, interfacial tension and density affecting
imbibition process have been shown to be temperature dependent (Chimienti, Illiano, & Najurieta,
1999).Chimienti et al. (1999) worked on the influence of IFT and temperature on the spontaneous
imbibition process to be applied in oil fields of the San Jorge Basin, and his study points out that
a strong imbibition rate and final oil recovery dependence with temperature was observed. The
sample reached an oil recovery of 30% of OOIP when subjected to a temperature of 20°C,
however, a sharp increase in oil recovery was noticed when the temperature was increased to 60°C

18
(47% of OOIP), reaching a similar oil recovery value to those samples with 60°C as their initial
imbibition temperature (44% of OOIP).
Permeability: Imbibition plays an important role in oil recovery from fractured reservoirs; and
the dominant displacement process in reservoirs under water flooding is imbibition which is
characterized by variation in permeability, especially in fractured reservoirs (Brownscombe &
Dyes, 1952). Study by Cuiec (1994) shows that oil recovery by imbibition of water in low-
permeability chalk is fast and efficient.
2.3.3 Generalized Scaling of Spontaneous Imbibition
Spontaneous imbibition is an important process in reservoir engineering with respect to oil
recovery from fractured reservoirs. From the study on scaling of oil recovery by imbibition from
fractured reservoirs by Mattax and Kyte (1962), a scaling class was proposed for systems with
different rock and fluid properties. The conditions set for the derivation of the scaling equation
include identical core shapes, viscosity ratios, and initial water saturation.
The scaling equation proposed by Mattax and Kyte (1962) for scaling imbibition data for different
oil/brine/rock systems or in predicting the oilfield performance from laboratory scale
measurement:
2,
1
L
kCtt
w
MKD
(2-5)
where 𝑡𝐷,𝑀𝐾 is a dimensionless time, t is the imbibition time, C is a units conversion factor when
t is in minutes which is equal to 0.018849, k is permeability in mD, 𝜙 is the fractional porosity, 𝜎
19
the interfacial tension in dynes/cm, 𝜇𝑤 is the water viscosity in cP, and L is the characteristic length
in cm.
The following conditions were made for equation for scaling of imbibition data to hold: (1) the
sample shapes and conditions must be identical, (2) the oil/water viscosity ratio is duplicated, (3)
effects of gravity can be neglected, (4) initial fluid distribution are to be duplicated, (5) the capillary
pressure functions must be directly proportional, and (6) the relative permeability functions are the
same. Mattax and Kyte (1962) used two sets of imbibition data to test the scaling equation and
Hamon and Vidal (1986) studied the effect of core length and boundary conditions on the
imbibition rate. To develop an improved scaling of the spontaneous imbibition process, Zhnag et
al. (1996) performed an extensive experimental study of twenty Berea cores. The system used in
all this studies is considered to be very strongly water-wet.
From the work of Warren and Root (1963); Kazemi et al. (1976); Kazemi et al. (1992) as cited in
Ma et al. (1997), a shape factor, SF , is presented to compensate for the effect of shapes and
boundary conditions:
n
i A
i
b
S
iS
A
VF
1
1 (2-6)
Where bV is the bulk volume of the matrix, iA is the area open to imbibition with respect to the ith
direction, iAS is the distance from iA to the center of the matrix, and n is the total number of
surfaces open to imbibition.

20
From equation 2-5, Mattax and Kyte (1962) did not define the characteristic length L. The
characteristic length that correlates to the shape factor, SL as defined by the work of Ma et al.
(1995) is:
n
i
Aii
b
S
S
SA
V
FL
1
1 (2-7)
Ma et al. (1995a) considered the mechanism of counter-current imbibition which led to the
modification of characteristic length:
n
i
Aii
b
C
lA
VL
1
(2-8)
Where 𝑙𝐴𝑖 is the distance that the imbibition front travels from the imbibition face to the no-flow
boundary and 𝐿𝐶 = 𝐿𝑆. Ma et al. (1995b) carried out an experimental study of the effect of oil
viscosity on the rate of spontaneous imbibition and showed that imbibition time is proportional to
the geometric mean of water and oil viscosities. This led to equation 2-5 been modified to include
the effect of viscosity ratio:
2,
1
Cow
MKDL
kCtt
(2-9)
Where MKDt , is the dimensionless time, k is permeability in mD,, C is a units conversion factor
when t is in minutes which is equal to 0.018849, 𝜙 is the fractional porosity, 𝜎 the interfacial
21
tension in dynes/cm, ow is the geometric mean of the oil and brine viscosity, CL is the
characteristic length that compensates for sample shape, size, and boundary conditions.
The application of the modified equation to the Mattax and Kyte (1962) sets of two data gives a
correlation that is satisfactory. This is a semi-empirical scaling group developed for recovery of
oil from very strongly water-wet media (VSWW).
Morrow and Xie (2001) worked on the contribtuion to oil recovery by gravity segregation at very
weakly water-wet condition, and developed a scaling for spontaneous imbibition when gravity is
included because when capillary forces are sufficeiently small, gravity segregation will have a
significant contribution on oil recovery. The expression for dimenasionless time for linear
imbibition for this case is:
H
C
owowC
DL
gLf
L
ktgct
2
2)(
(2-10)
Where gct D is the dimensionless time for imbibition that includes capillary and gravity forces,
representative imbibition capillary pressure is proportional to ow , )(f is a wettability
factor, and HL is the vertical height of the sample.
2.4 RELATIVE PERMEABILITY
2.4.1 Darcy’s Law
According to Honarpour et al.(1986), the rate of flow of water through a sand filter was determined
by Henry P. Darcy in 1856 to be described by the equation:

22
L
hhKAq 21 (2-11)
Where q represents the rate at which water flows downward through a vertical sand pack with
cross-sectional area A and length L; 1h and 2h represents hydrostatic heads at the inlet and outlet,
respectively , of the sand filter, and K is a constant. The flow of water through sand packs which
were 100% saturated with water was the limit of Darcy’s experiments.
Darcy’s law could be modified to describe the flow of fluids other than water as determined by
investigators, and that the proportionality constant K could be replaced by k/μ, where k is a
property of the porous material (permeability) and μ is a property of the fluid (viscosity). Darcy’s
law may be written in a more general form with this modification as:
dS
dP
dS
dZg
kVS
(2-12)
Where S is the distance in direction of flow, which is taken as positive, SV is the volume of flux
across a unit area of the porous medium in unit time along the flow path S, Z is the vertical
coordinate, which is taken as a positive downward, g is gravitational acceleration, ρ is the density
of the fluid, and dS
dP is the pressure gradient along S at the point to which SV refers.
If we assume that a rock which contains more than one fluid has an effective permeability to each
fluid phase and that the effective permeability to each fluid is a function of its percentage
saturation, a more useful form of Darcy’s law can be obtained. Honarpour et al. (1986) explained
that aabsolute permeability is equal to the effective permeability of a rock to a fluid with which it

23
is 100% saturated. Effective permeability to each phase is considered to be independent of the
other fluid phases and the phases are considered to be immiscible.
Darcy’s law may be restated for a system which contains three fluid phases, if we define relative
permeability as the ratio of effective permeability to absolute permeability. The Darcy’s law may
be expressed as:
dS
dP
dS
dZg
kkV o
o
o
roos
dS
dP
dS
dZg
kkV
g
g
g
rg
gs
(2-13)
dS
dP
dS
dZg
kkV w
w
w
rwws
Where oil, gas, and water are represented by the subscripts o, g, and w respectively. rok , rgk ,
rwk are the relative permeabilities to the three fluid phases at the respective saturations of the
phases within the rock.
The basis of most calculations of fluid flow within a hydrocarbon reservoir is governed by Darcy’s
law. For this law to be used it is necessary to evaluate the relative permeability of the reservoir
rock to each of the fluid phases involved in the fluid flow process. This determination must be
made throughout the range of fluid saturations that will be encountered. Problems related to
measuring and predicting relative permeability have been studied by several investigators, with

24
them coming out with different results. These measurement methods will be discussed in the next
section.
2.4.2 Measurement of Relative Permeability
In the analysis of a waterflood or EOR project, water and oil relative permeabilities of reservoir
rocks are routinely needed. Such data are necessary in almost all the flow and recovery
calculations. Honarpour et al. (1986) explained that the relative permeability of a rock to each fluid
phase can be measured in a core sample by two methods, namely (1) Steady-state, and (2)
Unsteady-state methods.
In the steady-state method, a fixed ratio of fluids is forced through the test sample (core) until
pressure equilibria and saturation are reached. Many techniques have been successfully used to
obtain a uniform saturation. In steady-state experiment to determine the water-oil relative
permeabilities, both fluid phases are injected simultaneously (see Figure 2.6). The pressure
differential during flow is measured, and water and oil relative permeabilities are determined from
this. After fluid saturations equilibrium has been reached within the test core, the saturations can
be determined by one of many measuring techniques which include microwave or X-ray
absorption (Shen & Bae, 1987).
To determine fluid saturations, a simple technique that involves recycling of water and oil in a
holding tank can be used as suggested by Shen and Bae (1987). By monitoring the rise and fall of
the water-oil interface inside the holding tank, fluid saturation changes inside the test core may be
determined by material balance. Thus, steady-state relative permeability measurements involve
straightforward experimental apparatus and procedures. However, there is a major drawback as

25
regards to steady-state method. The steady-state method is time-consuming and tedious, because
it takes a while to reach the steady state at each injection rate.
Several steady-state methods employed for measuring relative permeability as discussed by
Honarpour et al. (1986) includes stationary fluid, penn-state, single-sample dynamic, hassler,
hafford, and dispersed feed methods.
Figure 2.6: Steady-state waterflooding procedure (Glover, 2008)
26
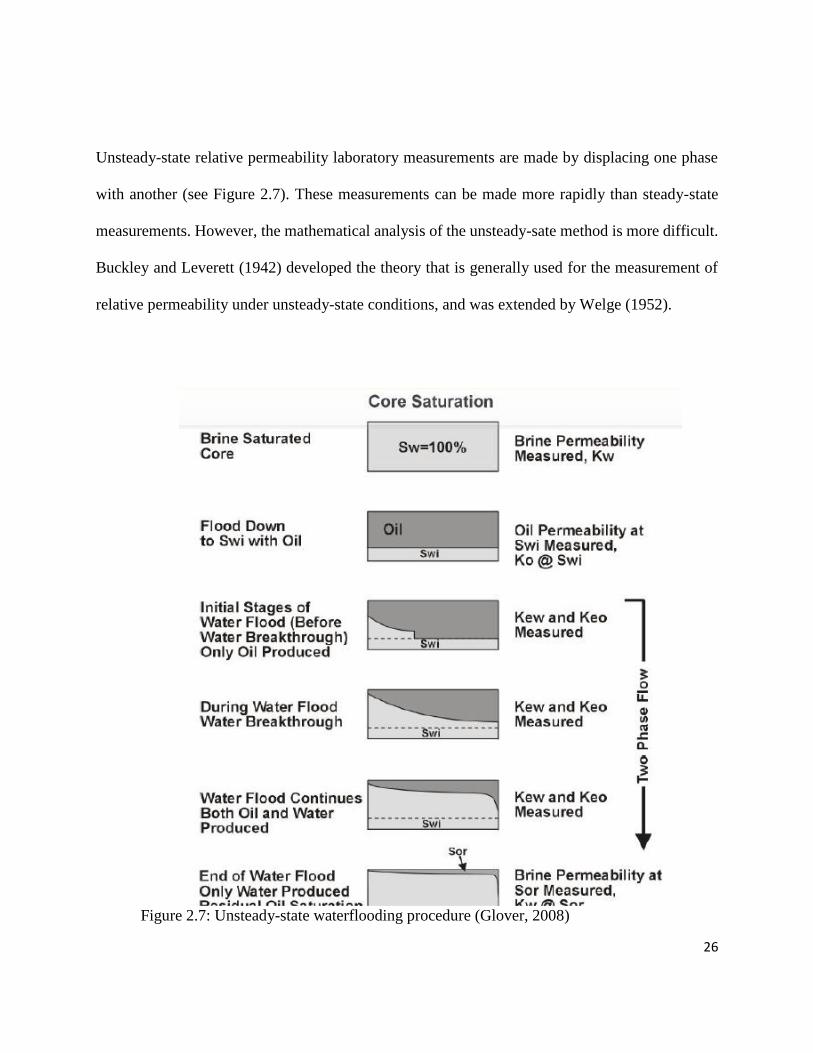
Unsteady-state relative permeability laboratory measurements are made by displacing one phase
with another (see Figure 2.7). These measurements can be made more rapidly than steady-state
measurements. However, the mathematical analysis of the unsteady-sate method is more difficult.
Buckley and Leverett (1942) developed the theory that is generally used for the measurement of
relative permeability under unsteady-state conditions, and was extended by Welge (1952).
Figure 2.7: Unsteady-state waterflooding procedure (Glover, 2008)
27
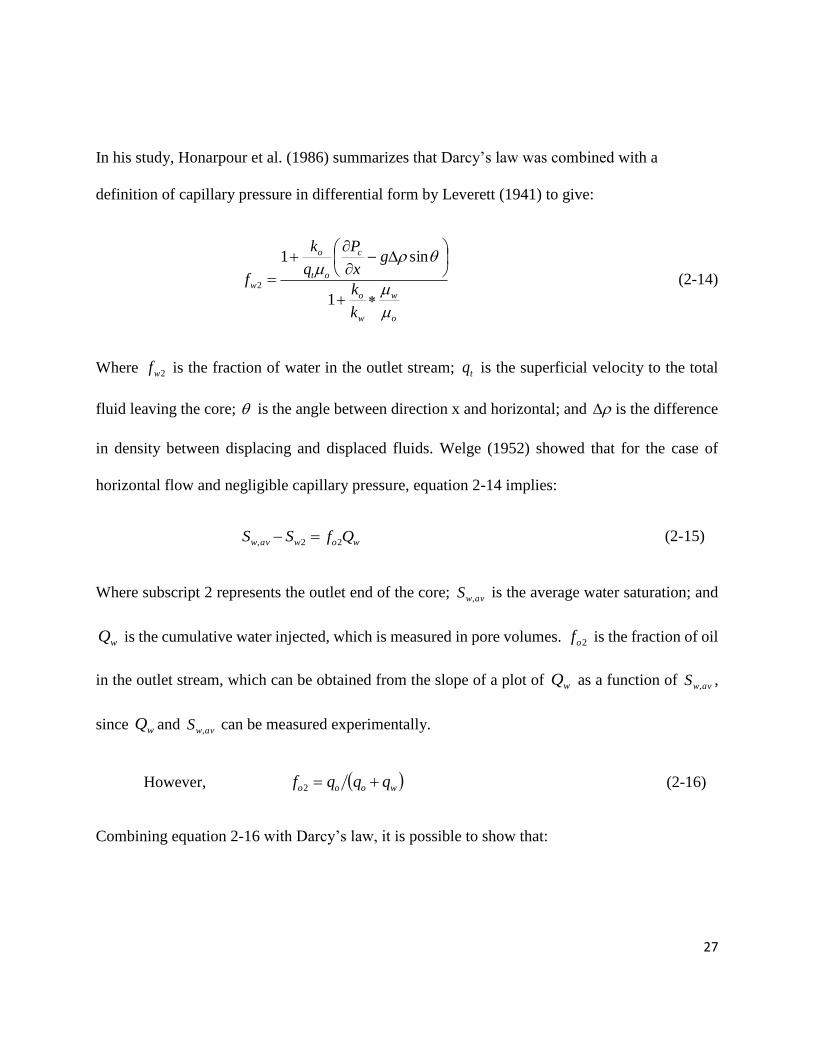
In his study, Honarpour et al. (1986) summarizes that Darcy’s law was combined with a
definition of capillary pressure in differential form by Leverett (1941) to give:
o
w
w
o
c
ot
o
w
k
k
gx
P
q
k
f
1
sin1
2 (2-14)
Where 2wf is the fraction of water in the outlet stream; tq is the superficial velocity to the total
fluid leaving the core; is the angle between direction x and horizontal; and is the difference
in density between displacing and displaced fluids. Welge (1952) showed that for the case of
horizontal flow and negligible capillary pressure, equation 2-14 implies:
wowavw QfSS 22, (2-15)
Where subscript 2 represents the outlet end of the core; avwS , is the average water saturation; and
wQ is the cumulative water injected, which is measured in pore volumes. 2of is the fraction of oil
in the outlet stream, which can be obtained from the slope of a plot of wQ as a function of avwS , ,
since wQ and avwS , can be measured experimentally.
However, wooo qqqf 2 (2-16)
Combining equation 2-16 with Darcy’s law, it is possible to show that:
28
rww
roo
o
k
kf
1
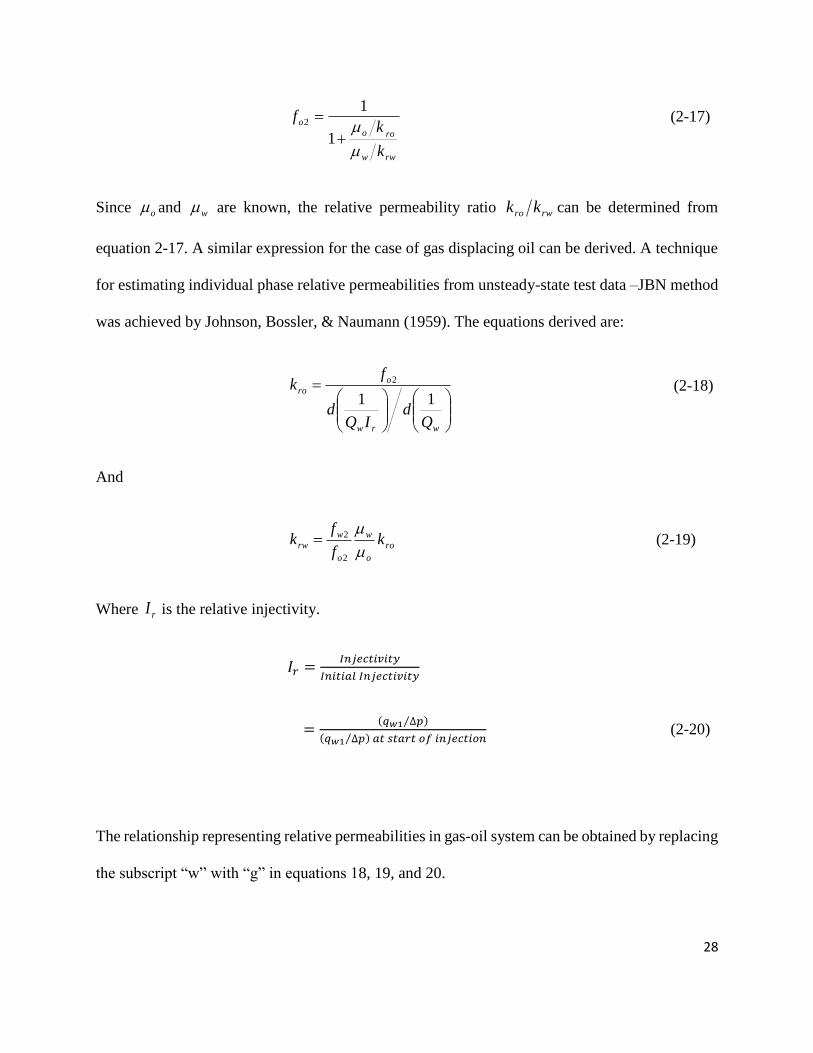
12 (2-17)
Since o and w are known, the relative permeability ratio rwro kk can be determined from
equation 2-17. A similar expression for the case of gas displacing oil can be derived. A technique
for estimating individual phase relative permeabilities from unsteady-state test data –JBN method
was achieved by Johnson, Bossler, & Naumann (1959). The equations derived are:
wrw
o
ro
Qd
IQd
fk
11
2 (2-18)
And
ro
o
w
o
wrw k
f
fk
2
2 (2-19)
Where rI is the relative injectivity.
𝐼𝑟 =𝐼𝑛𝑗𝑒𝑐𝑡𝑖𝑣𝑖𝑡𝑦
𝐼𝑛𝑖𝑡𝑖𝑎𝑙 𝐼𝑛𝑗𝑒𝑐𝑡𝑖𝑣𝑖𝑡𝑦
=(𝑞𝑤1 ∆𝑝⁄ )
(𝑞𝑤1 ∆𝑝⁄ ) 𝑎𝑡 𝑠𝑡𝑎𝑟𝑡 𝑜𝑓 𝑖𝑛𝑗𝑒𝑐𝑡𝑖𝑜𝑛 (2-20)
The relationship representing relative permeabilities in gas-oil system can be obtained by replacing
the subscript “w” with “g” in equations 18, 19, and 20.

29
Honarpour et al. (1986) explained that in laboratory experiments to determine relative permeability
under unsteady-state method, it is important that the pressure gradient be large enough to reduce
the effects of capillary pressure. Also, ensure that compressibility effects are insignificant in the
process by making sure that the pressure differential across the core be sufficiently small compared
with total operating pressure. The core sample used also should be homogenous and the driving
force and fluid properties be held constant during the test.
Measurement of relative permeability using unsteady-state methods are usually used to determine
the ratios ow kk , og kk and wg kk . These ratios are measured in a system that contains two fluids
for which the relative permeability ratio is determined. The performances of reservoirs which are
produced by waterflood or natural water drive are predicted using the ratio ow kk . In estimating
the production of a reservoir under a recovery process involving gas injection or solution gas drive,
the ratio og kk is used. To predict the performance of natural gas storage wells, wg kk ratio is
very important.
2.4.3 Two-Phase Relative Permeability
Direct experimental measurement has long been recorded in the petroleum related literatures to
determine relative permeability of porous rock. However, with the advent of digital reservoir
simulators, empirical methods for determining relative permeability are more widely used. The
general shape of the relative permeability curves may be approximated by these equations:
n
wrw SAk (2-21)

30
m
wro SBk 1 (2-22)
Where A, B, n, m are constants.
Honarpour et al. (1986) gives the four categories most relative permeability mathematical models
may be classified:
1. Capillary Models: These models are based on the assumption that a porous medium
consists of a bundle of capillary tubes of various diameters with a fluid path length longer
than the sample. This model ignores the interconnected nature of porous media and most
often provide unrelaistic results.
2. Statistical Models: These are based on modeling of porous media by a bundle of capillary
tubes with varying diameters distributed randomly. Also these models have the same
deficiency of not being able to characterize the interconnected nature of porous media.
3. Empirical Models: These models are based on proposed empirical relationships describing
experimentally estimated relative permeabilities. These have provided the most successful
approximations.
4. Network Models: These are frequently based on the modeling of fluid flow in porous media
using a network of electric resistors as an analog computer. These models are probably the
best tools for understanding flow in porous media.
Because of the complexity of porous media, hydrodynamic laws generally have limited use in
solving problems related to multiphase fluid flow. Honarpour et al., (1986) explained that the
Kozeny-Carmen equation is one of the early attempts to express laboratory measured data to rock
permeability. The equation describes the permeability of a porous media as a function of the

31
product of effective path length of the flowing fluid and the mean hydraulic radius of the channels
through which the fluid flows.
The work of Purcell (1949), an equation for the permeability of a porous system expressed in terms
of porosity and capillary pressure desaturation curve of the system by considering the porous
medium as a burdle of capillary tubes of different sizes. Rapoport and Leas (1951) presented two
equations for relative permeability to the wetting phase. The maximum and minimum wetting-
phase relative permeability equations are:
2
1
2
1
1
1(max)
m
wt
wt
m
wt
m
S
Sc
mwtc
wt
S
cS
Sc
S
c
m
mwt
rwt
dSP
SSP
S
dSPdSP
dSPS
SS
k
(2-23)
and
wtm
wt
S
c
S
c
S
c
m
mwtrwt
dSPdSP
dSP
S
SSk
11
1
3
1(min) (2-24)
Where mS represents the minimum irreducible saturation of the wetting phase from a drainage
capillary pressure curve; wtS represents the saturation of the wetting phase for which the wetting-
32
phase relative permeability is determined; cP is the drainage capillary pressure expressed in psi
and represents the porosity. mS , wtS , are all expressed as a fraction.
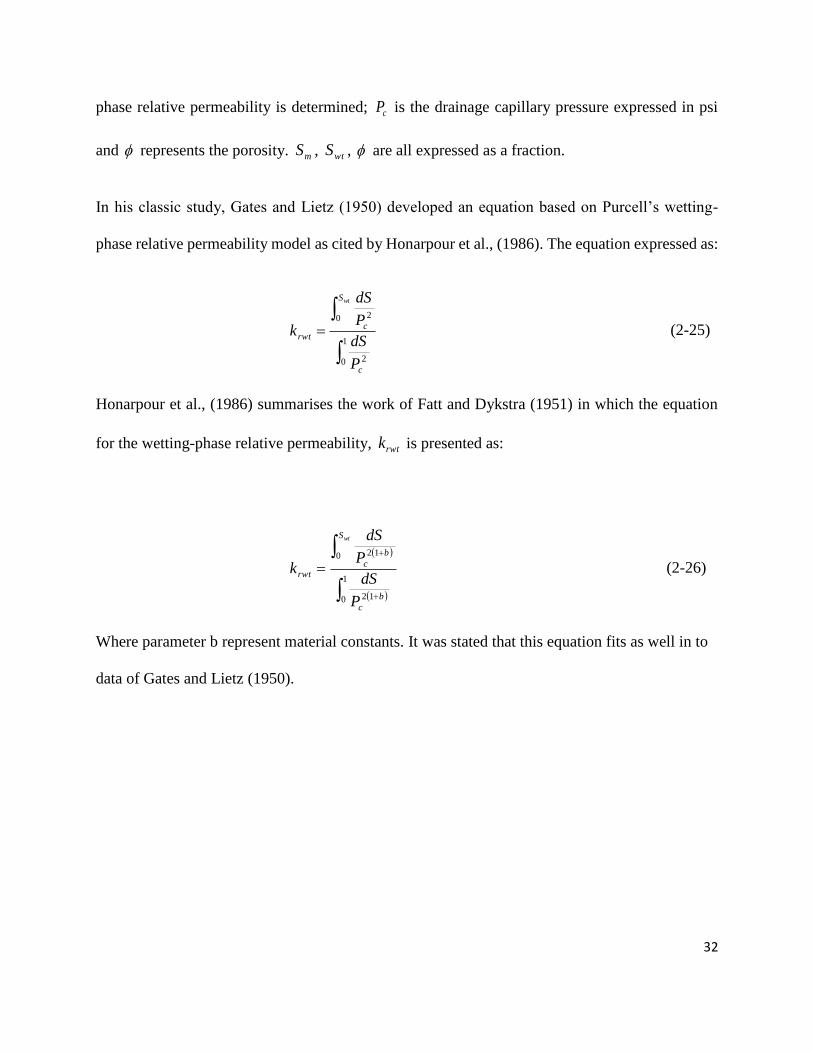
In his classic study, Gates and Lietz (1950) developed an equation based on Purcell’s wetting-
phase relative permeability model as cited by Honarpour et al., (1986). The equation expressed as:
1
0 2
0 2
c
S
crwt
P
dS
P
dS
k
wt
(2-25)
Honarpour et al., (1986) summarises the work of Fatt and Dykstra (1951) in which the equation
for the wetting-phase relative permeability, rwtk is presented as:
1
0 12
0 12
b
c
S
b
crwt
P
dS
P
dS
k
wt
(2-26)
Where parameter b represent material constants. It was stated that this equation fits as well in to
data of Gates and Lietz (1950).

33
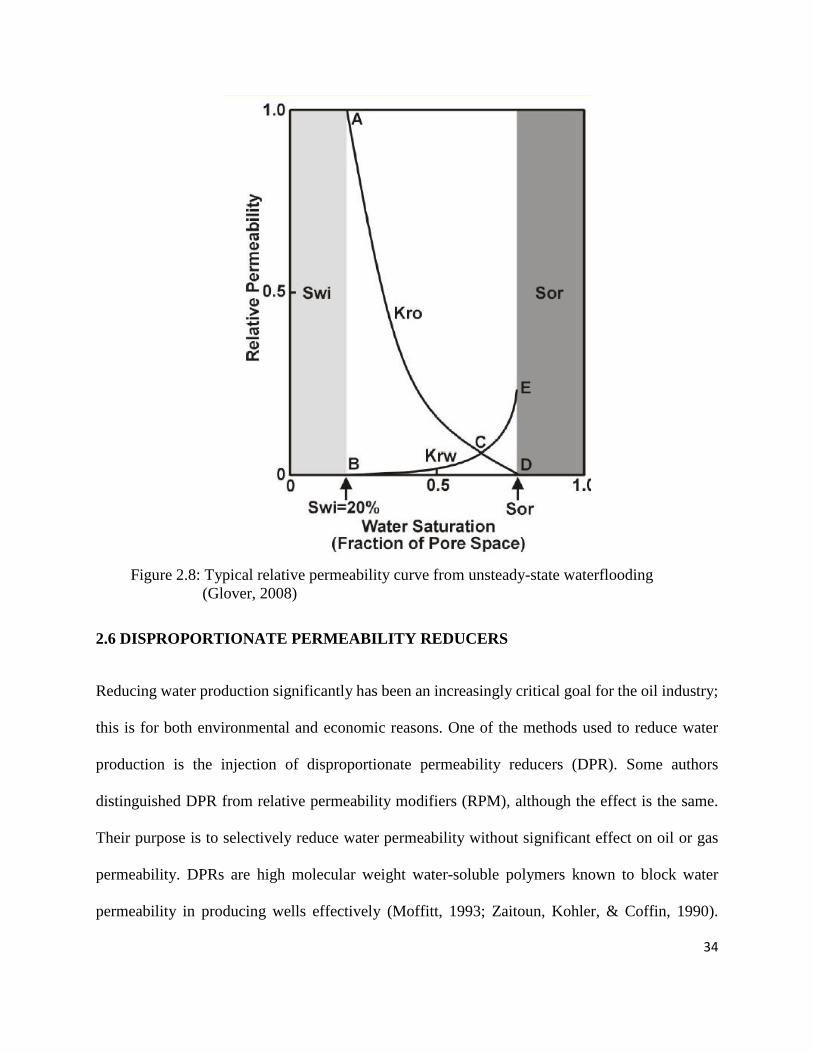
2.5 RELATIVE PERMEABILITY CURVE
The effective permeabilities measured over a range of fluid saturations enable relative permeability
curves to be constructed. Water-oil relative permeability curve are plotted as a function of water
saturation. Figure 2.8 illustrates an example of relative permeability curve from an unsteady state
waterflood experiment. At the initial condition of the experiment, the core is 80% saturated with
oil and 20% irreducible water saturation due to water wet nature of this example. Point A is the
permeability of oil under the initial core condition, which is unity since the measurement has been
taken as the base permeability. The beginning of water permeability is shown as point B. This is
zero since the water is immobile, i.e. irreducible.
Water is injected into the core at constant rate at one end with the emerging fluids being measured
at the other end of the core. The differential pressure is measured across the core. The permeability
to oil reduces during this process from unity to zero (curve ACD) while permeability to water
increases (curve BCE). There is no further recovery of oil from the test core after rok = 0 at point
D which occurs at irreducible oil saturation. Relative permeability of water and oil must be less or
equal to one always.
34
2.6 DISPROPORTIONATE PERMEABILITY REDUCERS
Reducing water production significantly has been an increasingly critical goal for the oil industry;
this is for both environmental and economic reasons. One of the methods used to reduce water
production is the injection of disproportionate permeability reducers (DPR). Some authors
distinguished DPR from relative permeability modifiers (RPM), although the effect is the same.
Their purpose is to selectively reduce water permeability without significant effect on oil or gas
permeability. DPRs are high molecular weight water-soluble polymers known to block water
permeability in producing wells effectively (Moffitt, 1993; Zaitoun, Kohler, & Coffin, 1990).
Figure 2.8: Typical relative permeability curve from unsteady-state waterflooding
(Glover, 2008)

35
DPRs are chemicals that plug pores, however, they do not swell or viscosify when in contact with
hydrocarbons as they do in a water environment. The chemicals give a rise in the potential to
improve oil recovery and cuts down on the cost of water-treatment in the petroleum industry.
Some of this system are polymers which when applied adsorb on to the grain surfaces to form
crosslinked gels in the porous media. The crosslinked-gel completely shutoff water flow by acting
as porosity fill sealants (PFS’s). The placement risk and cost related to PFS treatments have
discouraged oilfield operators from using chemical systems for many decades. Tielong et al.
(1996) worked on two partially hydrolyzed polyacrylamides (HPAM’s) treatment that selectively
reduces water permeability without affecting gas permeability. The results showed that the
polymer treatment selectively reduce the relative permeability to water phase significantly without
influencing the relative permeability to gas phase in water-wet sandstone cores in the whole
saturation region. The field trial of the same HPAMs show 60% to 70% reduction in water cut,
with an increase of 10% to 20% in gas-production rate in 1½ years.
Also Schneider and Owen (1982) used six different polyacrylamide polymers in the treatment of
both water-wet and oil wet cores, and measured the polymer/oil permeability curves. After the
polymer contact, the water relative permeability curve for water-wet cores was significantly lower
compared to that before polymer contact. In the experimental test carried out, polymer treatment
improved oil mobility by increasing oil relative permeability at all levels of oil saturation. Zaitoun
and Kohler (1989) studied a new polyacrylamide which reduces the water relative permeability,
and significantly increase gas relative permeability in water/gas system.
Chauveteau et al. (2004) worked on a new type of disproportionate permeability reduce (water
shutoff microgel) that is soft, stable and size-controlled microgels to decrease the production of
36
water by reducing the water permeability strongly. This occurs by the formation of thick absorbed
layers on Berea sandstone cores that is so soft that relative permeability to oil is not affected. The
result shows that they are remarkable DPR with no significant decrease in the oil permeability by
the presence of adsorbed microgel layers.
In this study, hydrophilic polymer (cationic acrylamide polymer) was initially proposed as DPR
because of their solubility in water and their ability to adsorb to the rock surface of the porous
media. They also do not need cross-linking of the polymer chains. The DPR reduces the pore throat
channel size and water-wet the pores. This results in the reduction of water permeability by a larger
factor with no significant effect on the oil; this leads to the treated well to produce more oil or gas,
provided the loss of productivity index is compensated by higher drawdown.
However, we had issues with sourcing for the reagents for the synthetic polymer, so it was decided
that Xanthan gum be used in this study as DPR. It is the most commonly used polysaccharide in
EOR and the molecular structure of xanthan gum gives high level of rigidity to the polymer
molecule which gives excellent resistance to mechanical breakage. Xanthan gum is highly known
for its strong pseudoplasticity in aqueous solution and for its tolerance of high ionic strengths. The
structure of the xanthan gum that is majorly accepted is a double chain occurring as a helix or as a
side-by-side agglomerate, with stability of this ordered conformation extended to higher
temperatures at increasing ionic strength.

37
2.7 EQUIVALENT NaCl DETERMINATION FROM IONIC CONCENTRATIONS.
A chemical analysis of the salt composition of a conductive solution -brine or formation water is
usually given in ionic or molecular concentration. These concentrations are given in milligrams
per liter or converted to parts per million, ppm. By operating on the ionic concentrations with
suitable multipliers they may be converted to equivalent amounts of NaCl.
In converting ionic concentrations to equivalent NaCl, Dunlap and Hawthorne (1951) developed
a series of multipliers as shown in Table 2.2. Schlumberger (1968) as cited by Desai and Moore
(1969) developed the variable Dunlap conversion multipliers as functions of each ion’s particular
concentration when dealing with solutions that are not too concentrated.
Table 2.2: Dunlap conversion factors
Ionic concentrations Conversion Factors
Na⁺ 1.00
Ca⁺⁺ 0.95
Mg⁺⁺ 2.00
Cl⁻ 1.00
SO₄⁻⁻ 0.50
HCO₃⁻⁻ 0.27
CO₃⁻⁻ 1.26
Desai and Moore (1969) described the Sinclair Variable Multipliers which is a function of total
solids concentration. These variables multipliers convert ionic concentrations to equivalent NaCl
and cover the spectrum of total solids concentrations, with an accuracy of what can be expected
from experimental estimated or measured equivalent NaCl. The application of conversion

38
multipliers to a chemical analysis is because of a main objective which is to effect equality between
a converted salt concentration and its measured equivalent NaCl concentration.
The ion concentrations depend on their own atomic weights and the total solids concentration of
the salt solution. The measured equivalent NaCl of a pure salt solution is determined by knowing
the resistivity of this solution and the concentration of a NaCl solution of identical resistivity or
reciprocal of conductivity. Desai and Moore (1969) carried out a comparison of the measured
equivalent NaCl concentration from over 100 synthetic and natural solutions with their equivalent
NaCl concentrations estimated from ionic concentrations as presented in Appendix A of this work
using the following conversion methods:
1. Sinclair Multipliers : The variable multipliers as a function of total solids concentration.
2. Variable multipliers as a function of ionic concentrations.
3. Dunlap Conversion Factors: This is a function of constant multipliers.
The outcome of the comparison carried out by Desai and Moore (1969) showed the reliability of
the Sinclair Multipliers in estimating equivalent NaCl over the whole concentration range
investigated and an accuracy approaching that of the measured equivalents. The Sinclair Variable
Multipliers for converting total solids concentration to equivalent NaCl will be used in this study
for the synthetic brine composition. This is due to the justification of its accuracy already
confirmed by Desai and Moore (1969) investigation, and as a result of the high dominance of NaCl
in formation water solution.
In this study, Xanthan gum was used as DPR and the use of the equivalent NaCl concentration was
important due to the results of the investigation by Nashawi (1991) on the effects of mono and
divalent cation salts on the screen factor of xanthan gum solutions. The screen factor of xanthan
39
gum solution and most polymers used for EOR decreases upon addition of salts. Also it was
concluded that the presence of calcium cations in xanthan gum solutions causes gel formation and
increases the degradation of the polymer. Magnesium chloride also has this effect on the polymer
solution.
2.8 CRUDE OIL/BRINE/ROCK INTERACTION
The believe from several historical researches was that petroleum reservoirs are strongly water-
wet due to the fact that almost all clean sedimentary rocks are strongly water-wet, and also because
sandstone reservoirs were deposited in aqueous environment where oil later migrated into.
However, reservoir rock can change from its original strongly water-wet condition by the
adsorption of polar compounds and deposition of organic matter originally in the crude oil. The
interaction between the rock surface and different components present in the crude oil can change
or alter the rock wettability (Anderson, 1986a). Within a reservoir rock, the wetting characteristics
of pore surfaces have a major contribution and vital role in immiscible fluid displacement and fluid
distribution.
Mineral surfaces wetting properties can be altered by the adsorption of polar crude oil components
on them. However, wetting alteration is a difficult phenomenon to be extrapolated from laboratory
observations to reservoir conditions because of the variability of mineral surfaces, chemical
complexity of the crude oils and the presence of brine. In order to align most conflicting reports
and observation about the mechanism of wettability alteration by crude oil, it should be known
that laboratory core tests is difficult to unravel these mechanism because of combined effects of
wetting and pore morphology (Buckley, Liu, & Monsterleet, 1998).
40
The wetting alteration occurrence crucially depends on crude oil composition with regards to the
polar components present in the crude oil which are those that influence wetting (particularly in
heavy asphaltene and resin fractions). Buckley et al (1998) discussed the four main categories of
the mechanism involved in crude oil/brine/rock interactions; these are discussed in this study as
follows.
1. Polar Interaction: This phenomenon occurs between oil and solid or mineral surface in the
absence of water. Several reports have highlighted the adsorption of asphaltenes onto
mineral surfaces directly from oil. The type of clay and its exchangeable cations, nitrogen
content of the oil and the solvent in which the polar compounds are dissolved are vital
variables that affect adsorption onto clay minerals in the absence of water. The adsorbed
material has a higher molecular weight than the oil it comes from and is enriched in oxygen,
nitrogen and sulfur (Buckley et al., 1998). In this study, polar interaction was not
considered vital due to the presence of brine in the core analysis.
2. Surface Precipitation: This phenomenon depends on the ability of crude oil to be a solvent
of its asphaltenes. Crude oils ability to act as solvent for its asphaltenes is known to vary
widely. The tendency for oil to alter wettability is enhanced in a situation where the oil is
a poor solvent for its asphaltenes. Several experimental studies have shown that the poorer
the oil solvent properties with respect to asphaltenes, the more the adsorption and less
water-wet conditions are achieved (Buckley et al., 1998).
3. Ionic Binding: In this phenomenon, the presence of divalent and multivalent ions like Ca²⁺
ions in the aqueous solution promotes ionic binding interactions. The divalent and
41
multivalent ions can bind oil-oil, solid-solid and/or oil-solid interfaces. The interaction for
the first two interfaces limits alteration of wettability, whereas the oil-solid interface
promotes wettability alteration (Buckley et al., 1998).
4. Acid/Base Interactions: Acid/Base interaction occurs as a result of surface charges between
solid-water and water-oil interfaces. In oil and solid interactions, water plays a key role in
mediating the interaction by making both phases interface become charged. Polar
functional groups belonging to for both the mineral and crude oil phases can behave as
acids and bases. The phenomenon of surface charge impacts interactions between crude
oils, solid surfaces and brine in two major ways.
First, net charge affects water film stability. For a given oil or solid surface, their surface
charges depends on the extent of acid/base dissociation reactions which is dependent on
the pH at the surface. For some brine compositions, both the phases’ interfaces will have
the same charge, which results in stabilized water film. When the water film is stable,
strongly water-wet is achieved. And if not, the collapsed water film supports wettability
altering interactions. Secondly, ionized acidic and/or basic sites influence adsorption. In
this stage, components of the crude oil at the oil/brine interface adsorbs on the solid surface
(Buckley et al., 1998).
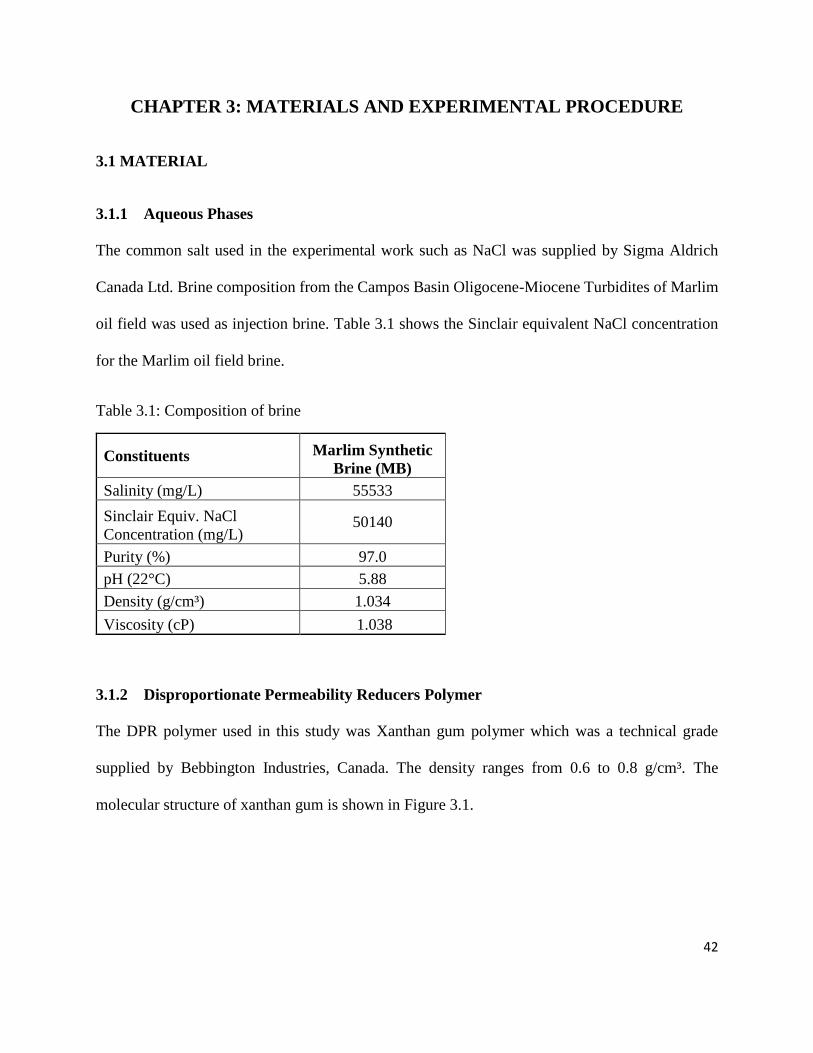
42
CHAPTER 3: MATERIALS AND EXPERIMENTAL PROCEDURE
3.1 MATERIAL
3.1.1 Aqueous Phases
The common salt used in the experimental work such as NaCl was supplied by Sigma Aldrich
Canada Ltd. Brine composition from the Campos Basin Oligocene-Miocene Turbidites of Marlim
oil field was used as injection brine. Table 3.1 shows the Sinclair equivalent NaCl concentration
for the Marlim oil field brine.
Table 3.1: Composition of brine
Constituents Marlim Synthetic
Brine (MB)
Salinity (mg/L) 55533
Sinclair Equiv. NaCl
Concentration (mg/L) 50140
Purity (%) 97.0
pH (22°C) 5.88
Density (g/cm³) 1.034
Viscosity (cP) 1.038
3.1.2 Disproportionate Permeability Reducers Polymer
The DPR polymer used in this study was Xanthan gum polymer which was a technical grade
supplied by Bebbington Industries, Canada. The density ranges from 0.6 to 0.8 g/cm³. The
molecular structure of xanthan gum is shown in Figure 3.1.
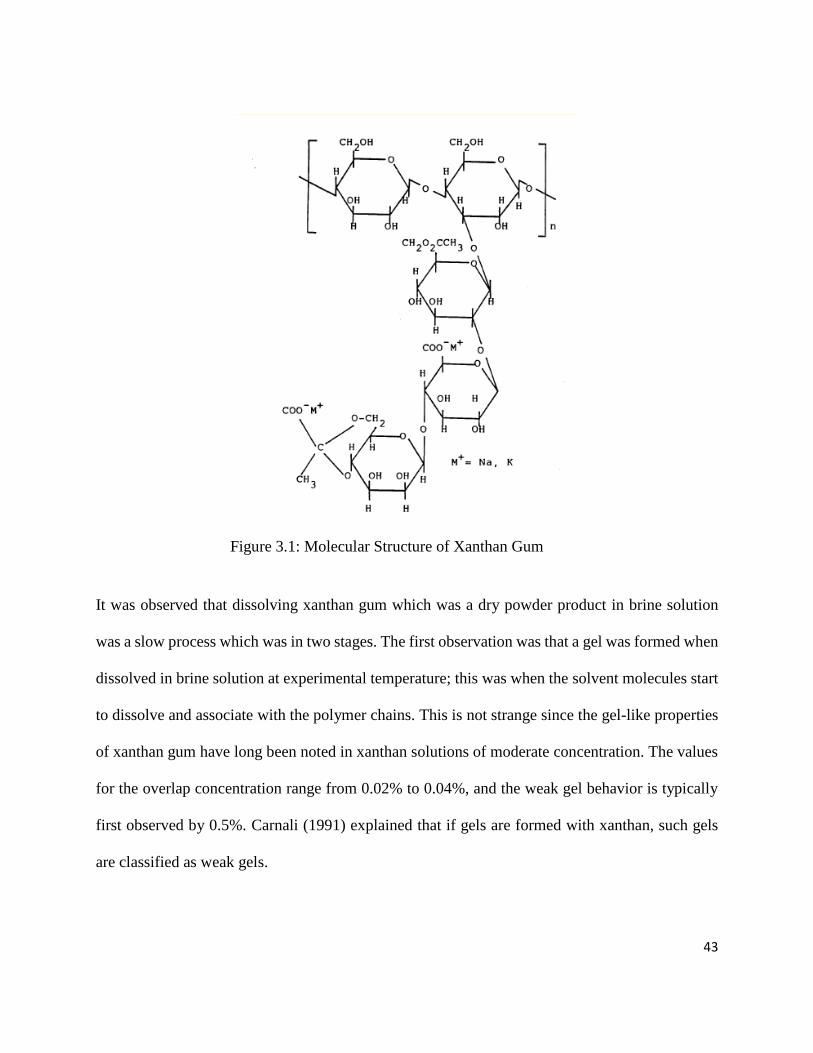
43
It was observed that dissolving xanthan gum which was a dry powder product in brine solution
was a slow process which was in two stages. The first observation was that a gel was formed when
dissolved in brine solution at experimental temperature; this was when the solvent molecules start
to dissolve and associate with the polymer chains. This is not strange since the gel-like properties
of xanthan gum have long been noted in xanthan solutions of moderate concentration. The values
for the overlap concentration range from 0.02% to 0.04%, and the weak gel behavior is typically
first observed by 0.5%. Carnali (1991) explained that if gels are formed with xanthan, such gels
are classified as weak gels.
Figure 3.1: Molecular Structure of Xanthan Gum

44
The second stage is the type of mixing used. A good dispersion is important not only with respect
to the screen factor of the solution but also to avoid plugging of small pores in the core sample
during imbibition. The polymer powder was added gradually to the brine solvent and mixed for 5
to 10 minutes using a Hamilton Beach blender which provides a shear rate to thoroughly disperse
the polymer particles and prevent gel formation.
Nashawi (1991) explained that it is important to note the intensity of the mixing shear and the time
at a particular shear condition affect the polymer solution. Too high a shear rate results in loss of
screen factor while at a given shear rate, too short a mixing time failed in breaking the gel. After a
good dispersion was achieved, the polymer brine solution (MPB) was filtered using a vacuum filter
with a 5-10 μm Fisherbrand P5 filter paper placed in the round bottom flask to remove remaining
gels in the polymer-brine solution as shown in Figure 3.2. This was done to avoid plugging of the
core samples under polymer-brine imibibition.
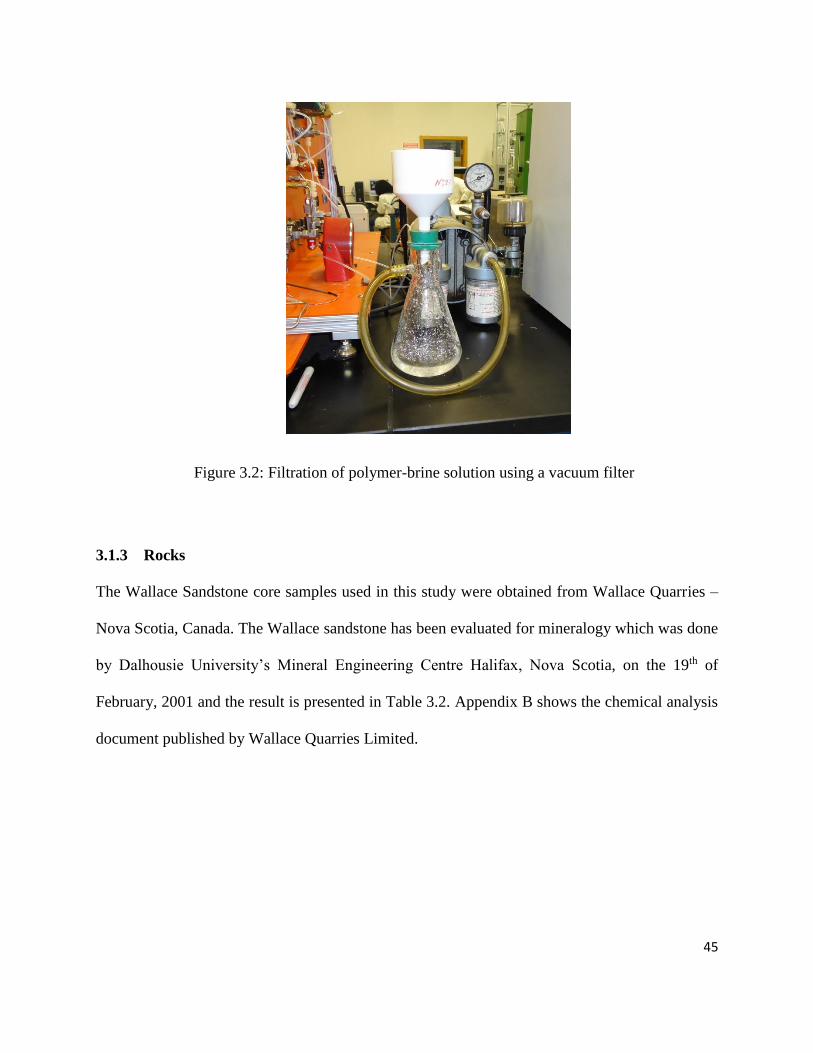
45
3.1.3 Rocks
The Wallace Sandstone core samples used in this study were obtained from Wallace Quarries –
Nova Scotia, Canada. The Wallace sandstone has been evaluated for mineralogy which was done
by Dalhousie University’s Mineral Engineering Centre Halifax, Nova Scotia, on the 19th of
February, 2001 and the result is presented in Table 3.2. Appendix B shows the chemical analysis
document published by Wallace Quarries Limited.
Figure 3.2: Filtration of polymer-brine solution using a vacuum filter
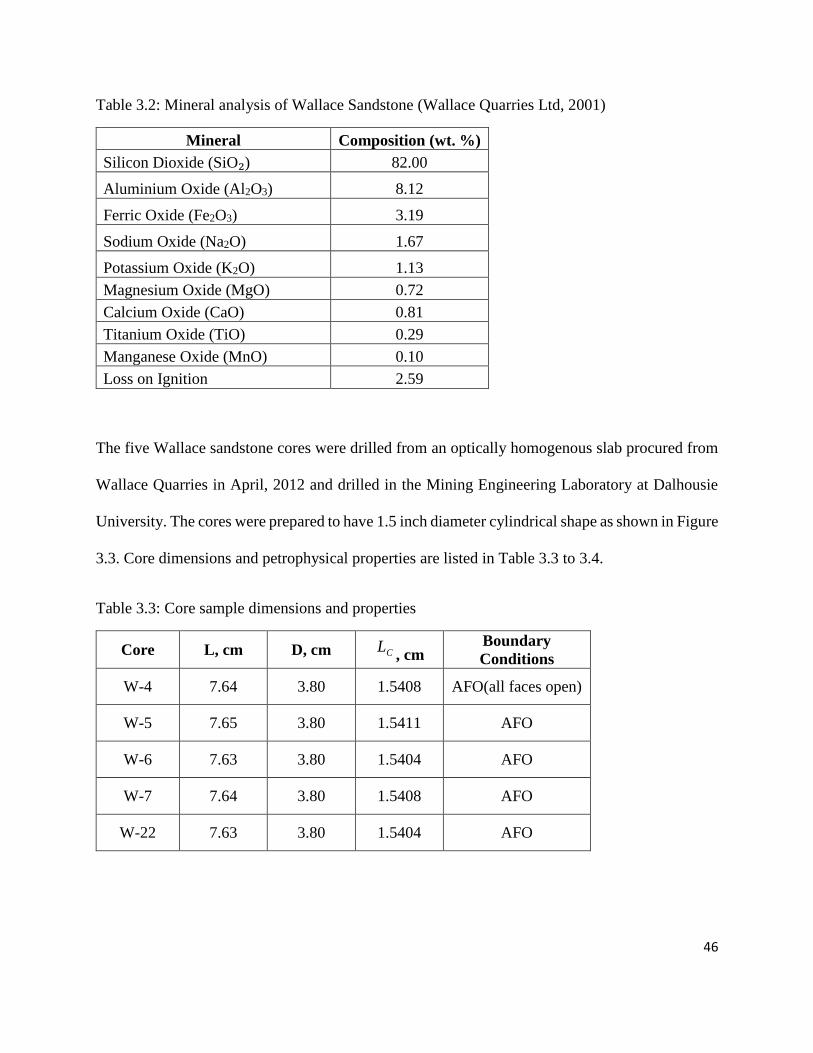
46
Table 3.2: Mineral analysis of Wallace Sandstone (Wallace Quarries Ltd, 2001)
Mineral Composition (wt. %)
Silicon Dioxide (SiO₂) 82.00
Aluminium Oxide (Al2O3) 8.12
Ferric Oxide (Fe2O3) 3.19
Sodium Oxide (Na2O) 1.67
Potassium Oxide (K2O) 1.13
Magnesium Oxide (MgO) 0.72
Calcium Oxide (CaO) 0.81
Titanium Oxide (TiO) 0.29
Manganese Oxide (MnO) 0.10
Loss on Ignition 2.59
The five Wallace sandstone cores were drilled from an optically homogenous slab procured from
Wallace Quarries in April, 2012 and drilled in the Mining Engineering Laboratory at Dalhousie
University. The cores were prepared to have 1.5 inch diameter cylindrical shape as shown in Figure
3.3. Core dimensions and petrophysical properties are listed in Table 3.3 to 3.4.
Table 3.3: Core sample dimensions and properties
Core L, cm D, cm CL, cm
Boundary
Conditions
W-4 7.64 3.80 1.5408 AFO(all faces open)
W-5 7.65 3.80 1.5411 AFO
W-6 7.63 3.80 1.5404 AFO
W-7 7.64 3.80 1.5408 AFO
W-22 7.63 3.80 1.5404 AFO

47
Table 3.4: Core samples petrophysical properties
Core L, cm D, cm bV , cm³ 𝑾𝒅 ,
grams
𝑾𝒘 ,
grams Φ , %
W-4 7.64 3.80 86.65 200.7 211.6 12.2
W-5 7.65 3.80 86.76 200.9 211.8 12.2
W-6 7.63 3.80 86.53 200.7 212.2 12.9
W-7 7.64 3.80 86.65 200.5 212.8 13.7
W-22 7.63 3.80 86.53 199.5 211.0 12.9
Where, L is the length of core; D is the diameter of core; characteristic length of core is 𝐿𝐶; 𝑉𝑏
represents bulk volume of core; Wd is the weight of dry core; Ww is the weight of 100% saturated
with brine core, and Φ represents the porosity of core.
Figure 3.3: The side view of well cleaned 1.5” diameter Wallace sandstone
reservoir rock core plugs

48
3.1.4 Kerosene
The kerosene used in this study was for laboratory research purposes supplied by Sigma-Aldrich,
Canada. It has a colorless appearance with boiling point of 175-325°C at 1,013 hPa (760mmHg)
and flash point of 82°C. The density of the liquid is 0.800 g/cm³ and viscosity of 2.113 cP.
Table 3.5: Solutions used for experiment
Solution Injected Marlim
Synthetic Brine (MB)
Injected Marlim
Polymer Brine (MPB)
Composition Equiv. NaCl – 5.014%
w/w
Equiv. NaCl – 5.014%
Polymer - 500ppm
w/w
Density g/cc 1.034 1.032
Viscosity cP 1.038 1.745
pH (22°C) 5.88 5.00
The measurement of the interfacial tension between kerosene and injected synthetic brine (MB)
was evaluated to be 12.87 dynes/cm, while that of kerosene and injected polymer-brine solution
(MPB) was measured to be 16.43 dynes/cm. Kruss spinning drop equipment was used for
interfacial tension measurement at an experimental temperature of 23°C.
3.2 PROCEDURES AND EQUIPMENT
3.2.1 Core Preparation
The cores were prepared such that the mineral oil used in the drilling of the cores were removed
so as replicate reservoir conditions by cleaning the cores in the following process.
49
1. The dry weight of each of the four core samples were taken by a precision weight scale
prior to the cleaning process.
2. The core samples were immersed in Methanol at experimental temperature (25°C) and
placed in vacuum until 100% saturated with Methanol.
3. The saturated cores were then weighed.
4. The cores were put in the fume hood to evaporate methanol.
5. The core samples were then weighed to observe if initial weights were restored.
6. The core samples were saturated with de-ionized (DI) water at experimental temperature
(25°C).
7. The core samples were then dried in an oven operating with a temperature of 90°C until
their weights were restored back to dry weight.
This method gives a very efficient cleaning for low permeability cores. All the core samples used
in the experiment have a diameter of 1.5 inches and variable length.
3.2.2 Core Characterization
3.2.2.1 Permeability
Permeability can be determined by flowing a single phase fluid through a core plug that is 100%
saturated with the flowing fluid. The flowing fluid must not react with the porous medium because
it may alter the characteristics of the porous medium thereby changing its permeability as flow
continues. The Darcy’s equation applied is:
PA
Lqkl
; (3-1)

50
22
2
outin
scscg
ppA
Lpqk
(3-2)
Where k represents permeability (Darcy); q is the flowrate (cm³/s); μ is viscosity of fluid (cP); L
is the length of the core (cm); A is the cross-sectional area of the core (cm²) ; P is pressure drop
across the core (atm), scq is the gas volumetric flowrate at reference pressure scp , while inp and
outp are the inlet and outlet pressure of the core.
3.2.2.2 Porosity
Porosity is the measure of the pore spaces in a rock which is a fraction of the pore volume to the
total volume. It is determined by fluid saturation method. In this approach the dry weight of the
core was determined using a precision weight scale. The scale measures weight with a precision
of 0.1gram. The dry core was then immersed in synthetic-brine (MB) and placed in the vacuum
chamber overnight under a pressure of -91432.4940 Pa.
The 100% saturated core was then weighed to determine its wet weight by the difference between
wet and dry weight. This is to determine the mass of liquid in the core at experimental temperature.
The pore volume was then calculated as the difference in mass divided by the experimental density
of synthetic brine (MB). Then the bulk volume of the core was determined as the product of the
cross-sectional area of the core and its length. Porosity was determined as the pore volume divided
by the bulk volume of the core. This process is non-destructive and has reasonable accuracy.
3.2.2.3 Specific Surface Area per unit Bulk Volume
This is defined by the work of Kozeny, Fair and Hatch, and Carman which is usually called Kozeny
equation as cited by Marshall (1958) and the equation may be written in the form:
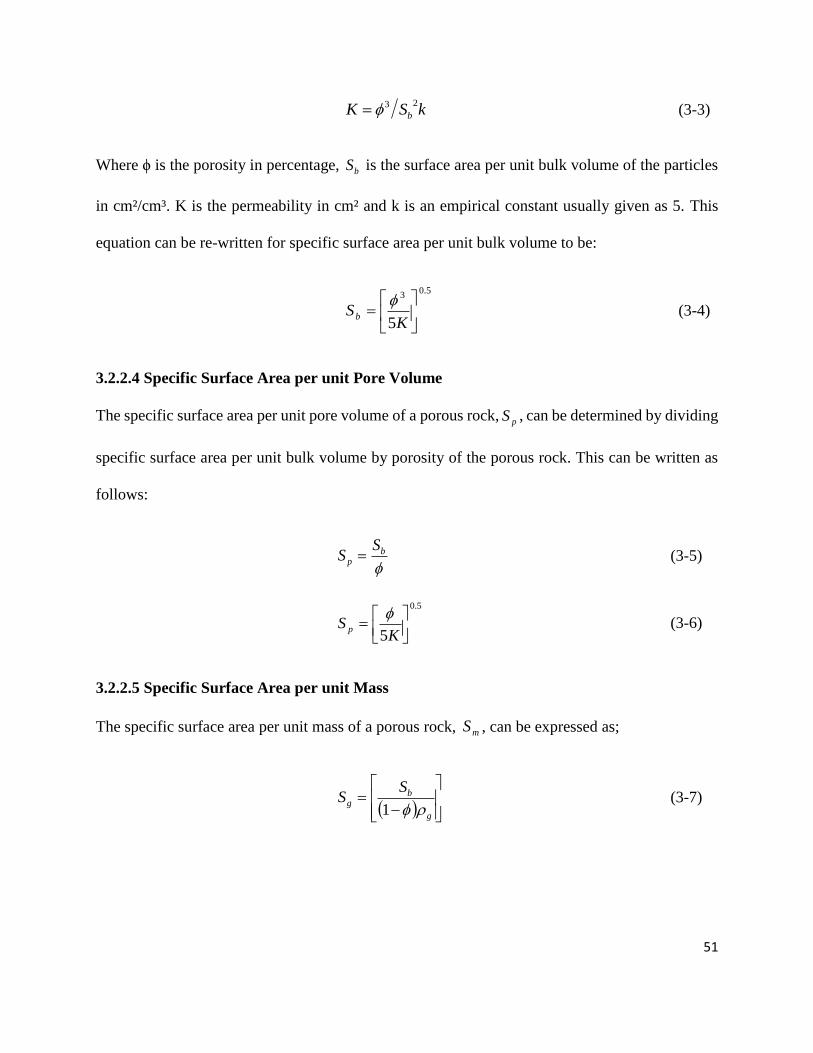
51
kSK b
23 (3-3)
Where ϕ is the porosity in percentage, bS is the surface area per unit bulk volume of the particles
in cm²/cm³. K is the permeability in cm² and k is an empirical constant usually given as 5. This
equation can be re-written for specific surface area per unit bulk volume to be:
5.03
5
KSb
(3-4)
3.2.2.4 Specific Surface Area per unit Pore Volume
The specific surface area per unit pore volume of a porous rock, pS , can be determined by dividing
specific surface area per unit bulk volume by porosity of the porous rock. This can be written as
follows:
bp
SS (3-5)
5.0
5
KS p
(3-6)
3.2.2.5 Specific Surface Area per unit Mass
The specific surface area per unit mass of a porous rock, mS , can be expressed as;
g
bg
SS
1 (3-7)

52
Where,
1b
dg
V
W (3-8)
Where g is the density of grain in g/cm³, dW is the dry weight of the core in grams, and bV is
the bulk volume of the core in cm³.
3.2.3 Core Saturation
The core samples were immersed in brine solution contained in a beaker and the beaker was placed
in the vacuum chamber overnight at experimental temperature (25°C) until 100% saturated with
synthetic brine (MB). The core samples were then ready for further testing.
3.2.4 Core Flooding Set Up
The core flooding equipment named Benchtop Relative Permeameter (BRP) was supplied by Vinci
Technologies, France. The BRP is equipped with all wetted components made of Stainless Steel
316 for chemical compatibility and corrosion resistance. This system includes a fluid delivery
pump, two piston accumulators, a core-holder, a back pressure regulator, a confining pressure
system, a pressure measurement system, and a video tracker. Other accessory associated with the
BRP is the computer software application (Applilab software) for monitoring and controlling
process parameters simultaneously from one central unit.
The piston accumulators are driven by distilled water in order to maintain the pressure supplied to
the core holder and to avoid pressure pulsations. Most flows from desired accumulators are
regulated by the use of valves that are operated manually while the fluid delivery pump rates can
be adjusted both manually and remotely through the Applilab software. Figure 3.4 shows the set-
up and detailed parts list is made available in the Appendix C of this work.
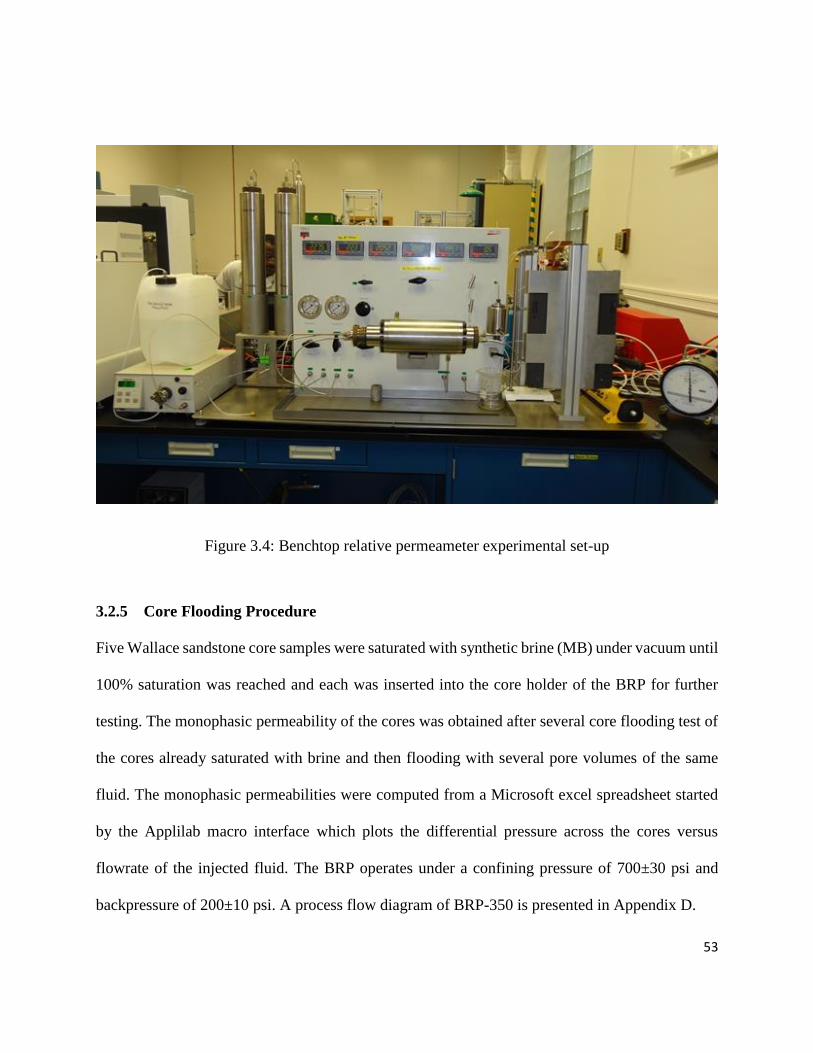
53
Figure 3.4: Benchtop relative permeameter experimental set-up
3.2.5 Core Flooding Procedure
Five Wallace sandstone core samples were saturated with synthetic brine (MB) under vacuum until
100% saturation was reached and each was inserted into the core holder of the BRP for further
testing. The monophasic permeability of the cores was obtained after several core flooding test of
the cores already saturated with brine and then flooding with several pore volumes of the same
fluid. The monophasic permeabilities were computed from a Microsoft excel spreadsheet started
by the Applilab macro interface which plots the differential pressure across the cores versus
flowrate of the injected fluid. The BRP operates under a confining pressure of 700±30 psi and
backpressure of 200±10 psi. A process flow diagram of BRP-350 is presented in Appendix D.

54
For spontaneous imbibition tests, each core samples which are 100% saturated with synthetic brine
was then subjected to drainage by injecting several pore volume of kerosene at 0.1cc/min until
irreducible water saturation (IWS) were reached. The displaced volume of brine was measured
using the Applilab acquisition interface using the video tracker which gives the displaced volume
as a function of level changes in the BRP burette, and used to compute the saturation of each
phases in the core. Each core was then immersed in the spontaneous imbibition cell under kerosene
and the volume of brine displaced by spontaneous (free) imbibition was measured after 2 days.
The core was then subjected to forced displacement by kerosene on the BRP until irreducible water
saturation (IWS) was reached, and the volume of displaced brine was measured. These were used
for the simple calculation of oil index for Amott-Harvey wettability index.
Then each core was immersed under brine in the spontaneous imbibition cell and the volume of
kerosene displaced was measured in an hour interval for 3 days. The cores were then returned to
the BRP for forced imbibition under brine, with several pore volumes of brine injected at 0.1
cc/min until the core reached residual oil saturation (ROS) and displaced volume of kerosene was
measured and used to compute the water index for the Amott-Harvey wettability index.
As for the core flooding under polymer-brine solution (MPB), the same experimental sequences
as described earlier were followed. The 100% saturated with brine core was first flooded with
several pore volumes of kerosene until IWS and the volume of displaced brine was measured to
determine IWS of the cores. The core was then placed in the imbibition cell under kerosene for
spontaneous imbibition and volume of brine displaced measured. The core was then returned to
the BRP for forced displacement under kerosene until IWS, and volume of displaced brine was
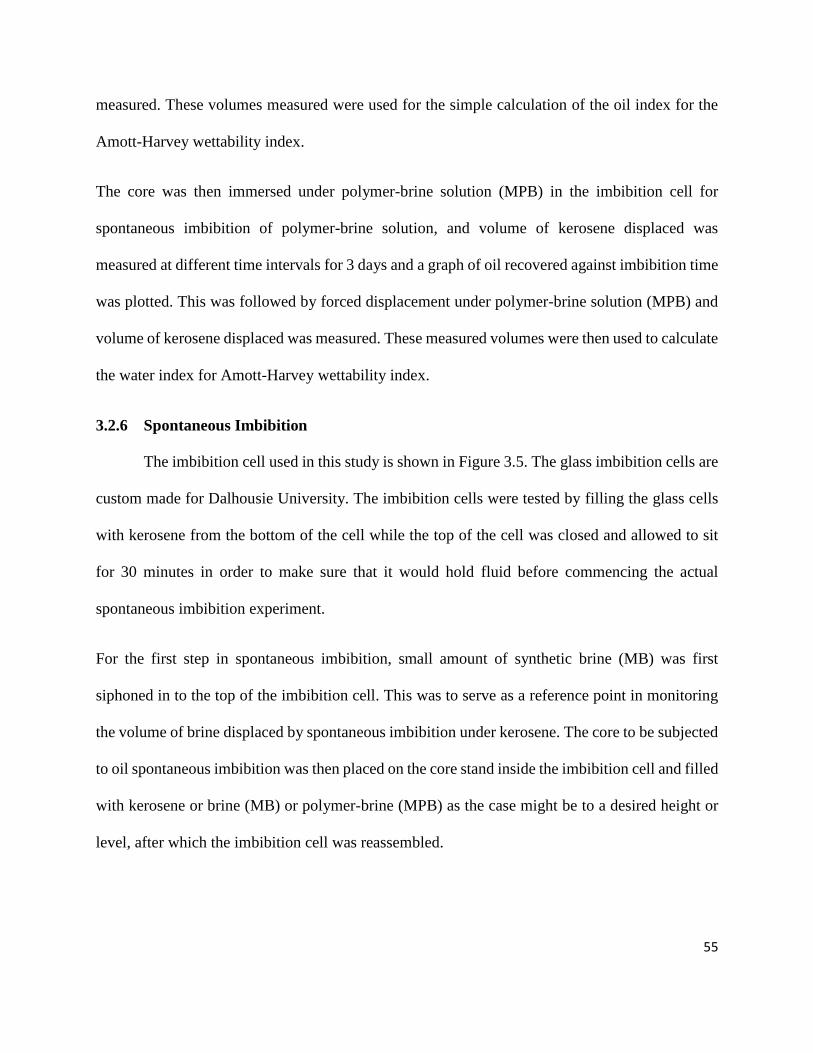
55
measured. These volumes measured were used for the simple calculation of the oil index for the
Amott-Harvey wettability index.
The core was then immersed under polymer-brine solution (MPB) in the imbibition cell for
spontaneous imbibition of polymer-brine solution, and volume of kerosene displaced was
measured at different time intervals for 3 days and a graph of oil recovered against imbibition time
was plotted. This was followed by forced displacement under polymer-brine solution (MPB) and
volume of kerosene displaced was measured. These measured volumes were then used to calculate
the water index for Amott-Harvey wettability index.
3.2.6 Spontaneous Imbibition
The imbibition cell used in this study is shown in Figure 3.5. The glass imbibition cells are
custom made for Dalhousie University. The imbibition cells were tested by filling the glass cells
with kerosene from the bottom of the cell while the top of the cell was closed and allowed to sit
for 30 minutes in order to make sure that it would hold fluid before commencing the actual
spontaneous imbibition experiment.
For the first step in spontaneous imbibition, small amount of synthetic brine (MB) was first
siphoned in to the top of the imbibition cell. This was to serve as a reference point in monitoring
the volume of brine displaced by spontaneous imbibition under kerosene. The core to be subjected
to oil spontaneous imbibition was then placed on the core stand inside the imbibition cell and filled
with kerosene or brine (MB) or polymer-brine (MPB) as the case might be to a desired height or
level, after which the imbibition cell was reassembled.
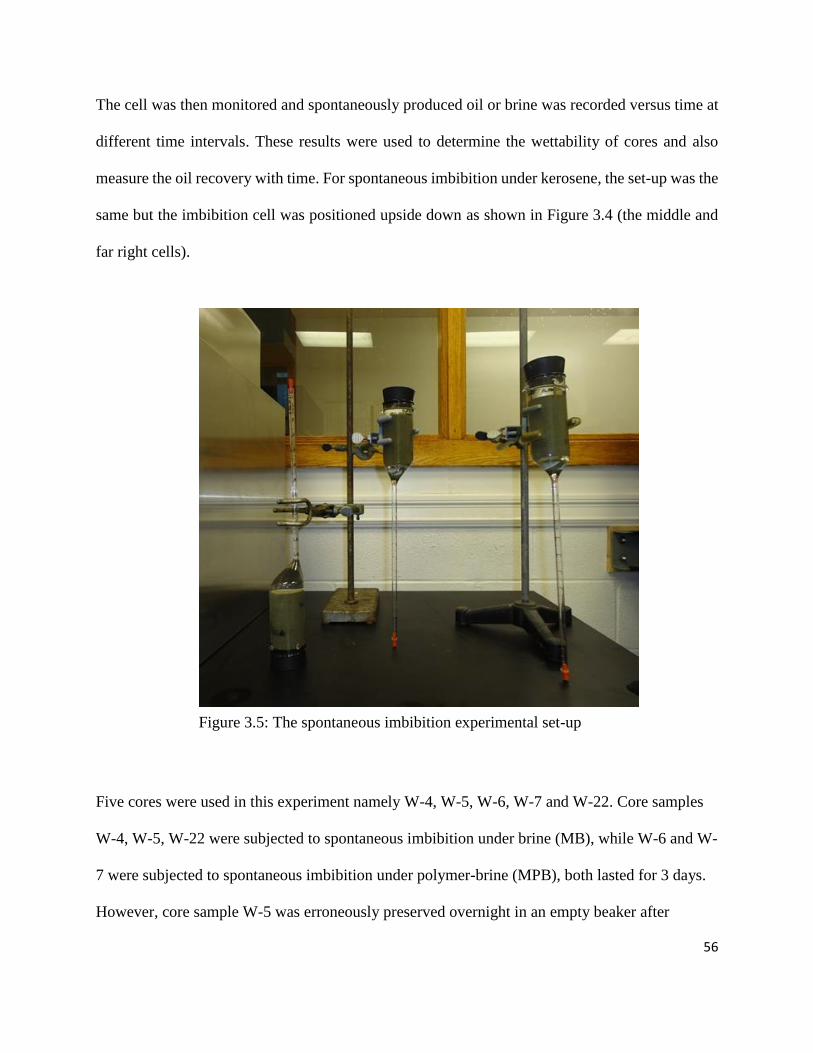
56
The cell was then monitored and spontaneously produced oil or brine was recorded versus time at
different time intervals. These results were used to determine the wettability of cores and also
measure the oil recovery with time. For spontaneous imbibition under kerosene, the set-up was the
same but the imbibition cell was positioned upside down as shown in Figure 3.4 (the middle and
far right cells).
Five cores were used in this experiment namely W-4, W-5, W-6, W-7 and W-22. Core samples
W-4, W-5, W-22 were subjected to spontaneous imbibition under brine (MB), while W-6 and W-
7 were subjected to spontaneous imbibition under polymer-brine (MPB), both lasted for 3 days.
However, core sample W-5 was erroneously preserved overnight in an empty beaker after
Figure 3.5: The spontaneous imbibition experimental set-up

57
preparing the core ready for spontaneous imbibition under brine, instead of placing the core
directly in the imbibition cell after forced imbibition. This has an adverse effect on the imbibition
oil recovery from the core. However, to have a good spontaneous imbibition data, it was decided
that another core sample be subjected to Amott-Harvey wettability test. This made the total core
samples used for this study to be five. It was noted that the core sample was drilled from another
homogenous slab procured from Wallace Quarries.

58
CHAPTER 4: RESULTS AND DISCUSSIONS
4.1 PETROPHYSICAL PROPERTIES OF CORE SAMPLES
The petrophysical characterization of the core samples which were determined by successful
experiments explained in section 3.2.2 of this work are listed in Table 4.1.
Table 4.1: Petrophysical properties of the core samples
Core
PV
(cm³)
φ
(%)
k
(mD)
𝑆𝑏
(cm²/cm³)
𝑆𝑝
(cm⁻¹)
𝑆𝑚
(cm²/g)
W-4 10.54 12.2 1.06 5747.68 47897.33 17191.44
W-5 10.54 12.2 1.05 5774.98 48124.83 17267.85
W-6 11.12 12.9 1.18 6142.5 47250 18781.22
W-7 11.9 13.7 1.35 6212.8 4534.91 19302.15
W-22 11.12 12.9 0.46 9724.76 75385.75 4218.00
4.2 MEASUREMENT OF WETTABILITY OF RESERVOIR CORE
Wettability is usually defined as a term used to depict the relative attraction of one fluid for a
solid in the presence of other immiscible fluids. It is also the tendency of a fluid to adhere to the
surface of a solid in the presence of another immiscible fluid. It represents a balance of forces
that exist between a three- phase interface. Distribution of oil and water in a reservoir system of
oil/brine/rock system is controlled by the wettability of the reservoir rock and affects fluid
distribution in the pores of the rock. Microscopic fluid distribution occurs mainly because of the
wettability of the porous media and dictates the amount of residual oil saturation and the
potential for a particular phase to flow. Several methods have been deployed to measure
59
wettability of a reservoir rock, in this study a quantitative method – Amott-Harvey wettability
Index was used.
4.2.1 Amott-Harvey Wettability Index
The Amott-Harvey wettability index combines both spontaneous imbibition and forced
displacement to determine the wettability of the core samples. The procedure followed in this
study in the measurement of wettability is a modification of the Amott wettability test called the
Amott-Harvey relative displacement index as described by Anderson (1986b) which includes a
modified core preparation step. The core samples were first injected with two (2) pore volumes
of brine under forced imbibition and then under kerosene to reduce the core samples to IWS.
This process makes the core sample restored to reservoir conditions. Then the following four (4)
steps were carried out:
(1) Immerse the core sample in kerosene, and measure the volume of brine displaced by
spontaneous imbibition after 2 days
(2) Forced imbibition of core sample in kerosene until IWS is reached, and measure the total
volume of brine displaced, including the volume displaced by spontaneous imbibition.
(3) Immerse the core sample in brine, and measure the volume of displaced kerosene by
spontaneous imbibition of brine after 3 days.
(4) Forced imbibition of core sample in brine until ROS is reached and measure the total
volume of kerosene displaced including the volume displaced during spontaneous
imbibition

60
In this study however, during the period of measuring wettability for core samples W-6 and W-7,
polymer-brine solution (MPB) were used instead of the synthetic brine (MB). The result from
these wettability measurement procedures for all the core samples is shown in Tables 4.2 and
4.3.
The best way to present the set of experimental data for displaced volumes during spontaneous
imbibition and forced imbibition for computing Amott-Harvey wettability index is by propagating
the error found in each measurement of displaced volumes and determine the amount of error in
the final wettability index. The spontaneous imbibition and forced imbibition measured displaced
volumes error was ±0.05 and the Amott-Harvey wettability index propagated error was determined
to be ±0.11, ±0.08, ±0.10, ±0.08 and ±0.06 for core samples W-4, W-5, W-6, W-7 and W-22
respectively.

61
Table 4.2: Spontaneous imbibition under brine only for cores W-4, W-5 and W-22
Core Procedures Experimental
stages
Volume
(ml) Index
Amott-Harvey
Index
Core W-4
Spontaneous
Oil Imbibition A 0.00 Oil Index
=0 .00/(0.00+0.05)
= 0.00
Amott-Harvey
Index
= Water Index-Oil
Index
= 0.17-0.00
= 0.17
“Neutrally Wet”
Forced Oil
Imbibition B 0.05
Spontaneous
Brine
Imbibition
C 0.08 Water Index
=0 .08/(0.08+0.40)
= 0.17 Forced Brine
Imbibition D 0.40
Core W-5
Spontaneous
Oil Imbibition A 0.00
Oil Index
=0.00/(0.00+0.39)
= 0.00
Amott-Harvey
Index
= Water Index-Oil
Index
= 0.02-0.00
= 0.02
“Neutrally Wet”
Forced Oil
Imbibition B 0.39
Spontaneous
Brine
Imbibition
C 0.01 Water Index
= 0.01/(0.01+0.62)
= 0.02 Forced Brine
Imbibition D 0.62
Core W-22
Spontaneous
Oil Imbibition A 0.00
Oil Index
= 0.00/(0.00+0.60)
= 0.00
Amott-Harvey
Index
= Water Index-Oil
Index
= 0.67-0.00
= 0.67
“Water-Wet”
Forced Oil
Imbibition B 0.60
Spontaneous
Brine
Imbibition
C 0.82
Water Index
= 0.82/(0.82+0.40)
= 0.67 Forced
Polymer-
Brine
Imbibition
D 0.40

62
Table 4.3: Spontaneous imbibition under polymer-brine for cores W-6 and W-7
Core Procedures Experimental
Stages
Volume
(ml) Index
Amott-Harvey
Index
Core W-6
Spontaneous Oil
Imbibition A 0.00
Oil Index
= 0.00/(0.00+0.40)
= 0.00
Amott-Harvey
Index
= Water Index-Oil
Index
= 0.73-0.00
= 0.73
“Water-Wet”
Forced Oil
Imbibition B 0.40
Spontaneous
Polymer-Brine
Imbibition
C 0.53 Water Index
= 0.53/(0.53+0.20)
= 0.73 Forced Polymer-
Brine Imbibition D 0.20
Core W-7
Spontaneous Oil
Imbibition A 0.00
Oil Index
= 0.00/(0.00+1.00)
= 0.00
Amott-Harvey
Index
= Water Index-Oil
Index
= 0.83-0.00
= 0.83
“Water-Wet”
Forced Oil
Imbibition B 1.00
Spontaneous
Polymer-Brine
Imbibition
C 0.97 Water Index
= 0.97/(0.97+0.20)
= 0.83 Forced Polymer-
Brine Imbibition D 0.20
From the tables showing the Amott-Harvey wettability index, core samples W4 and W-5 are
neutral-wet while W-6, W-7, and W-22 are water-wet. The result shows that Core sample W-22
was water-wet under brine. The water-wet wettability of core W-22 under brine may have occurred
due to the core having been drilled from a portion of the slab which is different in petrophysical
properties with the rest of the core. There is a sharp difference in permeability of core W-22
determined to be 0.46mD while other cores have permeability in the range of 1.05-1.35 mD. This
will be discussed more under the discussion section (section 4.4)

63
4.3 SPONTANEOUS IMBIBITION TEST RESULTS
The spontaneous imbibition was performed using two different brine solutions. Core samples W-
4, W-5 and W-22 were subjected to spontaneous imbibition under synthetic brine (MB) while
W-6 and W-7 were subjected to spontaneous imbibition under polymer-brine solution (MPB).
The plot of oil recovery during spontaneous imbibition under synthetic brine or polymer brine as
the case may be versus dimensionless time is presented in Figure 4.1.
Figure 4.1: Oil recovery by spontaneous imbibition as a function of dimensionless time for five
wallace sandstone cores.
0
0.2
0.4
0.6
0.8
1
1.2
0 200 400 600 800 1000 1200 1400
Imbib
itio
n O
il R
ecover
y (
ml)
Dimensionless time, tD,MK
Core W-5
Core W-4
Core W-6
Core W-7
Core W-22
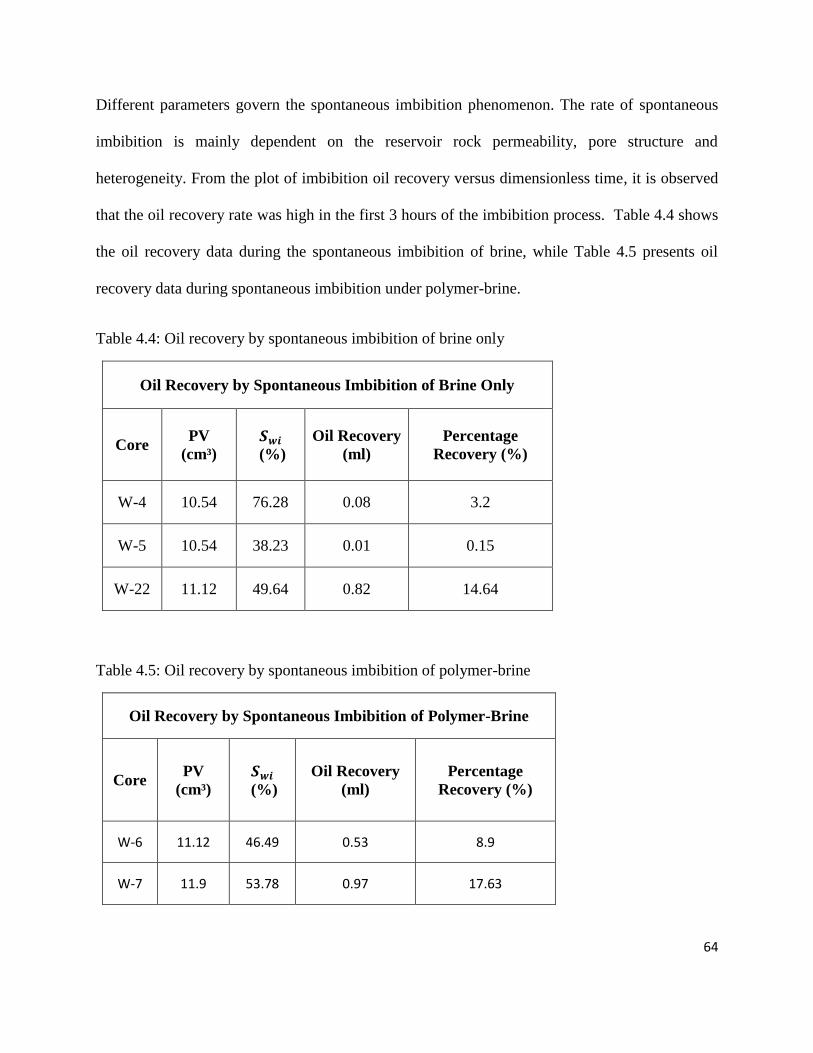
64
Different parameters govern the spontaneous imbibition phenomenon. The rate of spontaneous
imbibition is mainly dependent on the reservoir rock permeability, pore structure and
heterogeneity. From the plot of imbibition oil recovery versus dimensionless time, it is observed
that the oil recovery rate was high in the first 3 hours of the imbibition process. Table 4.4 shows
the oil recovery data during the spontaneous imbibition of brine, while Table 4.5 presents oil
recovery data during spontaneous imbibition under polymer-brine.
Table 4.4: Oil recovery by spontaneous imbibition of brine only
Oil Recovery by Spontaneous Imbibition of Brine Only
Core PV
(cm³)
𝑺𝒘𝒊
(%)
Oil Recovery
(ml)
Percentage
Recovery (%)
W-4 10.54 76.28 0.08 3.2
W-5 10.54 38.23 0.01 0.15
W-22 11.12 49.64 0.82 14.64
Table 4.5: Oil recovery by spontaneous imbibition of polymer-brine
Oil Recovery by Spontaneous Imbibition of Polymer-Brine
Core PV
(cm³)
𝑺𝒘𝒊
(%)
Oil Recovery
(ml)
Percentage
Recovery (%)
W-6 11.12 46.49 0.53 8.9
W-7 11.9 53.78 0.97 17.63

65
The total oil recovered from spontaneous imbibition under brine of core sample W-4 was 0.08cm³
and the pore volume (PV) of core was 10.54 cm³ as shown in Table 4.1 with irreducible water
saturation (IWS) of 76.28%. This shows that the recovery was very low i.e. 3.2% of the original
oil in place. For core W-5, the total oil recovered during spontaneous imbibition under brine was
0.01cm³. The core has a PV of 10.54cm³ and IWS of 38.23%. The result shows that the oil recovery
during spontaneous imbibition was very low i.e. 0.15% of the OOIP. This result might have been
caused by the core sample having been erroneously preserved in a beaker overnight after forced
displacement under oil as earlier highlighted in section 3.2.6. The core ought to have been placed
in the imbibition cell immediately.
The oil recovered for core sample W-6 during spontaneous imbibition under polymer-brine was
0.53cm³. The core has a pore volume of 11.12 cm³ and IWS of 46.49%.This shows a high oil
recovery of 8.90% of the OOIP. Also core W-7 was subjected to spontaneous imbibition under
polymer-brine and oil recovered was 0.97cm³. The core has a pore volume of 11.90cm³ and IWS
of 53.78%. This result indicated that oil recovery was high i.e. 17.63% of OOIP. Lastly, for core
sample W-22, oil recovered during spontaneous imbibition under brine was 0.82cm³. W-22 was a
core with PV of 11.12cm³ and IWS of 49.64%. The result obtained shows a high oil recovery of
14.64% of OOIP. The spontaneous imbibition data for all the cores is presented in Appendix E.
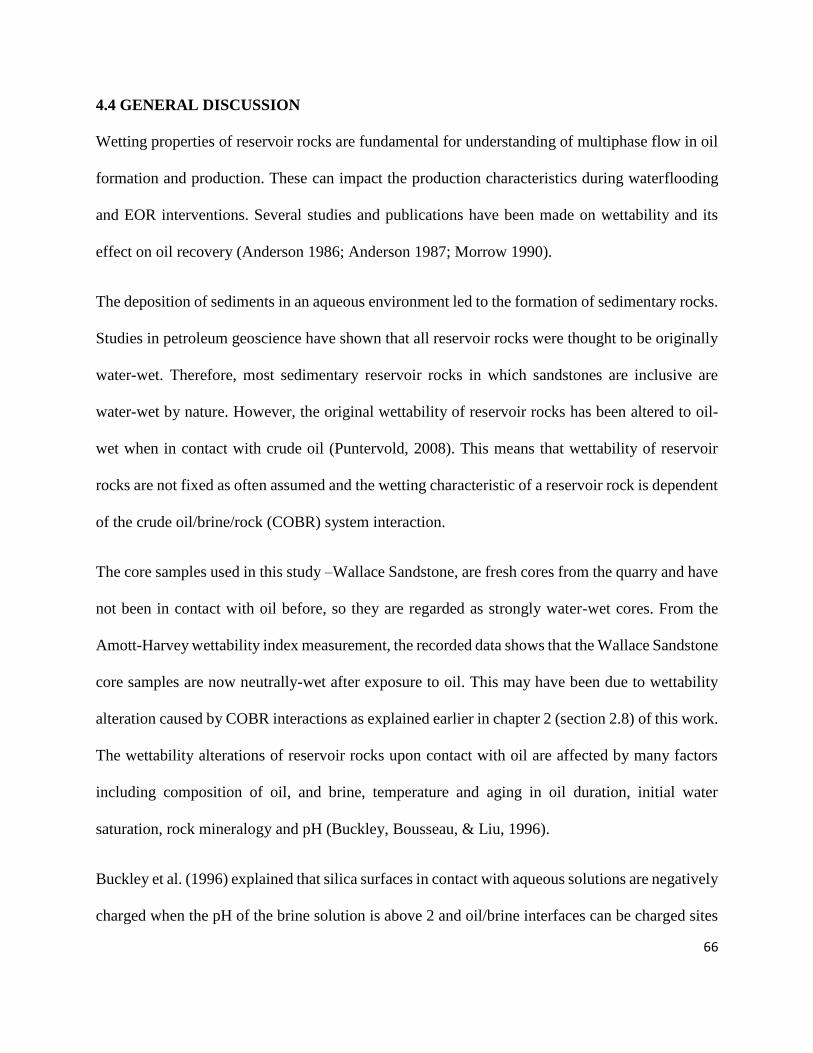
66
4.4 GENERAL DISCUSSION
Wetting properties of reservoir rocks are fundamental for understanding of multiphase flow in oil
formation and production. These can impact the production characteristics during waterflooding
and EOR interventions. Several studies and publications have been made on wettability and its
effect on oil recovery (Anderson 1986; Anderson 1987; Morrow 1990).
The deposition of sediments in an aqueous environment led to the formation of sedimentary rocks.
Studies in petroleum geoscience have shown that all reservoir rocks were thought to be originally
water-wet. Therefore, most sedimentary reservoir rocks in which sandstones are inclusive are
water-wet by nature. However, the original wettability of reservoir rocks has been altered to oil-
wet when in contact with crude oil (Puntervold, 2008). This means that wettability of reservoir
rocks are not fixed as often assumed and the wetting characteristic of a reservoir rock is dependent
of the crude oil/brine/rock (COBR) system interaction.
The core samples used in this study –Wallace Sandstone, are fresh cores from the quarry and have
not been in contact with oil before, so they are regarded as strongly water-wet cores. From the
Amott-Harvey wettability index measurement, the recorded data shows that the Wallace Sandstone
core samples are now neutrally-wet after exposure to oil. This may have been due to wettability
alteration caused by COBR interactions as explained earlier in chapter 2 (section 2.8) of this work.
The wettability alterations of reservoir rocks upon contact with oil are affected by many factors
including composition of oil, and brine, temperature and aging in oil duration, initial water
saturation, rock mineralogy and pH (Buckley, Bousseau, & Liu, 1996).
Buckley et al. (1996) explained that silica surfaces in contact with aqueous solutions are negatively
charged when the pH of the brine solution is above 2 and oil/brine interfaces can be charged sites
67
that are either positive or negative over a range of pH values. The DLVO theory can predict
whether or not the water film which is initially in contact with the mineral surface is stable. For
low ionic strength NaCl solutions, at high pH the water layer is stable and for low pH it is unstable.
When the water film breaks, oil gets in contact and adsorbs on the solid surface.
In this work, Wallace sandstone has mineralogy composition dominated by 82% silicon dioxide
and low ionic strength synthetic brine of low pH (5.88) was used. This may have resulted in the
thin water film layer in contact with pore surfaces of the core samples to be unstable and has the
tendency to break, and this leads to adsorption from the oil components on the mineral surface and
wettability alteration from water-wet Wallace sandstone core samples to neutrally-wet. This has
been proven by previous investigation where crude oil/brine/solid contact angles were measured
for Forties crude oil with aqueous solutions of varying pH and ionic composition. The results
showed water-wet conditions at high pH and oil-wet with low pH or high salinity brine (Brown &
Neustadter, 1980).
Also in the work of Buckley, Takamura, and Morrow (1989) as cited by Buckley et al. (1996),
adhesion test which was used to differentiate between COBR combinations with stable and
unstable water films, was used to characterize COBR interactions between crude oil from France
and glass surfaces with varying pH of brines. The result of the investigation showed that waterflood
displacement from bead packs under low pH of 2 (adhesive condition) were more oil-wet and oil
recovery was less, whereas for high pH of 11 (nonadhesive conditions) were more water-wet and
produced more oil. In this study, the synthetic brine (MB) used for the spontaneous imbibition of
cores W-4 and W-5 under brine was of a low pH value (5.88) and this may have caused the low
oil recovery due to the COBR interactions which causes the core samples to be neutrally-wet and

68
produces less oil during imbibition. Moreover, this interpretation is supported by the work of Ullah
(2013) who investigated the effect of waste cooking oil on wettability of Wallace sandstone and
determined the wettability of the reservoir rock changed from strongly water to near neutral wet
conditions after exposure to both crude oil and waste cooking oil. Wettability alteration is a
complex mechanism and difficult to understand using core tests because of combined effects of
wetting and pore morphology.
However, in the spontaneous imbibition of cores W-6 and W-7 under polymer-brine (MPB), there
was an increase in imbibition oil recovery which indicates a more water-wet condition by the
adsorption of the DPR polymer on the pore surfaces of the core samples and thereby making the
water films layer more stable on the mineral surfaces. Kowalewski, Holt, and Torsaeter (2002)
explained that the stability of a thick water film depends on the magnitude of the disjoining
pressure. The van der Waals forces are attractive; however, the electrostatic and steric forces must
be repulsive for a stable water film to be achieved. In the case of the polymer-brine solution used
in this experiment, it was believed that the coating on the pore surfaces of the core by the
disproportionate permeability reducers increased the magnitude of the electrostatic and steric
forces to be greater than the van der Waals forces; which in turns made the water film more stable
and the core samples W-6 and W-7 pore surfaces to be more water-wet.
Based on the result stated for cores subjected to spontaneous imbibition under brine and those
under polymer-brine, it is clear that the oil recovery was much higher under polymer-brine. The
recovery under brine was very low with exception to core W-22 which shows a high oil recovery
also. It was assumed that the slab from which the cores were drilled was optically homogenous in
which petrophysical properties are assumed uniform. But from the permeability measured for core
69
W-22 (0.46mD), it shows that the cores permeability is not showing similar petrophysical
properties with the rest of the cores with permeability in the range of 1.05-1.35mD. This might
have been due to geochemical processes including diagenesis during sedimentation in aqueous
environment.
Also difference in geochemical environment (pressure and temperature) and dissolution of feldspar
and clay formation may have caused changes in surface chemistry of the rock. Hauang, Bishop
and Brown (1985) explained that sandstone reservoir quality depends largely on the reservoir’s
diagenetic history and the precipitation of authigenic clay such as illite in reservoir rock pore space
can significantly reduce permeability and porosity of rock (Stalder, 1973). It is possible that the
core W-22 was drilled from a portion of the rock in which this conditions had occurred and that is
why it has a different surface chemistry with the other portion from where other cores were drilled.
Thus, the difference in the wettability of core sample W-22.
Several researches such as Tielong et al. (1996), Schneider and Owen (1982), Zaitoun and Kohler
(1989), Chauveteau et al. (2004) have shown that Xanthan gum and other DPR’s selectively
reduces the water permeability without significant effect on oil or gas permeability. This leads to
effective sweep efficiency during waterflooding and EOR interventions. However, researchers
have not investigated the effect of xanthan polymer or other DPRs on spontaneous imbibition of
brine into reservoir rocks. Much investment has gone into deploying DPRs for water control in
EOR interventions but most users might not have known the impact of DPR to wettability of rocks.
It is shown by the result of this work that DPRs make the core pore surfaces to be more water-wet
and increases the oil recovery through spontaneous imbibition phenomenon.

70
Bovwe (2013) also used xanthan gum polymer to petrophysically characterize the effect of DPR’s
on the fractional flow of water during waterflooding. An increase in the residual water saturation
and displacement pressure was observed after treating core with Xanthan gum polymer-brine. This
may be as a result of the adsorption of the xanthan polymer on the walls of the rock pore surface.
The flow of brine was hindered as the smaller pores which are usually occupied with brine were
further reduced by the xanthan polymer film. Analytically, the pressure needed to displace the
wetting fluid during a drainage process is inversely proportional to the pore radius. This could be
a reason for an increase in the displacement pressure observed. This supports the interpretation of
the results of this work results on wettability of the Wallace sandstone becoming more water-wet
after exposure to xanthan gum polymer- brine.
Also the petrophysical properties of the core sample as measured in this experiment shows that the
Wallace sandstone cores are of high porosity and very low permeability. The high porosity
contributes to the high pore volumes recorded for each core sample, however, the spontaneous
imbibition data shows a slow spontaneous imbibition rates under synthetic brine (MB) and the
spontaneous imbibition phenomenon only lasts for a very short period of time (3 hours).
It is well agreed that spontaneous imbibition is the most important phenomenon in oil recovery
from fractured reservoirs. Warren and Root (1963) as cited by Schembre, Akin, Bhat & Kovscek
(1998) explained that the rate of mass transfer for such reservoirs between the rock matrix and
fractures usually determines the oil production. Capillary suction is the main driving force for
spontaneous imbibition. Handy (1960) as cited by Schembre et al. (1998) investigated the
dynamics of imbibition by examining the limit of capillary forces dominating over buoyancy and
viscous forces. It was assumed that water imbibes in a piston-like manner, where gas viscosity is

71
negligible, capillary forces out weigh gravity forces and the spatial gradient of capillary pressure
is linear, the mass of imbibed water is given by Handy (1960):
21
21
2t
SkPAm
w
wc
w
(4-1)
Where m is the mass of water imbibed, φ is the porosity, 𝑆𝑤 the aqueous phase saturation, 𝜇𝑤 is
the wetting-phase viscosity, 𝜌𝑤 is the density of water, A is the cross-sectional, 𝑃𝑐 is the capillary
pressure, k is the permeability to water, and t is the time.
From Equation 4-1; the larger the product of capillary pressure and permeability, the more rapid
is spontaneous imbibition (Akin et al., 2000). This means that the rate of imbibition is proportional
to the square root of 𝑃𝑐𝑘𝑆𝑤 which is known as imbibition potential. The permeability of core
sample W-7 was determined to be 1.35mD which was the highest among the cores, followed by
W-6, W-4, W-5 and W-22 in descending order. This means that the imbibition potential of core
sample W-7 was the highest among the core samples and that further supports the increase in its
rate of imbibition and oil recovery within a short period of time compared to the other cores.
CHAPTER 5: CONCLUSIONS AND FUTURE WORK
This chapter of this project presents the conclusions drawn from this study and some
recommendations for future work are suggested.

72
5.1 CONCLUSIONS
5.1.1 Wettability of Wallace Sandstone Reservoir Rock
(1) From the Amott-Harvey Wettability Index, it was determined that the reservoir rock is
neutrally wet.
(2) Addition of Xanthan gum polymer (DPR) to brine solution renders the reservoir rock
more water-wet.
5.1.2 Effect of Disproportionate Permeability Reducers on Spontaneous Imbibition
(1) Xanthan gum as a DPR not only selectively reduce water permeability without
significantly affecting oil or gas permeability but also significantly increases the ultimate
oil recovery during spontaneous imbibition of polymer-brine solution into Wallace
sandstone reservoir rock by 18.29% compared to oil recovery by spontaneous imbibition
under brine only.
(2) The spontaneous imbibition rate is increased under DPR polymer in brine.
5.2 FUTURE WORK
Future works should be focused on the following topics:
The effects of DPR on spontaneous imbibition of water into oil-wet carbonate reservoir
rocks.
The effect of synthetic disproportionate permeability reducers (cationic acrylamide
polymers) on spontaneous imbibition of water into Wallace sandstone reservoir rocks.
73
BIBLIOGRAPHY
Abdallah, W., Buckley, J. S., Carnegie, A., Edwards, J., Herold, B., Fordham, E., et al. (2007).
Fundamentals of Wettability. Retrieved June 10, 2013, from Schlumberger Oilfield Review:
http://www.slb.com/~/media/Files/resources/oilfield_review/ors07/sum07/p44_61.ashx
Adamson, A. W. (1982). Physical Chemistry of Surfaces. New York: Wiley.
Amott, E. (1959). Observations Relating to the Wettability of Porous Rock. Petroleum Transactions,
AIME, 216, 156-62.
Anderson, W. G. (1986a). Wettability Literature Survey- Part 1: Rock/Oil/Brine Interactions and the
Effects of Core Handling on Wettability. Journal of Petroleum Technology, 38(10), 1125-1144.
Anderson, W. G. (1986b). Wettability Literature Survey- Part 2: Wettability Measurement. Journal of
Petroleum Technology, Volume 38, Number 11, 1246-1262.
Anderson, W. G. (1987). Wettability Literature Survey-Part 6: The Effects of Wettability on
Waterflooding. Journal of Petroleum Technology, 39(12), 1605-1622.
Bennion, D. B., Thomas, F. B., & Sheppard, D. A. (1992, February). Formation Damage Due to Mineral
Alteration and Wettability Changes During Hot Water and Steam Injection in Clay-Bearing
Sandstone Reservoirs. SPE Formation Damage Control Symposium, 165-174.
Bovwe, E. (2013). Petrophysical Characterization of the Effect of Disproportionate Permeability Reducers
on Fractional Flow of Water during Waterflooding. MEng Project, Dalhousie University.
unpublished work.

74
Brown, C. E., & Neustadter, E. L. (1980). The Wettability of Oil/Water/Silica Systems With Reference to
Oil Recovery. Journal of Canadian Petroleum Technology, 19(3), 100-110.
Brownscombe, E. R., & Dyes, A. B. (1952). Water-imbibition Displacement-A Possibility for the Spraberry.
Drilling and Production Practice, 383-390.
Buckley, J. S., Bousseau,, C., & Liu, Y. (1996). Wetting Alteration by Brine and Crude Oil: From Contact
Angles to Cores. SPE Journal, 1(3), 341-350.
Buckley, J. S., Liu, Y., & Monsterleet, S. (1998). Mechanisms of Wetting Alteration by Crude Oils. SPE
Journal, 3(1), 54-61.
Buckley, J. S., Takamura, K., & Morrow, N. R. (1989). Influence of Electrical Surface Charges on the
Wetting Properties of Crude Oils. SPE Reservoir Engineering, 4(3), 332-340.
Buckley, S. E., & Leverett, M. C. (1942). Mechanism of Fluid Displacement in Sands (Vol. 146). Trans.
AIME.
Carnali, J. O. (1991). A Dispersed Anisotropic Phase as the Origin of the Weak-Gel Properties of Aqueous
Xanthan Gum. Journal of Applied Polymer Science, 929-941.
Chauveteau, G., Tabary, R., Blin, N., Renard, M., Rousseau, D., & Faber, R. (2004). Disproportionate
Permeability Reduction by Soft Preformed Microgels. SPE/DOE Symposium on Improved Oil
Recovery (pp. 1-8). Tulsa: Society of Petroleum Engineers.
Chen, T., Zhao, Y., Peng, K., & Pu, W. (1996). A Relative Permeability Modifier for Water Control of Gas
Wells in a Low-Permeability Reservoir. SPE Reservoir Engineering, Volume 11, Number 3, 168-
173.
75
Chimienti, M. E., Illiano, S. N., & Najurieta, H. L. (1999). Influence of Temperature and Interfacial Tension
on Spontaneous Imbibition Process. Latin American and Caribbean Petroleum Engineering
Conference (pp. 1-7). Caracas: Society of Petroleum Engineers.
Cuiec, L. (1984, September). Rock/Crude-Oil Interactions and Wettability: An Attempt To Understand
Their Interrelation. SPE Annual Technical Conference and Exhibition, 1-10.
Cuiec, L. E., Bourbiaux, B., & Kalaydjian, F. (1990). Imbibition in low-permeability porous media:
understanding and improvement of oil recovery. SPE.
Desai, K. P., & Moore, E. J. (1969). Equivalent Nacl Determination From Ionic Concentrations. The Log
Analyst, X(3), 12-21.
Donaldson, E. C., Thomas, R. D., & Lorenz, P. B. (1969, March). Wettability Determination and Its Effect
on Recovery Efficiency. SPE Journal, Volume 9, Number 1, 13-20.
Dunlap, H. F., & Hawthorne, R. R. (1951). The Calculation of Water Restivities from Chemical Analyses
(Vol. 192). Trans. AIME.
Farouq Ali, S. M., & Thomas, S. (1996, July ). The Promise And Problems of Enhanced Oil Recovery
Methods. Journal of Canadian Petroleum Technology, Volume 35, Number 7, 1.
Farouq Ali, S. M., & Thomas, S. (1996, July). The Promise And Problems of Enhanced Oil Recovery
Methods. Journal of Canadian Petroleum Technology, 35(7), 57-63.
Glover, P. (2008). Chapter 10: Relative Permeability. [Lecture Notes]. Retrieved from:
http://www2.ggl.ulaval.ca/personnel/paglover/CD%20Contents/Formation%20Evaluation%20E
nglish/Chapter%2010.PDF.
76
Hamon, G., & Vidal, J. (1986). Scaling-Up the Capillary Imbibition Process From Laboratory Experiments
on Homogeneous and Heterogeneous Samples. European Petroleum Conference (pp. 1-12).
London: Society of Petroleum Engineers.
Handy, L. L. (1960). Determination of Effective Capillary Pressures for Porous Media from Imbibition
Data. Petroleum Transactions, AIME, 219, 75-80.
Honarpour, M., Koederitz, L., & Harvey, A. H. (1986). Relative Permeability of Petroleum Reservoirs.
Florida: CRC Press Inc.
Huang, W. L., Bishop, A. M., & Brown, R. W. (1986). The Effect of Fluid/Rock Ratio on Feldspar
Dissolution and Illite Formation Under Reservoir Conditions. Clay Minerals, 21, 585-601.
Johnson, E. F., Bossler, D. P., & Naumann, V. O. (1959). Calculation of Relative Permeability from
Displacement Experiments (Vol. 216). Trans. AIME.
Kazemi, H., Gilman, J. R., & Elsharkawy, A. M. (1992). Analytical and Numerical Solution of Oil Recovery
From Fractured Reservoirs With Empirical Transfer Functions. SPE Reservoir Engineering, 7(2),
219-227.
Kazemi, H., Merrill Jr., L. S., Porterfield, K. L., & Zeman, P. R. (1976, December). Numerical Simulation of
Water-Oil Flow in Naturally Fractured Reservoirs. SPE Journal, 16(6), 317-326.
Keijzer, P. M., & Vries, A. S. (1993, July). Imbibition of Surfactant Solutions. SPE Advanced Technology
Series, Volume 1, Number 2, 110-113.
Kowalewski, E., Holt, T., & Torsaeter, O. (2002). Wettability Alterations Due To An Oil Soluble Additive.
Journal of Petroleum Science and Engineering, 33(1-3), 19-28.

77
Leach, R. O., Wagner, O. R., Wood, H. W., & Harpke, C. F. (1962, February). A Laboratory and Field Study
of Wettability Adjustment in Water Flooding. Journal of Petroleum Technology, Volume 14,
Number 2, 206-12.
Lefebvre, D. E. (1978, June). Gravity and Capillarity Effects on Imbibition in Porous Media. SPE Journal,
Volume 18, Number 3, 195-206.
Leverett, M. C. (1941). Capillary Behavior in Porous Solids (Vol. 142). Trans. AIME.
Log Interpretation Charts, Schlumberger Technology Corporation, (1968) pp. 8-9.
Ma, S., Morrow, N. R., & Zhang, X. (1997, May). Generalized Scaling Of Spontaneous Imbibition Data For
Strongly Water-Wet Systems. J. Petroleum Science, 18, 165-178.
Ma, S., Zhang, X., & Morrow, N. R. (1995b). Influence of Fluid Viscosity On Mass Transfer Between Rock
Matrix And Fractures. Annual Technical Meeting (pp. 1-14). Calgary: Society of Petroleum
Engineers.
Ma, S., Zhang, X., & Morrow, N. R. (19995a). A Characteristic Length for Scaling of Mass Transfer
Between Rock Matrix and Fractures. Soc. Pet. Eng.
Marshall, T. J. (1958). A Relation Between Permeability and Size Distribution of Pores . Journal of Soil
Science, 1-8.
Mattax, C. C., & Kyte, J. R. (1962, June). Imbibition Oil Recovery from Fractured, Water-Drive Reservoir.
SPE Journal, Volume 2, Number 2, 177 - 184.

78
Moffitt, P. D. (1993, April ). Long-Term Production Results of Polymer Treatments on Producing Wells in
Western Kansas. Journal of Petroleum Technology, 45(4), 356-362.
Morrow, N. R. (1990). Wettability and Its Effect on Oil Recovery. Journal of Petroleum Technology, 1476-
1484.
Morrow, N. R., & Mason, G. (2001, August). Recovery of oil by spontaneous imbibition. Current Opinion
in Colloid & Interface Science, Volume 6( Issue 4), 321-337.
Morrow, N. R., & Xie, X. (2001). Oil Recovery By Spontaneous Imbibition From Weakly Water-wet Rocks.
Petrophysics, 42(4), 313-322.
Nashawi, I. S. (1991). Laboratory Investigation of the Effect of Brine Composition on Polymer Solution-
Part 2: Xanthan Gum. SPE Journal, 1-19.
Puntervold, T., 2008. Waterflooding of carbonate reservoirs, EOR by wetting alteration. PhD thesis,
University of Stavanger
Schechter, D. S., Zhou, D., & Orr Jr., F. M. (1994, September). Low IFT drainage and imbibition. Journal of
Petroleum Science and Engineering, 11(4), 283-300.
Schembre, J. M., Akin, S., Castanier, L. M., & Kovscek, A. R. (1998). Spontaneous Water Imbibition into
Diatomite. SPE Western Regional Meeting, 149-165.
Schneider, F. N., & Owens, W. W. (1982, February). Steady-State Measurements of Relative Permeability
for Polymer/Oil Systems. SPE Journal, 22(1), 79-86.
Shen, J. J., & Bae, J. H. (1987). An Automated Steady-State Relative Permeability Measurement System.
Unsolicited, 1-8.

79
Stalder, P. J. (1973). Influence of Crystallographic Habit and Aggregate Structure of Authigenic Clay
Mineral on Sandstone Permeability. Geologie en Mijnbouw, 5(214), 217-220.
Taber, J. J. (1983). Technical Screening Guides for the Enhanced Recovery of Oil. SPE Annual Technical
Conference and Exhibition (p. 2). San Francisco California: Society of Petroleum Engineers.
Tielong, C., Yong, Z., Kezong, P., & Wanfeng, P. (1996, August). A Relative Permeability Modifier for
Water Control of Gas Wells in a Low-Permeability Reservoir. SPE Reservoir Engineering, 11(3),
168-173.
Treiber, L. E., & Owens, W. W. (1972, December). A Laboratory Evaluation of the Wettability of Fifty Oil-
Producing Reservoirs. SPE Journal, Volume 12, Number 6, 531-40.
Ullah, Z. (2013). The Effect of Waste Cooking Oil on the Wettability of Wallace Sandstone. MEng Project,
Dalhousie University
Warren, J. E., & Root, P. J. (1963, September). The Behavior of Naturally Fractured Reservoirs. SPE
Journal, 3(3), 245 - 255.`
Warren, J. E., & Root, P. J. (1963). The Behavior of Naturally Fractured Reservoirs. SPE Journal, 3(3), 245-
255.
Welge, H. J. (1952). A Simplified Method for Computing Recovery by Gas or Water Drive (Vol. 195). Trans.
AIME.
Zaitoun, A., & Kohler, N. (1989). Modification of Water/Oil and Water/Gas Relative Permeabilities after
Polymer Treatment of Oil or Gas Wells. In Situ, 55-78.
80
Zaitoun, A., Kohler, N., & Coffin, P. (1990). Synergistic Effects in the Polymer Treatment of Producing
Wells. SPE Annual Technical Conference and Exhibition (pp. 685-695). New Orleans: Society of
Petroleum Engineers.
Zhang, X., Morrow, N. R., & Ma, S. (1996, November). Experimental Verification of a Modified Scaling
Group for Spontaneous Imbibition. SPE Reservoir Engineering, 11(4), 280-285.
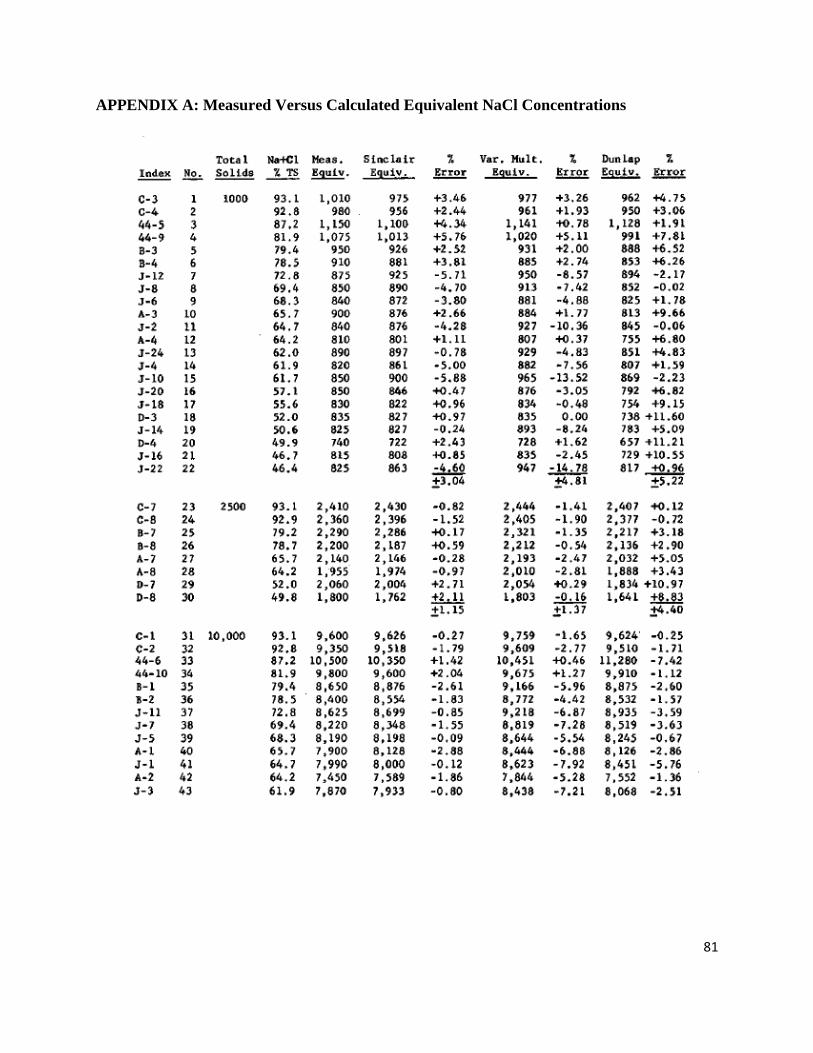
81
APPENDIX A: Measured Versus Calculated Equivalent NaCl Concentrations
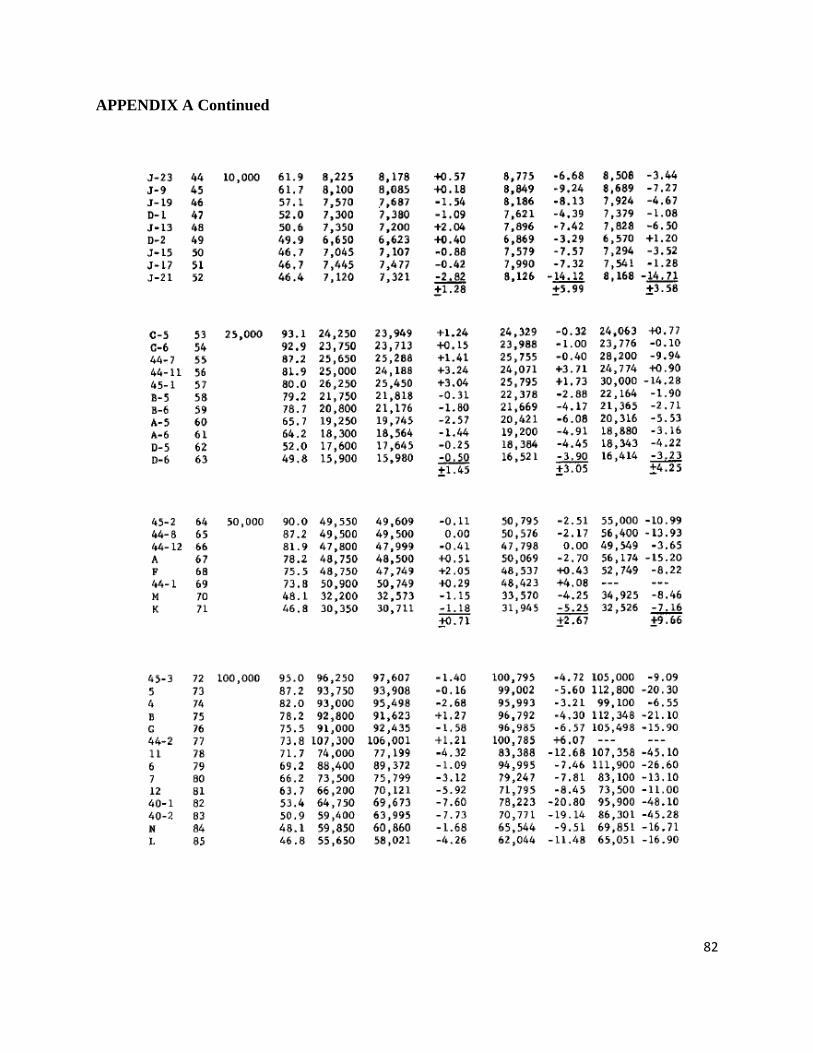
82
APPENDIX A Continued

83
APPENDIX A Continued

84
APPENDIX B: Wallace Quarries – Test Data.

85
APPENDIX C: Benchtop Relative Permeameter Detailed Part List (BRP-350)
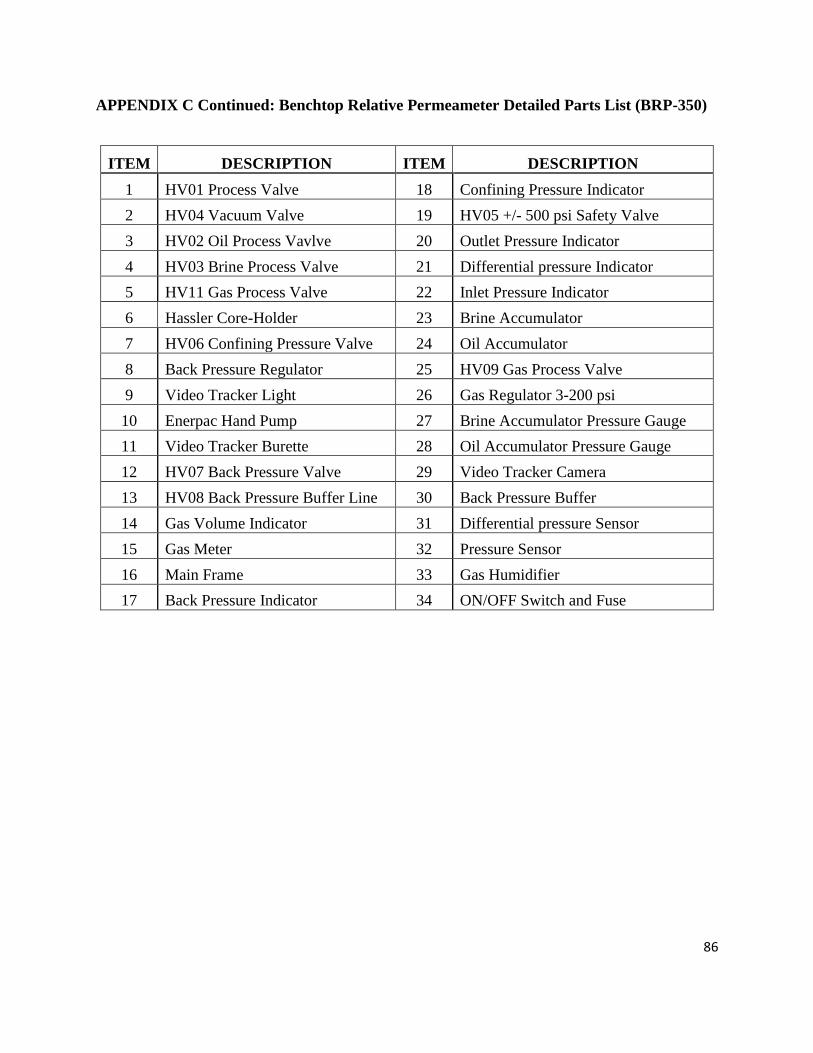
86
APPENDIX C Continued: Benchtop Relative Permeameter Detailed Parts List (BRP-350)
ITEM DESCRIPTION ITEM DESCRIPTION
1 HV01 Process Valve 18 Confining Pressure Indicator
2 HV04 Vacuum Valve 19 HV05 +/- 500 psi Safety Valve
3 HV02 Oil Process Vavlve 20 Outlet Pressure Indicator
4 HV03 Brine Process Valve 21 Differential pressure Indicator
5 HV11 Gas Process Valve 22 Inlet Pressure Indicator
6 Hassler Core-Holder 23 Brine Accumulator
7 HV06 Confining Pressure Valve 24 Oil Accumulator
8 Back Pressure Regulator 25 HV09 Gas Process Valve
9 Video Tracker Light 26 Gas Regulator 3-200 psi
10 Enerpac Hand Pump 27 Brine Accumulator Pressure Gauge
11 Video Tracker Burette 28 Oil Accumulator Pressure Gauge
12 HV07 Back Pressure Valve 29 Video Tracker Camera
13 HV08 Back Pressure Buffer Line 30 Back Pressure Buffer
14 Gas Volume Indicator 31 Differential pressure Sensor
15 Gas Meter 32 Pressure Sensor
16 Main Frame 33 Gas Humidifier
17 Back Pressure Indicator 34 ON/OFF Switch and Fuse

87
APPENDIX D: Benchtop Relative Permeameter Process Flow Diagram (BRP-350)

88
APPENDIX E: Spontanoeus imbibition test results
Table E- 1: Spontaneous imbibition test data of W-4 (76.28% irreducible water saturation)
Imbibition Time (min) Dimensionless time Oil Recovery (ml)
0 0 0
40 8 0.048
70 14 0.057
120 24 0.067
180 37 0.073
240 49 0.076
360 73 0.076
580 118 0.076
720 146 0.076
1440 293 0.076
2050 417 0.076
2760 561 0.076
3200 651 0.076
4920 1001 0.076

89
Table E- 2: Spontaneous imbibition test data of W-5 (38.23% irreducible water saturation)
Imbibition Time (min) Dimensionless time Oil Recovery (ml)
0 0 0
40 8 0.006
70 14 0.007
120 24 0.0085
180 36 0.01
240 49 0.01
360 73 0.01
580 117 0.01
720 146 0.01
1440 291 0.01
2050 415 0.01
2760 558 0.01
3200 647 0.01
4920 995 0.01
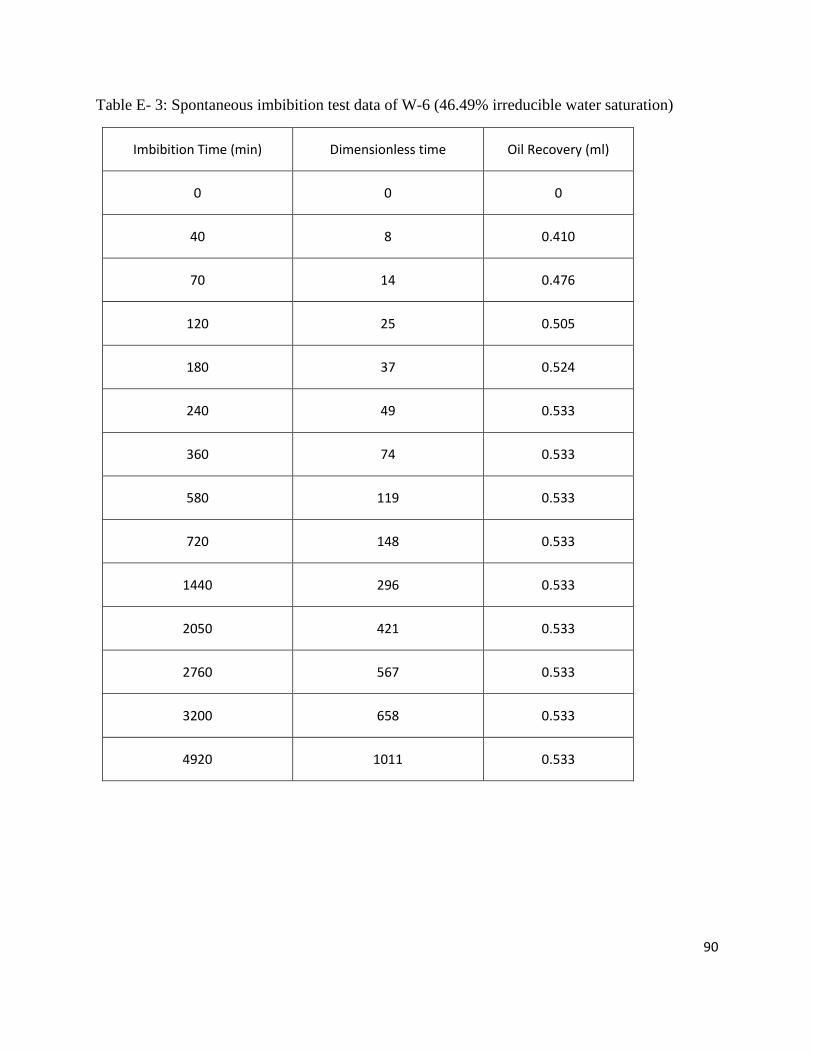
90
Table E- 3: Spontaneous imbibition test data of W-6 (46.49% irreducible water saturation)
Imbibition Time (min) Dimensionless time Oil Recovery (ml)
0 0 0
40 8 0.410
70 14 0.476
120 25 0.505
180 37 0.524
240 49 0.533
360 74 0.533
580 119 0.533
720 148 0.533
1440 296 0.533
2050 421 0.533
2760 567 0.533
3200 658 0.533
4920 1011 0.533
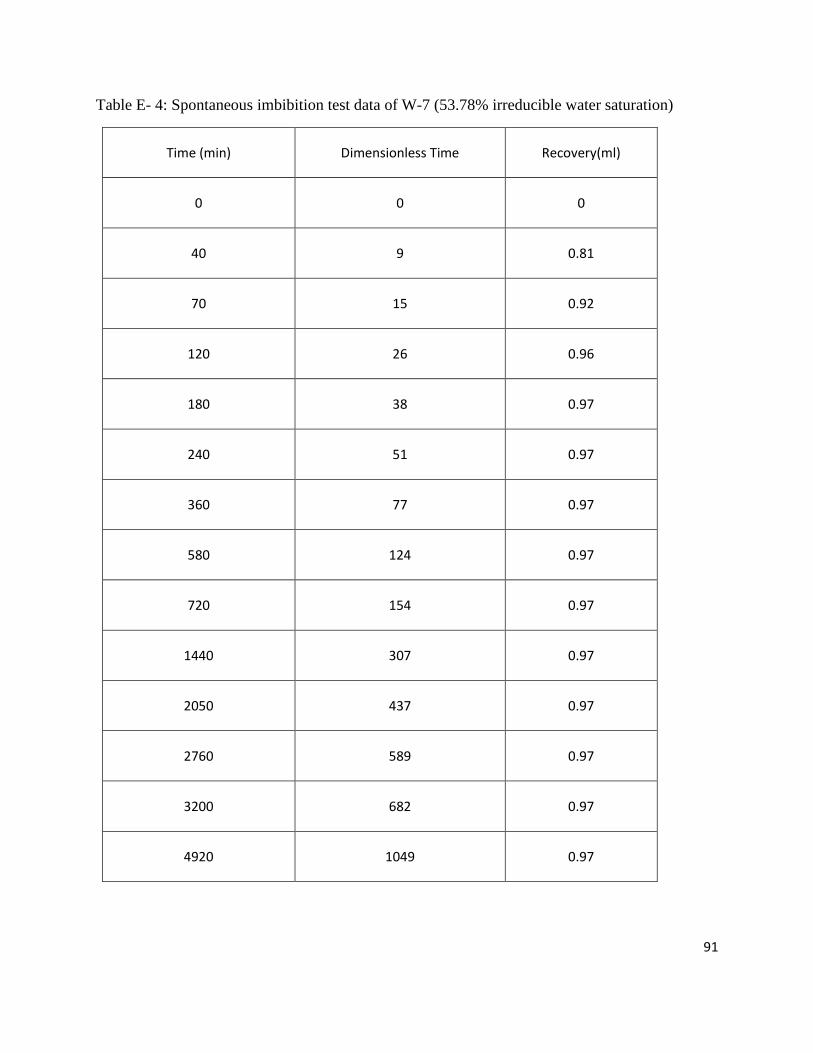
91
Table E- 4: Spontaneous imbibition test data of W-7 (53.78% irreducible water saturation)
Time (min) Dimensionless Time Recovery(ml)
0 0 0
40 9 0.81
70 15 0.92
120 26 0.96
180 38 0.97
240 51 0.97
360 77 0.97
580 124 0.97
720 154 0.97
1440 307 0.97
2050 437 0.97
2760 589 0.97
3200 682 0.97
4920 1049 0.97

92
Table E- 5: Spontaneous imbibition test data of W-22 (49.64% irreducible water saturation)
Imbibition Time (min) Dimensionless time Oil Recovery (ml)
0 0 0
40 5 0.629
70 9 0.705
120 16 0.75
180 23 0.79
240 31 0.819
360 47 0.819
580 76 0.819
720 94 0.819
1440 188 0.819
2050 267 0.819
2760 360 0.819
3200 417 0.819
4920 641 0.819
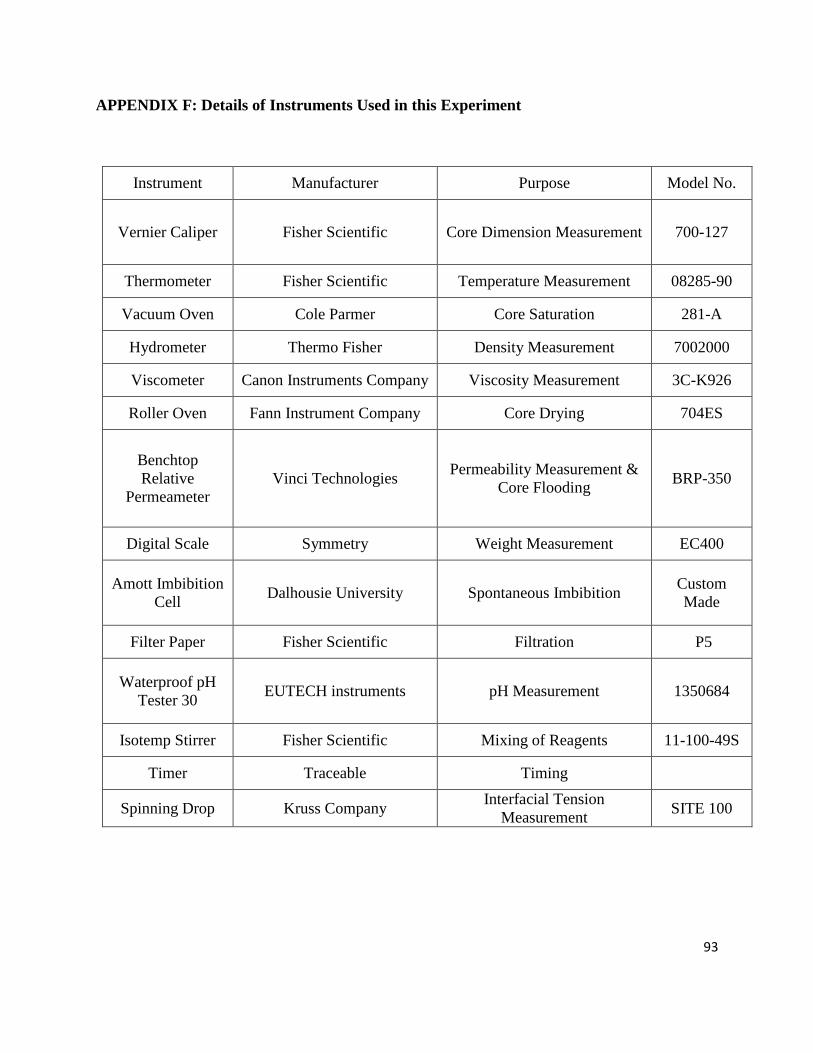
93
APPENDIX F: Details of Instruments Used in this Experiment
Instrument Manufacturer Purpose Model No.
Vernier Caliper Fisher Scientific Core Dimension Measurement 700-127
Thermometer Fisher Scientific Temperature Measurement 08285-90
Vacuum Oven Cole Parmer Core Saturation 281-A
Hydrometer Thermo Fisher Density Measurement 7002000
Viscometer Canon Instruments Company Viscosity Measurement 3C-K926
Roller Oven Fann Instrument Company Core Drying 704ES
Benchtop
Relative
Permeameter
Vinci Technologies Permeability Measurement &
Core Flooding BRP-350
Digital Scale Symmetry Weight Measurement EC400
Amott Imbibition
Cell Dalhousie University Spontaneous Imbibition
Custom
Made
Filter Paper Fisher Scientific Filtration P5
Waterproof pH
Tester 30 EUTECH instruments pH Measurement 1350684
Isotemp Stirrer Fisher Scientific Mixing of Reagents 11-100-49S
Timer Traceable Timing
Spinning Drop Kruss Company Interfacial Tension
Measurement SITE 100