The Effect of Direct Marketing on the - DY Patil Deemed to ...
340
i The Effect of Direct Marketing on the Consumers of Maharashtra (A consumer Survey of Metros in Maharashtra with reference to household products) Dissertation Submitted to the Padmashree Dr. D Y Patil University‘s Department of Business Management in partial fulfillment of requirements for the award of the Degree of DOCTOR OF PHILOSOPHY IN BUSINESS MANAGEMENT Submitted by: ZEENAT F M KHAN (Enrollment No. DYP-Ph.D-086100005) Research Guide Prof. Dr. Pradip Manjrekar DEAN PADMASHREE DR. D Y PATIL UNIVERSITY’S, DEPARTMENT BUSINESS MANAGEMENT, SECTOR, 4 PLOT NO. 10 CBD BELAPUR, NAVI MUMBAI-400 614 AUGUST 2012
Transcript of The Effect of Direct Marketing on the - DY Patil Deemed to ...

i
The Effect of Direct Marketing on the Consumers of Maharashtra
(A consumer Survey of Metros in Maharashtra with reference to household products)
Dissertation Submitted to the Padmashree Dr. D Y Patil University‘s Department of Business Management
in partial fulfillment of requirements for the award of the Degree of
DOCTOR OF PHILOSOPHY IN
BUSINESS MANAGEMENT
Submitted by: ZEENAT F M KHAN
(Enrollment No. DYP-Ph.D-086100005)
Research Guide
Prof. Dr. Pradip Manjrekar
DEAN PADMASHREE DR. D Y PATIL UNIVERSITY’S,
DEPARTMENT BUSINESS MANAGEMENT, SECTOR, 4 PLOT NO. 10
CBD BELAPUR, NAVI MUMBAI-400 614 AUGUST 2012

ii
The Effect of Direct Marketing on the
Consumers of Maharashtra
(A consumer Survey of Metros in Maharashtra with reference to
household products)

iii
DECLARATION
I hereby declare that the dissertation entitled ―The effect of Direct Marketing on
the consumers of Maharashtra (A Consumer Survey of metros in Maharashtra
with reference to household products)‖ submitted for the award of Doctor of
Degree of Philosophy in Business Management at the Padmashree Dr. D Y Patil
University Department of Business Management is my original work and the
dissertation has not formed the basis for the award for any degree, associate
ship, fellowship or any similar titles.
Place : Navi Mumbai
Date : August 2012
(Zeenat F M Khan)
Signature of the Candidate

iv
CERTIFICATE
This is to certify that this dissertation entitled ―The Effect of Direct Marketing on
the Consumers in Maharashtra (A Consumer Survey of metros in Maharashtra
with reference to household products)‖ is a bona fide research work carried out
by Mrs. Zeenat. F. M. khan, student of Doctorate in Philosophy (Business
Management), at Padmashree Dr.D.Y.Patil University‘s Department of Business
Management during the year 2008-2012 in partial fulfillment of the requirements
for the award of the Degree of Doctor of Philosophy in Business Management
and that the dissertation has not formed the basis for the award previously of any
degree, diploma, associate ship, fellowship or any other similar title of any
University or Institution.
Prof. Dr. Pradip Manjrekar Prof. Dr. R. Gopal
DEAN- Business Management Director & Head Of Department
Padmashree Dr. D. Y. Patil University Department of Business Mgmt.
Padmashree Dr. D. Y. Patil University
Place: Navi Mumbai

v
Acknowledgement
I am indebted to the Padmashree Dr. D. Y. Patil University Department of Business
Management, which has accepted me under the Ph.d program and provided me
with an excellent opportunity to carry out the present research.
Regardless of my efforts, the accomplishment of this dissertation is greatly
dependent upon the expert guidance, understanding and patience of the guide. I
am extremely indebted to my guide Dr. Pradip Manjrekar, Dean- Business
Management, Padmashree Dr. D. Y. Patil who deserves considerable credit for the
academic quality of this study. I am thankful to Dr. Pradip Manjrekar who has been
my primary advisor, guide and mentor; and has inspired and encouraged me to
write this dissertation.
My sincere thanks to Prof. Dr. R. Gopal, Director, and Head of the Department,
Padmashree Dr. D. Y. Patil University, Department of Business Management,
whose expert guidance and interest became an inspiration to me in completing this
difficult endeavor.
Most of all my gratitude is extended to my family, my husband, my son and
brother-in-law Mr. S. Prakash without whose support, I could not have undertaken
this endeavor.
Place: Navi Mumbai
Date: August 2012
(Mrs. Zeenat F. M. Khan)

vi
Signature of the Candidate
Contents
Chapter
TITLE
Page No.
List of Tables ix
List of Figures xi
Executive Summary 1
1 Introduction 6
1.1 Direct Marketing 7
1.2 Characteristics of Direct Marketing 10
1.3 Goals of Direct Marketing 13
1.4 Social & Technological Change 17
1.5 Direct Marketing & Traditional Marketing 29
1.5 Household Products of Direct Marketing 29
2 The Indian Consumer 33
2.1 Consumer Landscape 34
2.2 Maharashtra 37
2.3 Consumer & Consumer Behavior 39
2.4 Consumer as Family Member 41
2.5 Indian Women Consumer 44
3 Literature Review 45
3.1 History of Direct marketing 46
3.2 Direct Marketing: Advent in India 49

vii
3.3 Developments in Direct Marketing 49
3.4 Direct Marketing in United States & Japan 51
3.5 Major Channels in Direct Marketing 54
3.6 Direct Response Advertising 90
4 Objectives of research 95
4.1 Research Problem 96
4.2 Research Objectives 98
4.3 Statement of Hypothesis 99
4.4 Importance of Research 101
5 Research Methodology 102
5.1 Instrument Development & Measures 104
5.2 Pilot Test 107
5.3 Validity & Reliability 109
5.4 Sample Design 111
5.5 Sample Size 112
5.6 Schedule of Data Collection 114
5.7 Approach to Primary Data Collection 115
5.8 Analysis of Data 117
5.9 Limitations of the Study 118
6 Analysis of Data & Findings 120
6.1 Description of Sample 121
6.2 Variables of Direct Marketing 134
6.3 Testing of Hypothesis 144

viii
6.4 Study of Correlation 189
6.5 Regression Analysis 191
6.6 Findings 206
7 Conclusions 212
8 Recommendations 216
9 Bibliography 219
Annexure 230

ix
List of Tables
Table No. Name of the Table Page No.
3.1 E- Commerce Timeline 85
3.2 Function of Mytrip.com 89
5.1 Factors of Direct Marketing 105
5.2 Sample size 111
5.3 Respondents in metros 115
6.1 Sample Description 122
6.3 Education 123
6.5 Age group 125
6.7 Sex 126
6.9 Employment status 127
6.11 Monthly Income 128
6.13 No. of members in family 130
6.15 Children in family 131
6.17 Frequency distribution of Customer building relationship and Loyalty
136
6.18 Frequency distribution of convenient method 137
6.19 Frequency distribution of time saving 138
6.20 Frequency distribution of high credibility 139
6.21 Frequency distribution of Intrudes on Privacy 140
6.22 Frequency distribution of Customer Care Service
140
6.23 Frequency distribution of after sales service 141
6.24 Frequency distribution of Quality and utility of service
142
6.25 Frequency distribution of consumer satisfaction 143
6.26 Frequency distribution of exposure to new products
143
6.27 Level of responses for Hypothesis 1 145
6.29 Level of direct marketing for Hypothesis 1 146
6.31 Chi square test for H1 147
6.33 Frequency distribution for Hypothesis 2 149
6.35 Chi square test for Hypothesis 2 151
6.37 Frequency test for Time saving method 153
6.39 Chi square test for time saving method 154
6.41 Level of scores for high credibility 156
6.43 Chi square test for high credibility 157
6.45 Level of scores for intrude upon privacy 159
6.47 Chi square for intrudes upon privacy 161
6.49 Level of scores for customer care 163

x
6.51 Chi square for customer care 164
6.53 Level of scores for after sales service 166
6.55 Chi square test for after sales service 167
6.57 Level of scores for quality and utility of Products
169
6.59 Chi square of quality and utility of products 171
6.61 Level of scores for consumer satisfaction 173
6.63 Chi square for customer satisfaction 174
6.65 Chi square of impact of demographic factors 176
6.66 Chi square of qualification 177
6.67 Chi square of age 179
6.68 Chi square of sex and parameters of direct marketing
181
6.69 Chi square of members of family 182
6.70 Chi square of children and parameters of direct marketing
184
6.71 Chi square of children in family 186
6.72 Chi square of income and parameter of direct marketing
187
6.73 Table of Pearson‘s Correlations 189
6.74 Table of coefficients (H1) 192
6.75 Table of coefficient (H2) 192
6.76 Table of coefficients (H3) 193
6.77 Table of coefficients (H4) 193
6.78 Table of coefficients (H5) 194
6.79 Table of coefficients (H6) 194
6.80 Table of coefficients (H7) 195
6.81 Table of coefficients (H8) 195
6.82 Table of coefficients (H9) 196
6.83 Table of coefficients (H10) 196
6.84 Number of respondents 197
6.86 Qualifications of respondents 198
6.88 Respondents according to age 199
6.90 Sex of respondents 200
6.92 Number of members in family 201
6.94 Children in family 202
6.96 Employment status 204
6.98 Monthly income 205
6.99 Ranking of direct marketing methods by consumers
205
6.100 Awareness of direct marketing methods 206
6.101 Proving the Hypothesis 209

xi
List of Figures
No. Figures Page
1.1 Direct Marketing 10
2.1 Indian Consumer Landscape 34
2.2 Household Asset Ownership 35
3.1 Career Path of Consultant 62
3.2 Users & Usage 86
3.3 On-Line Advertising 87
6.2 Pie chart of Sample description 122
6.4 Pie chart of education 124
6.6 Age Group 125
6.8 Pie Chart of Sex 126
6.10 Pie chart of employment status 128
6.12 Pie chart of monthly income 129
6.14 Pie chart of members in family 131
6.16 Pie chart of no. of children 132
6.28 Pie chart of building relations/loyalty 146
6.30 Pie chart of Hypothesis1 147
6.32 Bar diagram for Hypothesis1 148
6.34 Pie chart of level of convenience(H2) 150
6.36 Bar diagram for Hypothesis 3 151
6.38 Pie chart for time saving method 153
6.40 Bar diagram for time saving method 155
6.42 Pie chart for high creditability 157
6.44 Respondents according to level of credibility
158
6.46 Pie chart for intrude upon privacy 160
6.48 Bar diagram for intrudes upon privacy 161
6.50 Pie chart for customer care 163
6.52 Bar diagram for customer care 164

xii
6.54 Pie chart for after sales service 166
6.56 Degree of respondents according to after sales
168
6.58 Pie chart for quality and utility of products 170
6.60 Bar diagram for quality and utility of products
171
6.62 Pie chart for consumer satisfaction 173
6.64 Bar diagram for customer satisfaction 175
6.85 Pie chart of respondents 198
6.87 Pie chart of qualifications 199
6.89 Pie chart of age 200
6.91 Pie chart of sex 201
6.93 Pie chart of members in family 202
6.95 Pie chart of children in family 203
6.97 Pie chart of employment status 204

1
EXECUTIVE SUMMARY
Direct marketing has been one of the most significant developments in marketing
in recent years. The United Kingdom has demonstrated one of the fastest direct
marketing growth rates in Europe; the various statistical sources, the list industry
and the wealth of the direct marketing agencies all point to a dynamic and fast-
evolving industry. Direct mail and telemarketing are by far the most significant
types of media used by direct marketers to achieve this growth.
Many marketers believe that direct marketing is poised for a rapid growth in the
next decade due to a variety of factors, such as technological improvements in
database creations and analysis of the data inputs, in creating psychological
profile of consumers to establish future contacts. The preparation of near exact
psychological profiles of characteristics consumer, is important, to target specific
consumer groups with a product of service.
There is a growing disenchantment with traditional marketing, in particular with
traditional mass media, e.g Television. Though television has penetrated into
two-thirds of homes, and is found in 80% homes of elite & middle classes, it has
become multi-channel and more private.
The cost of advertising on television has increased manifolds, and the effect of
projected adverts is difficult to measure, with the result that it is not possible to
target accurately. The rise in costs particularly in advertising, have made it

2
necessary for marketers to evaluate their efforts on promotions of their products.
Apart from other changes in consumer behavior, Indian consumers are
witnessing changes in the economic environment as well. There is a rapid
increase in the usage of credit cards, and the time is not far away, when the
Indians will became a cashless society. Such a society will demand greater
individualism and privacy from the market, giving rise to alternate methods of
marketing namely direct marketing.
On the other hand, it could be argued that consumers are over-target, and feel
saturated by the over whelming marketing messages that are thrown at them.
They increasing find themselves exposed to unknown sources, drawing out
details of their earning, opinions on products and their personals life-styles. The
prospects of litigation is becoming very real for those organization that do not
manage consumer data. In some countries, governments are concerned about
the inclusion of marketers into the lives of people and are considering action i.e.
legislation .The advent of direct marketing in India in the early 90s was through a
few companies who marketed through the direct approach of multi-level
marketing. In this direct marketing strategy the company sells directly to
customers, who contact other customers (usually relatives & friends) and sales of
products occur through building a network of consumers. Consumers are
rewarded by the company through ―commissions‖ and discounts on market retail
price of products.

3
Because this strategy was new in the Indian marketing environment, it was
initially well received. Cosmetic Swedish giant Oriflame, was able to gain foothold
followed by others. Though two decades have passed, direct-marketing is yet to
make a big dent in the Indian market. On the other hand, organized retail is
taking leaps and bounds in the Indian market. Modern retail formats, malls have
mushroomed in the metros and big cities of many states in India. Millions of sq-
feet of space is being assigned to new formats of retailing. Millions of people are
employed, and millions are spent on promotion.
Direct marketing does not use traditional promotion methods as traditional
marketing. The mass media promotion is absent. Hence, the benefit of saving
through mass media, is transferred to the consumer through discounts on retail
price of products. As the name suggests, direct marketing, is reaching
consumers directly and not through retail chains. Therefore the products of direct
marketing companies are not available in retail outlets. There are many other
benefits provided through this strategy to the consumers.
There are many methods under direct marketing to reach consumers. The most
primitive among them is direct mail. It has been in existence for many decades. It
is a promotional method which promotes a product through a mail (Personal
Letter). The other methods are telemarketing, response advertisements, and
direct selling i.e. multi-level marketing.

4
The latest method of direct marketing is through the Internet. The proliferation of
the Internet into personal sites e-g, social media will allow direct marketers to
speed interactions with consumers, and promote the products.
At the same time there is a growing disenchantment with direct marketing. A few
methods of direct marketing are under the thick lens of consumers, as they seem
to attack ―the privacy of consumers‖.
Telemarketing was under attack, for making calls at irregular times and without
consumer permission. Consumers are also irked with the unsolicited mail they
receives Database marketing similarly is earning negative ire of consumers who
do not want to partake with their personal information.
Against this back drop, the study was undertaken to determine the general
attitudes of consumers towards direct marketing. The methods of direct
marketing have not yet reached the depths of the Indian market. Their presence
is in the metros, and in the last five years have penetrated in the Metros (Tier I
cities), Big cities (Tier II) of a few Indian states. Hence a survey to determine
general attitudes of consumers was designed. Through the methods of multi-
variate analysis (factor analysis), an effort was made to determine the attitude of
consumers. The broad findings of the survey indicated that Indian consumers
had a positive attitude towards direct marketing. There is a general consensus
among consumers of the three metros in Maharashtra namely Mumbai, Pune

5
and Nagpur, that consumers found direct marketing a convenient method for
purchasing products. The study through the statistical analysis concludes that
consumers find distributors of the direct marketing companies, interested and
eager to satisfy their wants for products. They are patient in explaining the
products as also answer their quarries about the product. The issues of privacy
concerns in direct marketing have of late been a topic of discussion in the
advanced countries of UK, USA & Japan where direct marketing is an
established mode of selling products. In consolation, Indian consumers
(respondents of the survey) are not offended by direct marketing interfering in
their personal lives, but marketers must work to avoid intrusion into the lives of
consumers without their consent.
Among the direct marketing methods, direct selling has maximum awareness in
the market, followed by telephone and the Mail, and Internet had least
awareness. This revelation is not surprising because direct selling through multi-
level marketing is an established mode of marketing as it gains strong foothold in
tier I & II towns and within time in rural markets as well. Though the internet had
less awareness its growth in the past year suggests it is ―New Age Media‖.

6
Introduction

7
CHAPTER 1
INTRODUCTION
1.1 Direct Marketing:
Direct marketing is a channel of Marketing, of advertising communication and
distribution serving the needs of a wide spectrum of business and non-profit
organizations. Direct marketing is increasing in importance in the field of
marketing and according to (Chaturvedi-1999) it is of strategic importance in
reaching today‘s consumer. It makes a significant contribution to our economy,
as virtually all big businesses; respond to societal change in which the marketer
contacts consumers through a medium and growing sophistication of technology.
Direct Marketing lowers marketing costs e.g. direct response (a method of direct
marketing) in which the manufacturer makes direct sales contacts with
consumers, provides consumers with enough information about products and
services to make a buying decision. Other methods of direct marketing e.g.,
direct mail, print advertising, catalogues, the telephone, the personal computer,
cable television, and other media, are used to transfer product information and
knowledge to consumers. According to (Mary Lou Roberts, Paul Berger 2000)
direct marketing communication is targeted to specific individuals not to
segmented mass markets by way of mass media.
Direct Marketing is the use or access or resort to the direct channels to reach
customers and deliver goods and/or services to customers without using

8
marketing middlemen, intermediaries or agents or brokers. The channels of
Direct Marketing include face-to-face selling, direct mail, catalogues,
telemarketing, response advertising, direct selling methods like, multi-level
marketing, company‘s salesmen/agents, interactive Kiosks, web sites, mobile
devices, a host of devices. According to (Mary Lou, Paul Berger 2000), the
strategies of direct marketing have a distinct level of personalization, meaning
the communication is directed to an individual rather than to a mass of
customers. Therefore, the strategies of direct marketing are less visible to
competitors than are strategies that must be implemented in mass media. The
many definitions of direct marketing also convey the same.
Direct marketing uses a variety of media, including mail, magazine ads,
newspaper ads, television and radio spots, infomercials (also television but
longer format), free-standing inserts (FSIs), and card decks. This flexibility allows
direct marketing to provide interactivity and measurability and still be able to take
advantage of new technologies. By being able to utilize virtually any media, direct
marketing will lead marketers into the 21st century as interactive television, the
information highway, and other new technologies become a reality.
Definitions of Direct Marketing
1. Any advertising activity which creates and exploits a direct relationship
between the business and their prospect/s or customer/s as an
individual. (Drayton Bird – 1990)
9
2. Direct market is the umbrella for al forms of media that operate in the
market place: ( i) to get a lead (ii) to build traffic (iii) to raise funds (iv)
to sell a product or service. (Jutkins –1996).
3. Direct Marketing is any type of marketing that seeks some sort of reply
from the reader, typically by phone, mail, E-mail, fax etal Direct
Marketing print materials usually have response coupons or reply
cards, the reader can use to request more information or order the
product – TV & radio commercials typically use toll-free numbers.
(Robert Bly – 1998).
4. Direct Marketing is simply a marketing operation where the sale is
made direct to the consumer, without resort to normal retail outlets,
and includes employing door-to-door selling and traditional mail-order
and off the page (response ad) (Bill Living stone 1998 )
5. Direct marketing is promotion via a direct mail, e-mail or telemarketing
initiative, guaranteeing to identifiable individuals in a chosen target
audience in return for the price of postage, computer time or telephone
calls pub the cost of producing the mail shot, email message, or
telesales operator‘s script. (Paul & others, 2003)

10
Fig. 1.1 Direct Marketing, www.direct marketing.com
The strategy of Direct Marketing, is relatively new in the Indian Marketing
Environment, but its methods like face-to-face selling and mail order response
are in existence for many years and has passed through a number of stages e.g.
i.e. (1) Mass Mailing, (2) Data base Marketing: -Direct Marketers mine the data
base to identify the prospects who would have the most interest in an offer and
are potential customers that is to say a high probability of materializing into an
actual sale.
1.2 Characteristics of Direct Marketing
The essential character of direct marketing lies in its action orientation. General
advertising may inform, persuade, or remind prospects about products about

11
products or services, but does not sell. To sell, or to invite a step towards a sale,
direct marketers include a call to immediate action and an easy-to Use response
device. Direct marketers make specific offers: they tell prospects what they‘re
going to get and what they have to do to get it be it a product in exchange for a
price, free information exchange for a phone call, or some other quid pro quo. In
addition to action orientation, direct marketing has several other important
characteristics.
1. Direct Marketing Is Targeted
Successful direct marketers develop products and services that will appeal to
specific groups of consumers groups that are measurable, and sizable enough to
ensure meaningful sales volume. Direct marketers‘ ability to tailor a list of
prospect names combining several characteristics for instance, Proven mail-
order buyers who own home exercise equipment and take at least two ski
vacations a year allows them to carve out new market segment with profit
potential.
2. Direct Marketing Is Personal
Because direct marketers can record so much about their customers‘ and
prospects buying habits and preferences as well as lifestyle information, they are
able to address these people in very specific terms—as tennis enthusiasts, old—
movie buffs, or whatever. What‘s more, today‘s database and printing

12
applications make possible a broad range of personalization techniques as well
as one-to-one customized messages and offers.
3. Direct Marketing Is Measurable
Each direct marketing message carries a call to action, the advertiser is able to
measure the effectiveness of mailings, calls and ads by tracking the sales, leads,
or other responses received. This makes direct Marketers accountable for every
dollar that is spent.
4. Direct Marketing Is Testable
Direct marketers can generate firm numbers that measure the effectiveness of
their efforts, it is possible for them to devise accurate Head-to-head tests of
offers, formats, price, payment terms, creative approach, and much more—all in
relatively small and affordable quantities.
5. Direct Marketing Is Flexible
Direct marketing‘s flexibility is especially apparent in direct mail, where few
constraints limit size, color, and format. Other than conformance to Postal
standards, a direct mail marketer can sell with formats ranging from a postcard to
a 9‖ X 12‖ envelope to a three-dimensional Package. The mailing date is set by
the marketer not by a publication.

13
1.3 Goals of direct marketing
Direct marketing finds application in a wide range of business solutions. It is
useful in meeting marketing objectives, and a good strategy for;
(a) Customer Database
Every organization today wants to come close to their consumers to enable them
to serve consumer needs and wants efficiently and hence the organizations want
to become ―Consumer Centric‖ (focusing marketing programs around consumers
by making them active partners in business) rather than being ―Product Centric‖
(focusing on company‘s products and internal resources). Hence organizations
are engaging themselves in building customer databases i.e., the collection of
names and purchase histories as well as other related information pertinent to
the transaction and which is basic to a technological age . Consumer databases
are also referred to as ‗Lists‘ or mailing lists.
The important usage of mailing lists is to mail promotional information on
products and services to the consumer. A list or database consists of names and
addresses of consumers under a similar demographic criteria e.g., age, income,
address (geographical location) education, service/ profession of social class
(classes A, B,C). Lists are information of a target group of customers and hence
become a segment for a particular promotion program. (Chaturvedi 1999), refers
to list as ―Creation of Markets‖. Direct marketing is a business of mathematic
numbers not names (Chaturvedi 1999). Mailing Lists (Lists of names to whom

14
information on product is mailed) form the bulk of lists generated by
organizations. They are also made by public sources or syndicated services who
then sell them to prospect organizational buyers for their reference. Each list
made available to the organization (either firm or advertiser or direct marketer)
typically contains thousands of names and addresses of individuals, but no
further information of any individual; and mailing list transaction prohibits the list
user, by a legal contract to copy or make a record of the names contained in it.
Hence, the mailer only uses the list to mail the promotion material and the mailer
and consumer to whom the mail is sent remain anonymous. Earlier the lists were
manually maintained and updated, but with technology advancement and falling
costs of computation, lists are maintained through computer, and it has become
easier to merge/purge (add, combine and delete) lists for tailor made
applications. Hence, direct marketers analyze data to arrive at just the level of
personal attention on a massive and necessarily anonymous basis, using
modern technology.
(b) Lead Generation
Definition: ―The finding and qualifying of new prospects‖*.Another goal of direct
marketing is to find new prospects, to convert into consumers. Many direct
marketers use telephone, mailers, response advertising to reach to consumers
before competition arrives. For premium products it becomes a successful
strategy to create awareness within consumers. Brand awareness is
established, and consumers remember the first brand to strike the market.

15
(c) Spirit of Entrepreneurship
A manufacturer of goods has always a problem to find consumer to buy his
product. The traditional method of marketing involves moving the goods through
established channels of distributions which move goods at a price, almost taking
25-30% of the market retail price of the product. Alternatively, going direct to
consumers involves lower costs to manufactures as well as consumers, the seller
gets directly in touch with consumers and the exchange process takes place.
Hence direct marketing cannot be done singly; rather it is a team work
comprising of creative people namely copywriters, act directors, catalog
managers, researchers, list managers etc; and also a creative approach idea, to
lead the team. An entrepreneurial spirit (i.e. person who undertakes commercial
venture) makes up a direct marketing venture, every member of the team,
creatively selects consumers, designs promotion communication, products,
leading to a successful direct marketing venture.
According to (Robert Bly 1998), some of the forces contributing to effect of
direct marketing are:
1) Consumer‘s need to save time;
2) The erosion of in the shopping experience
3) Lack of qualified sales help in stores to provide information,
4) Development of telephone, computer and telecommunication‘s
5) Consumer‘s desire to eliminate the middleman‘s profit as a means of
reducing prices.

16
(d) Building Relationship
The main pillar of direct marketing is that it builds relation with customers.
Relationship management is becoming more important, since the emphasis in
marketing is moving from a transaction focus to a relationship focus (Kotler
2004). A customer, who contributes a relatively large share to the return of the
organization within a certain period, is a good customer (Hoektra 1993). It means
that the customer has good perceptions of the company and wants to keep a
long term association with the company. Such consumers both drive the
company‘s economics and gauge customer loyalty.
A relationship consist of a behavioral and a mental dimension ( Reinartz & Kumar
(2003) the behavioral part indicates length of the relationship, recency,
frequency, monetary value and regularity; from the mental view point a variable
like satisfaction, attractiveness, perceived switching costs, trust, involvement of
long-term expectations are indicators for relationship strength.
The term ―relationship marketing‖ was introduced by (Berry, Linoff 2004) it is
simply an orient ship between the company and its customers aimed at delivering
extra value and generating multiple transactions. Under a relationship program
the company must be able to keep its promises with customer, and work to avoid
negative word-of-mouth (Arnett, Hunt 2003) so that a long term sustaining
relationship is established..

17
1.4 The Growth Of Direct Marketing Social And Technological Change (with
reference to its origin in the United States)
The 1960s was a decade of profound social change in the United States, as well
as a time of many technological advances that spurred the growth of direct
marketing. It was during this period that most of the forces that drive the direct
marketing boom first emerged.
Advances In Computer Technology
Recording and manipulating a database became feasible when fast and
affordable computers penetrated the American business market. The new
technology also has allowed for useful innovations in printing & production such
as laser and ink-jet personalization techniques and computerized graphic design
and production.
The Internet originally a tool for the military and universities, found a booming
business and consumer market in the 1990s fueled by user friendly navigation
software, powerful search engines, and high –quality graphics on the World Wide
Web. On-line services, which had served a small, cult like audience for years,
caught fire the 1990s as well, with millions of American homes served by
America on line, CompuServe, Prodigy, and their competitors.

18
Targeted Media Opportunities
Just as the Sears general catalog has given way to myriad smaller and more
specialized catalogs from Sears Shop-at Home, the old mass magazines such as
Life and Look have been supplanted by periodicals that define their audiences:
Working Mother, New Age, and Tennis, just to name a few among hundreds of
targeted titles. And the three old-line television networks, with their ―all-things-to-
all-people‖ programming, lose ground year by year to more targeted networks
such as Fox, WB, and UPN, and to specialized outlets such a CNN Headline
News, ESPN (all sports), Univision (Spanish), and home shopping channels. At
the same time, marketers have learned to use radio stations geared toward
news, talk, classical music, and other defined audiences for direct response
offers.
Growth of Consumer Credit
American Express, Master Card, Visa, Discover, and other widely distributed
credit cards offer consumers the opportunity to make impulse buying decision, a
boon for direct marketers.
Consumer credit works hand in hand with telemarketing to streamline the buying
process: customers can use a toll-free telephone number, provide their card
numbers, and order products from the comfort of home. Credit card also
increases the opportunity for trust on both sides of the buying transaction. The
marketer is protected against much of the risk of bad credit, and the buyer can

19
call on the credit-card firm to help if there is a customer service problem. As
consumers grow to trust the privacy safeguard now in place on the World Wide
Web and on-line service, more direct purchases will be made there by credit as
well.
Decline in Personal Service
Americans believe that they got better service from retailers in the ―good old
days.‖ They remember when career salespeople who knew their merchandise
well would provide individual service, calling customers by name and showing
the deference and respect. Contrast this with today‘s transient retail salesclerk,
often paid a minimum wage and no commission. Add the time- wasting prospect
of standing in line only to find that the desired item is out of stock, and it is no
wonder that consumers are ripe for the convenience of shopping at home. Vast
improvements in direct marketers in bound telemarketing systems, customer-
service capabilities, and inventory and shipping control have made shopping
from home a viable alternative even for those who need merchandise delivered
quickly.
Changing Life Styles
The classic American family, with Dad employed outside the home and Mom
staying at home with two or more children, now accounts for only a tiny fraction
of Americans family units. There are more single-parents families and dual-
20
career families than ever before. In fact, women now account for more than half
of the workforce.
With these changes has come an important alteration in family buying patterns.
Today‘s working often has more money than time to invest shopping thus; she
prefers to complete her buying transactions as quickly and painlessly as
possible. Direct marketers offer ways to do this: catalogs shopping. TV home
shopping, or Internet shopping at any hour of the day or night: toll-free, 24-hour
phone lines for ordering: home or office delivery, including affordable overnight or
two day delivery: liberal guarantees: free-trail privileges; and much more
shopping at home also allows customers to remain safe and anonymous in their
own ―Comfort Zones: attributes that are growing in importance to many busy
consumers and senior citizen today. Home shoppers need not get dressed up,
carry mace spray units on their key chains, or walk through deserted parking lots
garages with their purchases in hand.
In addition, the higher incomes of many dual-career families allow them to
indulge in hobbies and leisure activities. Special interest groups such as white-
water rafters, figurine collectors, and movie buffs allow direct marketers a fertile
field for development of targeted product lines.

21
A Diverse and Affluent Market Place
In the United States today, in terms of percentage the fastest-growing population
group is that of Asian Americans, followed by Hispanics and African Americans.
Sometime early in the 21st century, experts project that whites will become a
minority in the United States in the other words, people of colour will make a 51%
or more of the American population.
While well-heeled consumers who represent visible minority groups may often be
forced to purchase products that are promoted using only white faces, music,
speech pattern and culture their preference are clear: they appreciate being
targeted much more directly with media choices broadening, direct marketers
can reach specific racial and ethnic groups in magazines and newspapers, and
on cable networks such as BlacK Entertainment Television (BET) and Univision.
Restaurant chains including McDonalds and KFC (Kentucky Fried Chicken) have
reaped considerable financial rewards by tailoring messages and even store
décor and menus to the racial and ethnic groups, who live and work near specific
stores. Automobile companies, cigarette marketers, and sporting goods firms
are among many others that have become much more sensitive to the profit
potential of better targeting .While some direct marketers who are personally
―steeped in the dominant culture‖ may initially dismiss such market segmentation
as mere political correctness, improvement on the bottom line is the most
dramatic business reason for target marketing based on race or ethnicity.
Indeed, many direct marketers who do not appreciate and reflect the diversity of

22
their potential customer may be missing business unknowingly. Note the
sentiments expressed in this quote from Dr. Linda Hollies, an African American
professional woman:
They didn‘t get my money! I ‗m one of those catalog shoppers who love to flip
through the pages, ooh and ah, pick up the phone, dial the 800 number and
charge it! It‘s so easy, no fuss and if it‘s not what I like, the company can take it
back.
Dr. Hollies goes on to explain that she received a catalog with wonderful
merchandise and attractive prices, and she was all ready to order, but then
stopped short. She continues. : … as I flipped the pages and looked at the
numerous items, what was conspicuously absent were people who looked like
me. The smiling faces were all Anglo. The happy children were all Anglo. Nobody
brown, yellow or black looked at me from those pages that were so slickly
advertising articles I could easily have charged. But, they didn‘t get my money!
In recent years, the ability to target individuals by surname has increased
marketer‘s opportunities to address Asians and Hispanics by mail. Since African
American surname are much less discernible, some marketers have attempted
creative methods of identification, such as compiling lists from directories of
predominately African American churches.

23
Segmentation opportunities abound within general ethnic and racial groups as
well as evidenced by the success of Allstate Insurance in targeting various
specific segments of the Hispanic/Latino market. Allstate‘s ads in Spanish
feature voice-over announcers with Cuban accents in Miami, Mexican accents in
southern California, and Puerto Rican accents in New York City, for example.
Direct marketers who recognize the profit potential of sensitively targeting
specific racial and ethnic group will enjoy fertile new fields especially in a time
when many firms are complaining of difficulties in finding untapped markets.
Challenges For The Direct Marketing Community
While direct marketers enjoy many positive indicators for sustained growth and
success, it is essential to recognize and deal with several threats to the industry.
These concerns include privacy, the environment, and issues regarding the
government and U.S. Postal Service.
Privacy Issues
Responsible direct marketers see their customer knowledge as a positive way to
customize offers and serve individuals better. However, some customers and
activists are concerned about what types of lists may be rented, sold, or even
obtained on the internet-including government-recorded data such as vehicle
registration and driver‘s license records. What more, some buyers are unwilling
to let their names be rented to other marketers.

24
Direct marketers are dealing with these concerns in a number of positive ways.
First, the Direct Marketing Association and many regional direct marketing
groups requires their members to adhere to specific codes of conduct. Second,
the DMA‘s Mail preference Service and Telephone Preference Service allow
consumers to opt out of direct marketing offers – DMA shares these names with
direct marketers, who eliminate them from their rental lists. Third, responsible
direct marketers ensure that they use database information in ways that are
perceived as non intrusive and positively by their customers and prospect.
Another privacy issue has to do with telemarketing. Consumers complain about
poorly targeted telemarketing calls that they receive at inopportune times. In
addition, unsolicited faxes and E-mail often are considered annoying by both
consumers and business people. Self-regulation on the part of direct marketers
can take care of many of these complaints, as can adherence to all applicable
Federal Trade Commission standards.
Environmental Issues
While many direct marketers can make excellent profits with very low response
rates, consumers often question how much paper is wasted in the process. To
deal with these concerns, many direct marketers have made a conscious effort to
use more recycled papers, as well as soy-based printing inks that are less
harmful to the environment. Better direct mail targeting can also help cut down
complaints on this score. In addition, as more transactions are completed in

25
cyberspace, less paper will be needed for both product promotion and consumer
communications.
Governmental Concerns
In recent years, federal and state governments have considered imposing a
number of restrictions on direct marketing methods, and taxes on the direct
marketing sales. Most concerned direct marketers work diligently on intelligent
self-regulation in concert with the Direct Marketing Association and regional
associations and clubs. In addition, these associations expend considerable
effort and money in educating legislators regulators, and consumers about the
benefits of direct marketing and its positive impact on economic development.
Rate and Delivery Issues with Postal Service
Even considering the favorable rates available to direct marketers who prepare
their mail according to post office standards, the cost of postage has risen
substantially over the past few decades. In addition, there are continuing
concerns regarding timely and effective delivery in nearly all mail classes.
Looking forward, some experts predict that postal questions eventually will
become moot, as more and more commercial communication is conducted in
cyberspace. In the meantime, direct marketers seek productive solutions with
postal officials, and experiment with alternate methods of delivering both
message and products.

26
Prospects for Creative People in Direct Marketing
With so many factors in its favor, direct marketing has shown phenomenal growth
over the past four decades. What‘s more, Fortune 500 companies and their
advertising agencies have come to understand the wisdom of integrating direct
response techniques into a great percentage of their marketing plans. This
growth gives rise to a continuing need for more and better direct marketing
creative people with successful track records often command six-figure salaries
and lucrative freelance opportunities. But they reach that exalted level only
through years of study and practice-usually beginning at subsistence-level
salaries.
Time was, direct marketers learned strictly though a mentor system. Their craft
was handed down from generation to generation. Albert Lasker, for example,
staffed about a dozen cubicles at Lord and Thomas with fledgling writers whom
he schooled in the concept of ―salesmanship in print‖ and ―reasons-why‖ copy.
When these men left Lord and Thomas many of them went on to head some of
the most successful advertising agencies of the 20th century.
The Direct Marketing Association and a number of regional direct marketing
clubs host frequent how to seminars staffed by seasoned practitioners. The
Direct Marketing Educational Foundation, the Chicago Association of Direct
Marketing Educational Foundation, and several other regional and local

27
foundations support graduate, undergraduate, professorial, and professional
development programs at sites all over the country.
Record What You Need To Know, & Customer Wants You To Know
When setting up a database, it is tempting for marketers to think simply in terms
of what they want and need to know about their customers and prospects. But it
is just as important to find out what your customers want you to know about them
so that you can serve them better. Here are some examples of each type of
information.
Capture the Information You Need to Serve Your Customers: Following are some
of the basic elements you will want to record on your database. To serve your
customer best, you may need to add other elements based on availability of
information and your experience.
Prefix, name and address
Titles (business)and family relationship (consumer)
Phone (day and evening), fax, E-mail is applicable
Original source of customer or prospect (what mailing, ad, etc.)
Original purchase.
Purchase history, continually updated (what, how much, and when)
Yearly or seasonal purchase volume
Credit risk history

28
Customer service history (how often is merchandise returned; how often
have we been unable to meet his customer‘s needs)
For consumers: lifestyle information (by zip + four or individual house-hold
data)
For business databases: company sales volume, number of employees,
home office location, and other indicators of the customer‘s overall
potential and needs.
Capture the Information the Customer wants You to Have
Customers will be generous in sharing their preference with you if there is
something attractive in it for them such as time savings, special opportunities, or
pampering. They will also share data with you if you promise to offer them
needed reminders. Here are just a few examples of each some from the direct
marketing field and some that combine direct mail with retail.
Customer preferences Airline food choices, seating choices, frequent flyer
number, Hotel bed size, newspaper preference, high or low floor, view
preference, smoking/nonsmoking; Clothing catalog favorite labels, sizes,
wardrobe colour scheme.
Identify new product, market, and business opportunities. The more you know
about the demographics and psychographics of your customer, the more likely
you are to be able to identify new opportunities for you that will be especially

29
intriguing to them. In the catalog world, examples of this concept abound. For
example, Lands End has expanded from its original sportswear catalog to offer
books focused on linens and other home products, &dressier women‘s attire.
1.5 Direct Marketing & Traditional Marketing
There is no significant difference between the basic concept of direct marketing
and traditional market. According to (Stanton & Walker 1994) marketing is a total
system of business activities designed to plan, price, promote and distribute want
satisfying products to target markets and achieve organizational objectives. The
same applies to direct marketing. If we refer to the 4Ps , Price, Product , Place &
Promotion ,referred to as marketing Mix as mentioned by (Kotler, Lane 2004),
and compare it with direct marketing then only three of the four Ps namely
Product, Price & Promotion are applicable , because the fourth P refers to Place (
Retail outlets) which is irrelevant as goods are sold to consumers directly. Hence,
(Dunne, Lusch,1999) refer to direct marketing as an alternate channel of
distribution, or Non- Store retailing. Many companies have integrated direct
marketing with traditional marketing tools as mix strategy for better marketing
effectiveness.
1.6 Household Products
With the exception of some products like fresh foods and personal products
requiring special selling, virtually all products can be sold through direct
marketing. In Japan, which is the world‘s largest selling direct marketer almost

30
every category of consumer goods is both sold direct and conventionally retailed.
In the UK and Europe, preference is given to those products where it is possible
for a direct marketer to gain a competitive edge over retail competition.
The direct marketers in India have launched a few product categories. They
have introduced product that are economically practical for a direct marketer to
gain a competitive edge other retail competition. In developed countries where
direct marketing is prevalent for many decades, the product range is very wide
from cosmetics, fragrances, jewellery, women‘s and children‘s clothes to food
products like frozen foods, nutritional supplements and diet plans, to household
goods like books, toys, games, & white goods also. While selecting the product
mix, the characteristics of the market must be kept in mind. They should at least
meet one of the following key criteria:
(i) Product must be novel.
The word ―new―is the most powerful word in sales communications. For direct
marketers, whether they rely on catalogues or live demonstrations, the words
new, latest, & fresh, help in attracting attention of the prospect and creating
interest in the products they have to offer. Novelty need not be in the product, it
could be a novel way to sell. In the 1960‘s, a Swedish direct marketing cosmetic
company launched its skincare products based on the party plan concept where
a trained consultant demonstrated the products to a small group of customers in
their homes. The opportunity to sell novel products is an important factor in
motivating salespeople as it becomes easier to sell the product to a past
consumer.

31
(ii) It must have mass appeal.
Products which are common and used by many consumers like household
products have a big market and because of their utility are easier to sell. Most
direct sales persons are part- timers, hence within a short span of time if they can
sell in their neighborhood or to friends becomes motivation to expand in the
business. Specialised features like better design and improved efficiency in mass
products, creates appeal among consumers easily and takes lesser efforts in
selling.
(iii) It should be easily demonstrable.
The power of a demonstration of the product lies in the fact that it is an effective
way of convincing the prospect that what is claimed is true.
It should have respect purchase potential. It is this ability to demonstrate
products in the home environment that gives direct marketers an edge over in-
store demonstrations.
In India, Eureka Forbes recruited their own salesmen to demonstrate vacuum
cleaners which were introduced for the first time in the Indian market. Apart from
being a new product it was also an high involvement product. Salesmen needed
to take an appointment with the family, for at least half an hour to demonstrate
the product and its usage. The result was an astounding success. The company
has still retained its position for the same reason- the ability to demonstrate
quality and performance.

32
(iv) It must have potential for repeat purchase.
A direct marketing agent joining a business and marketing low-ticket consumer
goods, wants to feel that having made one sale to a new customer, improves the
chances of repeat purchase. In other words repeat purchase opens the door to
further business. A customer becomes a business contact when he/she makes a
purchase. This contact can be used to make future contacts with other products.
A guest at a party may decide to buy a single product at a time, though other
products are as appealing. An invitation to attend a future party provides an
opportunity while also motivating the sales agent. It is believed that repeat sales
are difficult with big ticket products, at the same time it gives a valuable
opportunity to contact past customers for ―referrals‘ to new customers.
Each company, while introducing their products has kept the above in mind and
has introduced low-ticket, easily demonstrable products. While Amway has
focused on detergents and nutritional supplements Tupperware has introduced
house ware and tableware. The products introduced in the Indian market by
direct marketers are mostly household products, whose demand is high. The
categories that are introduced within the household products are personal
products, cosmetics, hygiene and health product, and detergent.

33
The Indian Consumer

34
CHAPTER 2
The Indian Consumer
2.1 Consumer Landscape – A statistical Look!
Per Capita income of average Indian has been on the rise thanks to stellar
performance of India‘s Economy. We are seeing people move from villages to
towns and from towns to cities. In a short span of little over a decade, urban pie
has grown by nearly 10 percent
Indian Consumer Landscape
India is currently 30 percent urbanised, while 70 percent of consumers are still in
rural India.
As far as consumption goes, 404 Million are either consuming or are aspiring
consumers. 742 Million though are still under privileged.
Fig. 2.1 Indian Consumer landscape, Source : Juxtconsult.2011

35
80% urban India is low/lower middle class in income terms – below Rs.
12,500 /m
Only 15% is middle class, 5% upper class (64 million)
Avg. monthly family income of urban Indians is Rs. 8,910 p.m
2/3rd urban Indians live in the tier 3 small towns (only 20% urban Indians
live in the metros)
Metros account for only 25% of the uppermost socio-economic class
Only urban affluent (5%) lead the popularly perceived modern lifestyle
Fig. 2.2 Household Asset Ownership, Source : Juxtconsult, 2011
Indian Consumer Education & Skill sets
Only 20% urban Indians have gone to college, only 3% have had their
education completely in English

36
Only 1 in 3 ‗employed‘ in Metros works in the corporate world, an equally
sizeable chunk are shop owners/traders/skilled workers
Less than 3% urban Indians prefer to read in English
Indian Consumers Employment
‗Gen Now‘ (roughly 30 to 45 yrs of age) is the biggest generation group in
India (308 million individuals).
‗Gen Next‘ (roughly 15 to 30 yrs of age) is a close second at 300 million
individuals
Only 16% ‗Gen Next‘ are gainfully employed (2/3rd are students)
‗Gen Yest‘ (roughly 45 to 60 yrs) are the most employed (60%) and have
the best individual incomes (avg. of Rs. 4,985 or USD 110).
‗Gen Yest‘ also have the highest penetration of credit cards, life
insurance, and takes leisure holidays somewhat more frequently.
There are only 40 million working women in India (9% of all women). 260
million are housewives.
2 out of 3 working women are also working moms.
Although, India is growing it is quite clear that we have a long way to go before
we can even remotely become a developed nation. Close to 70 percent of our
population is still under-privileged.

37
2.2 MAHARASHTRA:
This research study is limited to the state of Maharashtra located in the western
India. It is a huge state, and one of the most industrious among the states in
India. It has a glorious past, having been ruled by the Peshwas and mighty
Marathas. Maharaj Shivaji ruled this state and has become its icon. It has many
industries, amongst them are the popular sugar factories for which the state is
well- known. It has good educational Institutions and many public and private
business organisations. The state is well-known for its historical tourist
destinations, beautiful hill- stations as well as good public transport, making it a
formidable tourist state. The state is held in high esteem because of its great
capital Mumbai.
MUMBAI:
Mumbai is the capital city of Maharashtra and is also known as the financial
capital of India. It is formed out of seven islands, namely, Colaba, Mazagaon, Old
Woman‘s Island, Wadala, Mahim, Parel and Matunga-Sion. The present day
Mumbai City is the outcome of much rehabilitation done on these seven islands.
Having a glorious history and an equally sparkling present to boast of, Mumbai
has earned the name of the ―city of dreams‖. This can be credited mostly to the
dominating presence of the Indian film industry, popularly known as the
bollywood.

38
The present day Mumbai has emerged as the largest metropolis in India with a
population of more than thirteen million people. This has also earned Mumbai the
tag of one of the world‘s most populous cities.
When viewed in terms of economic status Bombay/Mumbai has also emerged as
the top ten centres in the world in terms of global financial flow. What makes this
city an attractive destination from the rest of the country is the fact that is offers
tremendous employment avenues coupled with a better standard of living when
compared with the rest of India. It is also one of the few cities of the world that
boast of a national park within the limits of the city.
Pune
Or the ‗Queen of Deccan‘ is known for its educational, research and development
institutions. The city of Pune has been at the helm of affairs since the ancient
times. The home town of Marathas was the cradle of Shivaji Bhonsle. Many
edifices standing tall in Pune tell the story of the glorious past of this city.
Pune is the eight most populous metropolitans city of India is known for its
educational institutions. Pune schools and colleges are known far and wide their
quality of education. Some of the most popular educational institutions of Pune
are Symbiosis international university, Pune University etc. Located on the
confluence of Mutha and Mula rivers, Pune is one the most visited tourist places
of Maharashtra. The city is dotted with some of the most spectacular historical
monuments of Maratha period.

39
Pune, is a hub of automotive industry as well as IT industry. Some of the leading
automotive manufacturer companies such as Kinetic Motor Company, Tata
Motors and Bajaj Auto have their offices in Pune. Software is also a growing
industry in Pune.For the purpose of this research, respondents selected for this
study were from Dr. Babasaheb Ambedkar chowk, Ghorpuri bazaar, N W
college, Pune cantonment, Pune New Bazaar, Sachapir street, Koregaon park,
Azad campus, Geeta society, Bhavani peth and Mahatma Gandhi park.
Nagpur:
It is one of the leading cities of Maharashtra. It is also the second capital of the
state. It has population of total 4245930 comprising male and female. It is well
connected with Railways and road transport. The main occupation of the people
of Nagpur is service or business. It has been a witness to large scale
development activities and some of India‗s foremost builders & developers have
projects launched in the city.
For the purpose of this research the respondents were selected from Sadar
Bazaar, Ram Nagar, New Colony, Mohan Nagar, Kasturchand Park, Coal estate,
Bureau of Mines.
2.3 Consumer and Consumer Behaviour
The study focused on the consumers in the above cities. Their opinion on the
marketing strategy of direct marketing was the basic objective of the study.

40
Consumer decisions are based on the socio-economic status of the consumers.
Hence, a little knowledge of consumer behaviour becomes essential to make in
depth inferences in consumer surveys.
Consumer behaviour is the process where the individual decide what, when, how
and from whom to purchase goods and services. Consumer behaviour studies
focus on the way individuals, groups and organization selects, buys, use &
dispose of goods, services, ideas or experiences to satisfy their needs and
desire. The study of consumer behaviour enables marketers to understand and
predict consumer behaviour in the market place in advance and it is concerned
not only with what consumer buy but also with why, when, where, how and how
often they buy it. Consumer research is the methodology which is used to study
consumer behaviour and it takes place at every phase of the consumption
process before during & after the purchase. Consumer Behaviour is an
interdisciplinary approach that based on concepts and theories about people that
have been developed by scientists from such diverse disciplines as psychology,
sociology, social psychology, cultural anthropology and economics. Consumer
behaviour has become an integral part of strategic and social responsibility. It is
also an integral component of every marketing decision and is embodied in a
revised marketing concept and the social marketing concept. It helps marketers
to fulfill the needs of their target markets in such a way that it also develops
society. Consumer Behaviour is dependent on the following factors:

41
a) Social Factors: Social factors divide the society into a hierarchy of district
classes. The members of each class have relatively the same status and
members of other classes have either more or less status. It includes family,
group, celebrity etc.
b) Cultural Factors: Its potent influences are brought up to follow the beliefs,
values and customs of their society and to avoid behaviour that is judged
acceptable. Beliefs, values, and customs that sets subculture apart from other
members of the same society. We therefore define sub-culture, as a distinct
cultural group that exists as an identifiable segment, within a larger, more
complex society.
c) Personal Factor: Personal factor also influences buyer behaviour. It includes
age, income, occupation, life style. It simply directs our outer personality.
Personal factor is very important factor in consumer decision making.
d) Psychology Factor: The buyer behaviour of consumer is influenced by
number of psychological factors. It includes motivation, perception, learning,
beliefs and attitude and personality.
2.4 Consumer as Family Member
A family is defined by the bureau of the census of the United States as two or
more persons related by blood, marriage, or adoption and living together‖. The
area of family research considers the family as a unit of analysis. Family

42
research attempts to describe and understand how family members interact and
influence one another in terms of individual, household purchase.
Family decision making basically refers to the manner in which family members
interact and influence each other when making purchase choices for the
household. Although a family is being recognized as the basic decision making
unit, marketers most frequently examine attitudes and behaviour of one family
member whom they believe to be the major decision maker (Blackwell, 2001). To
fully understand family decision making, marketers need to identify which family
members take on what roles. Family Roles can be categorized as :
1) Initiator is the person who first suggests the idea of buying the product or
service.
2) Influencer is the person whose view or advice influences the decision.
3) Decider is the person who decides on any component of a buying
decision: whether to buy, what to buy. How to buy, or where to buy.
4) Buyer is the person who makes actual purchase.
5) User is the person who consumers or uses the product or service.
Review of Studies on Family Purchases : Global And The Indian Experience
This presents a review of the existing literature in order to gain insights into the
research work undertaken in the area.

43
The following are the major studies, which deal with the exploration of products
category differences, their relationship to family decision-making and the
structure of husband and wife roles.
a) Wolgast M. Elizabeth (October 1958) studied the role played by husbands
and wives in making a purchase decision. Her study was based on a cross
section of families In all parts of USA. It indicates that, in consumer
surveys concerned with a broad range of expenditures, the husband and
wife are equally desirable respondents.
b) Webster Cynthia (September 1994) involves the conclusions drawn with
regards to the traditional role specialization and purchase behavior.
Traditional role specialization affects, which spouse has dominations with
respect to specific products. Traditional role specialization influences the
relative dominance with respect to products attributes.
c) Komorousky‘s Mirra (1961) indicated that joint involvement in decision-
making is found to occur most in middle-income families and younger
couples and is related to the extent of husband-wife communications. The
study examined support the fact that the wife in the lower socio-economic
hierarchy have less involvement than among the middle class.
d) Wilkie‘s study (1975) provides the measures which influences family in
four stages i.e. Problem recognition, search, alternative evaluation and
purchase of choice. His research measures the following: Who was
responsible for the initial problem recognition? Who was responsible for

44
acquiring information about the purchase alternatives? Who made the final
decision as to which about the purchase alternative should be purchased?
Who made the actual purchase of the product?
2.5 Profile of New Age Indian Woman Consumer
It is interesting to note that the Indian women consumer has matured with leaps
& bounds over the last decade. They are more educated and are aware of
national and international brands. As the number of employed women grows,
they create demand life-style products. The role of the women consumer in
decision making has increased and they contribute to half of the decisions taken
in the house termed as ―joint decision-making‖. According to (Pitch, 2005) the
Indian urban women has evolved into four distinct categories mentioned below:
Popular – lively, cheerful, positive personality, friendly, independent
minded and not self sacrificing and likes to be a fashion leader.
Gharelu – perfect homemaker, conscious about spending, sacrificing,
tending towards a traditional woman.
Meri Aawaz Suno – Outspoken innovator, ―prosumer‖ setting trends, self
indulgent.
Mrs Pataka – Cool, change seekers with their feet in traditions.Mrs. Hey
Bhagwan – Moaner; unappreciative of modern products, self conscious.

45
Review of Literature

46
CHAPTER 3
REVIEW OF LITERATURE
The present status of Direct Marketing‘ has undergone changes as it has
developed and evolved over the years. It began as an aspect of marketing, not
really a category in and of itself, but now is a collection of methods that seemed
to include everything from direct mail to direct advertising and direct selling. The
evolution and development of technology has had profound effects on direct
marketing and the use of direct marketing and has brought about many issues
that merit serious consideration as a result.
3.1 History of Direct Marketing
The history of direct marketing starts with mail-order shopping and direct mail,
two traditional elements that still play a role in many direct marketing campaigns.
It is necessary to distinguish direct marketing from direct mail or mail-order
business, although direct marketing encompasses those two concepts. A firm
may spend millions of dollars on direct mail and not sell anything through the
mail. Direct mail is an advertising medium, one of several media that direct
marketers utilize. Mail order is a distribution channel; the other two channels of
distribution are retail and personal sales.
How old is direct marketing? Garden and seed catalogs were known to be
distributed in the American colonies before the Revolutionary War. Mail-order

47
shopping of consumer goods entered a period of growth in the 1880s, when mail-
order houses began to fiercely compete with local stores. Their marketing contest
centered on three major issues—price, inventory, and assurances—the very
factors that made mail-order houses successful.
Aaron Montgomery Ward (1843-1913), regarded as the first of the consumer
goods catalogers, started his catalog business in 1872, while Richard Warren
Sears (1863-1914) mailed his first flyers in the 1880s. These catalogs had a
liberating effect on 19th-century consumers. Consumers were no longer captives
of their local stores, which had limited inventories and charged higher prices
because the stores weren't big enough to receive large volume discounts from
their suppliers. With the advent of mail order, consumers could get attractive
goods and prices whether they lived in the middle of Manhattan or a remote rural
setting.
The postal system allowed direct-mail companies to operate on a national basis.
With economies of scale working in their favor, mail order houses could undercut
the pricing of local stores. In 1897 bicycles were selling for $75 to $100 and
more, until Sears started offering them for $5 to $20 in its catalog. Sears could
offer those low prices because it sold thousands of bicycles every week.
The large volume of business also allowed catalogers to offer a wider variety of
goods. Consumers not only wanted low prices, they also wanted variety—20

48
kinds of dresses rather than 2. Here again, the enormous volume generated by
leading mail-order houses made huge inventories not only possible but also
practical.
But price and variety, while important, have only limited value if the goods
themselves are shoddy or poorly made. So the mail-order firms protected
consumers with powerful guarantees. Montgomery Ward was one of the first
companies to offer a money-back guarantee, and the Sears, Roebuck pledge of
"satisfaction guaranteed or your money back" is one of the best-known
commitments in American business.
Another successful cataloger, L. L. Bean of Freeport, Maine, began in 1913 when
Mr. Leon Leonwood Bean mailed his first single-sheet flyer advertising his Maine
hunting boots. Perhaps he got the idea of using direct mail from his brother, Guy
Bean, who was the Freeport postmaster. L. L. Bean targeted his mailing to
individuals who had hunting licenses.
Another landmark in direct marketing occurred in 1926, when copywriter John
Caples wrote a direct-response advertisement for a music correspondence
school using the headline," They Laughed When I Sat Down at the Piano … but
Then I Started to Play!" Today the Caples Award is a coveted prize among direct
marketing copywriters.

49
3.2 Direct Marketing Advent In India
The 1990s: In India this period is referred to as post liberalization era integrating
Indian economy with world economy. The new industrial policy, delicenced many
industries; the trade policy lowered tariffs; and the economic policy brought fiscal
and monetary reforms. Many foreign companies ventured into India, bringing with
them new brands, products and marketing strategies. Direct marketing is one
such strategy. Direct marketing strategy was adopted by the famous Eureka
Forbes for the first time but it was popularized by the international brands like
Tupperware, Oriflames, Amway and Modicare which have launched their
products with a new distribution and marketing systems. Direct Marketing is an
innovative distribution strategy which does not involve channel members but
there is a direct interaction between the company and the customer for product
offering and sales.
This study is undertaken with a view to examine the process of direct marketing /
selling and project it as a viable marketing strategy.
3,3 Developments In Direct Marketing
Although direct marketing has been established as an interactive media, it was
the research findings of (Schultz, 1993), which gave a new thought. According to
him, direct marketing appears to be very much considered an important area in
itself when he discusses important areas of direct marketing and methods of
implementing and measuring direct marketing programs. He states that direct

50
marketing seems to have evolved and been elevated to a level where it is
considered an area separated and distinct from just a number of different types
that are used to market a product.
Many authors seem to feel one of the advantages of direct marketing is the
personal aspect of this type of marketing. Many others feel that using direct
marketing is a way to help establish a relationship with the customer. (Gengler
and Leszczyc,1997) use customer satisfaction research for relationship
marketing to present a direct marketing approach. Relationship marketing is a
fairly sophisticated way to market a product that might seem like a very effective
way to market a product. Since there are and have been many similar products
on the market, one way to effectively market a product is to ―develop a
relationship‖ with the customer. That means appealing on an emotional level to
the customer. The hope is that since the customer has this ―relationship‖ on an
emotional level with a product and /or company that is the product that will be
chosen instead of other products on the market that may even be very similar.
They examine the significance of long-term relationship with customers
concerning repeat business. Repeat business is essential for survival of any
organization and for direct marketing to play an important part in obtaining repeat
business underscores how essential this area of marketing has become at this
point in time.
There have been many technological advances in the area of direct marketing
over the years. There is a fair amount of work that illustrates that the direct

51
marketing area has reached a new level of sophistication but one that is
appropriate for a marketing method to be useful in the present marketplace. Bose
examines quantitative models that support direct marketing in electronics
channels (2009), takes a look at the digitization and networking of information
that is changing marketing communications with respect to the approach for
connecting with consumers.
3.4 Direct Marketing In U.S. And Japan
The United State of America is the pioneer of Direct Marketing, therefore most
studies on consumer‘s attitudes towards direct marketing have sampled US
consumers. These studies have generally focused on direct marketing
techniques and general attitudes towards marketing, privacy and direct
marketing. Research studies undertaken by (Maynard, and Taylor in 1996) that
compared American and Japanese consumer‘s attitudes towards direct
marketing showed that consumers of both countries have similar levels of
ambivalence towards direct marketing their studies showed that respondents in
Japan showed more negative attitudes towards telemarketing than respondents
in United State. Maynard and Taylor found that the Japanese participants in their
studies were concerned about privacy issues than their American counters parts.
The respondents from Japan were less tolerant of the practice of marketers
sharing information about their age and purchasing habits than American
respondents.

52
Another demographic factors under privacy was that of age where respondents
were concerned above sharing information. Higher- income earning participants
were slightly more concerned about privacy than those at lower-income levels. In
a study conducted by the Japan Direct Marketing Association (1997), it was
found that 62.5% of the total respondents answered yes to the statement. I feel
my privacy is invaded if I receive direct mail from unknown marketers. But, only
11.8% respondents felt that their privacy was invaded by receiving catalogues
from direct marketers from whom they had previously purchased. In addition,
11.2 % of the total respondents concerned said that they had prior experience
with privacy invasion in direct marketing.
Direct Marketing in China & Taiwan
The consumers in China have had a hot and cold attitude towards direct
marketing. Direct selling faced nearly a band in the late nineties where
consumers were agonized by malpractices in the network systems. Here also the
issue of trust and privacy pose a significant barrier to direct marketing. This
barrier was more prominent in the growing e-commerce business in greater
China region. An online research study conducted by (Cheskin Research 2000)
to gain insight into online behaviors and attitudes in Greater China revealed that
the respondents worry about identity risk and how their personal information
might be handled by a website. Online consumers in Greater China are reluctant
to use credit card to purchase online fearing credit card fraud. They scored

53
relatively low on the trust scale when compared to similar attitudes of general
market respondent.
Consumers in Taiwan had similar views of their Chinese counterparts and raised
similar apprehensions about privacy issues of direct marketing.
Direct Marketing in Australia
The consumers in Australia have nearly a similar profile to consumers of United
Kingdom and United States they are high on education and income therefore,
their attitudes and concerns to direct marketing is similar to those of the
Americans. In a study on ethics and trustworthiness titled, an exploratory
investigation of the ethical values of American and Australian consumers : Direct
Marketing implications, authors (Rawwas, Strutton, Johnson,1996) found that
Australians were more sensitive to ethical standards, valuing trustworthiness
substantially more than Americans. The Australians consumers expect firms to
honor their complaints without asking questions. This study indicates to the direct
marketers that informative, straightforward and functional consumer policies,
such as guaranteed refunds, would prove successful in targeting the Australian
consumer.

54
3.5 Major Channels of Direct Marketing
Direct marketing uses a variety of media, including mail, magazine ads,
newspaper ads, television and radio spots, infomercials (also television but
longer format), free-standing inserts (FSIs), and card decks. This flexibility allows
direct marketing to provide interactivity and measurability and still be able to take
advantage of new technologies. By being able to utilize virtually any media, direct
marketing will lead marketers into the 21st century as interactive television, the
information highway, and other new technologies become a reality.In direct
marketing, the transaction may take place at any location and is not limited to
retail stores or fixed places of business. The transaction may take place in the
consumer's home or office via mail, over the phone, or through interactive
television. It may also occur away from the home or office, as at a kiosk for
example.
Direct Marketing Lists and Databases
Data base marketing is a form of direct marketing in which you repeatedly
communicate with prospects whose names and other information are contained
in a data base you own or rent (.Bly 1998 ).
Lists are commonly used in direct mail and telemarketing. The two basic types of
lists are response lists and compiled lists. Response lists contain the names of
prospects who have responded to the same offer. These typically contain
individuals who share a common interest. Names on a response list may include

55
buyers, inquirers, subscribers, continuity club members, or sweepstakes
entrants. They may have responded to an offer from one of several media,
including direct mail, television, or a print ad. Response lists are not usually
rented; rather, they are an in-house list compiled by a particular business.
Compiled lists are often rented by direct marketers. Compiled mass consumer,
specialized consumer, and business lists are available for a wide range of
interests.
Direct marketing databases are similar to mailing lists in that they contain names
and addresses, but they are much more. They are the repository of a wide range
of customer information and may also contain psychographic, demographic, and
census data compiled from external sources. They form the basis of direct
marketing programs whereby companies establish closer ties and build
relationships with their customers.
In the 1980s database marketing became one of the prevalent buzzwords of the
direct marketing industry. Whether it's called relationship marketing, relevance
marketing, or bonding, the common theme of database marketing is
strengthening relationships with existing customers and building relationships
with new ones. Databases allow direct marketers to uncover a wealth of relevant
information about individual consumers and apply that knowledge to increase the
probability of a desired response or purchase.

56
As with mailing lists, there are two basic types of marketing databases, customer
databases and external databases. Customer databases are compiled internally
and contain information about a company's customers taken from the
relationship-building process. External databases are collections of specific
individuals and their characteristics. These external databases may be mass-
compiled from public data sources; they may contain financial data based on
confidential credit files; they may be compiled from questionnaires; or they may
be a combination of all three sources.
Database marketing, and especially the prospect of using confidential information
for marketing purposes, has made privacy an important issue in the direct
marketing industry. Some states have passed legislation limiting access to
previously public data or limiting the use of such data as automobile registrations,
credit histories, and medical information. In order to avoid excessive government
regulation, the direct marketing industry has attempted to be self-policing with
regard to the use of sensitive data. Nevertheless, the struggle between industry
self-regulation and government regulation continues and will probably continue
for some time.
Telemarketing: The systematic use of the telephone to market goods or
services, survey for information, or commercially service accounts (Mchotton
1998). Most of the direct marketing methods use data bases which contain
names of consumers. These lists are made up of homogeneous consumer

57
segments, either on the bases of one or more demographic factor. These lists
are rented to direct marketers for approaching prospects. This method the
telemarketers operate with lists of telephone numbers of prospect consumers.
Calls made to prospects are referred to as outbound calls. The product is
explained to the prospects and then given time for a reply. Consumer calls
received are called as inbound calls. The product is delivered to the consumer
Direct marketing uses a variety of media, including mail, magazine ads,
newspaper ads, television and radio spots, infomercials (also television but
longer format), free-standing inserts (FSIs), and card decks. This flexibility allows
direct marketing to provide interactivity and measurability and still be able to take
advantage of new technologies. By being able to utilize virtually any media, direct
marketing will lead marketers into the 21st century as interactive television, the
information highway, and other new technologies become a reality
In direct marketing, the transaction may take place at any location and is not
limited to retail stores or fixed places of business. The transaction may take place
in the consumer's home or office via mail, over the phone, or through interactive
television. It may also occur away from the home or office, as at a kiosk for
example, and dispatched through courier the payment collected on receipt of the
product. The advantage of this method is the fast reach to the consumer at very
low price. Telemarketing is useful in the sales of low-ticket novelty products.

58
The use of the telephone in direct marketing has grown dramatically over the
past two decades. According to a 1996 study conducted by The WEFA Group for
the Direct Marketing Association, more money was spent on telemarketing than
on direct-mail advertising. Of all direct marketing media spending in 1995,
telemarketing accounted for 40 percent, or $54.1 billion, compared to $31.2
billion for direct mail.
Telephone-based direct marketing may be outbound and/or inbound. Inbound
telemarketing is also known as teleservicing and usually involves taking orders
and responding to inquiries. Outbound telemarketing for consumers may be used
for one-step selling, lead generation, lead qualification or follow-up, and selling
and servicing larger and more active customers. In business, telemarketing can
be used to reach smaller accounts that don't warrant a personal sales call, as
well as to generate, qualify, and follow up leads.
Telemarketing has the advantage of being personal and interactive. It's an
effective two-way communications medium that enables company
representatives to listen to customers. Telephone salespeople typically work from
a script, but the medium allows the flexibility of revising the script as needed. It
also allows up- and cross-selling. While customers are on the phone it's possible
to increase the size of their orders by offering them additional choices, something
that tends to lead to confusion in other direct marketing media. Examples include

59
offering "telephone specials" to callers or letting them know about clearance or
discounted merchandise.
Telemarketing is more expensive than direct mail. It also lacks a permanent
response device that the prospect can set aside or use later. It is not a visual
medium at present, although the technology to make it one may be available in
five years. Finally, it's perceived as intrusive, generating consumer complaints of
"invasion of privacy" that have led to legislative actions to regulate the
telemarketing industry.
Direct Selling:
The method of direct selling is among the most popular methods of direct
marketing. This method is age- old, and earlier involved selling of goods, door-to
–door by individual salesmen or by those appointed by the company. A network
marketing system, professed by the giant direct marketer ―Amway‖ with origins in
the United States is the popular method of direct marketing and has expanded in
several countries in the last decade. Another method is marketing of goods,
door-to –door by salesman appointed by the company. This type of marketing
involved the selling of products which were high involvement products whose
concept would not be fully understood through advertising, and required live
demonstrations in the prospect‘s home or office.
60
Multi-level Marketing : It is a method of direct selling door-to-door where
customers are distributors (Salesmen) of product and services e.g. Amway or
customer sell products through house party e.g. Tupperware. (Sterne Priorre
2000). Each distributor has a list of prospects which includes friends, neighbors
or relatives who live in short distance from the distributor. Telephone calls are
made to prospects, and the convenient time for a visit is fixed. During the visit the
products are displayed, and the distributor collects the order, communicate with
the company to deliver the product to distributor who gives it to the consumer.
The distributor is also a consumer who purchases products at discount rate from
the company. Examples of this method are given below:
1) Tupperware
Tupperware, is an international brand of plastic ware. Located in Orelands, USA
it has its presence in more than 100 countries around the world and its presence
in millions of home around the world, spells quality, convenience and versatility.
Tupperware products largely in the homecare segment help improve home
management, open new doors of opportunity and save time, money and water
through a simple approach–creating extraordinary design for everyday living.
(Tupperware annual report 2002).
Launched in India in 1996 as a private limited company, it has its head office in
Gurgaon, Uttar Pradesh. It began with its presence in the Capital Delhi in 1996,
followed by Mumbai in 1997, moving to South (Chennai / Bangalore) and then

61
Kolkatta. Since, they have made in foray in 48 cities in India, apart from Metros,
and also covered the rural markets in Punjab. In 2005, it became a 100 Core
company with only one head office, four regional small offices and a
manufacturing facility in Hyderabad. The raw materials are imported from Korea
and Japan for the Asian market and international quality standards are strictly
maintained through quality test of reports sent regularly to the host country
headquarters for approval and advice. The ―moulds‖ of the products are shared
all over the world. Tupperware India private Ltd, started with approx.25-30
products and presently they have successfully launched about 70 products in the
homecare segment. In a few countries, the company has diversified into toys and
beauty products, but in India the launch is still awaited.
Marketing Strategy of Tupperware:
A basic market research survey, before making an advent into the Indian market
i.e. before 1996, gave an insight into the Indian market and its potential. The
Indian consume was found to be mature, had the urban consumer had higher
indispensable incomes and the penchant for better living. Moreover, the Indian
consumer was found to be quality conscious, had a high awareness of national /
international products, and most important understand the value of quality goods.
The competition in the Indian market was scant, there being only two brand
names in the segment, namely Pearl-pet and Brite. Largely, the Indian plastic
ware market is dominated by unbranded products sold through petty shops and
road side vendors.

62
Marketing Plan of Tupperware:
The international strategy of single-level, marketing is the Company‘s common
plan of marketing its products in all the countries of its presence. The single level
marketing plan (Party plan) consists of an host lady, who wants to join
Tupperware‘s marketing program. She invites a group of friends to a party at her
residence and demonstrates the products before them. She explains the salient
features of each product, and listens to the reaction of the prospects. In the end,
she understands her friends‘ needs and suggests products that will fulfill the
needs. The orders are collected, and the party ends. The orders are
communicated to the nearest distributor, who sends the products to the host
consultant.
Party Incentives of Tupperware:
There are various incentives provided to party hosts, according to the following
chart:
First level training New Dealer Orientation
(Guests & New
Consultant)
Power Start (4 sessions
new consultant)
New Consultant
Second level training Growth Class (6 classes
for Prospective)
Leadership Class (6
sessions for Managers)
Consultant who wants
to be a Manager
Third Level Training Excellence Class (8
sessions for Distributors)
For aspiring Distributors
Fig. 3.1 Career Path of Consultants

63
Company Philosophy of Tupperware
The mission of the Company is to reach every kitchen, and its motto is: Build
people, people will build business. The Tupperware Company is of women, by
women, for women. The Consultants & distributors are all women. Hence, they
understand the products well. The Consultants are able to customize the
products to every individual need. Any individual can become a Consultant, and
without any investment join the business and begin to earn. The Commission of
20-25% on products on Market Retail Price (MRP) belongs to the Consultant. It
is believed that working for 25 to 30 hours in a month can fetch a business
commission of minimum of Rs.3000/-.
Another interesting feature of the Tupperware Company is the Lifetime
Guarantee against Chipping, cracking or breaking under normal, non-commercial
use. If the same product (or any part) is not available, a comparable Tupperware
product replacement will be made, or credit towards further purchases will be
given.
Corporate Social Responsibility of Tupperware :
Apart from the social element of empowering women, in the business philosophy,
Tupperware is supportive of national / international social campaigns. In India, it
supports the ―CRY‖ – Child Relief & You. In their recent product brochure is a
mention of the following:

64
CRY and Tupperware have a common vision empowerment, growth and
sustainability for all individuals. CRY aims to enable people to take responsibility
for the situation of the deprived Indian child and motivate them to confront the
situation through collective action, thereby giving the child an opportunity to
realize their full potential. Tupperware supports this noble though by supporting
the CRY project, NAVSHRISHTI, which operates in North India, in Delhi, by
supporting Survival, Development, Protection and Participation for Children as
per the UN Charter of Child Rights. Tupperware‘s mission is also to support the
education programs and vocational training for children while also making the
program sustainable by creating awareness on child rights within the community.
The project also runs Income Generation programs for women in the locality.
2) Amway Enterprises
Amway Corporation, a $6.3 billion, World‘s largest direct selling companies in the
world, began operations in India in August 1995 through its affiliate Amway India
Enterprises (AIE), set up on an investment of $15 million (Rs.52.5 crore). It
began with a launch of 8 products, from its personal care and home care
segment. Its headquarters are in Delhi with Amway Distribution Centres (Product
Selection Centres) in Delhi, Mumbai, Kolkata and Chennai and Bangalore.
Amway India commenced commercial operations on May 5, 1998 and since has
established itself as a reputed leader in the country as a worldwide leader in the
multilevel marketing / direct selling industry.

65
Amway India is a wholly subsidiary of the Amway group of Companies,
established in August 1995 after approval by India‘s Foreign Investment
Promotion Board (FIPB) and has approximately about 300-400 full time
employees. It give distribution centers in India provides a full range of distribution
services including product training and telephone ordering for home deliveries.
Home delivery was available in 174 cities and towns throughout the country
within two years of its operation in India, but presently the company has made its
presence in all the States in India. Its at present in four metros, large cities in
each state and also Tier II & III cities in many states. The Amway Distribution
Centers are connected by Satellite to Delhi Headquarters, hence all distributor
data (PV/BV) is accessible online. Currently about 100 products are available in
India, in the personal, home and health care segments. Amway has also
launched its cosmetic range ―Artistry‖ in 2002-03.
Product Manufacture in India:
Amway manufactures its products in India. Its strategy for manufacture of
products is through ―third party‖. Local contract manufacturers from the medium
and small scale sectors manufacture all products offered by Amway India in
India. Amway has selected these manufacturers based on their ability to produce
products that meet Amway‘s stringent global standards of high quality and
performance.

66
The Amway Corporation was started by Mr. Doug Devos and his best friend Mr.
Steve Van Andel about 45 years ago. Today, he counts many world leaders as
friends and is respected the world over for his business acumen. He has
continued to remain active in building new civic, social, spiritual and business
enterprises well in his 70s. Amway, today has presence over 90 countries and
this multinational is the pioneer of direct selling in many of these countries.
Levels of Recognition:
The distributors have been regularly recognized and rewarded according to well
charted Recognition plan, which is as follows:
Training of Amway Distributors:
Training is an important issue with the Company and a lot of emphasis is laid
down over systematic levels of training to be given to distributors who have
completed successive levels of performance for the company.
The essence of the training is to give distributors thorough understanding of
products so that they can generate more conviction during sales presentations
before prospective customers. In the words of the Company, ―Amway makes
selling the concept a lot easier than it would have been otherwise. Amway just
doesn‘t promise success, it trains you to be successful. With over 45000 free
training sessions & retailing workshops conducted every year, there seems to be
a lot you can achieve through these training sessions – at whatever level you are

67
now‖. This is an encouragement from the company to its distributors, to make
their distributorship a success, thereby fulfilling dreams. The Company expects
distributors to ploy their own success graph. Three levels of training modules are
designed for distributors at levels of performance.
Level 1
o Basic product training sessions
For all product categories
Healthcare, personal care, artistry, attitude, nutrilite
Basic ENA
Foundation of optimal health
Essentials and lifestyle speciality products.
o Eligibility : Open for all
o Duration : All ---- - 1 ½ hrs to 2 hours
o
Level 2
General effective product presentation and Effective product Sales
session (EPS)
Basic presentation & selling skills workshops for all distributors who
have attended Level 1 Basic Product Training.
Effective Product Presentation Session (EPP) Duration – 3 – 3 ½ hours
Effective Product Sales Session (EPS) Duration – 3 ½ to 4 hours.
Level 3
Retail Training Workshops.
Business Support Material Policy (BSM)
According to Amway‘s BSM review policy for India, material intended for us with
prospective distributors, training material for new distributors and any Sales Plan

68
training material must be reviewed and receive written authorization prior to use.
All material that requires review must be submitted to the attention of BSM
administration, Amway World Headquarters for review.
Expanding your Amway Business in India.
Develop your list of leads from family, friends and distributors and write or call
them to share your enthusiasm and experience in the Amway business
distributors should follow their original line of sponsorship when entering the
Indian market. Distributors should also be aware of and uphold the laws and
regulations of the market.
Distributors who are Non-resident Indians (NRIs) and who are seeking to
establish a second distributorship in India, are required to inform the Reserve
Bank of India within 90 days of starting business activity in India.
Distributors who are foreign passport holders and not of Indian origin, require
prior approval from the Reserve Bank of India or the Foreign Investment
Promotion Board (FIPB) to do business in India.

69
Ordering Procedures Of Amway Products
The order instructions are found in the Distributor price list, SA_12-ID. This price
list contains product names, item numbers, PV, BV current distributor prices,
including local sales tax at applicable rates.
The price list also has a maximum retail (MRP) for each item. Distributors may
sell products either at or below the MRP. All distributors order directly from
Amway India. Distributors can order by telephone or fax or in person at the
Amway Distribution Centres (ADCs)
Why do people start Amway business or pursue other direct selling
opportunities?
Recent research by the US direct selling association shows that six broad types
of people get into direct sales, and their primary interests vary considerably. We
believe these reason for building a direct selling business also apply to Amway.
Build a career and own their own business
Improve their quality of life by working part time
Achieve specific short term objective
Buy products they like at wholesale /discount prices
Recommend products they like to others

70
Get personal recognition and encouragement around the world, the Amway
business opportunity provides low cost low risk means to achieve all this and
more, for instance it
Helps people to develop and refine their business skills.
Provides people with the flexibility to organize and manage their time as they
wish.
Without the constraints of the typical job.
Gives families a chance to work closely together and develop stronger ties
Is a way to meet other people and develop new friendships.
Gives opportunities to those who might not otherwise have them, to
succeed on their own.
How many distributors remain in the Amway business year to year?
Worldwide, more than 50% of all Amway distributors choose to renew their
business each year – an impressive figure given the part time approach of the
great majority of people on direct selling.
What role does books, tapes, and meetings playing the Amway business?
Many distributors have found that these materials can be helpful in teaching them
how to build an Amway business books, tapes and seminars can be effective
education and motivation tools by learning from those who have already

71
succeeded in the Amway business. In most case, this is the most efficient way to
communicate with large number of people spread across a broad area.
In buying books and tapes and attending required to be an Amway
distributors?
No. Distributors are free to choose whether or not they wish to purchase these
materials. Distributors should purchase these materials only if they believe these
materials will assist them in building a more successful and profitable Amway
business.
Many distributors have found these materials to be helpful in building their
business, and thus encourage their sponsored distributors to buy these
materials. However, participation in any training system or any purchase of
business support materials is always voluntary.
Is it true you don’t have to sell, just buy the products for yourself and
recruit others to do the same?
The simple fact, is, you can‘t make money in the Amway business unless Amway
products are sold. To say it otherwise would be misrepresenting the Amway
Sales and Marketing Plan – violation of our rules.

72
How do AMWAY products rank in comparative tests?
AMWAY products are rated very favorably for performance in various tests
around the world. We are product of our products and our commitment to
research and development. Unlike other direct selling companies that use
outside contractors to develop and manufacture most, if not all, of their products,
we have our won expensive R&D and manufacturing facilities and make major
investments each year in this area.
Consumers are the ultimate judges of product quality. They may buy a product
once, but if its quality and value don‘t measure up, they probably won‘t buy it
again.
3). Eureka Forbes Ltd.
Mission Statement
―To foster and nurture relationships regarding evolving Indian homes by
satisfying lifestyle expectations through innovative and value for money products
that will achieve market leadership.‖
It has been a pioneer in the application of direct marketing strategy. The strategy
has become very successful for the products ―vacuum cleaner‖ and aqua guard
water purifier, whose sales over the years have increased manifolds only through
the use of direct marketing strategy. The strategy manifests itself by going

73
unconventional i.e. not using the channels of distribution (wholesalers, retailers)
to retail their products rather than using a sales force (sales men and women).
The products formed a group of related products under the category cleaning
appliances namely vacuum cleaners, water cum filter purifiers, electronic air
cleaning systems, small household appliances, electronic safe washing
machines & mechanical floor sweepers.
The Sales Force of Eureka Forbes
They form the important part of the organization, because they sell the product
(i.e. demonstrate give presentations and advocate about the product. They are
given ongoing training and work part time on commission basis + fixed salary.
They have to follow a strict code of conduct.
Code of conduct
1. Identification: The representative will identify himself as a Representative from
EUREKA FORBES LIMITED with the support of an identity card, issued by the
company.
1. Territory: The representative will sell the products of the company
to the customer‘s house/office within the specific boundaries/territories
approved by the company.

74
2. Information and use of products
A. The representatives will offer details to the customer about the
product which can be confirmed with the necessary demonstration
in support of information mentioned in brochures, user manual or
literature published issued by the company. The representative
shall not overstate or exaggerate claims featured by the product.
B. The representative will inform the customer about any scheme with
the products which are officially announced by the company.
3. Standard and quality of the product: The representative will offer
the details about the standard quality of the products which are mentioned
in the brochure, user manual/literature and which confirmed by respective
authorities by certificate.
4. Technical aspect: The representative will inform technical details to
the customer which are mentioned in the brochure, user manual/literature.
5. Price of the product: The representative will offer the product to the
customer on such price that is fixed by the company and there will be no
deviation from the same.
6. Promises: verbal and written: The representatives will offer those
promises which are fair and can be fulfilled by the company‘s policies. The
representative shall give accurate and understandable answers to all

75
questions from the customers regarding he products, price and any other
matter relating to the products or services.
7. Commitment:
a) The representative will offer those commitments which can be honored
with the company‘s policy and within the time frame given by the
company.
b) The representative will honour the commitment within the time frame given
by the company regarding :
1) Advances to be converted into sale
2) Delivery of the products
3) Installation of the products if required
4) Deputation of representative
8. Services: The representative will offer those information about the
products, after sales service which are mentioned in the Service Manual
with respect to:
1) Within warranty, out of warranty.
2) Within Contract, out of Contract.
3) Need based Services.

76
9. Return of goods: The customer would be provided one week from the
date of purchase to return the product if he/she is not satisfied with the
same and, would be eligible for a full refund of the money.
10. Fairness: The representative shall not abuse the trust of individual
customers, shall respect the lack of commercial experience of customers
and shall not exploit customer‘s age, illness, lack of understanding or lack
of knowledge of the language.
11. Privacy: Personal or telephone contact shall be made in a reasonable
manner and during reasonable hours to avoid intrusiveness. A
representative shall discontinue a demonstration or sales presentation
upon the request of the customer.
After Sales Force
The company‘s policy ensures a free after sales service for a year after the
purchase. These services are provided twice in a year, and services are promptly
given and complaints regarding the product are dealt with in detail. Also
regarding feedback on the product is seeked from the customer about the
functioning of the product. The feedback system ensures customer satisfaction
while at the same time, it also builds up relationship making.
Mail Order: Is a form of direct marketing where the selling of products through
the mail. In mail order selling, the buyer typically purchases the product directly

77
from an ad, mailing or catalog, without visiting a store or seeing a salesperson.
The product is then shipped by mail or courier service; with no middleman
involved… (Bly 1998).
Direct mail has traditionally been the most heavily used direct marketing medium
and the one direct marketers learned first. Direct mail has been used to sell a
wide variety of goods and services to consumers as well as businesses. Despite
postage increases, direct mail continues to grow. A recent count showed some
714,000 businesses had bulk-mail permits that allowed them to mail at lower
rates, and they sent out more than 63 billion pieces of advertising mail a year.
According to the U.S. Postal Service's 1997 annual report, Standard Mail (A)
(formerly third-class mail), which includes advertising letters, flats, and small
parcels, increased by 7.8 percent over 1996.
Direct mail offers several advantages over other media. Perhaps the most
important is selectivity and personalization. This doesn't necessarily mean
addressing every individual by name, but it does allow targeting individuals with
known purchase histories or particular psychographic or demographic
characteristics that match the marketer's customer profile. Direct mail can be
targeted to a specific geographic area based on zip codes or other geographic
factors. Personalization in direct mail means not only addressing the envelope to
a person or family by name, it can also mean including the recipient's name
inside the envelope on a letter, for example, or elsewhere in the package.

78
Direct-mail packages come in all shapes and sizes, making it one of the most
flexible of the direct marketing media. A standard direct-mail package includes an
envelope, a letter, a brochure, and a response device. The envelope's job is to
motivate the recipient to open the package. Regardless of the volume of mail a
person receives, the envelope must distinguish itself from other mail by its size,
appearance, and any copy that might be written on it.
The letter is a sales letter and provides the opportunity to directly address the
interests and concerns of the recipient. The letter typically spells out the benefits
of the offer in detail. The more personal the sales letter, the more effective it is
generally. While the letter tells the recipient about the benefits of the offer, the
brochure illustrates them. Illustrated brochures are used to sell services as well
as products. Finally, the package must include a response device, such as a
business reply card, that the recipient can send back. Response rates are
generally higher when the response device is separate from, rather than part of,
the brochure or letter. Toll-free numbers are often prominently displayed to allow
the recipient to respond via telephone.
A "lift letter" is often added to the package to "lift" the response rate. The lift letter
often carries the message, "Read this only if you've decided not to accept our
offer," or something similar to grab the recipient's attention one more time.

79
More complex direct-mail packages are three-dimensional; that is, they include
an object such as a gift or product sample. These three dimensional mailings can
be effective in reaching top executives whose mail is screened by a secretary,
and they are practically guaranteed to be opened by consumers at home.
Direct mail is the most easily tested advertising medium. Every factor in
successful direct marketing—the right offer, the right person, the right format, and
the right timing—can be tested in direct mail. In terms of selecting the right list,
computer technologies have made it easier to select a randomized name sample
from any list, so that mailers can run a test mailing to determine the response
from a list before "rolling out," or mailing, the entire list. Different packages
containing different offers can also be tested. Other media allow some degree of
testing, but direct mail is the most sophisticated
Direct mail is the most effective media for reaching a company's customer base,
which is likely to provide the best sales opportunities, thereby maximizing the
profit from a business's customer list. The only other advertising medium that
allows a marketer to reach its customers without any waste is telephone-based
selling.
In relation to the other direct marketing media, direct mail is considered to offer
the most cost-effective way of achieving the highest possible response. Only
80
telemarketing produces a higher response rate, but usually at a much higher cost
per response. An example of Mail is given below.
1) THE PHYSICIAN’S DIGEST
The physician‘s digest is a bi-monthly digest and is specifically designed for
practicing physicians. It is small handy magazine (100-150 pages) containing
valuable information on on-going and important issues concerning the discipline
of medicine. Medical practitioners find the information in the magazine interesting
and relevant to their clinical practice. It was first published in 1991 by a small firm
(turnover 2-3 crore) headed by a single entrepreneur, an MBA graduate from
Mumbai. In the first decade of its launch, the Digest has made significant
progress to become a national digest and has command over a good market
share.
The Marketing Campaign of Physician’s Digest
The Physician‘s Digest is marketed and circulated (distributed) to its subscribers
through ―Mail Direct Marketing‖. The Marketing campaign has 3 phases as given
below:
Phase I: An introductory mailer, inviting subscription for the magazine with an
incentive of a mystery gift for a subscription for a year. The mailer also gives a
brief note on the salient features of the digest and the benefits derived from
reading its content. The mailers are mailed to the target customers.

81
Phase II: Upon receipt of the mailer, the interest Physicians send the reply
coupon for a free gift and the subscription amount.
Phase III : The subscription is accepted by the Company and the digest is sent to
the customer Physicians through mail.
List of prospects:
The lists of prospects for the Physician‘s Digest are the Physicians, medical
practitioners who practice in public/ private hospitals or have private practice of
their own. The Physician‘s Digest is of benefit not only to doctors, but surgeons
i.e. graduate and post –graduates in medicine will benefit from the Digest.
Hence, the list of prospects to be sent to mailers is obtained from sources like
hospital, medical associations and national bodies like Medical Council of India
etc. The prospects are identified for the marketing campaign. Keeping in mind,
that a mail campaign generates only 2-5% of response, the target group is about
20-25 times the number.
It is also a known fact, that response to a mail campaign is slow, hence a lead
time of 1-2 months is kept, before beginning the subscription. Reminders are
sent to prompt more replies and each reminder gets about 10-15% of responses.
DESIGNING THE MAIL CAMPAIGN:
The entire mail campaign which includes the following procedure :

82
1. Generating ideas for the format of the mailing (the offer and its creative
expression)
2. Determining who should receive the mailing and when (the targeting
and timing)
3. Sending the letters via the post office / courier
4. Response handling and fulfillment of the completion of what was
promised to the customers.
Also, the above steps are handled in-house by the Marketing Department of the
firm. Management professionals of the firm design the mail campaign and also
plan, execute and control the campaign.
Editorship of the Digest :
A panel of Doctors drawn from all over India are on the editorial board of the
Physician‘s Digest. Articles are invited, as also some topics generated within the
firm, and are reviewed by the panel.
Television Shopping: Sale of products through the television in combination
with telephone to take orders and mail delivery, through Company‘s sales force
(direct) full or part time paid employees who work exclusively for the company
(Kotler, Keller & Lane 2004). In the last few years it has developed in the urban
area (metros, & cities & towns) where cable networks are established and paid
shopping channels are aired. The common products sold are imitation jewellery,

83
home appliances and hosiery, and gift articles. The advantage is the high
television density, and high teledensity which makes it easier for consumers to
place orders.
Response Advertising
Advertising of products given in the print news media namely newspapers,
magazines and other commercial newsprints .to create a direct response from
consumers to purchase the product. The advert consists of telephone numbers of
the company and through mail or telephone consumers can book order for the
purchase of products. Payment can be made on receipt of product.
Internet
A mesh of network of computers, through which communication can be set
worldwide (Sterne Prior 2000).of wireless technology e.g. mobile phones. The
number of mobile users in India has increased from 3 million in 2001 to 800
million subscribers at present (Ecotimes 2011), it is too early to predict its impact
as a medium for marketing products.
Internet: The new –Age media
Avenue for selling through the Internet using web sites to increase marketing
penetration and market diversification; also called e-retailing and internet retailing
(Danna, Nioleta Lascu 2009). Direct marketing has added a new channel to its

84
port folio i. e. the Internet. The new age marketing media stands at cross-roads
of a big revolution. There is no doubt that digital market media has a potential to
impact sales and make a dent in the economics of marketing in future. The first
wave known as the dot.com era of eye- ball chasing did not live to the
expectation. The second wave is supposed to change the past, largely due to the
manifold escalation in the internet users which have risen to a 100 million from a
mere 5 million on 2000. In the last decade technology has become cheaper,
accessible to many and very sophisticated. According to (Singh, Rajan, 2012)
advancement in technology has reduced start-up time for hosting a web-site from
a year in 2000 to only a month. In the last one year about 1000 digital businesses
have sprung up.
India‘s flag-ship e-commerce segment, the on-line travel segment made a
business of Rs. 25.000 crore in 2010, most of which is attributed to the Indian
Railways who pioneered e-ticketing in India and set the e-commerce ball rolling.
E-tailing in India is new and is in the phase of building a self-reliant base. Hence,
it should be cautions of the image it wants to build. Consumers perceive it a
media which offers products at rock-bottom prices. In the long run, this
perception will be difficult to holdfast. An image of offering good value for money
will hold in the long run. Market transactions on the net, like other direct
marketing methods are convenient, in the sense that transactions can be made
anytime (24x7) and from any part of the world in contrast to traditional marketing.
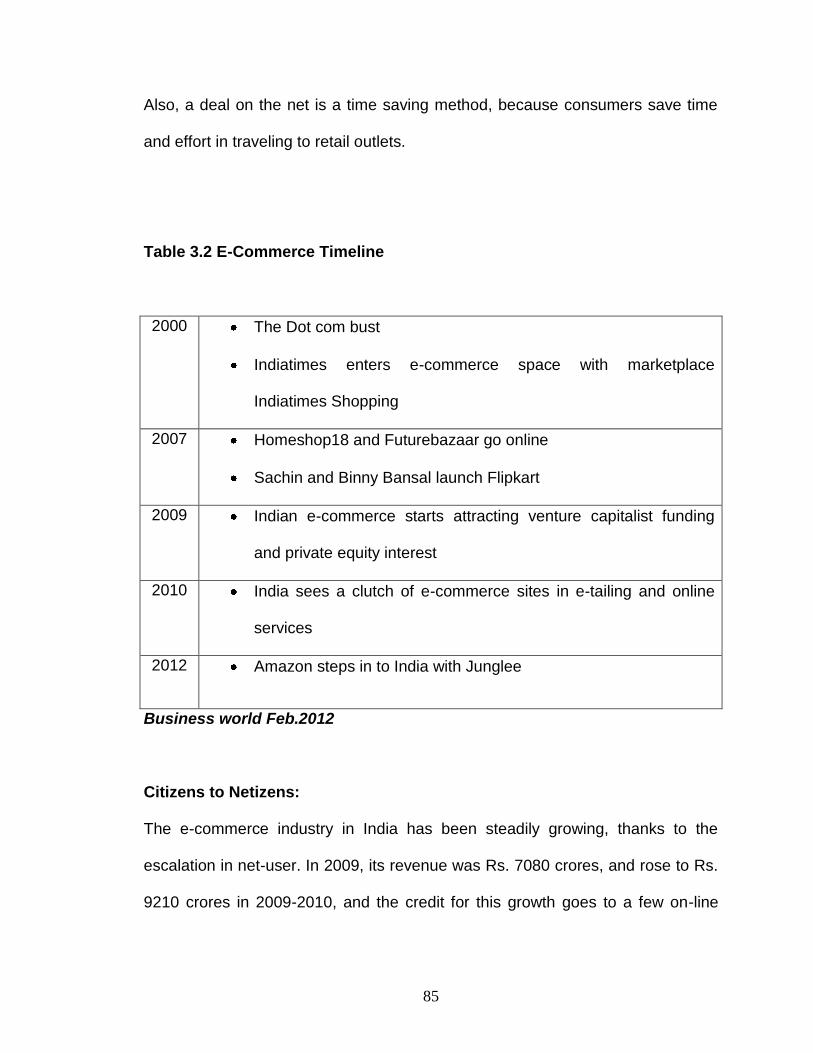
85
Also, a deal on the net is a time saving method, because consumers save time
and effort in traveling to retail outlets.
Table 3.2 E-Commerce Timeline
2000 The Dot com bust
Indiatimes enters e-commerce space with marketplace
Indiatimes Shopping
2007 Homeshop18 and Futurebazaar go online
Sachin and Binny Bansal launch Flipkart
2009 Indian e-commerce starts attracting venture capitalist funding
and private equity interest
2010 India sees a clutch of e-commerce sites in e-tailing and online
services
2012 Amazon steps in to India with Junglee
Business world Feb.2012
Citizens to Netizens:
The e-commerce industry in India has been steadily growing, thanks to the
escalation in net-user. In 2009, its revenue was Rs. 7080 crores, and rose to Rs.
9210 crores in 2009-2010, and the credit for this growth goes to a few on-line

86
set-ups that have made deep impacts on the net and the net users who are
steadily growing.
Users (millions)
Fig. 3.2 USERS AND USAGE, SOURCE: IAMAI, 2011
The popular products bought via the net are low-ticket e.g. books, railway tickets,
home appliances, toys, jewellery ; movie tickets; beauty products, health &
fitness products ; gifts articles ; sporting goods etc. At present, the on-line
industry is small in size, and net shoppers are enjoying the attention. But as the
business on the net increases, consumers will be besieged with unnecessary
product messages. At such times e-marketers will have to use SPT model
(segmentation, target, positioning), or micromarketing which is individualized
targeting. Presently shopping through the internet does not seem to be
convenient method. Money transactions on the net are unsafe but there are other
concerns also. An exclusive e-tailing consumer survey conducted by
(mouthshut.com 2012) found that 45% consumers had a shipment related
complaint; 19% consumers complained of poor service and bad customer
support.
5
32
100

87
According to (Shrutika Varma 2012) the e-tailers of India have adopted one of
the three global models; the market place model by e-Bay, which beings buyers
and sellers together, without delivery of products; the stock and sell model
(Amazon), where products are shipped to customer, and the model adopted by
Group on 2008 (gross billing) i.e. selling discounted coupon on services and
products. These models have proved to be successful globally and Indian e-
tailers have followed them.
Internet‘s role as a medium for product promotion classified, banners, e-mails
has been on an increase. In the table below the revenues from advertising could
be a thousand cores in a short time. Being an international media without any
boundary or control, the access of promotion on the net is worldwide. An
example of an internet company is given below.
Online ad spend ( cr)
Fig. 3.3 ONLINE ADVERTISING
* Figures are estimates SOURCE: IAMAI, 2011

88
1) Make my trip.com
Make MyTrip.com is the clear leader in the rapidly growing online travel space in
India. MakeMyTrip.com stands apart in an increasingly crowded Market place
due to a winning combination that brings together deep Experience in the online
travel business, a world class management team, a strong and well-established
network of fulfilment options and the ability to continually innovate as the market
leader.‖ MakeMyTrip.com was launched in the year 2000 for the booming USA to
India‘ travel market. It empowered NRIs with unmatched convenience of a 24x7
online travel portal and travel consultancy support. It was niche and hit early
success. Then it launched its operations in Indian in September 2005. With over
six years of profitability in real time booking of flights, hotels, holidays and car
rentals in the US, it had little problem in laying a successful foundation in India.
Since its inception, it has been growing at a fast pace to emerge as the foremost
travel website in the US to India market. MakeMyTrip.com commands a 4%
share of this NRI market, which is pegged at Rs. 4500 crores (USD 1 billion).
MakeMyTrip.com crossed Rs. 562 crores (USD 125 million) in current fiscal year,
which is approximately 180% growth from last year‘s registered sales of Rs. 200
crores (USD 42 million). They also acquired 1 million customers in 2007. The
projected turnover for 2007/2008 fiscal year ending March 2008 was Rs 1260
crores (USD 280 million), which is 124% growth from the previous year.
MakeMyTrip.com has enabled over one million people to travel with hundred
percent assurance of best deals possible.

89
Within a year of its launch MakeMyTrip.com has acquire over 250,000 delighted
customers and sells over 4000 flight tickets, 400 hotels room nights and over 100
holidays packages every day. The site attracts over 1.2 Million unique visitors
every month according to ebSideStory, Hbx Analytics, an independent traffic-
monitoring agency. In India MakeMyTrip.com has also partnered with ICICI to
power their TravelSmart Card, is providing travel services to HSBC credit card
customers, Visa and Kingfisher to service their travel offers and also power the
online flight auctions of GoAir and Kingfisher on the Rediff website.
Table. 3.2 Functions of MyTrip.com
Air Tickets Search compose and book tickets on any airlines,
including LCCs (Low Cost Carriers) and full service
airlines
Hotel
Reservations
Real-time booking of over 25,000 domestic and
international hotels at discounted tariffs
Car/Taxi
Booking
Book a car at special prices for airport transfers and
excursions
Holiday
Packages
Buy holiday packages within India or foreign holidays at
great prices
Road Trips Myriad options for motorable trips from all cities, with
interactive maps
Weekend
Breaks
Thousands of options for short stay holidays at all price
points

90
MICE The meetings, incentives, conferences and exhibitions
team provides a stellar service which has been testified
by over 200 corporate houses
3.6 Direct response Advertising :
Among the direct marketing methods mentioned about, there are a few which
have become very popular eg. Direct selling through company‘s agents or
distributors. Direct marketers found they could recruit agents or distributors with
little effort, and the sincerity by which these distributors carried on with sales of
products and recruiting further distributors with sincerity which was amazing. In
multilevel marketing, distributors (customers) came to attend the company‘s
regular meetings to provide knowledge about marketing of sales of products
regularly and with enthusiasm. For companies like Amway, Oriflame and
Tupperware which are international brands could recruit hundreds of distributors
to manage sales of products and network marketing for commission.
A few methods of direct marketing have however not been so popular. In direct
response advertising, consumers have to make the buying decision through an
advert in the media, either print or electronic media because there is no retail
presence in this method. According to, consumers are reluctant to buy through
these sources because misuse of direct marketing communication channels

91
could trigger consumer annoyance and concerns which may lead them to take
action to eliminate the causes. Unwanted direct marketing communication
messages may enhance the sense of loss of control in the minds of consumers.
According to (Breham1966) psychological reactants theory, it is helpful to
understand the relationship between add intrusiveness and the perceived loss of
control. The theory suggest that when individuals frequently act counter to
restrictions or pressures put upon them by external sources, they are likely to
react against threats or loss of freedom by acting in the opposite way intended by
the source. Breham has defined freedom as a ‗belief that one can engage in a
particular behaviour‘. In the case of direct marketing communication channels,
consumers may feel that marketers control his/her time, space, information and
security. In the context of consumer evaluations of response advertising,
consumers need to understand the company, it‘s products from a piece of
information, they may not understand in the context of making buying decisions.
In such cases, consumers could feel the lack of freedom and control in taking
decisions because of lack of choice. This has led many consumers to proclaim
that inappropriate advertising caused them distress.
Telemarketing :
This is a more dominant method of direct marketing being used by companies
to reach out to customers, it is through the medium of telephone. With high
teledensities in many countries, the medium of telephone is fastest and a
cheaper method of reaching out to customers. It is also a good medium of

92
building relationship with customers and seeking information on customer likes
and dislikes. They are very few studies how consumers define and evaluate
telephone interactions. According to(Li, H,& Edwards, Lee J, 2002),receiving
promotional calls on the telephone specially mobile phones can be considered an
interruption of task performance as by consumers as the phone is used for
specific purposes such as receiving or making business related important calls.
Consumers find the ringing of the phone while being engrossed in work a great
deal of disturbance, and may develop a negative feeling towards the source of
such calls.
According to the (Aaker & Bruzzone1985) frequent telephone calls could cause
―irritation ― among consumers, meaning negative, impatient and displeasing
feeling of individual consumers caused by various forms of advertising stimuli
The cause of irritation is represented by various criticism on advertising such as
targeting the wrong audience , manipulative messages, misplacements of ads,
excessive repetition within a short time, and forced exposure. On the basis of the
above inferences (Fennis & Bakker,2001)have suggested that the higher the
customer‘s perceived sense of being intruded on and irritation related to
telemarketing calls, the less likely he/she is to respond favorably to such calls.
Privacy Issues in Direct Marketing:
Direct Marketing reaches consumers through one of the channels mentioned
earlier. Among then, is telephone and mail which are personal channels of

93
communication. Consumers are unhappy, if they get telephone calls with market
managers often. They find it intruding into their private lives. In the research
paper managerial & consumer attitudes about information privacy, (Alexander J.
Campbell 1997), says that business using direct marketing as the basis upon
which to engage in relationship building must proceed in a manner that
acknowledges and minimizes consumer concern about privacy. There are other
concerns which relate to private information about consumer, e.g. Income,
residential status and occupation. Consumers are not forthcoming in parting with
information on these issues. (Mary Culnan 1995), says that providing consumers
an opportunity to remove names from mailing lists is one method for addressing
rising consumer concerns about privacy. Consumers are aware of the number of
mailers; they receive from single market offers. The wastage of paper turns into
environmental issue. Direct marketers need to address these environmental
issues.
Future of Direct Marketing:
The future of direct marketing rest on the effort by direct marketers. According to
(Vincent Copp, 1997), in reinventing direct marketing ,the future of direct
marketing receive much attention in trade journal and discussion at conferences,
yet its future remains vague there are misconception about the direct marketing
for e.g. issues concerning pricing of products as also environmental issues that
need to be overcome to launch it into the next generation. Increasing cost,
competition and consumer skepticism present serious challenges to the growth

94
of direct marketing. The authors say that future success of direct marketing firms
rests with their ability to exploit their inherent competitive advantages. They
further explain that if companies target very specific groups of customers (Need
based segmentation) with individualized marketing programs, direct marketing
will be more successful.
Consumer and marketers around the world are embracing the internet and online
Marketing, (McDaniel/Lamb/ Hair 2007). According to (G. Varma 2005) the
internet provides direct access to marketers and consumers to solve problems
and provide feedback. One drawback is number of fraud claims are not keeping
pace with the growth.
Research Gap:
Though there are many studies on the importance of Indian market and the
Indian consumer in the light of globalization, no undertaken research exists to
explore the possibilities of extending the depth of direct marketing and effects of
direct marketing in Indian context.

95
Objectives & Hypothesis

96
CHAPTER 4
OBJECTIVE AND HYPOTHESIS
4.1 Research Problem:
The Indian consumer is changing rapidly to-wards becoming a global consumer.
Rising income levels and education have fuelled a desire for the best living the
world can offer them. Good entertainment, good living, good travel and good food
are indicators of the life- style of the wealthy. These shape the wants and desires
of the people. There is a strong desire for good innovative products.
Modern Indians have high disposable incomes but, due to work and other
commitments many do not have the time & leisure to fulfill their desires. They do
not have enough time for traditional marketing which requires them to visit
traditional retail outlets to make purchases and satisfy their needs. Therefore
they are on the lookout for easy ways of shopping. Direct marketing are
convenient and time-saving methods for making market transactions.
It is a market strategy that does not use the formal retail chain rather going direct
to consumers. Through, direct marketing consumers can view the products,
inquire about them and also buy them in the environs of home or office at a
convenient time. The direct marketers in India offer unique products of
international quality and at competitive rates. Some direct marketers are
international companies who offer products of international brands. Products

97
offered through direct marketing are generally in the household category which
includes tableware, store ware, cosmetics, non prescription health food and
detergents. A few products in this category have good demand because of the
absence good quality products. Moreover direct marketers deal directly with
consumers and therefore are believed to have strong on-going relations with
consumers. The rapport between the consumer and direct marketer is strong
enough to provide convenient market transactions for mutual benefit.
Direct marketers have been in the Indian markets for about one and half
decades. Yet its progress in the last two decades has not been significant.
According to the report of the Direct Marketing Association of India (2010), only
4-5 % of total retail sales were contributed to direct marketing. Why are sales
through direct marketing not improving?
What is the acceptance level of direct marketing in the Indian Market?
How strong are the relations between the consumer and direct marketers?
How do consumers perceive the benefits provided by direct marketing?
The reasons need to be identified, if direct marketing wants to be a relevant
marketing strategy in the Indian environment.

98
4.2 The research objectives
The study is with respect to household products. The research objectives are as
follows
To study helpfulness of direct marketing to build relations and create
loyalty among consumers.
To study convenience to make buying decision at home or office by
consumers.
To study the effect of direct marketing as a time saving method of market
transaction.
To Study effect of sales agent of direct marketing with respect of high
credibility and finding prospects.
To study after sales service with respect to direct marketing and to find if
consumers are satisfied by the process.
To study the effect of the process of direct marketing upon the privacy of
consumers.
To study direct marketing provides good customer care.
To study the effect of demographic factors on relation building in direct
marketing.
To study if direct marketing is equally convenient method for various
demographic factor

99
4.3 Statement of hypothesis:
H01: Direct marketing does not help to builds relations and create loyalty among
consumers.
H11: Direct marketing helps to builds relations and create loyalty among
consumers.
H02: Consumers do not find direct marketing to be a convenient method to make
buying decisions.
H12: Consumer find direct marketing convenient to make buying decisions.
H03: Direct marketing is not a time saving method of market transaction.
H13: Direct marketing is a time saving method of market transactions
H04: The sales agents of direct marketing do not have high credibility and are
not able to find prospects.
H14: The sales agents of direct marketing have high credibility and are able to
find prospects.
H05: Direct marketing intrudes upon the privacy of consumers.
H15: Direct marketing does not intrude upon the privacy of consumers.
H06: Direct marketing does not provide good customer care.
H16: Direct marketing provides good customer care.

100
H7: Direct Marketing does not provide good after sales service to consumers
H17: Direct Marketing provide good after sales service to consumers
H8: The products sold through direct marketing are not good in quality and
utility
H18: The products sold through direct marketing are good in quality and utility
H09: The consumers are not satisfied with products bought through direct
marketing
H19: The consumers have satisfaction with products bought through direct
marketing
H010: There is no impact of demographic factor to build relations and create
loyalty in direct marketing.
H110: There is impact of demographic factor to build relations and create loyalty
in direct marketing.
H11: Direct marketing is not equally convenient method for various demographic
factors.
H011: Direct marketing is equally convenient method for various demographic
factor.

101
4.4 Importance of the research
This research has sought to identify the factors which make direct marketing a
relevant strategy in the Indian marketing environment. An endeavor has been
made to study the impact of the characteristics of direct marketing on the Indian
consumer. The study gives a consumer‘s view point on direct marketing. The
research is expected to help direct marketers in particular, but also traditional
marketers and retailers by providing reference literature for them to take
decisions.

102
Research Methodology

103
CHAPTER 5
RESEARCH METHODOLOGY
The study entails both qualitative and quantitative research approaches. The
sources of data required for the completion of the study included primary and
secondary data sources.
Secondary data sources were collected from various Text books on the title
subjects. Journals, research papers published in reputed Indian and international
Journals as well as Annual reports were referred .Data was also collected from
authentic sources on the Internet. The research packages namely EBSCO,
Proquest, Amazon and the annual report of the Direct Marketing Association of
India became a part of secondary data sources.
After the identification of gaps and the finalization of research objectives a
questionnaire was prepared for a pilot study. The questionnaire was
administered to a small group of consumers to obtain an initial opinion and to
decide the relevant factors to be taken into consideration to get the desired result
in consonance with the objectives of the study. Later, the information gathered
from the pilot scale study and the findings from the literature review were used to
prepare a final questionnaire to be used for the purpose of the research study.
Data was collected through a structured questionnaire administered to the
sample of respondents from the metros of Maharashtra.

104
5.1 Instrument development and measures
Given the objectives of the study, the research instrument was developed to
measure:
A) The demographic profile of respondents which included
1) ‗Age
2) Location
3) Marital status
4) Education
5) Income
6) Residential address
7) Level of awareness of direct marketing
8) Ranking of direct marketing methods
B) The other part of the questionnaire comprised of statements used to obtain
the opinion (attitudes) on specific issues (objectives of the study) of direct
marketing, which were defined as ten variables as follows:
1. Building relations & creating loyalty
2. Convenience of shopping from home or office.
3. Time saving method of market transactions.
4. Sales agents and distributors have high credibility.
5. Intrudes upon privacy
6. Customer care service

105
7. After sales service
8. Products good in quality &utility
9. Consumer satisfaction
10. Exposure to new products
The pilot stage used a large number of items for each scale. These were
reduced on the basis of the pilot test results to the instrument that was used for
the final data collection.
The following table gives the ten groups formed, each representing a factor for
effect of direct marketing on consumers and the statements in the questionnaire
that represent these factors:
Table 5.1 Factors of Direct Marketing
1. Group 1 Building Relation and Creating Loyalty
Qs. 1, 13, 19, 32, 37, 42
2. Group 2 Convenient Method
Qs.11, 17, 42
3. Group 3 Time Saving
Qs. 15, 16, 18, 20, 21
4. Group 4 High Credibility
Qs.12, 23, 30
5. Group 5 Intrudes upon Privacy

106
Qs. 24, 25, 26, 27, 31, 35
6. Group 6 Customer Care Service
Qs. 14, 33, 46
7. Group 7 After Sales Service
Qs. 45, 47, 48
8. Group 8 Products good in Quality and Utility
Qs. 38, 39, 43
9. Group 9 Consumer Satisfaction
Qs. 29, 34, 41, 44
10 Group 10 Exposure to New Products
Qs. 22, 28, 36
Scale Development
The questionnaire consisted of two parts. The first part of the questionnaire was
designed to obtain demographic profile of the respondents. It comprised of the
following scale.
1) Nominal Scale:
Nominal scale was used to obtain information on Qs.. 1,2,3,4, 5, 6, 7 & 8.
2) Ordinal Scale:
The questions 8, was designed to obtain level of awareness of the direct
marketing methods which was through ranking of the methods, hence ordinal

107
scale was applied. Similarly, question No. 9 was also ranking and ordinal scale
was used.
The second part of the questionnaire was designed to elicit the attitudes of
respondents to the ten variables (ten factors) of direct marketing. Hence the
questionnaire consisted of statements, whose response could best be obtained
through ―Summated Scales‖ (Kothari 2004) and the six point Likert scale was
used so that the data obtained could be analyzed through regression factor
analysis.
The following Likert scale was used:
1) Strongly agree
2) Agree
3) Somewhat agree
4) Somewhat disagree
5) Disagree
6) Strongly disagree
5.2 Pilot Test:
Since the study involved the evaluation of factors which describe the attitudes
towards direct marketing by the respondents, a proper review of the
questionnaire was made and a preliminary examination (pilot test) of the

108
questionnaire was conducted before data was collected by self administration to
the respondents. The purpose of the test was:
1) To identify any scales that were difficult to comprehend or had redundant
items and revise them prior to conducting the survey on the respondents.
2) For reliability testing.
3) For testing the correctness of the scales of measurements and validity
evaluation.
4) Calculating the variability of population under survey.
5) Refine the questionnaire to cover indirect questions covering the purpose
of data collection at the same time not putting pretentious or overloaded
questions before the respondents.
Research scholars, consultants, and eminent faculty in the field and renowned
management institutes were involved in the pilot study phase on request of the
scholar. Since the questionnaire was to be administered to respondents who
were consumers of direct marketing, it became necessary to test it on a similar
group of respondents, bearing in mind the level of understanding of the subject
and the questionnaire.
Hence, the pilot group also consisted of respondents who were consumers of
direct marketing. About 200 respondents constituted the sample group who were
administered the questionnaire. Faculty and consultants from whom academic
inputs were required also formed part of the group.

109
Suggestions received during the pilot study included framing a few of the
statements and adding a few new statements to get a better in sight on the issue.
According to the suggestions given, the questionnaire was revised to include the
suggestions. After ensuring that validity and reliability were adequate a few
categories of factors were reduced to 8 categories consisting of 25 relevant
factors for the study. This involved testing the dimensionality for all factors using
factor analysis. This practice of reducing and refining the factor items has been
used by many former researchers during the scale development process. Due to
large size and widely scattered of population, sampling was decided upon and a
representative sample was obtained to reflect the characteristic of the population.
Second Phase
The questionnaire finalized after phase I was tested on some known respondents
at Mumbai which was one of the metros in Maharashtra and also in the sampling
frame of the study, to identify if the questionnaire suffered any drawbacks and if
any question required re- framing. Reliability tests gave acceptable results and
indicated that factors must be measured on the 5 pt. Likert scale, to obtain
intensity of the attitude of the respondent.
5.3 Validity and Reliability:
Validity:
Based on the literature review and followed by the pre-test survey (phase I) items
were generated to operationalise the variables under study. A measure is

110
considered valid to the degree it really does measure what it is intended to
measure. The internal validity can be discussed as under:
1) Face validity or content validity
2) Construct validity
3) Criterion validity
4) Measurability (Copper & Schindler, 2003)
Face Validity
The face validity or content validity of a measuring instrument is the extent to
which it provides adequate coverage of the investigative questions guiding the
study. Determination of content validity is judgmental and can be approached in
many ways (Cooper and shindler, 2003).In this study, the first step involved a
careful investigation of the attributes of direct marketing that are important in
attitude building of consumers and the factors to be scales and the scales to be
used. Further, these factors were evaluated through conducting a screening
exercise or judgmental method.
Reliability:
The questionnaire gave consistent results in the pilot study under repeated
measurements, and the stability of the instrument determined. The responses
were collected largely by the investigator (scholar) and other well- trained staff,

111
hence the error occurring because of respondent characteristics were kept to the
minimum.
5.4 Sampling Design
The study was carried out in three main cities Maharashtra namely (a) Mumbai
and (b) Pune and (c) Nagpur. For better representation of sample, the metro city
of Mumbai was divided into six divisions, according to the six parliamentary
constituencies (mentioned in the economic survey of Maharashtra 2009-10).
Pune and Nagpur were each taken as a single constituent, because of the
scattered distribution of direct marketing; hence collective sample of 500 and 250
was taken. The total sample was 2000, collected through stratified random
sampling.
Table 5.2 Sample Size
Metro Population Sample Size
Percentage
Mumbai 16 m. (Approx) 1250 0.001
Pune 5,064,700 (lacs.) 500 0.010
Nagpur 2,420,000 (lacs.) 250 0.01033
Total 2000
Sampling Frame: The population to draw the sample was provided by the
distributors or company‘s agents. The lists of consumers became the population
frame for the study. Though the population of the metro cities of Pune and

112
Nagpur was large the population of direct marketing consumers was less and
random sampling was decided upon.
5.5 Sample Size
The sample was drawn using the Sample size calculator which is presented as a
service of Creative Research Systems survey software. The sample size was
calculated using the formula as under:
Sample Size = Z2 × (p) × (1-p) C2
= 2000
Where:
Z = Z value (e.g. 1.96 for 95% confidence level)
p = percentage picking a choice, expressed as decimal
(.5 used for sample size needed)
c = confidence interval, expressed as decimal
(e.g., .04 = ±4)
Sample size and actual sample:
The sample size according to the formula was 2000 respondents. The actual
sample collected for the study was about 2100, hundred more than the sample
size to account for errors in questionnaires and also non-responses. About 70
questionnaires were discarded because of errors and the actual numbers of
questionnaires taken or the study were 2030.

113
Data Collection
The data collection phase was the most important in the study and took the
maximum time. It consisted of the collection of primary data to evaluate the
attitude/perception of direct marketing from consumers of metros in Maharashtra.
Therefore the data collection phase was very important and crucial for the
outcome of the study. The data collection phase had to be designed considering
the vast data to be collected.
The following had to be kept in mind while beginning the data collection phase:
Sample Size: About 2000 respondents.
Unit of analysis: Respondent who is Individual resident and a Consumer of
direct marketing.
Location of Investigation: Metros in Maharashtra namely (i) Mumbai
(ii) Pune (iii) Nagpur
Type of data to be collected:
The research ―tool‖ was a well designed questionnaire which had about 48
questions. The questionnaire had two broad parts:

114
Part A: The first part of the questionnaire consisted of questions designed to
obtain demographic people of the respondents. This has reference to
demographic and socio-economic characteristics of respondents, i.e. age, sex,
education, monthly income, marital status, number of children etc.
Part B: The other part of the questionnaire consisted of about 38 statements
which would gather the respondent‘s attitude on direct marketing. Each
statement was made to represent the variable which would answer the research
objectives of the study. The statements were simple enough, to be understood by
the respondents in the right perspective to answer the goals of the study.
Response Format: The response format for collection demographic profile of the
respondents had one response space, broad categories for putting the
answers/the questionnaire had a 6–pt Likert Scale response format. It ranged
from strongly agree to strongly disagree. Respondents had to put s (V) against
the answer of their choice.
5.6 Schedule of Data Collection:
The questionnaire was to be administered to the selected respondents in the
three metro cities of Maharashtra as follows:

115
Table 5.3 Respondents in Metros
City No. of Respondents
Mumbai 1250
Pune 530
Nagpur 250
*Total 2030
The data collection schedule was planned in three phases, coinciding with the
three metros. The phase of collection from Mumbai was the largest and took
several months. The data collection phase of Pune and Nagpur extended for
about 3-4 months because a number of visits had to be made as respondents
were in pockets at locations away from each other.
5.7 Approach to primary data collection:
The primary data ( primary data refers to information from consumers that has
been gathered specifically to serve the research objectives of the research
study) for the survey was obtained by means of data collection from the
consumers who had made product purchases through the use of direct marketing
methods. There was a choice of two approaches to gather primary data. The
researcher can observe behavior, events, person or processes by watching the
respondents in a disguised form where the respondents do not know about the
presence of the researcher, and a record of the consumer‘s observation is data
collected, or the other option is, data can be gathered through communication

116
with the people on the specific topic. In this method there are three
communication modes to gather primary data namely (1) Personal interviewing:
In this method the researcher collects data through a face –to face personal
interview he takes of each respondent 2) Telephone interviewing : personal
interviews are taken through the telephone and (3) self- administering surveys: In
cases w ere the respondents are many and are scattered and the information to
be obtained is large then the survey method is most convenient.
The Survey Method:
The survey method was the most appropriate data collection method, because
the respondents were about two hundred in number and the data to be obtained
was large. It is a method of data collection through the use of questionnaire, and
recording their responses for analysis. The main advantage of the method is its
versatility, i. e. its usage in a number of research situations, and its ease of
administration and data collection from large samples of the population. It can be
standardized i.e. all responded reply to the same questions, having same
response options.
The survey method was the most appropriate to elicit primary information, as the
respondents are scattered, and required convenience to fill the questionnaire.
The survey was conducted, through self–administered questionnaire. A self –
administered survey is one in which the researcher conducts the survey by

117
administering the questionnaire to each respondent and collecting the filled
questionnaire by each respondent.
5.8 Analysis of the data
The analysis of the data was the next step after the entire data was collected.
The completed questionnaires were edited to assure that the data is accurate
and consistent. The data obtained from the questionnaire was coded and
recorded on the excel spread sheet.
Next, the data was coded into a limited number of categories .There were two
types of data collected (i) Descriptive data , which refers to the demographic data
and (ii)Data on ―attitude measurements‖, collected through 6 point likert scale.
The analysis therefore involved the two major areas of statistics, and according
to (kothari2004), these are Descriptive statistics and Inferential statistics also
known as sampling statistics concerned with estimations and testing of
Hypothesis.
The study involved, measuring relations between the factors of a bivariate
population. The study involved finding, association or correlation between the
concerned variables. Therefore the following methods of analyzing correlation
ships were applied to the data:

118
a) Cross-Tabulation, It was used to find the relation between variable was
symmetrical or reciprocal.
b)Karl Pearson‘s coefficient of correlation, It was used to acertain if the relation
between variables was linear, casually related or were independent.
Pearson’s (r) = ? (X – X) (Y – Y)
_____________
(N – 1) Sx Sy
c) Regression factor analysis,
Interpretation: -
The analyzed data were finally interpreted statistically via SPSS to draw the
inferences, which were reported as findings. From the findings, broad
conclusions were drawn on the research objectives of the study and the findings
of the survey.
5.9 Limitations of the study:
The sample for this research was based on the respondent of a specific state in
India, Maharashtra. The study was confined to respondents of the two metro
cities in Maharashtra namely Mumbai and Pune and Nagpur. The penetration of
direct marketing in Nagpur, the third largest city in Maharashtra was enough to
cover the sample size; hence Nagpur was also included in the sample. The

119
presence of direct marketing in the other cities in Maharashtra was not big
enough to solicit presence in the sample.
Though the sample size was large, it was restricted to the geographical areas of
three main cities of Maharashtra; hence Pune a major limitation to the extent that
this sample can be projected to other states in India or the entire Indian Market.
Similarly research studies are required to assess the general liability of these
findings to other Indian customers at large. The study is focused on household
products and the general methods of direct marketing. Thus, although the results
of the study provide insight into the general willingness and attitudes of
customers towards direct marketing, the attitudes may vary with other products
and services.

120
Analysis of Data
and
Findings

121
CHAPTER 6
Analysis of Data
For the analysis of data about study of ‗Direct Marketing‘ information is collected
through questionnaire method. List of questions in systematic ordered is given to
the respondents for collection of data. Information is collected for following
demographic factors.
1. City
2. Qualification
3. Age Group
4. Gender
5. Number of Members
6. Number of Children in Family
7. Employment
8. Monthly Income
6.1 Description of the sample
1. City of Respondent: There are total 2030 respondents. Information about
Their city of residence is collected. These respondents are mainly from three

122
cities, Mumbai, Nagpur and Pune. Classified information of respondents is given
in the following table.
Table 6.1: Sample Description
City Number of Respondents Percent
Mumbai 1250 61.6
Nagpur 250 12.3
Pune 530 26.1
Total 1206 100.0
Above table indicate that out of total 1206, maximum 426 respondents are from
Mumbai, and Minimum 200 from Pune. Above Information is presented using pie
diagram as given below.
Diagram of Respondents according city
1250250
530
Mumbai
Nagpur
Pune
Figure 6.2 Pie chart of Sample Description

123
2. Qualification of Respondents: To study effect of qualification on ‗Direct
Marketing‘ Information about qualification is collected. Classified information is
presented in the following table.
Table 6.3 Education
Qualification No. of Respondents Percent
SSC 94 4.6
HSC 119 5.9
Graduate 971 47.8
Post graduate 641 31.6
Professional 194 9.6
Doctorate 11 .5
Total 2030 100.0
Above table indicate that out of total 2030 respondents, 94 respondents have
qualification up to SSC. 119 respondents are qualified up to HSC. 971
respondents are Graduate where as 641 respondents are post graduate. 194
respondents are professional and remaining 11 respondents are from category of
Doctorate.
Above information is presented using pie-diagram presented as given
below.

124
Diagram of respondents according to Qualification.
94119
971
641
194 11
SSC
HSC
Graduate
Post graduate
Professional
Doctorate
Figure 6.4 Pie chart Education
3. Age group of Respondents: To study association of age on ‗Direct
Marketing‘ information about age of respondent is collected. Respondents are
classified in to three categories. Respondent of age 30 years and less is
classified in to first group known as ‗Young Respondent‘. Respondent of age 31
to 45 years is classified in to second group known as ‗Middle Age Respondent‘.
Respondent of age above 45 years is classified in to third group known as ‗Elder
Respondent‘.

125
Table 6.5 Age Group
Age group Frequency Percent
Young Age 1154 56.8
Middle Age 630 31.0
Elderly Age 246 12.1
Total 2030 100.0
Above table indicate that out of total 2030 respondents, 1154 respondents are
from of ‗Young Age group‘, 630 respondents are from ‗Middle Age group‘ and
remaining 246 respondents are from ‗Elderly Age group‘.
Above information is presented using pie-diagram.
Diagram of respondents according to Age group
1154630
246
Young Age
Middle Age
Elderly Age
Figure 6.6 Age Group

126
4. Gender of Respondents: To study impact of gender on direct marketing
information about gender of respondent is recorded, classified and presented in
the following table.
Table 6.7 Sex
Sex Frequency Percent
Female 971 47.8
Male 1059 52.2
Total 2030 100.0
Above table indicate that out of total 2030 respondents, 971 respondents are
female and remaining 1059 respondents are male. Above information is
presented using pie-diagram.
Diagram of respondents according to Sex
9711059
Female
Male
Figure 6.8 Sex

127
5. Employment of Respondents: Information about employment of respondents
is obtained.
Respondents are classified in to four categories. These categories are Service,
Business, Retired and House wife. Information about employment of respondents
is presented in the following table.
Table 6.9 Employment status
Employment status No. of Respondents Percent
House wife 220 10.8
Service 1462 72.0
Business 306 15.1
Retired 42 2.1
Total 2030 100.0
Above table indicate that out of total 2030 respondents, 220 respondents are
house wife. 1462 respondents do service where as 306 respondents do business
and remaining 42 respondents are retired.
Above information is presented using pie-diagram.
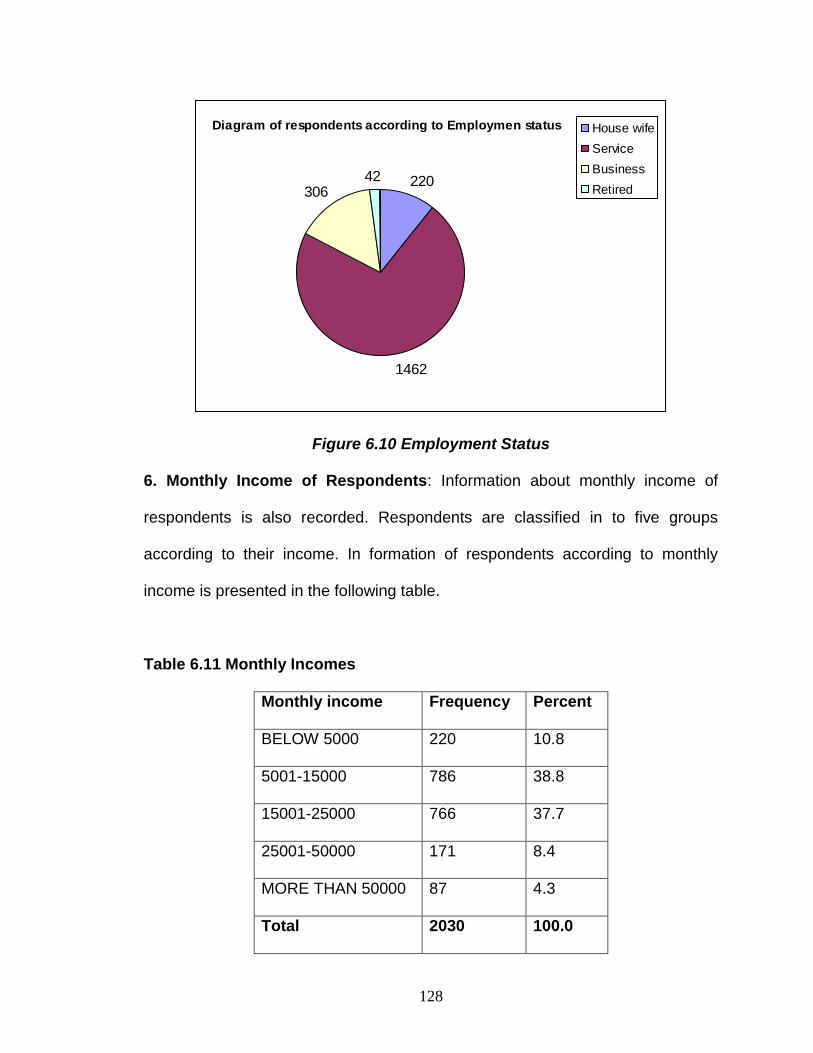
128
Diagram of respondents according to Employmen status
220
1462
30642
House wife
Service
Business
Retired
Figure 6.10 Employment Status
6. Monthly Income of Respondents: Information about monthly income of
respondents is also recorded. Respondents are classified in to five groups
according to their income. In formation of respondents according to monthly
income is presented in the following table.
Table 6.11 Monthly Incomes
Monthly income Frequency Percent
BELOW 5000 220 10.8
5001-15000 786 38.8
15001-25000 766 37.7
25001-50000 171 8.4
MORE THAN 50000 87 4.3
Total 2030 100.0

129
Above table indicate that out of total 2030 respondents, 220 respondents are
house wife. 1462 respondents do service where as 306 respondents does
business and remaining 42 respondents are retired.
Above information is presented using pie-diagram.
Diagram of Respondents According to Monthly Income
220
786766
17187
BELOW 5000
5001 - 15000
15001 - 25000
25001 - 50000
MORE THAN 50000
Figure 6.12 Monthly Incomes
8. Number of Members in Family of Respondents: To understand impact
of Number of Family members on ‗Direct Marketing‘ relative information is
collected, classified and presented in the following table.

130
Table 6.13 No. of members in family
No. of members in family No. of Respondents Percent
One 190 94
Two 866 42.7
Three 371 18.3
Four 335 16.5
Five 211 10.4
Six 57 2.8
Total 2030 100.0
Above table indicate that out of total 2030 respondents, 190 respondents are
from category of only one member in family. 866 respondents have two members
in family. 371 respondents have three members in family. 335 respondents are
from category of four members in family and remaining 211 and 57 respondents
have five and six members in family respectively.
Above information is presented using pie-diagram.

131
Diagram of Respondents according to No. of members in
family
190
866
371
335
21157
One
Two
Three
Four
Five
Six
Figure 6.14 Pie Chart of Respondents according to No. of members in
family.
9. Number of Children in Family of Respondents: Information about
number of children in family is also collected. This information is classified and
presented in the following table.
Table 6.15 Children in family
Children in family No. of Respondents Percent
Zero 761 37.5
One 676 33.3
Two 360 17.7
Three 179 8.8
Four 54 2.7
Total 2030 100.0

132
Above table indicate that out of total 2030 respondents, 761 respondents do not
have children. 676 respondents have only one child. 360 respondents have two
children. 179 respondents are from category of three children in family and
remaining 54 respondents have four children.
Above information is presented using pie-diagram.
Diagram of Respondents according to No. of members in
family
190
866
371
335
21157
One
Two
Three
Four
Five
Six
Figure 6.16 Pie Chart of Respondents according to No. of Children in family
The general and demographic facts of the respondents covered under the study
are tabulated above. It reveals important information about the respondents
which could help in the validating of the hypothesis, as well as draw conclusions
about the impact of demographics and socio-economic factors of respondents on
direct marketing.

133
The observations of the respondents are chiefly from the top most cities of the
state of Maharashtra. Maximum respondents of the survey are from the metro
city of Mumbai which has a high concentration of consumers who partronise
direct marketing. It is revealed from the above analysis that direct marketing is
preferred by educated respondents namely graduates; post- graduates and
professionals. According to the study, 47.8% of respondents were graduates;
and about 31.6% of the respondents were post-graduates. This analysis signifies
that direct marketing is a strategy whose attributes are well understood by the
educated class.
The data analysis reveals interesting facts about the age of the respondents, who
have bought products of direct marketing. 56.8% of respondents were from
young age group; whereas 31% were from middle- age group. This indicates that
the young age group is a more ardent customer of direct marketing. It also
indicates that the products marketed through direct marketing have appeal to-
wards the younger age-group of consumers. It also implies that the younger
classes of consumers have high market knowledge and are quality and brand
conscious.
Another interesting fact from the study is that 72% of respondents were from
public and private service sector, indicating that the strategy has a lot of benefit
to this segment of consumers who are ―time-strained‖, and therefore lack the

134
enthusiasm for frequent trips to traditional retail outlets for products which are
otherwise available through direct marketing.
Personal background, among which income is a big factor becomes an important
indicator for the usage of direct marketing. Though consumers from all income
groups are consumers of direct marketing the income group of Rs. 5001-15,000
and Rs. 15,001-25,000had 38.8% and 37,7% of respondents respectively. This
analysis indicates that direct marketing has many top-income customers who
appreciate international brands and good quality products. The responses from
age and income become good indicators to conclude that top income groups and
younger customers are more ―experiential‖ in trying new methods of buying
products.
6.2 Variables of Direct Marketing:
For detail study of direct marketing TEN variables are designed. For the study of
each variable questions related to variable are asked to respondents. From the
response of these respondents score is calculated using formula given below.
Sum of scores of all questions in the variable
Score of Variable = ------------------------------------------------------------------ x 100
Maximum score of all questions of that variable

135
These scores are used to validate hypothesis. List of TEN variables are as
follows:
1. Building Relation and Creating Loyalty.
2. Convenient Method.
3. Time Saving.
4. High Credibility.
5. Intrudes On Privacy.
6. Customer care Service.
7. After sales service.
8. Quality and Utility of Service.
9. Consumer Satisfaction.
10. Exposure to New Product.

136
1. Customer Building Relation and Creating Loyalty:
To understand contribution of customer building relation and creating loyalty in
direct marketing FIVE questions are asked through questionnaire. Response to
these questions is recorded using six points likert scale. Information about
question numbers related to first variable and response of all 2030 respondents
is presented in the following table.
Table 6.17 Frequency distribution of Customer Building Relation /
Customer Loyalty
Question
No
Strongly
Disagree
Disagree Somewhat
Disagree
Somewhat
Agree
Agree Strongly
Agree
Total
Que-13 61 44 359 795 585 186 2030
Que-19 31 345 348 478 527 301 2030
Que-32 115 134 198 676 634 273 2030
Que-37 23 104 715 629 392 167 2030
Que-42 463 77 463 589 483 318 2030
Response of the questions is rated as follows:
Strongly Disagree = 1
Disagree = 2
Somewhat Disagree = 3
Somewhat Agree = 4
Agree = 5
Strongly Agree = 6

137
After appropriate rating it observed that minimum score is 33.33 and maximum
score is 100. Average (Arithmetic Mean of) score is 67.10 and standard
deviation is 12.25
2. Convenient Method
To study convenient method in direct marketing THREE questions are asked
through questionnaire. Response to these questions is recorded using six points
likert scale. Information about question numbers related to first variable and
response of all 2030 respondents is presented in the following table.
Table6.18 Frequency Distribution of Convenient Method
Question
No
Strongly
Disagree
Disagree Somewhat
Disagree
Somewhat
Agree
Agree Strongly
Agree
Total
Que-11 3 39 47 376 704 861 2030
Que-17 70 61 186 432 703 578 2030
Que-40 64 207 511 541 440 267 2030
After appropriate rating it observed that minimum score is 38.89 and maximum
score is 100. Average (Arithmetic Mean of) score is 76.21 and standard
deviation is 13.45.

138
3. Time Saving:
To understand Time saving in direct marketing FIVE questions are asked through
questionnaire. Response to these questions is recorded using six points likert
scale. Information about question numbers related to first variable and response
of all 2030 respondents is presented in the following table.
Table 6.19 Frequency Distribution of Time Saving method
Question
No
Strongly
Disagree
Disagree Somewhat
Disagree
Somewhat
Agree
Agree Strongly
Agree
Total
Que-15 03 172 315 415 781 344 2030
Que-16 25 108 270 419 734 474 2030
Que-18 259 148 259 458 688 465 2030
Que-20 40 65 263 404 670 588 2030
Que-21 21 87 177 493 757 495 2030
After appropriate rating it observed that minimum score is 36.67 and maximum
score is 100. Average (Arithmetic Mean of ) score is 75.89 and standard
deviation is 12.99.

139
4. High Credibility:
To study High Credibility THREE questions are asked through questionnaire.
Response to these questions is recorded using six points likert scale. Information
about question numbers related to first variable and response of all 2030
respondents is presented in the following table.
Table 6.20 Frequency Distribution of High Credibility
Question
No
Strongly
Disagree
Disagree Somewhat
Disagree
Somewhat
Agree
Agree Strongly
Agree
Total
Que-12 52 39 306 541 803 289 2030
Que-23 45 103 366 673 580 263 2030
Que-30 99 199 406 587 511 228 2030
After appropriate rating it observed that minimum score is 22.22 and maximum
score is 100. Average (Arithmetic Mean of ) score is 69.69 and standard
deviation is 14.25..
5. Intrudes On Privacy:
To understand Intrudes on Privacy in direct marketing SIX questions are asked
through questionnaire. Response to these questions is recorded using six points
likert scale. Information about question numbers related to first variable and
response of all 2030 respondents is presented in the following table.

140
Table 6.21 Frequency Distribution of Intrudes on Privacy
Question
No
Strongly
Disagree
Disagree Somewhat
Disagree
Somewhat
Agree
Agree Strongly
Agree
Total
Que-24 03 172 315 415 781 344 2030
Que-25 25 108 270 419 734 474 2030
Que-26 259 148 259 458 688 465 2030
Que-27 40 65 263 404 670 588 2030
Que-31 21 87 177 493 757 495 2030
Que-35 37 158 232 658 545 400 2030
After appropriate rating it observed that minimum score is 16.67 and maximum
score is 100. Average (Arithmetic Mean of) score is 67.59 and standard
deviation is 13.45.
6. Customer Care Service:
To understand Intrudes on Customer care Service THREE questions are asked
through questionnaire. Response to these questions is recorded using six point
likert scale. Information about question numbers related to first variable and
response of all 2030 respondents is presented in the following table.
Table 6.22 Frequency Distribution of Customer Care Service
Question
No
Strongly
Disagree
Disagree Somewhat
Disagree
Somewhat
Agree
Agree Strongly
Agree
Total
Que-14 82 210 311 437 704 286 2030
Que-33 133 183 387 615 464 248 2030
Que-46 463 240 442 397 343 145 2030

141
After appropriate rating it observed that minimum score is 16.67 and maximum
score is 100. Average (Arithmetic Mean of) score is 62.37 and standard
deviation is 17.73.
7. After sales service:
To study after sales service THREE questions are asked through questionnaire.
Response to these questions is recorded using six points likert scale. Information
about question numbers related to first variable and response of all 2030
respondents is presented in the following table.
Table 6.23 Frequency Distribution of After Sales Service
Question
No
Strongly
Disagree
Disagree Somewhat
Disagree
Somewhat
Agree
Agree Strongly
Agree
Total
Que-45 88 346 651 412 349 184 2030
Que-47 179 480 571 517 161 122 2030
Que-48 182 155 536 639 342 176 2030
After appropriate rating it observed that minimum score is 22.22 and maximum
score is 83.33. Average (Arithmetic Mean of) score is 57.77 and standard
deviation is 12.18.

142
8. Quality and Utility of Service:
To study Quality and Utility of Service. THREE questions are asked through
questionnaire. Response to these questions is recorded using six points likert
scale. Information about question numbers related to first variable and response
of all 2030 respondents is presented in the following table.
Table 6.24 Frequency Distribution of Quality and Utility of Service
Question
No
Strongly
Disagree
Disagree Somewhat
Disagree
Somewhat
Agree
Agree Strongly
Agree
Total
Que-38 7 224 676 708 228 177 2030
Que-39 10 168 576 778 285 213 2030
Que-43 76 185 519 755 315 160 2030
After appropriate rating it observed that minimum score is 22.22 and maximum
score is 100. Average (Arithmetic Mean of) score is 63.09 and standard
deviation is 15.57.
9. Consumer Satisfaction:
To study Consumer Satisfaction. FOUR questions are asked through
questionnaire. Response to these questions is recorded using six points likert
scale. Information about question numbers related to first variable and response
of all 2030 respondents is presented in the following table.
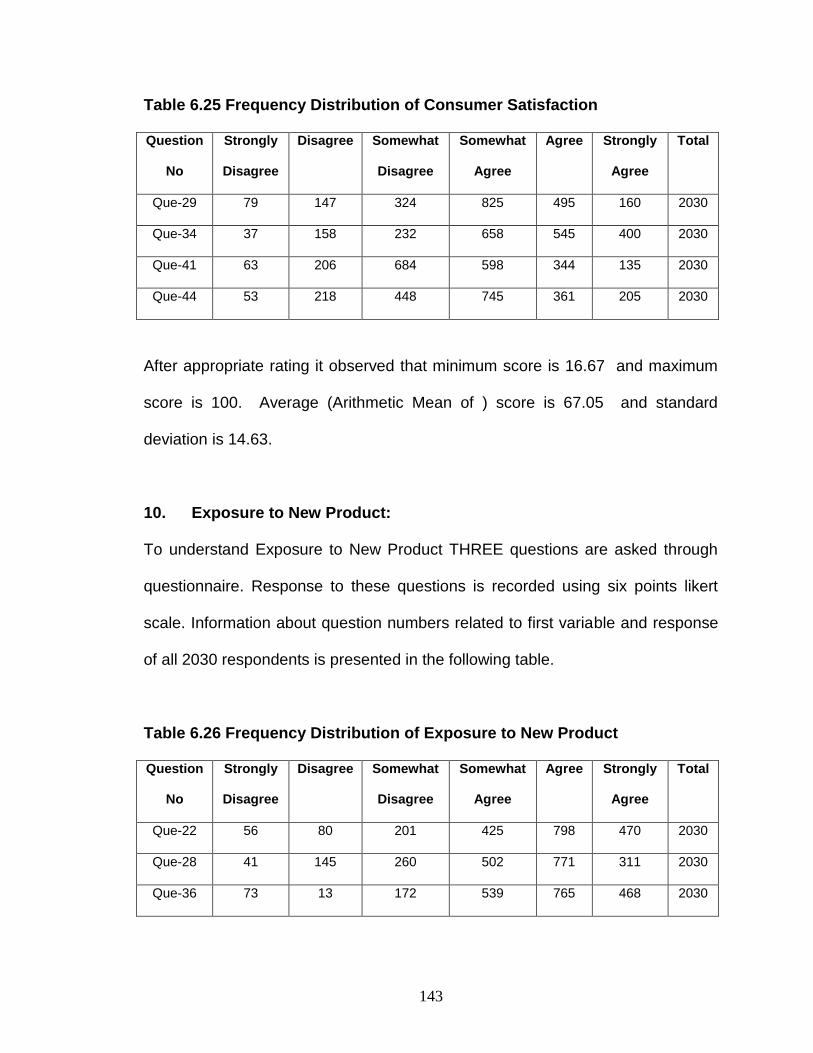
143
Table 6.25 Frequency Distribution of Consumer Satisfaction
Question
No
Strongly
Disagree
Disagree Somewhat
Disagree
Somewhat
Agree
Agree Strongly
Agree
Total
Que-29 79 147 324 825 495 160 2030
Que-34 37 158 232 658 545 400 2030
Que-41 63 206 684 598 344 135 2030
Que-44 53 218 448 745 361 205 2030
After appropriate rating it observed that minimum score is 16.67 and maximum
score is 100. Average (Arithmetic Mean of ) score is 67.05 and standard
deviation is 14.63.
10. Exposure to New Product:
To understand Exposure to New Product THREE questions are asked through
questionnaire. Response to these questions is recorded using six points likert
scale. Information about question numbers related to first variable and response
of all 2030 respondents is presented in the following table.
Table 6.26 Frequency Distribution of Exposure to New Product
Question
No
Strongly
Disagree
Disagree Somewhat
Disagree
Somewhat
Agree
Agree Strongly
Agree
Total
Que-22 56 80 201 425 798 470 2030
Que-28 41 145 260 502 771 311 2030
Que-36 73 13 172 539 765 468 2030

144
After appropriate rating it observed that minimum score is 39.47 and maximum
score is 96.93. Average (Arithmetic Mean of ) score is 68.46 and standard
deviation is 9.39.
Combine Score of All Variables: All variables are considered together and score
is calculated. Combine average score of all variables is 68.46 and standard
deviation is 9.38.
6.3 TESTING OF HYPOTHESIS:
H01: Direct marketing does not help to builds relations and create loyalty
among consumers.
H11: Direct marketing does help to builds relations and create loyalty
among consumers.
To test above hypothesis combine score of all variables and score of variable
ONE are considered. Total respondents are classified in to three levels according
to their scores.
For variable one (Building Relation and Creating Loyalty) total respondents are
classified in to three levels low, medium and high according to their score.

145
Results after classification are as follows.
Table 6.27 Level of responses for H01
Level of score of building relation and
creating loyalty
Number of
respondents
Percent
Low 240 11.8
Medium 1380 68.0
High 410 20.2
Total 2030 100.0
Above table indicate that out of 2030 respondents, minimum 240 respondents
are belongs to low level of building relation and creating loyalty, maximum 1380
respondents are from medium level and remaining 410 respondents are from
high level. Above information is presented using pie-diagram as shown below.
Table of Respondents According to Level of Building relation and
Creating Loyalty
240
1380
410
Low
Medium
High
Figure 6.28 Pie chart of Building Relation and Creating Loyalty

146
To study effect direct marketing of building relation and creating loyalty, Results
of all ten variables are considered together and score of direct marketing is
obtain. According to combine score of marketing respondents are classified in to
three levels low, medium and high. Distribution of respondents according to level
of direct marketing is presented in the following table.
Table 6.29 Level of Direct Marketing for H01
Level of
Direct Marketing Number of respondents Percent
Low 278 13.7
Medium 1473 72.6
High 279 13.7
Total 2030 100.0
Above table indicate that out of total 2030 respondents, minimum 278
respondents are from low level of direct marketing, maximum 1473 from medium
level and remaining 279 from high level of marketing. Above information is
presented using pie-diagram as shown below .Table 6.30 Respondents
According to Level of Direct Marketing

147
Table of Respondents According to Level of Direct Marketing
278
1473
279
Low
Medium
High
Figure 6.30 Pie hart of hypothesis 1
To test the hypothesis Chi-square test is applied.Bivariate frequency table of
level of building relation and creating loyalty and level of marketing is obtain and
presented as given below.
Level of building
relation and creating loyalty
Level of Direct Marketing Total
Low Medium High
Low 131 109 0 240
Medium 147 1137 96 1380
High 0 227 183 410
Total 278 1473 279 2030
Table 6.31 Chi square test for H1

148
Above information is presented using multiple bar diagram which is as follows.
131 109
0
147
1137
96
0
227183
0
200
400
600
800
1000
1200
Low Medium High
Level of Direct Marketing
Le
ve
l o
f b
uil
din
g r
ela
tio
n a
nd
cre
ati
ng
lo
ya
lty
Low
Medium
High
Figure 6.32 Bar Diagram of Level of Building Relation and Creating Loyalty
Vs Level of direct Marketing
Results of Chi-square test are as follows.
Chi-Square Calculated value = 781.83
Degree of freedom = 4
Level of significance = 5%
Chi-Square Table value = 9.49
Result of test = Rejected

149
From the result of chi-square test it is concluded that null hypothesis is rejected
and alternate hypothesis is accepted. Therefore we can say that Direct Marketing
does help to build relations and create loyalty among consumers.
H02: Consumers do not find direct marketing to be a convenient method
to make buying decisions.
H12: Consumer find direct marketing convenient to make buying
decisions.
To test above hypothesis combine score of all variables and score of variable
ONE are considered. Total respondents are classified in to three levels according
to their scores.
For variable-2 (Direct marketing is convenient method) total respondents are
classified in to three levels low, medium and high according to their score.
Results after classification are as follows.
Table 6.33 Frequency Distribution of H02
Level of score of convenient method Number of respondents Percent
Low 362 17.8
Medium 1380 68.0
High 288 14.2
Total 2030 100.0

150
Above table indicate that out of 2030 respondents, minimum 288 respondents
are of opinion that direct marketing is high level of convenience, maximum 1380
respondents are from medium level of convenience and remaining 362
respondents are from low level of Convenience. Above information is presented
using pie-diagram as shown below.
Diagram of Respondents according to level of
convenience of Direct Marketing
362
1380
288
Low
Medium
High
Figure 6.34 Pie Chart of Respondents according to Level of Convenience of
Direct Marketing
To study effect of convenience method on Direct marketing, Results of all
ten variables are considered together and score of direct marketing is obtain.
To test the hypothesis Chi-square test is applied. Bivariate frequency table of
level of convenience of direct marketing is obtain and presented as given below.

151
Table 6.35 Chi-square test for hypothesis H02
Level of building
relation and creating loyalty
Level of Direct Marketing Total
Low Medium High
Low 163 199 0 362
Medium 107 1160 113 1380
High 8 114 166 288
Total 278 1473 279 2030
Above information is presented using multiple bar diagram which is as follows.
Diagram of Respondents According to Level of Convenience
and level of Direct Marketing
163 199
0
107
1160
113
8
114166
0
200
400
600
800
1000
1200
1400
Low Medium HighLevel of Direct Marketing
Le
ve
l o
f c
on
ve
nie
nv
e
Low
Medium
High
Figure 6.36 Bar diagram of Respondents according to Level of
Convenience of Direct Marketing

152
Results of Chi-square test are as follows.
Chi-Square Calculated value = 888.37
Degree of freedom = 4
Level of significance = 5%
Chi-Square Table value = 9.49
Result of test = Rejected
From the result of chi-square test it is concluded that null hypothesis is rejected
and alternate hypothesis is accepted.
H03: Direct marketing is not a time saving method of market transaction.
H13: Direct marketing is a saving method of market transactions
To test above hypothesis combine score of all variables and score of variable-3
are considered. Total respondents are classified in to three levels according to
their scores.
For variable-3 (Direct marketing is time saving method) total respondents are
classified in to three levels low, medium and high according to their score.
Results after classification are as follows.

153
Table 6.37 Frequency Test for Convenient Method
Level of score of convenient method Number of respondents Percent
Low 230 11.3
Medium 1454 71.7
High 346 17.0
Total 2030 100.0
Above table indicate that out of 2030 respondents, minimum 230 respondents
are of opinion that there is low level of time saving in direct marketing, maximum
1454 respondents are of opinion that there is medium level of time in direct
marketing and remaining 346 respondents are of opinion of high level of time
saving. Above information is presented using pie-diagram as shown below.
Diagram of Respondents According to level of Time saving
230
1454
346
Low
Medium
High
Figure 6.38 Pie chart for Convenient Method

154
To study effect of Time saving method on Direct marketing, Results of all ten
variables are considered together and score of direct marketing is obtained.
To test the hypothesis Chi-square test is applied. Bivariate frequency table of
level of time saving of direct marketing is obtain and presented as given below.
Table 6.39 Chi-square test for hypothesis H o3
Level of building
relation and creating loyalty
Level of Direct Marketing Total
Low Medium High
Low 101 129 0 230
Medium 133 1209 112 1454
High 44 135 167 346
Total 278 1473 279 2030
Above information is presented using multiple bar diagram which is as follows.

155
Diagram of Respondents According to Level of Time Saving
Method and Direct Marketing
101 129
0
133
1209
11244
135 167
0
200
400
600
800
1000
1200
1400
Low Medium High
Direct Marketing
Le
ve
l o
f T
ime
Sa
vin
g
Low
Medium
High
Figure 6.40 Bar diagram of Respondents according to Level of Time Saving
Methods and Direct Marketing.
Results of Chi-square test are as follows.
Chi-Square Calculated value = 630.57
Degree of freedom = 4
Level of significance = 5%
H04: The sales agents of direct marketing do not have high credibility and
are not able to find prospects.
H14: The sales agents of direct marketing have high credibility and are able
to find prospects.

156
To test above hypothesis combine score of all variables and score of variable-4
are considered. Total respondents are classified in to three levels according to
their scores.
For variable-4 (High Credibility) total respondents are classified in to three levels
low, medium and high according to their score about high credibility.
Results after classification are as follows.
Table6.41 Level of scores of convenient method (H04).
Level of score of
convenient method Number of respondents Percent
Low 449 22.1
Medium 1315 64.8
High 266 13.1
Total 2030 100.0
Above table indicate that out of 2030 respondents, minimum 266 respondents
are of opinion that there is high level of credibility in direct marketing, maximum
1315 respondents are of opinion that there is medium level of credibility in direct
marketing and remaining 449 respondents are of opinion of low level of
credibility. Above information is presented using pie-diagram as shown below.

157
Diagram of respondents according to level of Credibility in
Dierect Marketing
449
1315
266
Low
Medium
High
Figure 6.42 To study effect of Credibility on Direct marketing,
Results of all ten variables are considered together and score of direct marketing
is obtained.
To test the hypothesis, Chi-square test is applied. Bivariate frequency table of
level of time saving of direct marketing is obtain and presented as given below.
Table.6.43 Chi square test for Level of credibility
Level of building
relation and creating loyalty
Level of Direct Marketing Total
Low Medium High
Low 239 200 10 449
Medium 39 1200 76 1315
High 0 73 193 266
Total 278 1473 279 2030

158
Above information is presented using multiple bar diagram which is as follows.
Diagram of Respondents According to level of Credibility and
Direct Marketing
339
200
1039
1200
760
73
193
0
200
400
600
800
1000
1200
1400
Low Medium High
Le
ve
l o
f C
red
ibilit
y
Low
Medium
High
Figure 6.44 Respondents according to level of credibility
Results of Chi-square test are as follows.
Chi-Square Calculated value = 1619.00
Degree of freedom = 4
Level of significance = 5%
Chi-Square Table value = 9.49
Result of test = Rejected
From the result of chi-square test it is concluded that null hypothesis is rejected
and alternate hypothesis is accepted.

159
H05: Direct marketing intrudes upon the privacy of communication.
H15: Direct marketing does not intrude upon the privacy of consumers.
To test above hypothesis combine score of all variables and score of variable-5
are considered. Total respondents are classified in to three levels according to
their scores.
For variable-5 (Intrudes upon privacy) total respondents are classified in to three
levels low, medium and high according to their score about intrudes upon
privacy.
Results after classification are as follows.
Table 6.45 Level of score of convenient method
Level of score of
convenient method Number of respondents Percent
Low 224 11.0
Medium 1609 79.3
High 197 9.7
Total 2030 100.0
Above table indicate that out of 2030 respondents, minimum 197 respondents
are of opinion that there is high level of Intrudes upon privacy direct marketing,
maximum 1609 respondents are of opinion that there is medium level of Intrudes

160
upon privacy in direct marketing and remaining 224 respondents are of opinion of
low level of Intrudes upon privacy.
Above information is presented using pie-diagram as shown below.
Diagram of Respondents According to Level of intrudes upon
privacy
224
1609
197Low
Medium
High
Figure 6.46 Pie chart of Level of intrudes upon privacy
To study effect of Credibility on Direct marketing, Results of all ten variables are
considered together and score of direct marketing is obtained.
To test the hypothesis, Chi-square test is applied. Bivariate frequency table of
level of time saving of direct marketing is obtain and presented as given below.

161
Table 6.47 Chi square test of Level of credibility
Level of building
relation and creating loyalty
Level of Direct Marketing Total
Low Medium High
Low 144 80 0 224
Medium 134 1313 162 1609
High 0 80 117 197
Total 278 1473 279 2030
Above information is presented using multiple bar diagram which is as follows.
Diagram of Respondent according to level of Intrudes on Privacy
14480
0
134
1313
162
0
80117
0
200
400
600
800
1000
1200
1400
Low Medium High
Le
ve
l o
f In
tru
de
s in
Pri
va
cy
Low
Medium
High
Figure 6.48 Diagram of Level of intrude upon privacy

162
Results of Chi-square test are as follows.
Chi-Square Calculated value = 912.48
Degree of freedom = 4
Level of significance = 5%
Chi-Square Table value = 9.49
Result of test = Rejected
From the result of chi-square test it is concluded that null hypothesis is rejected
and alternate hypothesis is accepted.
H06: Direct marketing does not provide good customer care.
H16: Direct marketing provides good customer care.
To test above hypothesis combine score of all variables and score of variable-6
are considered. Total respondents are classified in to three levels according to
their scores.
For variable-6 (Customer care) total respondents are classified in to three levels
low, medium and high according to their score about customer care.
Results after classification are as follows.

163
Table 6.49 Level of score of customer care
Level of score of
Customer care Number of respondents Percent
Low 289 14.2
Medium 1482 73.0
High 259 12.8
Total 2030 100.0
Above table indicate that out of 2030 respondents, minimum 259 respondents
are of opinion that there is high level of customer care, maximum 1482
respondents are of opinion that there is medium level of customer care in direct
marketing and remaining 289 respondents are of opinion of low level of customer
care.
Above information is presented using pie-diagram as shown below.
Diagram of Respondents according to level of customer care
289
1482
259
Low
Medium
High
Figure 6.50 Diagram of respondents according to level of customer care
To study effect of customer care on direct marketing, results of all ten variables
are considered together and score of direct marketing is obtained.

164
To test the hypothesis, Chi-square test is applied. Bivariate frequency table of
level of time saving of direct marketing is obtain and presented as given below.
Table 6.51 Level of customer care
Level of Customer
Care Level of Direct Marketing Total
Low Medium High
Low 198 91 0 289
Medium 80 1264 138 1482
High 0 118 141 259
Total 278 1473 279 2030
Above information is presented using multiple bar diagram which is as follows.
Diagram of Respondents accoding to Level of Customer Care and
Direct Marketing
198
91
080
1264
138
0
118 141
0
200
400
600
800
1000
1200
1400
Low Medium High
Le
ve
l o
f C
us
tom
er
ca
re
Low
Medium
High
Figure 6.52 Diagram of Level of customer care and Direct marketing

165
Results of Chi-square test are as follows.
Chi-Square Calculated value = 1243.42
Degree of freedom = 4
Level of significance = 5%
Chi-Square Table value = 9.49
Result of test = Rejected
From the result of chi-square test it is concluded that null hypothesis is rejected
and alternate hypothesis is accepted.
H07: Direct Marketing does not provide good after sales service to
consumers
H17: Direct Marketing provide good after sales service to consumers
To test above hypothesis combine score of all variables and score of variable-7
are considered. Total respondents are classified in to three levels according to
their scores.
For variable- 7(After sales service) total respondents are classified in to three
levels low, medium and high according to their score about after sales service
Results after classification are as follows.

166
Table 6.53 Level of scores of after sales service
Level of score of
convenient method Number of respondents Percent
Low 391 19.3
Medium 1312 64.6
High 327 16.1
Total 2030 100.0
Above table indicate that out of 2030 respondents, minimum 327 respondents
are of opinion that there is high level of after sales service, maximum 1312
respondents are of opinion that there is medium level of after sales service in
direct marketing and remaining 391 respondents are of opinion of low level of
after sales service.
Above information is presented using pie-diagram as shown below.
Diagram of respondents according to level of after sales service
391
1312
327
Low
Medium
High
Figure 6.54 Level of after sales service

167
To study effect of after sales service on direct marketing, results of all ten
variables are considered together and score of direct marketing is obtained.
To test the hypothesis, Chi-square test is applied. Bivariate frequency table of
level of time saving of direct marketing is obtain and presented as given below.
Table 6.55 Chi square of level of after sales service
Level of after sales service
Level of Direct Marketing Total
Low Medium High
Low 101 269 21 391
Medium 171 988 153 1312
High 6 216 105 327
Total 278 1473 279 2030
Above information is presented using multiple bar diagram which is as follows.
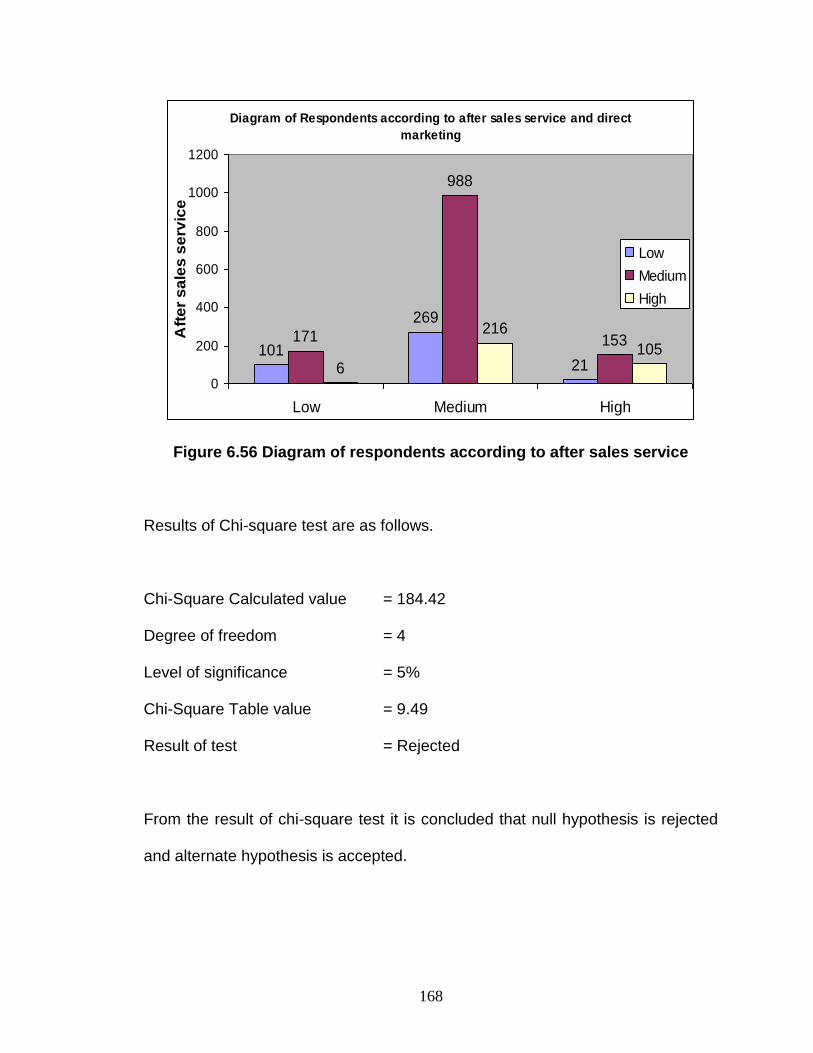
168
Diagram of Respondents according to after sales service and direct
marketing
101
269
21
171
988
153
6
216
105
0
200
400
600
800
1000
1200
Low Medium High
Aft
er
sa
les
se
rvic
e
Low
Medium
High
Figure 6.56 Diagram of respondents according to after sales service
Results of Chi-square test are as follows.
Chi-Square Calculated value = 184.42
Degree of freedom = 4
Level of significance = 5%
Chi-Square Table value = 9.49
Result of test = Rejected
From the result of chi-square test it is concluded that null hypothesis is rejected
and alternate hypothesis is accepted.

169
H08: The products sold through direct marketing are not good in quality and
utility
H18: The products sold through direct marketing are good in quality and
utility
To test above hypothesis combine score of all variables and score of variable-8
are considered. Total respondents are classified in to three levels according to
their scores.
For variable- (Quality and Utility of product) total respondents are classified in to
three levels low, medium and high according to their score about after sales
service
Results after classification are as follows
Table 6.57 Level of score of quality and utility of products
Level of score of
Quality and Utility of
product
Number of respondents Percent
Low 261 12.9
Medium 1534 75.6
High 235 11.6
Total 2030 100.0

170
Above table indicate that out of 2030 respondents, minimum 235 respondents
are of opinion that there is high level of Quality and Utility of product, maximum
1312 respondents are of opinion that there is medium level of Quality and Utility
of product in direct marketing and remaining 391 respondents are of opinion of
low level of Quality and Utility of Product. Above information is presented using
pie-diagram as shown below.
Diagram of Respondents accoring to Quality and Utility of product
261
1534
235
Low
Medium
High
Figure 6.58 Diagram of respondents according to quality and utility of
products
To study effect of after sales service on direct marketing, results of all ten
variables are considered together and score of direct marketing is obtained.
To test the hypothesis, Chi-square test is applied. Bivariate frequency table of
level of time Quality and Utility of product in direct marketing is obtain and
presented as given below.

171
Table 6.59 Chi square of quality and utility of products
Level of Quality and
Utility of product
Level of Direct Marketing Total
Low Medium High
Low 142 119 0 261
Medium 135 1246 153 1534
High 1 108 126 235
Total 278 1473 279 2030
Above information is presented using multiple bar diagram which is as follows.
Diagram of Respondents according to Quality and Utility of Prodect
and Direct Marketing
142 119
0
135
1246
153
1
108 126
0
200
400
600
800
1000
1200
1400
Low Medium High
Qu
ality
an
d U
tility
of
Pro
du
ct
Low
Medium
High
Figure 6.60 Diagram of respondents according to quality and utility of
products

172
Results of Chi-square test are as follows.
Chi-Square Calculated value = 761.46
Degree of freedom = 4
Level of significance = 5%
Chi-Square Table value = 9.49
Result of test = Rejected
From the result of chi-square test it is concluded that null hypothesis is rejected
and alternate hypothesis is accepted.
H09: The consumers are not satisfied with products bought through direct
marketing
H19: The consumers have satisfaction with products bought through direct
marketing
To test above hypothesis combine score of all variables and score of variable-9
are considered. Total respondents are classified in to three levels according to
their scores.
For variable-9 (Consumer Satisfaction) total respondents are classified in to three
levels low, medium and high according to their score about after sales service

173
Results after classification are as follows.
Table 6.61 Level of score of consumer satisfaction
Level of score of Consumer
Satisfaction Number of respondents Percent
Low 285 14.00
Medium 1491 73.4
High 254 12.5
Total 2030 100.0
Above table indicate that out of 2030 respondents, minimum 254 respondents
are of opinion that there is high level of Consumer Satisfaction, maximum 1491
respondents are of opinion that there is medium level of Consumer Satisfaction
in direct marketing and remaining 285 respondents are of opinion of low level of
Consumer Satisfaction.
Above information is presented using pie-diagram as shown below.
Diagram of Respondents accoring to Consumer Satisfaction
285
1491
254
Low
Medium
High

174
Figure 6.62 Diagram o f respondents according to consumer satisfaction
To study effect of after sales service on direct marketing, results of all ten
variables are considered together and score of direct marketing is obtained.
To test the hypothesis, Chi-square test is applied. Bivariate frequency table of
level of Consumer Satisfaction in direct marketing is obtain and presented as
given below.
Table 6.63 Level of consumer satisfaction
Level of Consumer
satisfaction Level of Direct Marketing Total
Low Medium High
Low 208 77 0 285
Medium 70 1309 112 1491
High 0 87 167 254
Total 278 1473 279 2030
Above information is presented using multiple bar diagram which is as follows.

175
Diagram of Respondents according to Consumer Satisfaction and
Direct Marketing
208
770
70
1309
112
087
167
0
200
400
600
800
1000
1200
1400
Low Medium High
Qu
ali
ty a
nd
Uti
lity
of
Pro
du
ct
Low
Medium
High
Fig 6.64 Diagram of respondents according to consumer satisfaction
Results of Chi-square test are as follows.
Chi-Square Calculated value = 1616.12
Degree of freedom = 4
Level of significance = 5%
Chi-Square Table value = 9.49
Result of test = Rejected
From the result of chi-square test it is concluded that null hypothesis is rejected
and alternate hypothesis is accepted.
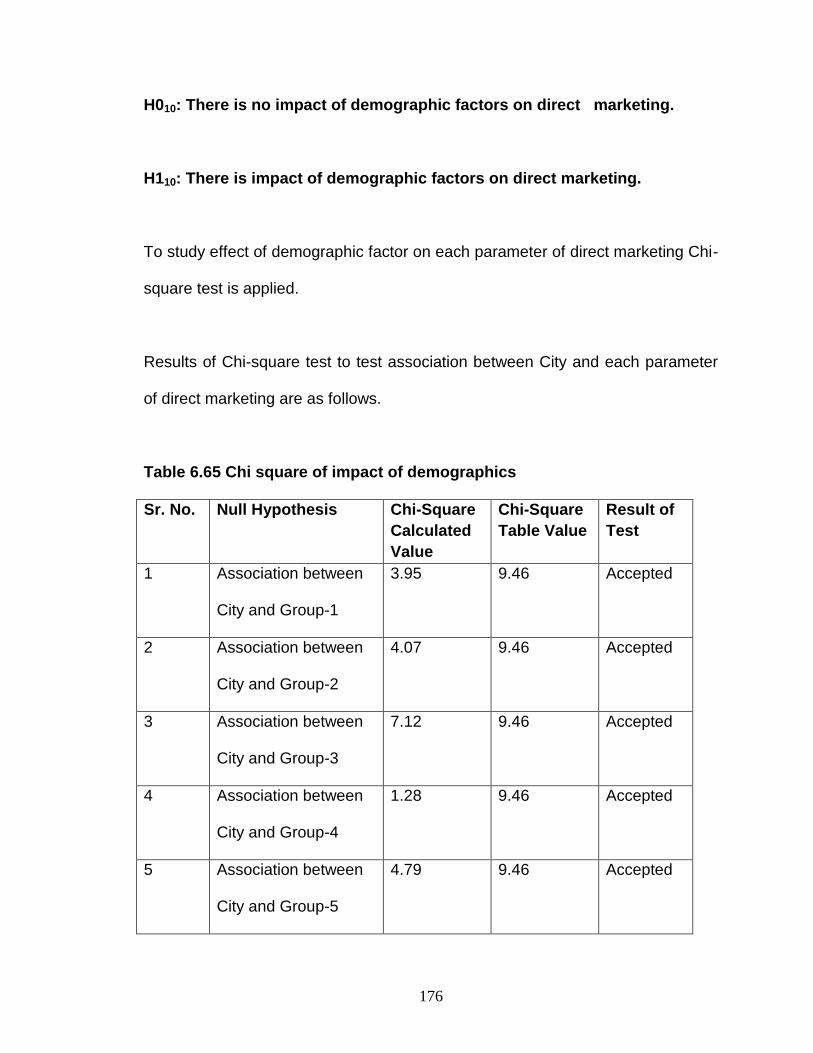
176
H010: There is no impact of demographic factors on direct marketing.
H110: There is impact of demographic factors on direct marketing.
To study effect of demographic factor on each parameter of direct marketing Chi-
square test is applied.
Results of Chi-square test to test association between City and each parameter
of direct marketing are as follows.
Table 6.65 Chi square of impact of demographics
Sr. No. Null Hypothesis Chi-Square
Calculated
Value
Chi-Square
Table Value
Result of
Test
1 Association between
City and Group-1
3.95 9.46 Accepted
2 Association between
City and Group-2
4.07 9.46 Accepted
3 Association between
City and Group-3
7.12 9.46 Accepted
4 Association between
City and Group-4
1.28 9.46 Accepted
5 Association between
City and Group-5
4.79 9.46 Accepted

177
6 Association between
City and Group-6
4.89 9.46 Accepted
7 Association between
City and Group-7
9.07 9.46 Accepted
8 Association between
City and Group-8
3.13 9.46 Accepted
9 Association between
City and Group-9
5.69 9.46 Accepted
10 Association between
City and Group-10
1.99 9.46 Accepted
Above table indicates chi-square tests for all ten parameters are accepted. It
indicates that there is no association between city and any of parameter of direct
marketing.
To association between qualification and each parameter of direct marketing chi-
square test is applied and results of test are as follows.
Table 6.66 Chi square of Qualification
Sr.
No.
Null Hypothesis Chi-Square
Calculated
Value
Chi-Square
Table Value
Result of
Test
1 Association between
Qualification and
Group-1
273.47 18.31 Rejected

178
2 Association between
Qualification and
Group-2
214.62 18.31 Rejected
3 Association between
Qualification and
Group-3
101.98 18.31 Rejected
4 Association between
Qualification and
Group-4
291.81 18.31 Rejected
5 Association between
Qualification and
Group-5
183.81 18.31 Rejected
6 Association between
Qualification and
Group-6
264.59 18.31 Rejected
7 Association between
Qualification and
Group-7
107.94 18.31 Rejected
8 Association between
Qualification and
Group-8
282.88 18.31 Rejected
9 Association between
Qualification and
217.52 18.31 Rejected

179
Group-9
10 Association between
Qualification and
Group-10
348.56 18.31 Rejected
Above table indicates chi-square tests for all ten parameters are rejected. It
indicates that there is association between qualification and every of parameter
of direct marketing.
To association between age and each parameter of direct marketing chi-square
test is applied and results of test are as follows.
Table 6.67 Chi square of Age
Sr.
No.
Null Hypothesis Chi-Square
Calculated
Value
Chi-Square
Table Value
Result of
Test
1 Association between
Age group and Group-1
46.07 9.46 Rejected
2 Association between
Age group and Group-2
9.52 9.46 Rejected
3 Association between
Age group and Group-3
54.18 9.46 Rejected
4 Association between 20.95 9.46 Rejected

180
Age group and Group-4
5 Association between
Age group and Group-5
24.19 9.46 Rejected
6 Association between
Age group and Group-6
71.24 9.46 Rejected
7 Association between
Age group and Group-7
30.88 9.46 Rejected
8 Association between
Age group and Group-8
24.31 9.46 Rejected
9 Association between
Age group and Group-9
13.77 9.46 Rejected
10 Association between
Age group and Group-
10
19.81 9.46 Rejected
Above table indicates chi-square tests for all ten parameters are rejected. It
indicates that there is association between age and every of parameter of direct
marketing.
To association between sex and each parameter of direct marketing chi-square
test is applied and results of test are as follows.

181
Table 6.68 Chi square of sex and parameters of direct marketing
Sr. No. Null Hypothesis Chi-Square
Calculated
Value
Chi-Square
Table Value
Result of
Test
1 Association between Sex
and Group-1
51.82 5.99 Rejected
2 Association between Sex
and Group-2
73.56 5.99 Rejected
3 Association between Sex
and Group-3
1.55 5.99 Accepted
4 Association between Sex
and Group-4
8.27 5.99 Rejected
5 Association between Sex
and Group-5
11.54 5.99 Rejected
6 Association between Sex
and Group-6
43.65 5.99 Rejected
7 Association between Sex
and Group-7
6.29 5.99 Rejected
8 Association between Sex
and Group-8
31.79 5.99 Rejected
9 Association between Sex
and Group-9
8.85 5.99 Rejected

182
10 Association between Sex
and Group-10
7.48 5.99 Rejected
Above table indicates chi-square tests for nine parameters are rejected. It
indicates that there is association between sex and nine corresponding
parameter of direct marketing.
Chi-square tests for nine parameters is accepted It indicates that there is no
association between sex and group -3 of direct marketing.
To association between number of members in family and each parameter of
direct marketing chi-square test is applied and results of test are as follows.
Table 6.69 Chi square and members of family
Sr.
No.
Null Hypothesis Chi-Square
Calculated
Value
Chi-Square
Table Value
Result of
Test
1 Association between
No. of members in
family and Group-1
191.52 18.31 Rejected
2 Association between
No. of members in
family and Group-2
129.99 18.31 Rejected
3 Association between
No. of members in
family and Group-3
184.34 18.31 Rejected

183
4 Association between
No. of members in
family and Group-4
247.78 18.31 Rejected
5 Association between
No. of members in
family and Group-5
129.54 18.31 Rejected
6 Association between
No. of members in
family and Group-6
259.66 18.31 Rejected
7 Association between
No. of members in
family and Group-7
33.06 18.31
Rejected
8 Association between
No. of members in
family and Group-8
122.06 18.31
Rejected
9 Association between
No. of members in
family and Group-9
188.90 18.31
Rejected
10 Association between
No. of members in
family and Group-10
249.62 18.31
Rejected

184
Above table indicates chi-square tests for all ten parameters are rejected. It
indicates that there is association between number of members in family and all
ten parameters of direct marketing.
To association between number of children in family and each parameter of
direct marketing chi-square test is applied and results of test are as follows.
Table 6.70 Chi square of Children and parameter of direct marketing
Sr. No. Null Hypothesis Chi-Square
Calculated
Value
Chi-Square
Table Value
Result of
Test
1 Association between
Children in family and
Group-1
173.55 15.51 Rejected
2 Association between
Children in family and
Group-2
132.55 15.51 Rejected
3 Association between
Children in family and
Group-3
58.87 15.51 Rejected
4 Association between
Children in family and
Group-4
99.40 15.51 Rejected
5 Association between
Children in family and
Group-5
78.37 15.51 Rejected
6 Association between
Children in family and
108.71 15.51 Rejected

185
Group-6
7 Association between
Children in family and
Group-7
36.76 15.51 Rejected
8 Association between
Children in family and
Group-8
104.94 15.51 Rejected
9 Association between
Children in family and
Group-9
250.68 15.51 Rejected
10 Association between
Children in family and
Group-10
53.96 15.51 Rejected
Above table indicates chi-square tests for all ten parameters are rejected. It
indicates that there is association between number of children in family and each
of ten parameter of direct marketing.
To association between number of children in family and each parameter of
direct marketing chi-square test is applied and results of test are as follows.

186
Table 6.71 Chi square of children in family
Sr.
No.
Null Hypothesis Chi-Square
Calculated
Value
Chi-Square
Table Value
Result of
Test
1 Association between
Employment status and
Group-1
49.83 12.59 Rejected
2 Association between
Employment status and
Group-2
36.35 12.59 Rejected
3 Association between
Employment status and
Group-3
88.75 12.59 Rejected
4 Association between
Employment status and
Group-4
21.92 12.59 Rejected
5 Association between
Employment status and
Group-5
60.62 12.59 Rejected
6 Association between
Employment status and
Group-6
64.85 12.59 Rejected
7 Association between
Employment status and
Group-7
9.04 14.07 Accepted
8 Association between
Employment status and
Group-8
32.43 12.59 Rejected

187
9 Association between
Employment status and
Group-9
27.11 12.59 Rejected
10 Association between
Employment status and
Group-10
31.65 12.59 Rejected
Above table indicates chi-square tests for nine parameters are rejected. It
indicates that there is association between employment status and nine
corresponding parameter of direct marketing.
Chi-square tests for nine parameters is accepted It indicates that there is no
association between employment status and group -7 of direct marketing.
To study association between monthly income and each parameter of direct
marketing chi-square test is applied and results of test are as follows.
Table 6.72 Chi square of Income and parameter of direct marketing
Sr. No. Null Hypothesis Chi-Square
Calculated
Value
Chi-Square
Table Value
Result of
Test
1 Association between
Monthly income and
Group-1
106.30 15.51 Rejected
2 Association between
Monthly income and
Group-2
86.67 15.51 Rejected

188
3 Association between
Monthly income and
Group-3
49.39 15.51 Rejected
4 Association between
Monthly income and
Group-4
100.59 15.51 Rejected
5 Association between
Monthly income and
Group-5
90.79 15.51 Rejected
6 Association between
Monthly income and
Group-6
116.61 15.51 Rejected
7 Association between
Monthly income and
Group-7
18.78 15.51 Rejected
8 Association between
Monthly income and
Group-8
71.19 15.51 Rejected
9 Association between
Monthly income and
Group-9
53.31 15.51 Rejected
10 Association between
Monthly income and
Group-10
113.97 15.51 Rejected
Above table indicates chi-square tests for all ten parameters are rejected. It
indicates that there is association between monthly income and each of ten
parameter of direct marketing.

189
6.4 STUDY OF CORRELATION:
To study correlation among ten parameters and combine of direct marketing Karl
Pearson‘s method is used. Results of correlation are as follows.
Correlation between each parameter is studied with every parameter of direct
marketing.
Table6.73 Table of Pearson’s Correlations
Group1 Group2 Group3 Group4 Group5 Group6 Group7 Group8 Group9 Group10 combine
Group1 Pearson
Correlation
1 .470** .383
** .638
** .520
** .677
** .272
** .570
** .643
** .232
** .822
**
Sig. (2-
tailed)
.000 .000 .000 .000 .000 .000 .000 .000 .000 .000
N 2030 2030 2030 2030 2030 2030 2030 2030 2030 2030 2030
Group2 Pearson
Correlation
.470** 1 .485
** .507
** .388
** .440
** .154
** .376
** .563
** .233
** .678
**
Sig. (2-
tailed)
.000
.000 .000 .000 .000 .000 .000 .000 .000 .000
N 2030 2030 2030 2030 2030 2030 2030 2030 2030 2030 2030
Group3 Pearson
Correlation
.383** .485
** 1 .352
** .324
** .332
** .082
** .262
** .296
** .303
** .591
**
Sig. (2-
tailed)
.000 .000
.000 .000 .000 .000 .000 .000 .000 .000
N 2030 2030 2030 2030 2030 2030 2030 2030 2030 2030 2030
Group4 Pearson
Correlation
.638** .507
** .352
** 1 .507
** .555
** .221
** .445
** .613
** .234
** .755
**
Sig. (2-
tailed)
.000 .000 .000
.000 .000 .000 .000 .000 .000 .000

190
N 2030 2030 2030 2030 2030 2030 2030 2030 2030 2030 2030
Group5 Pearson
Correlation
.520** .388
** .324
** .507
** 1 .548
** .199
** .196
** .515
** .464
** .740
**
Sig. (2-
tailed)
.000 .000 .000 .000
.000 .000 .000 .000 .000 .000
N 2030 2030 2030 2030 2030 2030 2030 2030 2030 2030 2030
Group6 Pearson
Correlation
.677** .440
** .332
** .555
** .548
** 1 .305
** .486
** .613
** .266
** .789
**
Sig. (2-
tailed)
.000 .000 .000 .000 .000
.000 .000 .000 .000 .000
N 2030 2030 2030 2030 2030 2030 2030 2030 2030 2030 2030
Group7 Pearson
Correlation
.272** .154
** .082
** .221
** .199
** .305
** 1 .335
** .337
** .033 .401
**
Sig. (2-
tailed)
.000 .000 .000 .000 .000 .000
.000 .000 .141 .000
N 2030 2030 2030 2030 2030 2030 2030 2030 2030 2030 2030
Group8 Pearson
Correlation
.570** .376
** .262
** .445
** .196
** .486
** .335
** 1 .561
** -.014 .614
**
Sig. (2-
tailed)
.000 .000 .000 .000 .000 .000 .000
.000 .518 .000
N 2030 2030 2030 2030 2030 2030 2030 2030 2030 2030 2030
Group9 Pearson
Correlation
.643** .563
** .296
** .613
** .515
** .613
** .337
** .561
** 1 .211
** .803
**
Sig. (2-
tailed)
.000 .000 .000 .000 .000 .000 .000 .000
.000 .000
N 2030 2030 2030 2030 2030 2030 2030 2030 2030 2030 2030
Group10 Pearson
Correlation
.232** .233
** .303
** .234
** .464
** .266
** .033 -.014 .211
** 1 .435
**
Sig. (2-
tailed)
.000 .000 .000 .000 .000 .000 .141 .518 .000
.000
N 2030 2030 2030 2030 2030 2030 2030 2030 2030 2030 2030

191
combine Pearson
Correlation
.822** .678
** .591
** .755
** .740
** .789
** .401
** .614
** .803
** .435
** 1
Sig. (2-
tailed)
.000 .000 .000 .000 .000 .000 .000 .000 .000 .000
N 2030 2030 2030 2030 2030 2030 2030 2030 2030 2030 2030
**. Correlation is significant at the 0.01 level (2-tailed).
6.5 Regression Analysis:
Regression is known as estimation. To estimate direct marketing with the help of
each individual independent variable is considered. In each regression analysis
dependent variable is ‗Direct Marketing‘ denoted by ‗Y‘ and ten independent
variables are denoted as given below.
Dependent Variable = Y
Building Relation and Creating Loyalty. =X1
Convenient Method. = X2
Time Saving. = X3
High Credibility. = X4
Intrudes On Privacy. = X5
Customer care Service. = X6
After sales service. = X7
Quality and Utility of Service. = X8
Consumer Satisfaction. = X9
Exposure to New Product. = X10

192
Table 6.74 Table of Coefficients
Model
Unstandardized
Coefficients
Standardized
Coefficients
t Sig. B
Std.
Error Beta
1 (Constant) 25.828 .667 38.747 .000
Group1 .630 .010 .822 64.996 .000
a. Dependent Variable: combine
Above results indicate that line of Regression of Combine Direct marketing(Y) on
Building Relation and Creating Loyalty (X1 ) is given by Y = 0.630 X1 + 25.828
Table 6.75 Coefficientsa
Model
Unstandardized
Coefficients
Standardized
Coefficients
t Sig. B
Std.
Error Beta
1 (Constant) 32.376 .882 36.722 .000
Group2 .473 .011 .678 41.560 .000
a. Dependent Variable: combine
Above results indicate that line of Regression of Combine Direct marketing(Y) on
convenient Method (X2) is given by Y = 0.437 X2+ 32.376

193
Table 6.76 Coefficientsa
Model
Unstandardized
Coefficients
Standardized
Coefficients
t Sig. B Std. Error Beta
1 (Constant) 36.070 .996 36.198 .000
Group3 .427 .013 .591 32.978 .000
a. Dependent Variable: combine
Above results indicate that line of Regression of Combine Direct marketing(Y) on
Time saving Method (X3 ) is given by Y = 0.427 X3+ 36.070
Table 6.77 Coefficientsa
Model
Unstandardized
Coefficients
Standardized
Coefficients
t Sig. B Std. Error Beta
1 (Constant) 33.838 .683 49.575 .000
Group4 .497 .010 .755 51.773 .000
a. Dependent Variable: combine
Above results indicate that line of Regression of Combine Direct marketing(Y) on
High credibility ( X4 ) is given by Y = 0.497 X4+ 33.838

194
Table 6.78 Coefficients a
Model
Unstandardized
Coefficients
Standardized
Coefficients
t Sig. B Std. Error Beta
1 (Constant) 33.554 .718 46.716 .000
Group5 .516 .010 .740 49.551 .000
a. Dependent Variable: combine
Above results indicate that line of Regression of Combine Direct marketing(Y) on
Intrudes On Privacy ( X5 ) is given by Y = 0.516 X5+ 33.554
Table 6.79 Coefficients a
Model
Unstandardized
Coefficients
Standardized
Coefficients
t Sig. B Std. Error Beta
1 (Constant) 42.389 .468 90.553 .000
Group6 .418 .007 .789 57.901 .000
a. Dependent Variable: combine
Above results indicate that line of Regression of Combine Direct marketing(Y) on
Intrudes On Privacy ( X6 ) is given by Y = 0.418 X6+ 42.389

195
Table 6.80 Coefficients a
Model
Unstandardized
Coefficients
Standardized
Coefficients
t Sig. B
Std.
Error Beta
1 (Constant) 50.599 .926 54.669 .000
Group7 .309 .016 .401 19.722 .000
a. Dependent Variable: combine
Above results indicate that line of Regression of Combine Direct marketing(Y) on
Intrudes On Privacy ( X7 ) is given by Y = 0.309 X7+ 50.599
Table 6.81 Coefficients a
Model
Unstandardized
Coefficients
Standardized
Coefficients t Sig.
B Std.
Error Beta
1 (Constant) 45.118 .687 65.710 .000
Group8 .370 .011 .614 35.017 .000
a. Dependent Variable: combine
Above results indicate that line of Regression of Combine Direct marketing(Y) on
Quality and Utility of Service ( X8 ) is given by Y = 0.370 X8 + 45.118

196
Table 6.82 Coefficients a
Model
Unstandardized
Coefficients
Standardized
Coefficients t Sig.
B Std. Error Beta
1
(Constant) 34.422 .574 59.981 .000
Group9 .515 .008 .803 60.750 .000
a. Dependent Variable: combine
Above results indicate that line of Regression of Combine Direct marketing(Y) on
Consumer Satisfaction ( X9 ) is given by Y = 0.370 X9 + 45.118
Table 6.83 Coefficients a
Model
Unstandardized
Coefficients
Standardized
Coefficients t Sig.
B Std. Error Beta
1
(Constant) 43.749 1.151 37.996 .000
Group10 .327 .015 .435 21.753 .000
a. Dependent Variable: combine
Above results indicate that line of Regression of Combine Direct marketing(Y) on
Exposure to New Product. ( X10 ) is given by

197
Y = 0.370 X10 + 45.118
Chi-Square Table value = 9.49
Table 6.84 Number of Respondents
City No. of Respondents Percent
Mumbai 1250 61.6
Nagpur 250 12.3
Pune 530 26.1
Total 2030 100.0
Respondent %
Result of test = Rejected
From the result of chi-square test it is concluded that null hypothesis is rejected
and alternate hypothesis is accepted.
Above table indicate that out of total 2030 respondents, 1250 respondents are
from Mumbai. 250 respondents are from Nagpur and remaining 530 respondents
are from Pune.
Above information is presented using pie-diagram.

198
Diagram of respondents according to differnt cities
1250250
530
Mumbai
Nagpur
Pune
Figure 6.85 Diagram of respondents according to cities
Table 6.86 Qualification of respondents
Qualification No. of Respondents Percent
SSC 94 4.6
HSC 119 5.9
Graduate 971 47.8
Post graduate 641 31.6
Professional 194 9.6
Doctorate 11 .5
Total 2030 100.0
Above table indicate that out of total 2030 respondents, 94 respondents have
qualification up to SSC. 119 respondents are qualified up to HSC. 971
respondents are Graduate where as 641 respondents are post graduate. 194

199
respondents are professional. And remaining 11 respondents are from category
of Doctorate.
Above information is presented using pie-diagram.
Diagram of respondents according to Qualification.
94119
971
641
194 11
SSC
HSC
Graduate
Post graduate
Professional
Doctorate
Figure 6.87 Pie chart of respondents according to qualification
Table 6.88 Respondents according to age
Age group Frequency Percent
Young Age 1154 56.8
Middle Age 630 31.0
Elderly Age 246 12.1
Total 2030 100.0
Above table indicate that out of total 2030 respondents, 1250 respondents are
from Mumbai. 250 respondents are from Nagpur and remaining 530 respondents
are from Pune.

200
Above information is presented using pie-diagram.
Diagram of respondents according to Age group
1154630
246
Young Age
Middle Age
Elderly Age
Figure 6.89 Diagram of respondents according to age.
Table 6.90 Sex of respondents
Sex Frequency Percent
Female 971 47.8
Male 1059 52.2
Total 2030 100.0
Above table indicate that out of total 2030 respondents, 971 respondents are
female and remaining 1059 respondents are male, Above information is
presented using pie-diagram.

201
Diagram of respondents according to Sex
9711059
Female
Male
Figure 6.91 Diagram of respondents according to sex
Table 6.92 No. of members in family
No. of members in family No. of Respondents Percent
One 190 9.4
Two 866 42.7
Three 371 18.3
Four 335 16.5
Five 211 10.4
Six 57 2.8
Total 2030 100.0
Above table indicate that out of total 2030 respondents, 190 respondents are
from category of only one member in family.866 respondents have two members
in family. 371 respondents have three members in family. 335 respondents are

202
from category of four members in family and remaining 211 and 57 respondents
have five and six members in family respectively.
Above information is presented using pie-diagram.
Diagram of Respondents according to No. of members in
family
190
866
371
335
21157
One
Two
Three
Four
Five
Six
Figure 6.93 Pie chart of respondents according to number of members in
family
Table 6.94 Children in family
Children in family No. of Respondents Percent
Zero 761 37.5
One 676 33.3
Two 360 17.7
Three 179 8.8
Four 54 2.7
Total 2030 100.0
Above table indicate that out of total 2030 respondents, 761 respondents do not
have children. 676 respondents have only one child. 360 respondents have two
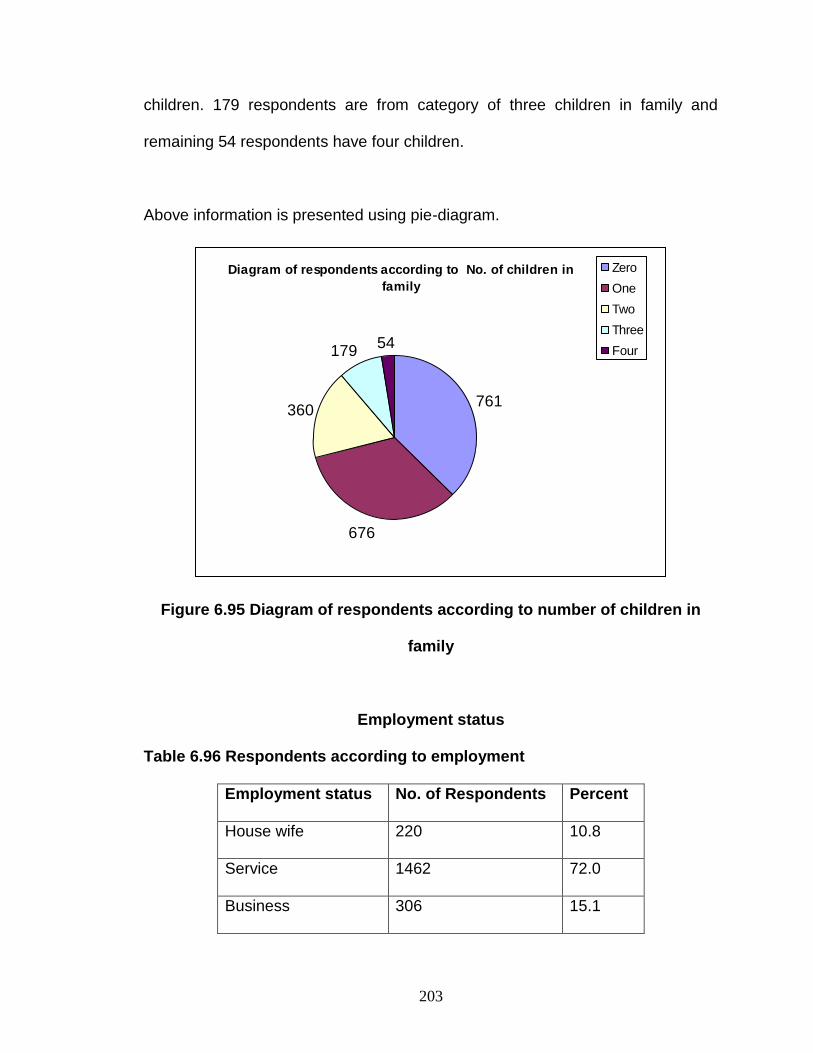
203
children. 179 respondents are from category of three children in family and
remaining 54 respondents have four children.
Above information is presented using pie-diagram.
Diagram of respondents according to No. of children in
family
761
676
360
17954
Zero
One
Two
Three
Four
Figure 6.95 Diagram of respondents according to number of children in
family
Employment status
Table 6.96 Respondents according to employment
Employment status No. of Respondents Percent
House wife 220 10.8
Service 1462 72.0
Business 306 15.1

204
Retired 42 2.1
Total 2030 100.0
Above table indicate that out of total 2030 respondents, 220 respondents are
house wife. 1462 respondents do service where as 306 respondents do business
and remaining 42 respondents are retired.
Above information is presented using pie-diagram.
Diagram of respondents according to Employmen status
220
1462
30642
House wife
Service
Business
Retired
Figure 6.97 Diagram of respondents according to employment status
Table 6.98 Monthly income
Monthly income Frequency Percent
BELOW 5000 220 10.8
5001 – 15000 786 38.8

205
15001 – 25000 766 37.7
25001 – 50000 171 8.4
MORE THAN
50000
87 4.3
Total 2030 100.0
Above table indicate that out of total 2030 respondents, 220 respondents are
house wife. 1462 respondents do service where as 306 respondents does
business and remaining 42 respondents are retired.
Above information is presented using pie-diagram.
Table 6.99 Rankings of direct marketing methods by consumers:
Rank Direct marketing
method
Percentage
1.
Company‘s Distributor 29%
2. Telephone 24%
3. Company‘s Salesmen 20%
4. Internet 8%
5. Television Shopping 5%
6. Response Advertising 4.17%

206
The method of direct marketing through the company‘s distributor was ranked
first and appears to be a popular method of direct marketing.
Table 6.100 Awareness of Direct marketing methods:
Direct Marketing method Average Rank
Telephone 3.2
Mail 4.33
Response Advertising 3.96
Company‘s salesman 2.64
Company‘s Distributor 2.61
Television Shopping 3.89
Internet 4.45
6.6 Findings:
The average rank given by the respondents among the direct marketing
methods was to the company‘s salesman at2.6 and company‘s distributor
also at 2.6.These were followed by Telephone and television shopping
at 3.12 & 3.89.respectively.The mail and the internet were ranked by
consumers at 4.3 and 4,4 respectively.
The result of the cross tabulation of direct marketing and Income group of
respondents showed that the highest income group had a good
awareness of direct marketing, whereas in the lower income group, only

207
50% of respondents were aware of direct marketing as compared to the
high income group, where 78% of respondents were aware of direct
marketing.
The cross-tabulation of direct marketing with the age of respondents
showed that the younger age group (18-25 years) had a high level of
awareness of direct marketing (56.8%), followed by the middle age-group
(26-40) years at 66% and lastly was the elderly age group.
Consumers find direct marketing a convenient method of making market
transactions. Nearly, 68% of respondents agree and 14.2% strongly agree
that direct marketing is a convenient method to make buying decisions.
Therefore the null hypothesis is rejected and the alternate hypothesis is
accepted. Traditional retailing requires consumers to go retail outlets to
make purchases, whereas shopping from home saves commutation time
and effort. They can shop at leisure, and at their convenience, by calling
direct marketers at times convenient to them.
The level of awareness for the direct marketing methods is high among
consumers. The company‘s salesman is the first in awareness at 81%,
followed by telephone marketing at second with 80% of consumers.
Response advertising has the least level of awareness and direct

208
marketing through the mail is second last with66.49% respondents aware
of this method.
The study reveals that the respondents find direct marketing to be a
convenient method of shopping.71.7%of the respondents agree, and 17%
strongly agree to direct marketing being an convenient method of
shopping. The channels of direct marketing are open for longer time than
traditional retail outlets and the internet is available 24/7, enabling
consumers to shop at leisure and at a time convenient to them.
The agents of direct marketing who approach consumers with products
are generally known to them hence consumer find it comfortable and easy
to find explanation about products from them making market transactions
become easy through sources which have high credibility in the mind of
consumers.
Table 6.101 Proving the Hypothesis
Sr. No. Null Hypothesis Alternate Hypothesis
1. Direct marketing does not help to
build relations and create loyalty
among customers…Rejected
Direct marketing helps to build
relations and create loyalty among
customers.
Accepted.

209
2. Consumers do not find direct
marketing to be a convenient
method to make buying
decisions.
Rejected
Consumers find direct marketing to
be a convenient method to make
buying decisions.
Accepted
3. Direct marketing is not a time
saving method of market
transactions.
Rejected
Direct marketing is a time saving
method of market transactions.
Accepted.
4. The sales agents of direct
marketing do not have high
credibility and are not able to find
prospects.
Rejected
The sales agent of direct marketing
have high credibility and are able
to find prospects.
Accepted
5. Direct marketing intrudes upon
the privacy of consumers.
Rejected
Direct marketing does not intrude
upon the privacy of consumers
Accepted.
6. Direct marketing does not
provide good customer care.
Rejected
Direct marketing does provide
good customer care.
Accepted
7. Direct marketing does not
provide good after sales services
Direct marketing does not provide
good after sales services to

210
to consumers.
Rejected
consumers.
Accepted
8. The products sold through direct
marketing are not good in quality
and utility.
Rejected
The products sold through direct
marketing are good in quality and
utility.
Accepted
9. The consumers are not satisfied
with products sold through direct
marketing.
Rejected
The consumers are satisfied with
products sold through direct
marketing.
Accepted
10. There is no impact of
demographic factors to build
relations and create loyalty in
direct marketing
Accepted.
There is impact of demographic
factors to build relations and create
loyalty in direct marketing
Rejected
11. Direct marketing is not equally
convenient method for various
demographic factors.
Rejected
Direct marketing is equally
convenient method for various
demographic
factors.
Accepted
The above table it is clear that direct marketing helps in building relations
with consumers, hence the null hypothesis is rejected. Similarly the null

211
hypothesis for convenient method and time saving method is also rejected
as consumers find direct marketing a convenient way to shop because
through direct marketing they can call direct marketers (any method) at a
time wherein they can devote wholly to market transactions
According to the findings of the survey, consumers do not find direct
marketing to be an intrusion on their privacy. About 80% of consumers do
not find direct marketing making any negative impact on their lives. They
do not find the calls or visits by salesman an intrusion on their privacy.
Consumers are also happy with the customer care and after sales service
of direct marketing .According to 83% of consumers, they agree to direct
marketers concern for them as expressed through good customer care
and after sales service.

212
Conclusions

213
CHAPTER 7
CONCLUSIONS
1. Consumers find direct marketing a good method to build relations between
consumer and the company. The direct marketers have high credibility among
consumers, and it becomes easy to make market transactions. They help
consumers in explaining products, help consumers to make effective buying
decision, and also solve after sales problems in relation to products. Hence,
direct marketing is an effective method to convert prospects into loyal
consumers.
2 It has emerged from the survey that the effect of direct marketing on
consumers is medium. About 80% of consumers agree that direct marketing
provides a benefits, are satisfied with direct marketing and find it a pleasure to
shop through direct marketers. Consumers also agree that direct marketing helps
in building good relations. Therefore it is advisable for companies to apply direct
marketing and build good relations with consumers and win loyalty.
3 The findings of the survey indicate that direct marketing has a high level of
awareness among the higher levels of the society, many of whom are its patrons.
Direct marketers must note that while they nurture this consumer class they must
also address the middle classes with marketing promotions and the product mix
which appeal to this class to increase their consumer base.

214
4 It is interesting to note that the younger class of consumers (18-25 years), have
a high awareness of direct marketing. It will be beneficial for direct marketers to
raise awareness of methods of direct marketing with low awareness among
these class for e. g. television shopping, response advertising and the internet by
launching appealing products and improving after sale services.
5 Respondents have expressed satisfaction on the benefits provided by direct
marketing. The benefit of convenience and that of time saving in commutation
provided by direct marketers in particular are appreciated by consumers.
Consumers appreciate in particular the leisure provided by direct marketing in
fulfilling their desires of shopping , sometimes 24/7 as in the case of internet as
also calling salesman at times they can devote wholly to market transactions.
6 The finding of the survey imply that consumers find the after sales service
through direct marketing good and satisfying. In cases of replacement or other
queries on products the time taken to attend to the complaint must be prompt.
Direct marketers need to pay more attention to after sales service and improvise
the methods of attending to the complaints of consumers and exchange of
product in cases of dissatisfaction.
7 Contrary to reports from other surveys respondents of this survey do not find
direct marketing an intrusion in their privacy. They do not mind occasional calls
215
by direct marketers for sale of their products, at the same time care must be
taken not to irritate consumers with frequent calls.
8 From the Pearson‘s correlation table it is clear that the major factors from
amongst the ten , that which contribute to the effectiveness of the strategy of
direct marketing is that of building relations and loyalty. Consumer, satisfaction,
and good customer care. Direct marketers can take note and concentrate on
these factors so that consumers are satisfied with direct marketing and remain
loyal to it in future.. The other factors as expressed by consumers have low
contribution. After sales service, Exposure to new products and Time saving
have not much effect on consumers,

216
Recommendations

217
CHAPTER 8
RECOMMENDATIONS
1 It is evident from the findings of the survey that direct marketing helps in
building relations with consumers on an on-going basis. The telephone & internet
keep marketers and consumers in contact 24/7. Therefore marketers can apply
direct marketing in building consumer contact, which will last for a long time after
the purchase transaction with the consumer is over.
2 The findings of the survey also revealed that the effect of direct marketing on
consumers is positive. Consumers find direct marketing an easy and satisfying
method of fulfilling their desires for products. Therefore the strategy is relevant in
the Indian market environment. At the same time, it must be noted that
consumers comment on direct marketing is medium, i.e bulk of consumers agree
to direct marketing being a good strategy to market products, but only about 20%
consumers strongly agree to it. Therefore direct marketers need to put in more
emphasis and effort on the identified factors in the study, so that the effect of
direct marketing on consumers becomes stronger
3 There is high level of awareness for direct marketing among the young age
group. Therefore new products which appeal to the young could be launched
through direct marketing channels. New channels e.g internet also has a high
level of awareness; hence the application of this channel for marketing can be

218
explored in future. Though this study takes is with reference to household
products other products categories can be launched through this strategy.
4 Most attributes of direct marketing contribute to increasing its effect on
consumers, but the dark areas of after sales services and customer care need
more attention. Handling of consumer complaints and replacements of products,
go hand-in-hand to build consumer satisfaction, and maintain long- lasting
relations with customers.
5 The findings of the survey, do not point to any concern of consumers on direct
marketing. The Indian consumers do not regard direct marketing as an intrusion
on their privacy. They appreciate the efforts of direct marketing in aiding to enrich
their lives

219
BIBLIOGRAPHY

220
CHAPTER 9
BIBLIOGRAPHY
Aaker D. A. & Bruzzone D. (1985)Causes of irritation in advertising.
Journal of marketing47-57.
Alexander J Campbell (2011) Managerial & consumer attitudes about
information privacy – Journal of Direct Marketing (pg.44-57)
Armstrong G & Kotler P (2003), Marketing an Introduction, Publisher:
Pearson Education, Singapore 11th Edition (pg. 3).
Baker Michael (2000), Marketing Handbook, New Delhi Viva Books
Berry, Linoff G. (2004)Data Mining Techniques for Marketing ,Sales and
Customer Relationship Management, 2 Edition New Delhi; Wiley
Dreamtech India.
Bill Living Stone, Handbook in marketing (1998) Publisher: NTC business
books, Chicago 2ndedition (pg.241)
Blackwell, Roger D & Others (2001), Consumer Behavior Publisher:
Thomson, Australia 9th Edition.

221
Bly Robert (1998) – Business to business direct marketing: proven direct
response methods to generate more leads & sales ; Publisher: NTC
business books, Chicago 1998 2nd Edition (pg. 5)
Bose, Indrani (Apr-Jun2009), Quantitative Models in Support of Direct
Marketing in Electronic Channels, Journal of Marketing, Vol, 19,Issue 2,
p83-84,2p.
Breham J. W. (1966)A theory of psychological Reactance San diego, CA
Academic Press
Chaturvedi Mukesh (1999), Direct Marketing cases and texts Publisher:
Himalayan Publishing Co. (pg. 4 & 9)
Cheskin Research (2000), Trust in the wired America and Greater e-China
Insights, On-line behaviours and attitudes in greater China.
www.cheskin.com
Chet Meisner (2006), The Complete Guide to Marketing Publisher:
Kaplan publishing, USA. MARY Lou Roberts& Paul D. Berger (2000),
Direct Marketing Management , Publisher: Prentice Hall, New York(pg 4-5,
& pg 231)

222
Cynthia Webster, ―Effects of Hispanic Ethnic Identification on Martial roles
in Purchase Decision‖, Journal of Consumer Research, Vol. 21
(September 1994), pp.319-331.
Danna Nicoleta Lascu (2009), - International marketing - What do we
really know – Journal of Marketing Vol 63 (1) (pg. 234 & 235)
D. Cooper & P. Schindler, Business Research Methods 6E, Mcgraw- Hill
International Editions, pg 559.
Dennis B Arnett, Steve D German & Shelboy D Hunt (2003), The Identity
Salience Model of relationship Marketing success. The case of Non-profit
Marketing – Journal of Marketing Vol 67 (pg. 89-105).
Dunne, Lusch (1999) Retailing, 3rd. Edition, Dryden Press, Fortworth
Annual Report, Direct Marketing Association of India , 2009.
Drayton Bird, Commonsense direct marketing, Second edition.
Publisher : Mc Graw Hill, USA (pg. 28)

223
Edward Nash (1985), Direct Marketing, Publisher: Mcgraw Hill, New York
1st Edition.
Fennis B. M. & Bakker A. (2001) Need to evaluate moderates the transfer
of irritation in advertising, Journal of advertising 30 (3) pg
Elizabeth Wolgast(1958), Family Influences, Sapna Rakesh, Soumendu
Bhattacharya, Manoj Kumar Dash (Jan 2009) Marketing Innovations for
Reaching Consumers Wisdom Publication Delhi , pg 21.
Fennis B. M. & Bakker A. (2001) Need to evaluate modertes and transfer
of irritation in advertising, Journal of advertising 30 (3) pg
Firzrory Dearborn (2003), Encyclopedia of Advertising, Publisher: Mc
Millan, New York.
Gayatri Varma (2005), Online marketing, Publisher: New Century
Publications, New Delhi (pg. 65).
Gengler, Charles E. and Leszczyc, Peter T.L Popk (Winter 1997),Using
Customer Satisfaction Research for Relationship Marketing: A Direct
Marketing Approach, Journal of Direct Marketing Vol.11 Issue 1,p23-
29,7p.

224
Goodwill C. (1991)Privacy: Recognition of a consumer Rights, Journal of
Public Policy and Marketing, Vol. 10 . 149-166.
Hoekstra (1993), Managerial and Consumer Attitudes about Information
Privacy, Journal of Direct Marketing Volume 11 Winter(1997)
Jackson Paul & Others (2003), E-business Fundamentals, Publishers:
Routledge, London.
Japan Direct Marketing Association (1997)JADMA Survey on Direct
Marketing Usage Report No. 4.
J. K. Sachdeva (2008), Business Research Methodology, Himalaya
Publishing House
Jutkins (1996), power direct marketing: how to make it work for you
Publishers: NTC Business Books, USA.
Juxtconsult, – Indian Consumer Landscape 2010 – Consumers in
India.www.maharashtra.com

225
Keegan W J(2004)-Global Marketing Management , Publishers: Prentice
Hall of India – New Delhi 7th Edition.
Kochran William (1977), Sampling Techniques, John Wiley and Sons,
New York.
Komorousky‘s Mirra (1961) , Journal of Marketing.
Kothari C.R. (2004), Research Methodology methods and techniques,
New Age International (P) Ltd. Publishers, New Delhi.
Kotler, Killer, Lane (2004) Marketing Management, Publishers:
Prentice Hall of India – New Delhi 12th Edition.
Leon Schiffman, Leslie Laza Kamuk (1997) , Consumer Behaviour,
Publisher – Prentice Hall of India Pvt Ltd, New Delhi (pg 35).
Li ,h,Edwards S. &Lee H.(2002) Measuring the intrusiveness of
advertisements: Scale development and validation. Journal of advertising
31(2) pg 37-47.

226
Sapna Rakesh, Soumendu Bhattacharya, Manoj Kumar Dash (Jan 2009)
Marketing Innovations for Reaching Consumers Wisdom Publication Delhi
, pg 21.
Mary Culnan (1995) – consumer awareness of name removal procedures
; implication for direct marketing journal of direct marketing Vol 9 (pg 10 -
19),
Mary Lou Roberts, Paul Berger (1999), Direct Marketing Management,
Publisher: Prentice Hall, New Delhi.
Maynard M. L. & Taylor C. R. (1996), A comparative analysis of Japanese
and U. S. attitudes towards Direct Marketing , Journal of Direct Marketing
10 (1) 34-44.
Mcdaniel, Lamb, Hair, (2007) Marketing essentials, 5th edition Publishers:
Melissa Accuna, Thomson Canada (pg 363-64) .
Michael Baker (2000), Marketing Handbook, New Delhi, Viva Books.
Page C& Luding y. (2003) Bank manager‘s dilemmas : Customer‘s
attitudes and purchase intentions, International Journal of Bank marketing
21 (3) pg147-163.

227
Peter T.L. Popkowskileszczyz, Charles Gangler (2011) – Using customer
satisfaction research for relationship marketing ; a direct marketing
approach Journal of interactive marketing
Pitch (2005), Evolving Urban Women, Issue Sept. 2005. Pg85.
Rawwas, M.A. Strutton, & JohnL.W. (1996) An Exploratory investigation
of the ethical values of American & Australian Consumers, Journal of
Direct Marketing 10 (4) 52-63.
Reddy R J (2004), Marketing Management Publisher:
APH Publishing Corporation, New Delhi.
Robert Mchatton (1988) – Total telemarketing Publisher: Stephen Kippur
(pg. 138 & 240).
Schultz, Don E. (Winter96) From The Editor Journal of Direct Marketing
Vol. 10 Issue 1 p7-9, 3p.
Shelly Singh / Rajan (2011), From e to Commerce, Economic Times,
September 2011, pg. 8.

228
Shrutika Verma (2012), E- Tailing Wars, The race to the top of the on-line
shopping industry is wide open, Business World, Feb. 2012 pg. 34
S. L. Gupta (2003), Marketing Research, Publisher Excel Books, Waraina,
New Delhi.
Stanton, Etzel, Walker (1994) – Fundamental of marketing, Publisher :
Mcgraw Hill International Singapore 10th Edition (pg. 410)
Sterne Priorre (2000) – E- mail marketing, Publisher: Wiley & Sons, USA
(pg. 6)
Vaswar Dasgupta (2001), Marketing Mantra-The real story of Direct
Marketing in India, Prentice Hall of India, Pvt. Ltd. New Delhi pg 95.
Werner Reinartz & V Kumar (2003)– The impact of Customer Relationship
Characteristic on Profitable Lifetime Duration – Journal of Marketing Vol
67 (pg. 77-99).
Wallis Report (1997) The Financial System Inquiry , AGPS, Canberra.

229
Wilkie‘s Study (1975), Family Influences, Sapna Rakesh, Soumendu
Bhattacharya, Manoj Kumar Dash (Jan 2009) Marketing Innovations for
Reaching Consumers Wisdom Publication Delhi ,

230
Annexures

231
Questionnaire
(Please answer the questions candidly. Your replies will be strictly used for
academic purposes and kept confidential.)
1. Name: ________________________________________
2. Residential Address :
________________________________________________
3. Qualifications : ____________________________________
4. Age : ____________________
5. Sex : M / F ; Family size __________adults __________children
6. Employment status : Service / Business / not applicable.
7. Monthly Emoluments : Below Rs.5000/- _________ Rs.5000-Rs.15000/-
_______
Rs.15000 – Rs.25000 _______ Rs.25000 – Rs.50000 _____ >Rs.50000 ______
8. Please (tick) against the methods of shopping from home, that you are
aware of from the following.
Telephone …………………………….
Mail ……………………………….
Response Advertising ………………………
Company‘s distributor (MLM) ……………………………..
Company‘s Salesman ……………………………..
Television shopping ……………………………..

232
Internet …………………………….
9. Please rank the above methods according to your preference (give most
preferred rank ..1 and least ..7)
Telephone …………………………….
Mail ……………………………….
Response Advertising ………………………
Company‘s distributor (MLM) ……………………………..
Company‘s Salesman ……………………………..
Television shopping ……………………………..
Internet …………………………….
10. a) Have you shopped from any of these methods ? Mention them.
b) Please name a few products that you have purchased from the methods
mentioned in
Part II
In the following questions the word ‗source‘ refers to the company / manufacturer
/ representative of the company/distributor/companies call centre/response
advertising.

233
Please put a v against your answer: 1…Strongly agree, 2….Agree, 3.Somewhat
agree, 4….Somewhat disagree, 5.Disagree…6.Strongly disagree.
1 2 3 4 5 6
11 I am happy about the new methods to reach
customers
12 The source has high credibility
13 I can rely on the information provided by the
source
14 I can immediately solve queries about the
products
15 I can respond to the source at my
convenience.
16 I have sufficient time to make purchase
decisions
17 I can comprehend the product better while
interacting with the source
18 I waste minimum time in seeking information
19 Generally the source is known to me
20 I save on commutation
21 My time spent on shop-hopping is reduced
22 It makes me aware of products of national/
international brands

234
23 I find it easier to react with the source
24 In the environs of office/home, I can talk with
ease on personal issues.
25 I do not think, it is an intrusion on my privacy
26 I feel it wrong, on part of the source to seek
personal information about me.
27 Sometimes, I am irritated by calls from the
source, inspite of my refusals.
28 I am surprised at the amount of information I
receive, that is of no interest to me
29 I am highly satisfied, with my interactions with
the source.
30 My satisfaction of the product is of deep
concern to the source.
31 I would certainly like to interact with the source
in future.
32 The source interacts with me about other
products from time to time.
33 I am thankful of the care and interest the
source has in my well being.
34 I think the source is happy with its business
with me
35 I, think I have a friend in the source
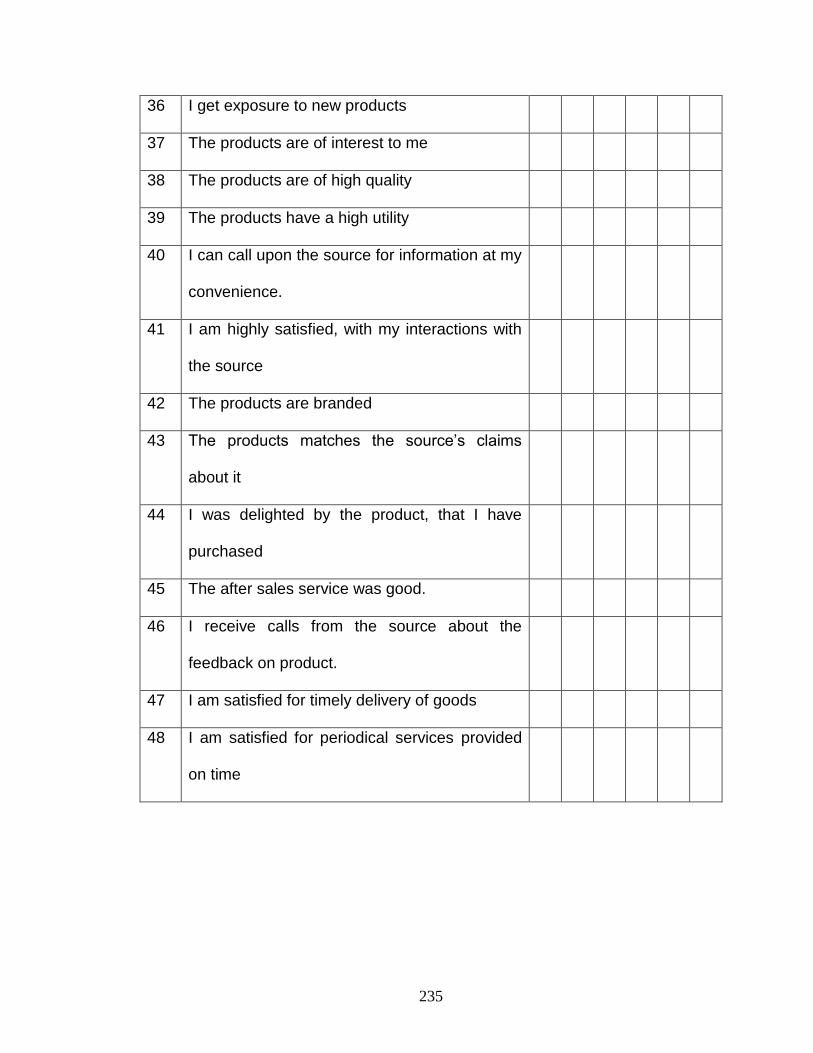
235
36 I get exposure to new products
37 The products are of interest to me
38 The products are of high quality
39 The products have a high utility
40 I can call upon the source for information at my
convenience.
41 I am highly satisfied, with my interactions with
the source
42 The products are branded
43 The products matches the source‘s claims
about it
44 I was delighted by the product, that I have
purchased
45 The after sales service was good.
46 I receive calls from the source about the
feedback on product.
47 I am satisfied for timely delivery of goods
48 I am satisfied for periodical services provided
on time

236
Table Variable
QN. ITEM SCALE VARIABLE
11 I am happy about the new methods to
reach customers
Consumer Satisfaction
12 The source has high credibility Credibility
13 I can rely on the information provided by
the source
Credibility of information
14 I can immediately solve queries about the
products
Customer care service
15 I can respond to the source at my
convenience.
Time saving
16 I have sufficient time to make purchase
decisions
Time saving
17 I can comprehend the product better
while interacting with the source
Convenience
18 I waste minimum time in seeking
information
Time saving
19 Generally the source is known to me Building relation & creating
Loyalty
20 I save on commutation Time saving
21 My time spent on shop-hopping is
reduced
Time saving

237
22 It makes me aware of products of
national/ international brands
Exposure to new products
23 I find it easier to react with the source High credibility
24 In the environs of office/home, I can talk
with ease on personal issues.
Intrudes on privacy
25 I do not think, it is an intrusion on my
privacy
Intrudes on privacy
26 I feel it wrong, on part of the source to
seek personal information about me.
Intrudes on privacy
27 Sometimes, I am irritated by calls from
the source, inspite of my refusals.
Intrudes on privacy
28 I am surprised at the amount of
information I receive, that is of no interest
to me
Exposure to new products
29 I am highly satisfied, with my interactions
with the source.
Customer satisfaction
30 My satisfaction of the product is of deep
concern to the source.
High credibility
31 I would certainly like to interact with the
source in future.
Intrudes on privacy
32 The source interacts with me about other
products from time to time.
Building relations & creating
Loyalty
33 I am thankful of the care and interest the Customer care service

238
source has in my well being.
34 I think the source is happy with its
business with me
Consumer Satisfaction
35 I, think I have a friend in the source Intrudes upon privacy
36 I get exposure to new products Exposure to new products
37 The products are of interest to me Building relations & creating
Loyalty
38 The products are of high quality Products good in quality
& utility
39 The products have a high utility Products good in quality
& utility
40 I can call upon the source for information
at my convenience.
Convenient method
41 I am highly satisfied, with my interactions
with the source
Consumer satisfaction
42 The products are branded Building relations & creating
Loyalty
43 The products matches the source‘s
claims about it
Good in quality &
Utility
44 I was delighted by the product, that I have
purchased
Consumer satisfaction
45 The after sales service was good. After sales service
46 I receive calls from the source about the Customer care service

239
feedback on product.
47 I am satisfied for timely delivery of goods After sales service
48 I am satisfied for periodical services
provided on time
After sales service
Frequency Table
Table. 1 City
Frequency Percent Valid Percent
Mumbai 1250 61.6 61.6
Nagpur 250 12.3 12.3
Pune 530 26.1 26.1
Total 2030 100.0 100.0
Table 2 QUALIFICATION
Frequency Percent Valid Percent
Valid Doctorate 11 .5 .5
Graduate 971 47.8 47.8
HSC 119 5.9 5.9
Post graduate 641 31.6 31.6

240
Table. 3 Age
Frequency Percent Valid Percent
Valid Elderly Age 246 12.1 12.1
Middle Age 630 31.0 31.0
Young Age 1154 56.8 56.8
Total 2030 100.0 100.0
Table 4 SEX
Frequency Percent Valid Percent
Valid Female 971 47.8 47.8
Male 1059 52.2 52.2
Total 2030 100.0 100.0
Table 5 Number_of_members_in_Family
Frequency Percent Valid Percent
Valid Five 211 10.4 10.4
Four 335 16.5 16.5
One 190 9.4 9.4
Six 57 2.8 2.8
Three 371 18.3 18.3
Two 866 42.7 42.7
Total 2030 100.0 100.0

241
Table 6 Children_in_family
Frequency Percent Valid Percent Cumulative
Percent
Valid Four 22 1.1 1.1 1.1
One 676 33.3 33.3 34.4
Six 32 1.6 1.6 36.0
Three 179 8.8 8.8 44.8
Two 360 17.7 17.7 62.5
Zero 761 37.5 37.5 100.0
Total 2030 100.0 100.0
Table 7 Employment_Status
Frequency Percent Valid
Percent
Cumulative
Percent
Valid BUSINESS 306 15.1 15.1 15.1
House wife 220 10.8 10.8 25.9
Retired 42 2.1 2.1 28.0
SERVICE 1462 72.0 72.0 100.0
Total 2030 100.0 100.0

242
Table 7 Monthly_Income
Frequency Percent Valid
Percent
Cumulative
Percent
Valid 15000 –
25000
766 37.7 37.7 37.7
25000 –
50000
171 8.4 8.4 46.2
5000 - 15000 425 20.9 20.9 67.1
5000 -15000 361 17.8 17.8 84.9
BELOW 5000 220 10.8 10.8 95.7
MORE THAN
50000
87 4.3 4.3 100.0
Total 2030 100.0 100.0
Table 8 Frequency Table
Frequency Percent Valid Percent Cumulative
Percent
Valid Agree 704 34.7 34.7 34.7
Disagree 39 1.9 1.9 36.6
Some What
Agree
376 18.5 18.5 55.1
Some What
Disagree
47 2.3 2.3 57.4

243
Strongly
Agree
861 42.4 42.4 99.9
Strongly
Disagree
3 .1 .1 100.0
Total 2030 100.0 100.0
Table 9 Q12
Frequency Percent Valid
Percent
Cumulative
Percent
Valid Agree 803 39.6 39.6 39.6
Disagree 39 1.9 1.9 41.5
Some What
Agree
541 26.7 26.7 68.1
Some What
Disagree
306 15.1 15.1 83.2
Strongly
Agree
289 14.2 14.2 97.4
Strongly
Disagree
52 2.6 2.6 100.0
Total 2030 100.0 100.0

244
Table 10 Q13
Frequency Percent Valid
Percent
Cumulative
Percent
Valid Agree 585 28.8 28.8 28.8
Disagree 44 2.2 2.2 31.0
Some What
Agree
795 39.2 39.2 70.1
Some What
Disagree
359 17.7 17.7 87.8
Strongly
Agree
186 9.2 9.2 97.0
Strongly
Disagree
61 3.0 3.0 100.0
Total 2030 100.0 100.0
Table 11 Q14
Frequency Percent Valid Percent Cumulative
Percent
Valid Agree 704 34.7 34.7 34.7
Disagree 210 10.3 10.3 45.0
Some What
Agree
437 21.5 21.5 66.6
Some What 311 15.3 15.3 81.9

245
Disagree
Strongly
Agree
286 14.1 14.1 96.0
Strongly
Disagree
82 4.0 4.0 100.0
Total 2030 100.0 100.0
Table 12 Q15
Frequency Percent Valid
Percent
Cumulative
Percent
Valid Agree 781 38.5 38.5 38.5
Disagree 172 8.5 8.5 46.9
Some What
Agree
415 20.4 20.4 67.4
Some What
Disagree
315 15.5 15.5 82.9
Strongly
Agree
344 16.9 16.9 99.9
Strongly
Disagree
3 .1 .1 100.0
Total 2030 100.0 100.0

246
Table 13 Q16
Frequency Percent Valid
Percent
Cumulative
Percent
Valid Agree 734 36.2 36.2 36.2
Disagree 108 5.3 5.3 41.5
Some What
Agree
419 20.6 20.6 62.1
Some What
Disagree
270 13.3 13.3 75.4
Strongly
Agree
474 23.3 23.3 98.8
Strongly
Disagree
25 1.2 1.2 100.0
Total 2030 100.0 100.0
Table 14 Q17
Frequency Percent Valid Percent Cumulative
Percent
Valid Agree 703 34.6 34.6 34.6
Disagree 61 3.0 3.0 37.6
Some What
Agree
432 21.3 21.3 58.9
Some What 186 9.2 9.2 68.1

247
Disagree
Strongly
Agree
578 28.5 28.5 96.6
Strongly
Disagree
70 3.4 3.4 100.0
Total 2030 100.0 100.0
Table15 Q18
Frequency Percent Valid
Percent
Cumulative
Percent
Valid Agree 688 33.9 33.9 33.9
Disagree 148 7.3 7.3 41.2
Some What
Agree
458 22.6 22.6 63.7
Some What
Disagree
259 12.8 12.8 76.5
Strongly
Agree
465 22.9 22.9 99.4
Strongly
Disagree
12 .6 .6 100.0
Total 2030 100.0 100.0

248
Table 16 Q19
Frequency Percent Valid Percent Cumulative
Percent
Valid Agree 527 26.0 26.0 26.0
Disagree 345 17.0 17.0 43.0
Some What
Agree
478 23.5 23.5 66.5
Some What
Disagree
348 17.1 17.1 83.6
Strongly
Agree
301 14.8 14.8 98.5
Strongly
Disagree
31 1.5 1.5 100.0
Total 2030 100.0 100.0
Table 17 Q20
Frequency Percent Valid Percent Cumulative
Percent
Valid Agree 670 33.0 33.0 33.0
Disagree 65 3.2 3.2 36.2
Some What
Agree
404 19.9 19.9 56.1
Some What 263 13.0 13.0 69.1

249
Disagree
Strongly
Agree
588 29.0 29.0 98.0
Strongly
Disagree
40 2.0 2.0 100.0
Total 2030 100.0 100.0
Table 18 Q21
Frequency Percent Valid Percent Cumulative
Percent
Valid Agree 757 37.3 37.3 37.3
Disagree 87 4.3 4.3 41.6
Some What
Agree
493 24.3 24.3 65.9
Some What
Disagree
177 8.7 8.7 74.6
Strongly
Agree
495 24.4 24.4 99.0
Strongly
Disagree
21 1.0 1.0 100.0
Total 2030 100.0 100.0

250
Table 19 Q22
Frequency Percent Valid Percent Cumulative
Percent
Valid Agree 798 39.3 39.3 39.3
Disagree 80 3.9 3.9 43.3
Some What
Agree
425 20.9 20.9 64.2
Some What
Disagree
201 9.9 9.9 74.1
Strongly
Agree
470 23.2 23.2 97.2
Strongly
Disagree
56 2.8 2.8 100.0
Total 2030 100.0 100.0
Table 20 Q23
Frequency Percent Valid Percent Cumulative
Percent
Valid Agree 580 28.6 28.6 28.6
Disagree 103 5.1 5.1 33.6
Some What
Agree
673 33.2 33.2 66.8
Some What 366 18.0 18.0 84.8

251
Disagree
Strongly
Agree
263 13.0 13.0 97.8
Strongly
Disagree
45 2.2 2.2 100.0
Total 2030 100.0 100.0
Table 21 Q24
Frequency Percent Valid Percent Cumulative
Percent
Valid Agree 581 28.6 28.6 28.6
Disagree 183 9.0 9.0 37.6
Some What
Agree
625 30.8 30.8 68.4
Some What
Disagree
356 17.5 17.5 86.0
Strongly
Agree
204 10.0 10.0 96.0
Strongly
Disagree
81 4.0 4.0 100.0
Total 2030 100.0 100.0

252
Table 22 Q25
Frequency Percent Valid Percent Cumulative
Percent
Valid Agree 436 21.5 21.5 21.5
Disagree 273 13.4 13.4 34.9
Some What
Agree
556 27.4 27.4 62.3
Some What
Disagree
366 18.0 18.0 80.3
Strongly
Agree
245 12.1 12.1 92.4
Strongly
Disagree
154 7.6 7.6 100.0
Total 2030 100.0 100.0
Table 23 Q26
Frequency Percent Valid Percent Cumulative
Percent
Valid Agree 408 20.1 20.1 20.1
Disagree 170 8.4 8.4 28.5
Some What
Agree
501 24.7 24.7 53.2
Some What 446 22.0 22.0 75.1

253
Disagree
Strongly
Agree
449 22.1 22.1 97.2
Strongly
Disagree
56 2.8 2.8 100.0
Total 2030 100.0 100.0
Table 24 Q27
Frequency Percent Valid Percent Cumulative
Percent
Valid Agree 553 27.2 27.2 27.2
Disagree 117 5.8 5.8 33.0
Some What
Agree
372 18.3 18.3 51.3
Some What
Disagree
271 13.3 13.3 64.7
Strongly
Agree
660 32.5 32.5 97.2
Strongly
Disagree
57 2.8 2.8 100.0
Total 2030 100.0 100.0

254
Table 25 Q28
Frequency Percent Valid Percent Cumulative
Percent
Valid Agree 771 38.0 38.0 38.0
Disagree 145 7.1 7.1 45.1
Some What
Agree
502 24.7 24.7 69.9
Some What
Disagree
260 12.8 12.8 82.7
Strongly
Agree
311 15.3 15.3 98.0
Strongly
Disagree
41 2.0 2.0 100.0
Total 2030 100.0 100.0
Table 26 Q29
Frequency Percent Valid Percent Cumulative
Percent
Valid Agree 495 24.4 24.4 24.4
Disagree 147 7.2 7.2 31.6
Some What
Agree
825 40.6 40.6 72.3
Some What 324 16.0 16.0 88.2

255
Disagree
Strongly
Agree
160 7.9 7.9 96.1
Strongly
Disagree
79 3.9 3.9 100.0
Total 2030 100.0 100.0
Table 27 Q30
Frequency Percent Valid
Percent
Cumulative
Percent
Valid Agree 511 25.2 25.2 25.2
Disagree 199 9.8 9.8 35.0
Some What
Agree
587 28.9 28.9 63.9
Some What
Disagree
406 20.0 20.0 83.9
Strongly
Agree
228 11.2 11.2 95.1
Strongly
Disagree
99 4.9 4.9 100.0
Total 2030 100.0 100.0

256
Table 28 Q31
Frequency Percent Valid Percent Cumulative
Percent
Valid Agree 679 33.4 33.4 33.4
Disagree 94 4.6 4.6 38.1
Some What
Agree
676 33.3 33.3 71.4
Some What
Disagree
288 14.2 14.2 85.6
Strongly
Agree
192 9.5 9.5 95.0
Strongly
Disagree
101 5.0 5.0 100.0
Total 2030 100.0 100.0
Table 29 Q32
Frequency Percent Valid
Percent
Cumulative
Percent
Valid Agree 634 31.2 31.2 31.2
Disagree 134 6.6 6.6 37.8
Some What
Agree
676 33.3 33.3 71.1
Some What 198 9.8 9.8 80.9
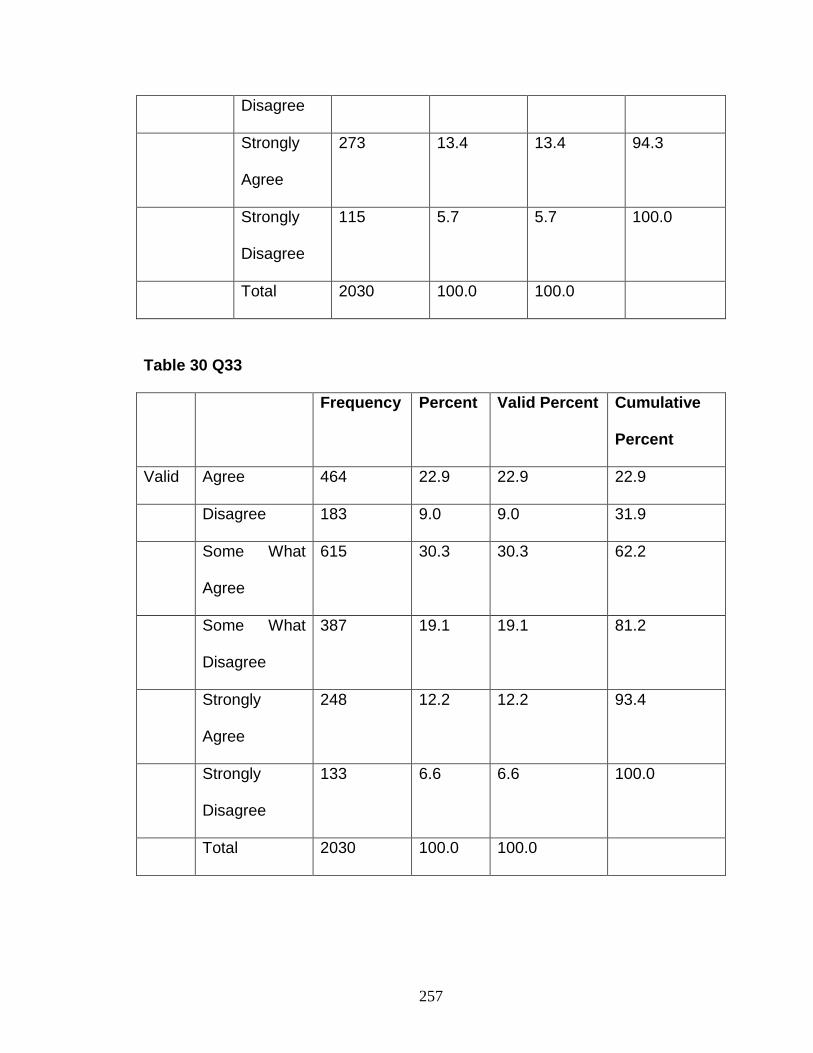
257
Disagree
Strongly
Agree
273 13.4 13.4 94.3
Strongly
Disagree
115 5.7 5.7 100.0
Total 2030 100.0 100.0
Table 30 Q33
Frequency Percent Valid Percent Cumulative
Percent
Valid Agree 464 22.9 22.9 22.9
Disagree 183 9.0 9.0 31.9
Some What
Agree
615 30.3 30.3 62.2
Some What
Disagree
387 19.1 19.1 81.2
Strongly
Agree
248 12.2 12.2 93.4
Strongly
Disagree
133 6.6 6.6 100.0
Total 2030 100.0 100.0

258
Table 31 Q34
Frequency Percent Valid Percent Cumulative
Percent
Valid Agree 545 26.8 26.8 26.8
Disagree 158 7.8 7.8 34.6
Some What
Agree
658 32.4 32.4 67.0
Some What
Disagree
232 11.4 11.4 78.5
Strongly
Agree
400 19.7 19.7 98.2
Strongly
Disagree
37 1.8 1.8 100.0
Total 2030 100.0 100.0
Table 32 Q35
Frequency Percent Valid Percent Cumulative
Percent
Valid Agree 338 16.7 16.7 16.7
Disagree 315 15.5 15.5 32.2
Some What
Agree
488 24.0 24.0 56.2
Some What 349 17.2 17.2 73.4

259
Disagree
Strongly
Agree
305 15.0 15.0 88.4
Strongly
Disagree
235 11.6 11.6 100.0
Total 2030 100.0 100.0
Table 33 Q36
Frequency Percent Valid Percent Cumulative
Percent
Valid Agree 765 37.7 37.7 37.7
Disagree 13 .6 .6 38.3
Some What
Agree
539 26.6 26.6 64.9
Some What
Disagree
172 8.5 8.5 73.3
Strongly
Agree
468 23.1 23.1 96.4
Strongly
Disagree
73 3.6 3.6 100.0
Total 2030 100.0 100.0

260
Table 34 Q37
Frequency Percent Valid
Percent
Cumulative
Percent
Valid Agree 392 19.3 19.3 19.3
Disagree 104 5.1 5.1 24.4
Some What
Agree
629 31.0 31.0 55.4
Some What
Disagree
715 35.2 35.2 90.6
Strongly
Agree
167 8.2 8.2 98.9
Strongly
Disagree
23 1.1 1.1 100.0
Total 2030 100.0 100.0
Table 35 Q38
Frequency Percent Valid Percent Cumulative
Percent
Valid Agree 228 11.2 11.2 11.2
Disagree 224 11.0 11.0 22.3
Some What
Agree
708 34.9 34.9 57.1

261
Some What
Disagree
676 33.3 33.3 90.4
Strongly
Agree
177 8.7 8.7 99.2
Strongly
Disagree
17 .8 .8 100.0
Total 2030 100.0 100.0
Table 36 Q39
Frequency Percent Valid Percent Cumulative
Percent
Valid Agree 285 14.0 14.0 14.0
Disagree 168 8.3 8.3 22.3
Some What
Agree
778 38.3 38.3 60.6
Some What
Disagree
576 28.4 28.4 89.0
Strongly
Agree
213 10.5 10.5 99.5
Strongly
Disagree
10 .5 .5 100.0
Total 2030 100.0 100.0

262
Table 37 Q40
Frequency Percent Valid Percent Cumulative
Percent
Valid Agree 440 21.7 21.7 21.7
Disagree 207 10.2 10.2 31.9
Some What
Agree
541 26.7 26.7 58.5
Some What
Disagree
511 25.2 25.2 83.7
Strongly
Agree
267 13.2 13.2 96.8
Strongly
Disagree
64 3.2 3.2 100.0
Total 2030 100.0 100.0
Table 38 Q41
Frequency Percent Valid Percent Cumulative
Percent
Valid Agree 344 16.9 16.9 16.9
Disagree 206 10.1 10.1 27.1
Some What
Agree
598 29.5 29.5 56.6
Some What 684 33.7 33.7 90.2

263
Disagree
Strongly
Agree
135 6.7 6.7 96.9
Strongly
Disagree
63 3.1 3.1 100.0
Total 2030 100.0 100.0
Table 39 Q42
Frequency Percent Valid Percent Cumulative
Percent
Valid Agree 483 23.8 23.8 23.8
Disagree 77 3.8 3.8 27.6
Some What
Agree
589 29.0 29.0 56.6
Some What
Disagree
463 22.8 22.8 79.4
Strongly
Agree
318 15.7 15.7 95.1
Strongly
Disagree
100 4.9 4.9 100.0
Total 2030 100.0 100.0

264
Table 40 Q43
Frequency Percent Valid Percent Cumulative
Percent
Valid Agree 315 15.5 15.5 15.5
Disagree 185 9.1 9.1 24.6
Some What
Agree
775 38.2 38.2 62.8
Some What
Disagree
519 25.6 25.6 88.4
Strongly
Agree
160 7.9 7.9 96.3
Strongly
Disagree
76 3.7 3.7 100.0
Total 2030 100.0 100.0
Table 41 Q44
Frequency Percent Valid
Percent
Cumulative
Percent
Valid Agree 361 17.8 17.8 17.8
Disagree 218 10.7 10.7 28.5
Some What
Agree
745 36.7 36.7 65.2
Some What 448 22.1 22.1 87.3

265
Disagree
Strongly
Agree
205 10.1 10.1 97.4
Strongly
Disagree
53 2.6 2.6 100.0
Total 2030 100.0 100.0
Table 42 Q45
Frequency Percent Valid Percent Cumulative
Percent
Valid Agree 349 17.2 17.2 17.2
Disagree 346 17.0 17.0 34.2
Some What
Agree
412 20.3 20.3 54.5
Some What
Disagree
651 32.1 32.1 86.6
Strongly
Agree
184 9.1 9.1 95.7
Strongly
Disagree
88 4.3 4.3 100.0
Total 2030 100.0 100.0

266
Table 43 Q46
Frequency Percent Valid
Percent
Cumulative
Percent
Valid Agree 343 16.9 16.9 16.9
Disagree 240 11.8 11.8 28.7
Some What
Agree
397 19.6 19.6 48.3
Some What
Disagree
442 21.8 21.8 70.0
Strongly
Agree
145 7.1 7.1 77.2
Strongly
Disagree
463 22.8 22.8 100.0
Total 2030 100.0 100.0
Table 44 Q47
Frequency Percent Valid Percent Cumulative
Percent
Valid Agree 161 7.9 7.9 7.9
Disagree 480 23.6 23.6 31.6
Some What
Agree
517 25.5 25.5 57.0
Some What 571 28.1 28.1 85.2

267
Disagree
Strongly
Agree
122 6.0 6.0 91.2
Strongly
Disagree
179 8.8 8.8 100.0
Total 2030 100.0 100.0
Table 45 Q48
Frequency Percent Valid Percent Cumulative
Percent
Valid Agree 342 16.8 16.8 16.8
Disagree 155 7.6 7.6 24.5
Some What
Agree
639 31.5 31.5 56.0
Some What
Disagree
536 26.4 26.4 82.4
Strongly
Agree
176 8.7 8.7 91.0
Strongly
Disagree
182 9.0 9.0 100.0
Total 2030 100.0 100.0

268
Table 46 Descriptive Statistics
N Minimum Maximum Mean Std. Deviation
Group1 2030 33.33 100.00 67.7010 12.25392
Group2 2030 38.89 100.00 76.2174 13.44774
Group3 2030 36.67 100.00 75.8865 12.99468
Group4 2030 22.22 100.00 69.6937 14.25826
Group5 2030 16.67 100.00 67.5876 13.45177
Group6 2030 16.67 100.00 62.3677 17.72655
Group7 2030 22.22 83.33 57.7702 12.18059
Group8 2030 22.22 100.00 63.0930 15.57554
Group9 2030 16.67 100.00 66.0568 14.63561
Group10 2030 27.78 100.00 75.4593 12.46866
combine 2030 39.47 96.93 68.4604 9.38771
Valid N (list wise) 2030
Table 47 Descriptive Statistics
N Minimum Maximum Mean Std.
Deviation
Mumbai_Gr1 1250 33.33 100.00 67.6239 12.51554
Mumbai_Gr2 1250 38.89 100.00 76.3996 13.28500
Mumbai_Gr3 1250 36.67 100.00 76.1358 12.77145
Mumbai_Gr4 1250 22.22 100.00 69.7735 14.24850

269
Mumbai_Gr5 1250 16.67 100.00 67.8600 13.51472
Mumbai_Gr6 1250 16.67 100.00 62.7160 17.48698
Mumbai_Gr7 1250 22.22 83.33 57.3694 12.26891
Mumbai_Gr8 1250 22.22 100.00 63.0983 15.54854
Mumbai_Gr9 1250 16.67 100.00 66.2831 14.50219
Mumbai_Gr10 1250 27.78 100.00 75.6395 12.36693
Mumbai_combine 1250 39.47 96.93 68.5810 9.42927
Valid N (listwise) 1250
Table 48 Descriptive Statistics
N Minimum Maximum Mean Std. Deviation
Nagpur_Gr1 250 33.33 100.00 68.0398 11.75873
Nagpur_Gr2 250 44.44 100.00 76.6662 13.60723
Nagpur_Gr3 250 36.67 100.00 75.5467 13.52910
Nagpur_Gr4 250 22.22 100.00 70.3777 14.28085
Nagpur_Gr5 250 16.67 100.00 68.1112 13.52159
Nagpur_Gr6 250 16.67 100.00 62.7338 17.44683
Nagpur_Gr7 250 22.22 83.33 57.8893 12.20125
Nagpur_Gr8 250 22.22 100.00 63.4228 15.60576
Nagpur_Gr9 250 16.67 100.00 67.1664 15.12829
Nagpur_Gr10 250 27.78 100.00 75.3994 12.76756
Nagpur_combine 250 40.35 96.49 68.8088 9.39561
Valid N (listwise) 250

270
Table 49 Descriptive Statistics
N Minimum Maximum Mean Std. Deviation
Pune_Gr1 530 33.33 100.00 67.7230 11.87242
Pune_Gr2 530 44.44 100.00 75.5761 13.75428
Pune_Gr3 530 36.67 100.00 75.4588 13.26739
Pune_Gr4 530 22.22 100.00 69.1827 14.28011
Pune_Gr5 530 16.67 100.00 66.6982 13.25301
Pune_Gr6 530 16.67 100.00 61.3735 18.40184
Pune_Gr7 530 27.78 83.33 58.6590 11.93376
Pune_Gr8 530 22.22 100.00 62.9250 15.65170
Pune_Gr9 530 16.67 100.00 64.9998 14.67872
Pune_Gr10 530 27.78 100.00 75.0624 12.57910
Pune_combine 530 40.35 96.93 68.0114 9.28720
Valid N (list wise) 530
Frequency Table
Table 49 Level_GrOne
Frequency Percent Valid Percent Cumulative Percent
Valid High 410 20.2 20.2 20.2
Low 240 11.8 11.8 32.0
Medium 1380 68.0 68.0 100.0
Total 2030 100.0 100.0

271
Table 50 Level_Gr2
Frequency Percent Valid
Percent
Cumulative
Percent
Valid High 288 14.2 14.2 14.2
Low 362 17.8 17.8 32.0
Medium 1380 68.0 68.0 100.0
Total 2030 100.0 100.0
Table 51 Level_Gr3
Frequency Percent Valid Percent Cumulative
Percent
Valid High 346 17.0 17.0 17.0
Low 230 11.3 11.3 28.4
Medium 1454 71.6 71.6 100.0
Total 2030 100.0 100.0
Table 52 Level_Gr4
Frequency Percent Valid Percent Cumulative
Percent
Valid High 266 13.1 13.1 13.1
Low 449 22.1 22.1 35.2
Medium 1315 64.8 64.8 100.0
Total 2030 100.0 100.0

272
Table 53 Level_Gr5
Frequency Percent Valid Percent Cumulative
Percent
Valid High 197 9.7 9.7 9.7
low 224 11.0 11.0 20.7
Medium 1609 79.3 79.3 100.0
Total 2030 100.0 100.0
Table 54 Level_Gr6
Frequency Percent Valid Percent Cumulative
Percent
Valid High 259 12.8 12.8 12.8
Low 289 14.2 14.2 27.0
Medium 1482 73.0 73.0 100.0
Total 2030 100.0 100.0
Table 55 Level_Gr7
Frequency Percent Valid Percent Cumulative
Percent
Valid High 327 16.1 16.1 16.1
Low 391 19.3 19.3 35.4
Medium 1312 64.6 64.6 100.0
Total 2030 100.0 100.0

273
Table 56 Level_Gr8
Frequency Percent Valid Percent Cumulative
Percent
Valid High 235 11.6 11.6 11.6
Low 261 12.9 12.9 24.4
Medium 1534 75.6 75.6 100.0
Total 2030 100.0 100.0
Table 57 Level_Gr9
Frequency Percent Valid Percent Cumulative
Percent
Valid High 254 12.5 12.5 12.5
Low 285 14.0 14.0 26.6
Medium 1491 73.4 73.4 100.0
Total 2030 100.0 100.0
Table 58 Level_Gr10
Frequency Percent Valid Percent Cumulative
Percent
Valid High 355 17.5 17.5 17.5
Low 329 16.2 16.2 33.7
Medium 1346 66.3 66.3 100.0
Total 2030 100.0 100.0

274
Table 59 Level_Grcombine
Frequency Percent Valid Percent Cumulative
Percent
Valid High 279 13.7 13.7 13.7
Low 278 13.7 13.7 27.4
Medium 1473 72.6 72.6 100.0
Total 2030 100.0 100.0
City * Level_GrOne Cross tabulation
Table 60 Count
City Level_GrOne
High Low Medium Total
Mumbai 263 156 831 1250
Nagpur 49 24 177 250
Pune 98 60 372 530
Total 410 240 1380 2030
Table 61 City * Level_Gr2 Cross tabulation
Count
City Level_Gr2
High Low Medium Total
Mumbai 178 211 861 1250
Nagpur 41 44 165 250

275
Pune 69 107 354 530
Total 288 362 1380 2030
Table 62 City * Level_Gr3 Cross tabulation
Count
City Level_Gr3
High Low Medium Total
Mumbai 206 126 918 1250
Nagpur 46 36 168 250
Pune 94 68 368 530
Total 346 230 1454 2030
Table 63 City * Level_Gr4 Cross tabulation
Count
City Level_Gr4
High Low Medium Total
Mumbai 169 271 810 1250
Nagpur 32 53 165 250
Pune 65 125 340 530
Total 266 449 1315 2030

276
Table 64 City * Level_Gr5 Cross tabulation
Count
City Level_Gr5
High low Medium Total
Mumbai 130 127 993 1250
Nagpur 24 28 198 250
Pune 43 69 418 530
Total 197 224 1609 2030
Table 65 City * Level_Gr6 Cross tabulation
Count
City Level_Gr6
High Low Medium Total
Mumbai 160 169 921 1250
Nagpur 34 30 186 250
Pune 65 90 375 530
Total 259 289 1482 2030
Table 66 City * Level_Gr7 Cross tabulation
Count
City Level_Gr7
High Low Medium Total
Mumbai 188 262 800 1250

277
Nagpur 48 46 156 250
Pune 91 83 356 530
Total 327 391 1312 2030
Table 67 City * Level_Gr8 Cross tabulation
Count
City Level_Gr8
High Low Medium Total
Mumbai 150 150 950 1250
Nagpur 30 33 187 250
Pune 55 78 397 530
Total 235 261 1534 2030
Table 68 City * Level_Gr9 Cross tabulation
Count
City Level_Gr9
High Low Medium Total
Mumbai 159 165 926 1250
Nagpur 37 32 181 250
Pune 58 88 384 530
Total 254 285 1491 2030

278
Table 69 City * Level_Gr10 Cross tabulation
Count
City Level_Gr10
High Low Medium Total
Mumbai 229 200 821 1250
Nagpur 43 39 168 250
Pune 83 90 357 530
Total 355 329 1346 2030
Table70 * Level_GrOne Cross tabulation
Count
QUAL Level_GrOne
High Low Medium Total
Doctorate 0 0 11 11
Graduate 262 137 572 971
HSC 38 1 80 119
Post
graduate
65 44 532 641
Professional 0 58 136 194
SSC 45 0 49 94
Total 410 240 1380 2030

279
Table 71 QUAL * Level_Gr2 Cross tabulation
Count
QUAL Level_Gr2
High Low Medium Total
Doctorate 0 11 0 11
Graduate 89 170 712 971
HSC 42 3 74 119
Post
graduate
100 109 432 641
Professional 26 28 140 194
SSC 31 41 22 94
Total 288 362 1380 2030
Table 71 QUAL * Level_Gr3 Cross tabulation
Count
QUAL Level_Gr3
High Low Medium Total
Doctorate 0 0 11 11
Graduate 134 97 740 971
HSC 46 2 71 119
Post
graduate
98 107 436 641
Professional 42 8 144 194

280
SSC 26 16 52 94
Total 346 230 1454 2030
Table 72 QUAL * Level_Gr4 Cross tabulation
Count
QUAL Level_Gr4
High Low Medium Total
Doctorate 0 11 0 11
Graduate 148 191 632 971
HSC 65 4 50 119
Post
graduate
44 152 445 641
Professional 1 57 136 194
SSC 8 34 52 94
Total 266 449 1315 2030
Table 73 QUAL * Level_Gr5 Cross tabulation
Count
QUAL Level_Gr5
High low Medium Total
Doctorate 0 0 11 11
Graduate 99 62 810 971
HSC 43 2 74 119

281
Post
graduate
25 110 506 641
Professional 20 29 145 194
SSC 10 21 63 94
Total 197 224 1609 2030
Table 74 QUAL * Level_Gr6 Cross tabulation
Count
QUAL Level_Gr6
High Low Medium Total
Doctorate 0 11 0 11
Graduate 144 134 693 971
HSC 57 0 62 119
Post
graduate
56 108 477 641
Professional 0 29 165 194
SSC 2 7 85 94
Total 259 289 1482 2030

282
Table 75 QUAL * Level_Gr7 Cross tabulation
Count
QUAL Level_Gr7
High Low Medium Total
Doctorate 0 3 8 11
Graduate 116 191 664 971
HSC 45 9 65 119
Post
graduate
117 110 414 641
Professional 22 68 104 194
SSC 27 10 57 94
Total 327 391 1312 2030
Table 76 QUAL * Level_Gr8 Cross tabulation
Count
QUAL Level_Gr8
High Low Medium Total
Doctorate 0 11 0 11
Graduate 118 137 716 971
HSC 27 0 92 119
Post
graduate
43 90 508 641
Professional 2 9 183 194

283
SSC 45 14 35 94
Total 235 261 1534 2030
Table 77 QUAL * Level_Gr9 Cross tabulation
Count
QUAL Level_Gr9
High Low Medium Total
Doctorate 0 11 0 11
Graduate 123 128 720 971
HSC 39 9 71 119
Post
graduate
43 94 504 641
Professional 10 29 155 194
SSC 39 14 41 94
Total 254 285 1491 2030
Table 78 QUAL * Level_Gr10 Cross tabulation
Count
QUAL Level_Gr10
High Low Medium Total
Doctorate 11 0 0 11
Graduate 186 51 734 971
HSC 47 11 61 119

284
Post
graduate
62 182 397 641
Professional 46 39 109 194
SSC 3 46 45 94
Total 355 329 1346 2030
Table 80 Age_Group * Level_GrOne Cross tabulation
Count
Age_Group Level_GrOne
High Low Medium Total
Eldely Age 65 52 129 246
Middle Age 138 48 444 630
Young Age 207 140 807 1154
Total 410 240 1380 2030
Table 81 Age_Group * Level_Gr2 Cross tabulation
Count
Age_Group Level_Gr2
High Low Medium Total
Eldely Age 24 58 164 246
Middle Age 97 104 429 630
Young Age 167 200 787 1154
Total 288 362 1380 2030

285
Table 82 Age_Group * Level_Gr3 Cross tabulation
Count
Age_Group Level_Gr3
High Low Medium Total
Eldely Age 58 52 136 246
Middle Age 83 82 465 630
Young Age 205 96 853 1154
Total 346 230 1454 2030
Table 83 Age_Group * Level_Gr4 Cross tabulation
Count
Age_Group Level_Gr4
High Low Medium Total
Eldely Age 30 41 175 246
Middle Age 64 127 439 630
Young Age 172 281 701 1154
Total 266 449 1315 2030
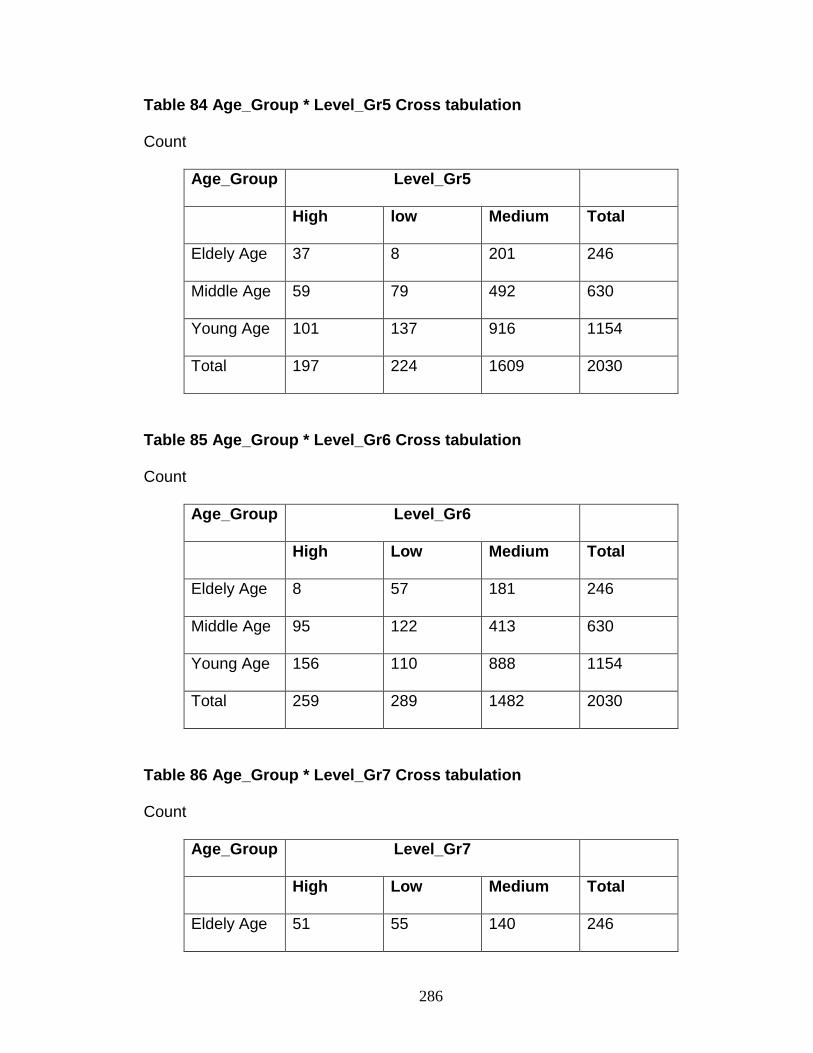
286
Table 84 Age_Group * Level_Gr5 Cross tabulation
Count
Age_Group Level_Gr5
High low Medium Total
Eldely Age 37 8 201 246
Middle Age 59 79 492 630
Young Age 101 137 916 1154
Total 197 224 1609 2030
Table 85 Age_Group * Level_Gr6 Cross tabulation
Count
Age_Group Level_Gr6
High Low Medium Total
Eldely Age 8 57 181 246
Middle Age 95 122 413 630
Young Age 156 110 888 1154
Total 259 289 1482 2030
Table 86 Age_Group * Level_Gr7 Cross tabulation
Count
Age_Group Level_Gr7
High Low Medium Total
Eldely Age 51 55 140 246

287
Middle Age 131 98 401 630
Young Age 145 238 771 1154
Total 327 391 1312 2030
Table 87 Age_Group * Level_Gr8 Cross tabulation
Count
Age_Group Level_Gr8
High Low Medium Total
Eldely Age 18 33 195 246
Middle Age 105 78 447 630
Young Age 112 150 892 1154
Total 235 261 1534 2030
Table 88 Age_Group * Level_Gr9 Cross tabulation
Count
Age_Group Level_Gr9
High Low Medium Total
Eldely Age 46 38 162 246
Middle Age 84 88 458 630
Young Age 124 159 871 1154
Total 254 285 1491 2030

288
Table 89 Age_Group * Level_Gr10 Cross tabulation
Count
Age_Group Level_Gr10
High Low Medium Total
Eldely Age 27 29 190 246
Middle Age 120 90 420 630
Young Age 208 210 736 1154
Total 355 329 1346 2030
Table 90 * Level_GrOne Cross tabulation
Count
SEX Level_GrOne
High Low Medium Total
Female 256 126 589 971
Male 154 114 791 1059
Total 410 240 1380 2030
Table 91 SEX * Level_Gr2 Cross tabulation
Count
SEX Level_Gr2
High Low Medium Total
Female 202 138 631 971
Male 86 224 749 1059

289
Total 288 362 1380 2030
Table 92 SEX * Level_Gr3 Cross tabulation
Count
SEX Level_Gr3
High Low Medium Total
Female 159 104 708 971
Male 187 126 746 1059
Total 346 230 1454 2030
Table 933 SEX * Level_Gr4 Cross tabulation
Count
SEX Level_Gr4
High Low Medium Total
Female 149 207 615 971
Male 117 242 700 1059
Total 266 449 1315 2030
Table 94 SEX * Level_Gr5 Cross tabulation
Count
SEX Level_Gr5
High low Medium Total
Female 85 130 756 971

290
Male 112 94 853 1059
Total 197 224 1609 2030
Table 95 SEX * Level_Gr6 Cross tabulation
Count
SEX Level_Gr6
High Low Medium Total
Female 173 123 675 971
Male 86 166 807 1059
Total 259 289 1482 2030
Table 96 SEX * Level_Gr7 Cross tabulation
Count
SEX Level_Gr7
High Low Medium Total
Female 177 185 609 971
Male 150 206 703 1059
Total 327 391 1312 2030
Table 97 SEX * Level_Gr8 Cross tabulation
Count
SEX Level_Gr8
High Low Medium Total

291
Female 153 118 700 971
Male 82 143 834 1059
Total 235 261 1534 2030
Table 98 SEX * Level_Gr9 Cross tabulation
Count
SEX Level_Gr9
High Low Medium Total
Female 140 146 685 971
Male 114 139 806 1059
Total 254 285 1491 2030
Table 99 SEX * Level_Gr10 Cross tabulation
Count
SEX Level_Gr10
High Low Medium Total
Female 192 160 619 971
Male 163 169 727 1059
Total 355 329 1346 2030

292
Table 100 Number_of_members_in_Family * Level_GrOne Cross tabulation
Count
Number_of_members_in_Family Level_GrOne
High Low Medium Total
Five 0 0 211 211
Four 106 59 170 335
One 39 36 115 190
Six 19 16 22 57
Three 77 23 271 371
Two 169 106 591 866
Total 410 240 1380 2030
Table 101 Number_of_members_in_Family * Level_Gr2 Cross tabulation
Count
Number_of_members_in_Family Level_Gr2
High Low Medium Total
Five 44 29 138 211
Four 32 37 266 335
One 48 70 72 190
Six 0 16 41 57
Three 45 48 278 371
Two 119 162 585 866
Total 288 362 1380 2030

293
Table 102 _of_members_in_Family * Level_Gr3 Cross tabulation
Count
Number_of_members_in_Family Level_Gr3
High Low Medium Total
Five 7 21 183 211
Four 53 21 261 335
One 77 9 104 190
Six 0 0 57 57
Three 41 34 296 371
Two 168 145 553 866
Total 346 230 1454 2030
Table 103 Number_of_members_in_Family * Level_Gr4 Cross tabulation
Count
Number_of_members_in_Family Level_Gr4
High Low Medium Total
Five 20 0 191 211
Four 86 46 203 335
One 25 60 105 190
Six 0 0 57 57
Three 38 53 280 371
Two 97 290 479 866

294
Total 266 449 1315 2030
Table 104 Number_of_members_in_Family * Level_Gr5 Cross tabulation
Count
Number_of_members_in_Family Level_Gr5
High low Medium Total
Five 37 0 174 211
Four 37 23 275 335
One 0 51 139 190
Six 1 0 56 57
Three 24 38 309 371
Two 98 112 656 866
Total 197 224 1609 2030
Table 105 Number_of_members_in_Family * Level_Gr6 Cross tabulation
Count
Number_of_members_in_Family Level_Gr6
High Low Medium Total
Five 3 0 208 211
Four 65 31 239 335
One 51 40 99 190
Six 0 0 57 57
Three 44 12 315 371

295
Two 96 206 564 866
Total 259 289 1482 2030
Table 106 Number_of_members_in_Family * Level_Gr7 Cross tabulation
Count
Number_of_members_in_Family Level_Gr7
High Low Medium Total
Five 32 39 140 211
Four 73 75 187 335
One 44 34 112 190
Six 8 11 38 57
Three 46 55 270 371
Two 124 177 565 866
Total 327 391 1312 2030
Table 107 Number_of_members_in_Family * Level_Gr8 Cross tabulation
Count
Number_of_members_in_Family Level_Gr8
High Low Medium Total
Five 0 16 195 211
Four 56 28 251 335
One 25 9 156 190

296
Six 0 9 48 57
Three 46 26 299 371
Two 108 173 585 866
Total 235 261 1534 2030
Table 108 Number_of_members_in_Family * Level_Gr9 Cross tabulation
Count
Number_of_members_in_Family Level_Gr9
High Low Medium Total
Five 7 1 203 211
Four 85 53 197 335
One 33 35 122 190
Six 0 0 57 57
Three 15 37 319 371
Two 114 159 593 866
Total 254 285 1491 2030
Table 109 Number_of_members_in_Family * Level_Gr10 Cross tabulation
Count
Number_of_members_in_Family Level_Gr10
High Low Medium Total
Five 75 21 115 211
Four 48 54 233 335

297
One 9 83 98 190
Six 0 13 44 57
Three 20 45 306 371
Two 203 113 550 866
Total 355 329 1346 2030
Table 110 Children_in_family * Level_GrOne Cross tabulation
Count
Children_in_family Level_GrOne
High Low Medium Total
Four 15 0 7 22
One 141 47 488 676
Six 16 16 0 32
Three 8 55 116 179
Two 70 28 262 360
Zero 160 94 507 761
Total 410 240 1380 2030
Table 112 Children_in_family * Level_Gr2 Cross tabulation
Count
Children_in_family Level_Gr2
High Low Medium Total
Four 0 15 7 22

298
One 87 66 523 676
Six 0 16 16 32
Three 17 25 137 179
Two 60 97 203 360
Zero 124 143 494 761
Total 288 362 1380 2030
Table 113 Children_in_family * Level_Gr3 Cross tabulation
Count
Children_in_family Level_Gr3
High Low Medium Total
Four 22 0 0 22
One 111 63 502 676
Six 0 0 32 32
Three 17 17 145 179
Two 77 62 221 360
Zero 119 88 554 761
Total 346 230 1454 2030

299
Table 114 Children_in_family * Level_Gr4 Cross tabulation
Count
Children_in_family Level_Gr4
High Low Medium Total
Four 6 1 15 22
One 91 115 470 676
Six 16 0 16 32
Three 40 55 84 179
Two 24 102 234 360
Zero 89 176 496 761
Total 266 449 1315 2030
Table 115 Children_in_family * Level_Gr5 Cross tabulation
Count
Children_in_family Level_Gr5
High low Medium Total
Four 6 1 15 22
One 98 79 499 676
Six 0 0 32 32
Three 37 15 127 179
Two 14 36 310 360
Zero 42 93 626 761
Total 197 224 1609 2030

300
Table 116 Children_in_family * Level_Gr6 Cross tabulation
Count
Children_in_family Level_Gr6
High Low Medium Total
Four 0 1 21 22
One 106 73 497 676
Six 0 0 32 32
Three 13 55 111 179
Two 34 86 240 360
Zero 106 74 581 761
Total 259 289 1482 2030
Table 117 Children_in_family * Level_Gr7 Cross tabulation
Count
Children_in_family Level_Gr7
High Low Medium Total
Four 11 3 8 22
One 105 127 444 676
Six 10 4 18 32
Three 28 34 117 179
Two 62 49 249 360
Zero 111 174 476 761

301
Total 327 391 1312 2030
Table 118 Children_in_family * Level_Gr8 Cross tabulation
Count
Children_in_family Level_Gr8
High Low Medium Total
Four 1 0 21 22
One 53 73 550 676
Six 16 0 16 32
Three 20 58 101 179
Two 50 42 268 360
Zero 95 88 578 761
Total 235 261 1534 2030
Table 119 Children_in_family * Level_Gr9 Cross tabulation
Count
Children_in_family Level_Gr9
High Low Medium Total
Four 6 1 15 22
One 52 19 605 676
Six 16 0 16 32
Three 43 55 81 179
Two 24 67 269 360

302
Zero 113 143 505 761
Total 254 285 1491 2030
Table 120 Children_in_family * Level_Gr10 Cross tabulation
Count
Children_in_family Level_Gr10
High Low Medium Total
Four 6 15 1 22
One 139 115 422 676
Six 0 0 32 32
Three 42 27 110 179
Two 25 42 293 360
Zero 143 130 488 761
Total 355 329 1346 2030
Table 121 Employment_Status * Level_GrOne Cross tabulation
Count
Employment_Status Level_GrOne
High Low Medium Total
BUSINESS 80 41 185 306
House wife 21 44 155 220
Retired 17 0 25 42
SERVICE 292 155 1015 1462

303
Total 410 240 1380 2030
Table 122 Employment_Status * Level_Gr2 Cross tabulation
Count
Employment_Status Level_Gr2
High Low Medium Total
BUSINESS 47 40 219 306
House wife 42 16 162 220
Retired 0 10 32 42
SERVICE 199 296 967 1462
Total 288 362 1380 2030
Table 123 Employment_Status * Level_Gr3 Cross tabulation
Count
Employment_
Status
Level_Gr3 Total
High Low Medium
BUSINESS 84 14 208 306
House wife 5 13 202 220
Retired 6 9 27 42
SERVICE 251 194 1017 1462
Total 346 230 1454 2030

304
Table 124 Employment_Status * Level_Gr4 Cross tabulation
Count
Employment_
Status
Level_Gr4 Total
High Low Medium
BUSINESS 41 46 219 306
House wife 29 70 121 220
Retired 6 10 26 42
SERVICE 190 323 949 1462
Total 266 449 1315 2030
Table 125 Employment_Status * Level_Gr5 Cross tabulation
Count
Employment_
Status
Level_Gr5 Total
High Low Medium
BUSINESS 51 34 221 306
House wife 0 11 209 220
Retired 6 0 36 42
SERVICE 140 179 1143 1462
Total 197 224 1609 2030

305
Table 126 Employment_Status * Level_Gr6 Cross tabulation
Count
Employment_
Status
Level_Gr6 Total
High Low Medium
BUSINESS 61 55 190 306
House wife 12 21 187 220
Retired 0 17 25 42
SERVICE 186 196 1080 1462
Total 259 289 1482 2030
Table 127 Employment_Status * Level_Gr7 Cross tabulation
Count
Employment_
Status
Level_Gr7 Total
High Low Medium
BUSINESS 38 70 198 306
House wife 28 43 149 220
Retired 8 6 28 42
SERVICE 253 272 937 1462
Total 327 391 1312 2030

306
Table 128 Employment_Status * Level_Gr8 Cross tabulation
Count
Employment_
Status
Level_Gr8 Total
High Low Medium
BUSINESS 21 34 251 306
House wife 34 18 168 220
Retired 0 0 42 42
SERVICE 180 209 1073 1462
Total 235 261 1534 2030
Table 129 Employment_Status * Level_Gr9 Cross tabulation
Count
Employment_
Status
Level_Gr3 Total
High Low Medium
BUSINESS 24 45 237 306
House wife 20 47 153 220
Retired 6 0 36 42
SERVICE 204 193 1065 1462
Total 254 285 1491 2030

307
Table 130 Employment_Status * Level_Gr10 Cross tabulation
Count
Employment_
Status
Level_Gr10 Total
High Low Medium
BUSINESS 45 45 216 306
House wife 40 10 170 220
Retired 6 10 26 42
SERVICE 264 264 934 1462
Total 355 329 1346 2030
Table 131 Monthly_Income * Level_GrOne Cross tabulation
Count
Monthly_Income Level_GrOne
High Low Medium Total
15000 - 25000 168 55 543 766
25000 - 50000 12 40 119 171
5000 - 15000 115 70 240 425
5000 -15000 45 65 251 361
BELOW 5000 58 0 162 220
MORE THAN
50000
12 10 65 87

308
Total 410 240 1380 2030
Table 132 Monthly_Income * Level_Gr2 Cross tabulation
Count
Monthly_Income Level_Gr2
High Low Medium Total
15000 - 25000 74 117 575 766
25000 - 50000 7 30 134 171
5000 - 15000 43 125 257 425
5000 -15000 82 44 235 361
BELOW 5000 57 30 133 220
MORE THAN
50000
25 16 46 87
Total 288 362 1380 2030
Table 133 Monthly_Income * Level_Gr3 Cross tabulation
Count
Monthly_
Income
Level_Gr3 Total
High Low Medium
15000 – 25000
115 112 539 766
25000 - 50000 17 13 141 171

309
5000 - 15000 98 57 270 425
5000 -15000 30 26 305 361
BELOW 5000 61 18 141 220
MORE THAN
50000
25 4 58 87
Total 346 230 1454 2030
Table 134 Monthly_Income * Level_Gr4 Cross tabulation
Count
Monthly_
Income
Level_Gr4 Total
High Low Medium
15000 – 25000
85 154 527 766
25000 - 50000 9 50 112 171
5000 - 15000 57 121 247 425
5000 -15000 58 95 208 361
BELOW 5000 56 13 151 220
MORE THAN
50000
1 16 70 87
Total 266 449 1315 2030

310
Table 135 Monthly_Income * Level_Gr5 Cross tabulation
Count
Monthly_
Income
Level_Gr5 Total
High Low Medium
15000 – 25000
72 121 573 766
25000 - 50000 3 1 167 171
5000 - 15000 49 47 329 425
5000 -15000 33 32 296 361
BELOW 5000 39 23 158 220
MORE THAN
50000
1 0 86 87
Total 197 224 1609 2030
Table 136 Monthly_Income * Level_Gr6 Cross tabulation
Count
Monthly_
Income
Level_Gr6 Total
High Low Medium
15000 – 25000
106 158 502 766
25000 - 50000 11 35 125 171
5000 - 15000 44 65 316 425

311
5000 -15000 41 12 308 361
BELOW 5000 56 5 159 220
MORE THAN
50000
1 14 72 87
Total 259 289 1482 2030
Table 137 Monthly_Income * Level_Gr7 Cross tabulation
Count
Monthly_
Income
Level_Gr7 Total
High Low Medium
15000 – 25000
106 157 503 766
25000 - 50000 25 35 111 171
5000 - 15000 83 83 259 425
5000 -15000 47 67 247 361
BELOW 5000 55 31 134 220
MORE THAN
50000
11 18 58 87
Total 327 391 1312 2030

312
Table 138 Monthly_Income * Level_Gr8 Cross tabulation
Count
Monthly_
Income
Level_Gr8 Total
High Low Medium
15000 – 25000
100 64 602 766
25000 - 50000 5 41 125 171
5000 - 15000 57 81 287 425
5000 -15000 36 45 280 361
BELOW 5000 29 10 181 220
MORE THAN
50000
8 20 59 87
Total 235 261 1534 2030
Table 139 Monthly_Income * Level_Gr9 Cross tabulation
Count
Monthly_
Income
Level_Gr9 Total
High Low Medium
15000 – 25000
113 80 573 766
25000 - 50000 12 35 124 171
5000 - 15000 72 86 267 425
5000 -15000 20 56 285 361

313
BELOW 5000 35 12 173 220
MORE THAN
50000
2 16 69 87
Total 254 285 1491 2030
Table 140 Monthly_Income * Level_Gr10 Cross tabulation
Count
Monthly_
Income
Level_Gr10 Total
High Low Medium
15000 – 25000
92 139 535 766
25000 - 50000 22 1 148 171
5000 - 15000 109 72 244 425
5000 -15000 66 50 245 361
BELOW 5000 52 63 105 220
MORE THAN
50000
14 4 69 87
Total 355 329 1346 2030
T-Test

314
Table 141 Paired Samples Statistics
Mean N Std.
Deviation
Std. Error
Mean
Pair 1 Combine 68.4604 2030 9.38771 .20836
Group1 67.7010 2030 12.25392 .27197
Pair 2 Combine 68.4604 2030 9.38771 .20836
Group2 76.2174 2030 13.44774 .29847
Pair 3 Combine 68.4604 2030 9.38771 .20836
Group3 75.8865 2030 12.99468 .28841
Pair 4 Combine 68.4604 2030 9.38771 .20836
Group4 69.6937 2030 14.25826 .31646
Pair 5 Combine 68.4604 2030 9.38771 .20836
Group5 67.5876 2030 13.45177 .29856
Pair 6 Combine 68.4604 2030 9.38771 .20836
Group6 62.3677 2030 17.72655 .39344
Pair 7 Combine 68.4604 2030 9.38771 .20836
Group7 57.7702 2030 12.18059 .27035
Pair 8 Combine 68.4604 2030 9.38771 .20836
Group8 63.0930 2030 15.57554 .34570
Pair 9 Combine 68.4604 2030 9.38771 .20836
Group9 66.0568 2030 14.63561 .32484
Pair 10 Combine 68.4604 2030 9.38771 .20836
Group10 75.4593 2030 12.46866 .27674

315
Table 142 Paired Samples Correlations
N Correlation Sig.
Pair 1 combine &
Group1
2030 .822 .000
Pair 2 combine &
Group2
2030 .678 .000
Pair 3 combine &
Group3
2030 .591 .000
Pair 4 combine &
Group4
2030 .755 .000
Pair 5 combine &
Group5
2030 .740 .000
Pair 6 combine &
Group6
2030 .789 .000
Pair 7 combine &
Group7
2030 .401 .000
Pair 8 combine &
Group8
2030 .614 .000
Pair 9 combine &
Group9
2030 .803 .000
Pair 10 combine &
Group10
2030 .435 .000

316
Table 143 Paired Samples Test
t df Sig. (2-tailed)
Pair 1 combine -
Group1
4.879 2029 .000
Pair 2 combine -
Group2
-35.353 2029 .000
Pair 3 combine -
Group3
-31.498 2029 .000
Pair 4 combine -
Group4
-5.876 2029 .000
Pair 5 combine -
Group5
4.338 2029 .000
Pair 6 combine -
Group6
23.230 2029 .000
Pair 7 combine -
Group7
40.033 2029 .000
Pair 8 combine -
Group8
19.666 2029 .000
Pair 9 combine -
Group9
11.990 2029 .000
Pair 10 combine -
Group10
-26.484 2029 .000

317
Table 143
Sr. No. Null Hypothesis Chi-Square
Calculated
Value
Chi-Square
Table Value
Result of
Test
1 Association between
City and Group-1
3.95 9.46 Accepted
2 Association between
City and Group-2
4.07 9.46 Accepted
3 Association between
City and Group-3
7.12 9.46 Accepted
4 Association between
City and Group-4
1.28 9.46 Accepted
5 Association between
City and Group-5
4.79 9.46 Accepted
6 Association between
City and Group-6
4.89 9.46 Accepted
7 Association between
City and Group-7
9.07 9.46 Accepted
8 Association between
City and Group-8
3.13 9.46 Accepted
9 Association between
City and Group-9
5.69 9.46 Accepted
10 Association between
City and Group-10
1.99 9.46 Accepted

318
Table 144
Sr. No. Null Hypothesis Chi-Square
Calculated
Value
Chi-Square
Table Value
Result of
Test
1 Association between
Qualification and
Group-1
273.47 18.31 Rejected
2 Association between
Qualification and
Group-2
214.62 18.31 Rejected
3 Association between
Qualification and
Group-3
101.98 18.31 Rejected
4 Association between
Qualification and
Group-4
291.81 18.31 Rejected
5 Association between
Qualification and
Group-5
183.81 18.31 Rejected
6 Association between
Qualification and
Group-6
264.59 18.31 Rejected

319
7 Association between
Qualification and
Group-7
107.94 18.31 Rejected
8 Association between
Qualification and
Group-8
282.88 18.31 Rejected
9 Association between
Qualification and
Group-9
217.52 18.31 Rejected
10 Association between
Qualification and
Group-10
348.56 18.31 Rejected
Table 145
Sr. No. Null Hypothesis Chi-Square
Calculated
Value
Chi-Square
Table Value
Result of
Test
1 Association between
Age group and
Group-1
46.07 9.46 Rejected
2 Association between
Age group and
9.52 9.46 Rejected

320
Group-2
3 Association between
Age group and
Group-3
54.18 9.46 Rejected
4 Association between
Age group and
Group-4
20.95 9.46 Rejected
5 Association between
Age group and
Group-5
24.19 9.46 Rejected
6 Association between
Age group and
Group-6
71.24 9.46 Rejected
7 Association between
Age group and
Group-7
30.88 9.46 Rejected
8 Association between
Age group and
Group-8
24.31 9.46 Rejected
9 Association between
Age group and
Group-9
13.77 9.46 Rejected
10 Association between
Age group and
Group-10
19.81 9.46 Rejected

321
Table146
Sr. No. Null Hypothesis Chi-Square
Calculated
Value
Chi-Square
Table
Value
Result of
Test
1 Association between
Sex and Group-1
51.82 5.99 Rejected
2 Association between
Sex and Group-2
73.56 5.99 Rejected
3 Association between
Sex and Group-3
1.55 5.99 Accepted
4 Association between
Sex and Group-4
8.27 5.99 Rejected
5 Association between
Sex and Group-5
11.54 5.99 Rejected
6 Association between
Sex and Group-6
43.65 5.99 Rejected
7 Association between
Sex and Group-7
6.29 5.99 Rejected
8 Association between
Sex and Group-8
31.79 5.99 Rejected

322
9 Association between
Sex and Group-9
8.85 5.99 Rejected
10 Association between
Sex and Group-10
7.48 5.99 Rejected
Table 147
Sr. No. Null Hypothesis Chi-Square
Calculated
Value
Chi-Square
Table
Value
Result of
Test
1 Association between
No. of members in
family and Group-1
191.52 18.31 Rejected
2 Association between
No. of members in
family and Group-2
129.99 18.31 Rejected
3 Association between
No. of members in
family and Group-3
184.34 18.31 Rejected
4 Association between
No. of members in
family and Group-4
247.78 18.31 Rejected

323
5 Association between
No. of members in
family and Group-5
129.54 18.31 Rejected
6 Association between
No. of members in
family and Group-6
259.66 18.31 Rejected
7 Association between
No. of members in
family and Group-7
33.06 18.31 Rejected
8 Association between
No. of members in
family and Group-8
122.06 18.31 Rejected
9 Association between
No. of members in
family and Group-9
188.90 18.31 Rejected
10 Association between
No. of members in
family and Group-10
249.62 18.31 Rejected

324
Table 148
Sr. No. Null Hypothesis Chi-Square
Calculated
Value
Chi-Square
Table
Value
Result of
Test
1 Association between
Children in family and
Group-1
173.55 15.51 Rejected
2 Association between
Children in family and
Group-2
132.55 15.51 Rejected
3 Association between
Children in family and
Group-3
58.87 15.51 Rejected
4 Association between
Children in family and
Group-4
99.40 15.51 Rejected
5 Association between
Children in family and
Group-5
78.37 15.51 Rejected
6 Association between
Children in family and
Group-6
108.71 15.51 Rejected

325
7 Association between
Children in family and
Group-7
36.76 15.51 Rejected
8 Association between
Children in family and
Group-8
104.94 15.51 Rejected
9 Association between
Children in family and
Group-9
250.68 15.51 Rejected
10 Association between
Children in family and
Group-10
53.96 15.51 Rejected
Table 149
Sr. No. Null Hypothesis Chi-Square
Calculated
Value
Chi-Square
Table
Value
Result of
Test
1 Association between
Employment status and
Group-1
49.83 12.59 Rejected
2 Association between
Employment status and
36.35 12.59 Rejected

326
Group-2
3 Association between
Employment status and
Group-3
88.75 12.59 Rejected
4 Association between
Employment status and
Group-4
21.92 12.59 Rejected
5 Association between
Employment status and
Group-5
60.62 12.59 Rejected
6 Association between
Employment status and
Group-6
64.85 12.59 Rejected
7 Association between
Employment status and
Group-7
9.04 14.07 Accepted
8 Association between
Employment status and
Group-8
32.43 12.59 Rejected
9 Association between
Employment status and
Group-9
27.11 12.59 Rejected

327
10 Association between
Employment status and
Group-10
31.65 12.59 Rejected
Table 150
Sr. No. Null Hypothesis Chi-Square
Calculated
Value
Chi-Square
Table
Value
Result of
Test
1 Association between
Monthly income and
Group-1
106.30 15.51 Rejected
2 Association between
Monthly income and
Group-2
86.67 15.51 Rejected
3 Association between
Monthly income and
Group-3
49.39 15.51 Rejected
4 Association between
Monthly income and
Group-4
100.59 15.51 Rejected
5 Association between
Monthly income and
Group-5
90.79 15.51 Rejected
6 Association between
Monthly income and
Group-6
116.61 15.51 Rejected

328
7 Association between
Monthly income and
Group-7
18.78 15.51 Rejected
8 Association between
Monthly income and
Group-8
71.19 15.51 Rejected
9 Association between
Monthly income and
Group-9
53.31 15.51 Rejected
10 Association between
Monthly income and
Group-10
113.97 15.51 Rejected