The effect of digital maturity and entrepreneurial agility ...
193
The effect of digital maturity and entrepreneurial agility on firm performance in digital transformation of traditional organisations Luke Venkatesan 18361359 A research project submitted to the Gordon Institute of Business Science, University of Pretoria, in partial fulfilment of the requirements for the degree of Master of Business Administration.
Transcript of The effect of digital maturity and entrepreneurial agility ...

The effect of digital maturity and entrepreneurial agility on firm performance in
digital transformation of traditional organisations
Luke Venkatesan
18361359
A research project submitted to the Gordon Institute of Business Science, University of
Pretoria, in partial fulfilment of the requirements for the degree of Master of Business
Administration.

ii
Abstract
Traditional organisations are under pressure to undergo digital transformations (DT) to
manage the threat of disruption caused by the adoption of digital technologies. There is
thus a need for businesses to understand how competitive advantage can be achieved
through their DTs. However, their progress lags that of the technology industry as they
have lower digital maturity scores, fewer benefits, and still largely traditional business
models. This study drew on the resource based view (RBV) and dynamic capabilities
framework (DCF) to understand the effect of entrepreneurial agility (EA) and digital
maturity (DM) on competitive advantage, measured through firm performance in DTs. This
was achieved through a quantitative research design with 60 online survey respondents,
of whom the majority were in traditional organisations. This study extends the existing
theory on entrepreneurial agility to DTs by showing a positive correlation with firm
performance. Similarly, the moderating effects of digital maturity on the relationship
between EA and firm performance were evaluated. The results showed much fewer
moderating effects than were expected following a review of the digital maturity literature.
These findings are discussed in the context of recent literature on organisational- and
industry-related barriers for traditional organisations in DTs. A framework for traditional
organisations is proposed based on how they can leverage EA and DM to achieve a
competitive advantage through DTs.

iii
Keywords
Digital maturity, Digital transformation, Entrepreneurial agility, Competitive advantage,
Firm performance.

iv
Declaration
The following declaration should appear on a separate page:
I declare that this research project is my own work. It is submitted in partial fulfilment of
the requirements for the degree of Master of Business Administration at the Gordon
Institute of Business Science, University of Pretoria. It has not been submitted before for
any degree or examination in any other University. I further declare that I have obtained
the necessary authorisation and consent to carry out this research.
Luke Venkatesan
01/12/2020
_____________________

v
Table of Contents
Abstract ........................................................................................................................... ii
Keywords .........................................................................................................................iii
Declaration ..................................................................................................................... iv
Table of Contents ............................................................................................................ v
List of Figures .................................................................................................................. x
List of Tables .................................................................................................................. xi
List of Abbreviations and symbols ................................................................................. xv
Chapter 1: Introduction to the research problem .............................................................. 1
1.1 Context to the research problem ............................................................................ 1
1.2 Theoretical need for the research ........................................................................... 4
1.3 Business need for the research .............................................................................. 6
1.4 Scope of research .................................................................................................. 7
Chapter 2: Literature review ............................................................................................ 8
2.1 Introduction ............................................................................................................ 8
2.2 Digital Transformation ............................................................................................ 9
2.2.1 Description and definition of the digital transformation phenomenon ............... 9
2.2.2 Digital business strategy and digital transformation strategy ......................... 10
2.2.3 The need for digital transformation of traditional organisations ...................... 11
2.3 Firm performance and competitive advantage ..................................................... 14
2.3.1 Firm performance and digital transformation ................................................. 14
2.3.2 Firm performance in terms of sales ............................................................... 15
2.3.3 Firm performance in terms of market share ................................................... 15
2.3.4 Firm performance in terms of profit ............................................................... 16
2.3.5 Firm performance in terms of ROI ................................................................. 16
2.4 Theory: Resource based view and dynamic capabilities ...................................... 17
2.5 Organisational agility ............................................................................................ 19

vi
2.5.1 Organisational agility as a dynamic capability ................................................ 19
2.5.2 Organisational agility and digital transformation............................................. 20
2.5.3 Adaptive agility and entrepreneurial agility as a function of organisational agility
............................................................................................................................... 21
2.5.4 The use of entrepreneurial agility as opposed to adaptive agility as a construct
of organizational agility for digital transformations .................................................. 21
2.6 Entrepreneurial agility and firm performance ........................................................ 23
2.6.1 Entrepreneurial agility and proactive market strategies ................................. 24
2.6.2 Entrepreneurial agility and digital business strategies ................................... 26
2.7 Digital maturity ..................................................................................................... 27
2.7.1 Digital maturity and digital transformation ...................................................... 27
2.7.2 Digital technology, digital culture, digital organisational structure and digital
insights as a function of digital maturity .................................................................. 28
2.8 The relationship between digital maturity and firm performance ........................... 31
2.9 The effect of digital maturity on entrepreneurial agility and firm performance ....... 33
2.9.1 The effect of digital technology on entrepreneurial agility and firm performance
............................................................................................................................... 34
2.9.2 The effect of digital insights on entrepreneurial agility and firm performance . 36
2.9.3 The effect of digital culture on entrepreneurial agility and firm performance .. 36
2.9.4 The effect of digital organisational structure on entrepreneurial agility and firm
performance ........................................................................................................... 37
2.10 Conclusion ......................................................................................................... 38
Chapter 3: Research questions and hypotheses ........................................................... 40
Chapter 4: Research methodology ................................................................................ 42
4.1 Introduction .......................................................................................................... 42
4.2 Research philosophy ............................................................................................ 42
4.3 Approach to theory development.......................................................................... 43
4.4 Research methodology ........................................................................................ 43
4.5 Population and sampling frame ............................................................................ 44

vii
4.6 Unit of analysis ..................................................................................................... 45
4.7 Sampling method and sample size ....................................................................... 45
4.8 Measurement instrument ...................................................................................... 47
4.9 Data gathering process ........................................................................................ 47
4.10 Analysis approach .............................................................................................. 50
4.10.1 Detection and removal of outliers ................................................................ 50
4.10.2 Test for normality ......................................................................................... 54
4.10.3 Reliability and validity .................................................................................. 56
4.10.4 Descriptive statistics .................................................................................... 56
4.10.5 Factor analysis ............................................................................................ 57
4.10.6 Correlation analysis ..................................................................................... 58
4.10.7 Moderated linear regression ........................................................................ 58
4.11 Quality controls .................................................................................................. 59
4.12 Limitations .......................................................................................................... 60
Chapter 5: Results ......................................................................................................... 61
5.1 Introduction .......................................................................................................... 61
5.2 Details of the sample collected ............................................................................. 61
5.2.1 Total data sample .......................................................................................... 61
5.3 Demographics of the sample ................................................................................ 62
5.3.1 Gender .......................................................................................................... 62
5.3.2 Seniority in organisation ................................................................................ 62
5.3.3 Years of experience in organisation ............................................................... 63
5.3.4 Organisation size ........................................................................................... 64
5.3.5 Annual revenues ............................................................................................ 64
5.3.6 Industry type .................................................................................................. 65
5.4 Validity of the constructs used in the study........................................................... 65
5.5 Reliability of the constructs used in the study ....................................................... 68
5.6 Exploratory factor analysis ................................................................................... 68

viii
5.7 Descriptive statistics ............................................................................................. 72
5.8 Recheck for normality after factor analysis ........................................................... 73
5.9 Correlation analysis .............................................................................................. 74
5.9.1 Research Question 1 ..................................................................................... 74
5.10 Moderated regression analysis .......................................................................... 75
5.10.1 Research Question 2 ................................................................................... 75
Chapter 6: Discussion of results .................................................................................... 85
6.1 Introduction .......................................................................................................... 85
6.2 Research question 1: What is the relationship between entrepreneurial agility and
firm performance? ...................................................................................................... 85
6.2.1 Entrepreneurial agility and sales .................................................................... 86
6.2.2 Entrepreneurial agility and market share ....................................................... 87
6.2.3 Entrepreneurial agility and Profit .................................................................... 87
6.2.4 Entrepreneurial agility and ROI ...................................................................... 88
6.3 Research question 2: What is the effect of digital maturity on the relationship
between EA and firm performance for firms in DT? .................................................... 88
6.3.1 Effect of digital maturity on EA and sales ....................................................... 89
6.3.2 Effect of digital maturity on entrepreneurial agility and market share ............. 93
6.3.3 Effect of digital maturity on EA and profit and ROI ......................................... 94
6.4 Entrepreneurial agility and digital maturity in traditional organisations ................. 97
Chapter 7: Conclusions ................................................................................................. 99
7.1 Introduction .......................................................................................................... 99
7.1 Contributions to theory ......................................................................................... 99
7.1.1 Effect of EA on firm performance ...................................................................... 99
7.1.2 Effect of DM on the relationship between EA and firm performance ............... 100
7.2 Implications for managers .................................................................................. 101
7.2.1 Potential benefits of EA for managers ......................................................... 101
7.2.2 Potential issues with using only digital maturity to measure levels of digital
transformation for managers in traditional organisations ...................................... 102

ix
7.2.3 Proposed strategic framework for the digital transformation of traditional
organizations ........................................................................................................ 103
7.3 The limitations of the research ........................................................................... 105
7.4 Future research .................................................................................................. 106
References .................................................................................................................. 107
Appendix A: Questionnaire .......................................................................................... 121
Appendix B: Coding catalogue..................................................................................... 129
Appendix C: Validity test (Bi-variate correlation) .......................................................... 132
Appendix D: Factor analysis ........................................................................................ 139
Appendix D.1: Factor analysis results: Entrepreneurial agility .................................. 145
Appendix D.2: Factor analysis results: Digital technology ........................................ 146
Appendix D.3: Factor analysis results: Digital Culture .............................................. 148
Appendix D.4: Factor analysis results: Digital organisational structure .................... 150
Appendix D.5: Factor analysis results: Digital Insights ............................................. 152
Appendix E: Moderated regression .............................................................................. 153
Appendix E.1: Moderated regression assumptions .................................................. 153
Appendix E.2: Moderated regression DV, Sales. ..................................................... 155
Appendix E.3: Moderated regression DV, Market share........................................... 160
Appendix E.4: Moderated regression DV, Profit. ...................................................... 166
Appendix E.5: Moderation regression DV, ROI ........................................................ 171
Appendix F: Ethical clearance ..................................................................................... 177
Appendix G: Consent form .......................................................................................... 178

x
List of Figures
Figure 1: Box and Whisker plot for firm performance construct scores (before outlier
removal) ........................................................................................................................ 52
Figure 2: Box and Whisker plot for item total scores for EA and DM constructs (before
outlier removal) .............................................................................................................. 52
Figure 3: Box and Whisker plot for firm performance construct scores (after outlier
removal) ........................................................................................................................ 53
Figure 4: Box and Whisker plot for item total scores for EA and DM constructs (after outlier
removal) ........................................................................................................................ 53
Figure 5: Conceptual model to be tested with correlation and moderated regression
analysis ......................................................................................................................... 71
Figure 6: Matrix scatter plot showing the linear relationships between the dependent and
independent variables .................................................................................................... 76
Figure 7: Moderating effect of DTE on the relationship between EA and Sales ............. 79
Figure 8: Moderating effect of LS on the relationship between EA and Sales ................ 80
Figure 9: Moderating effect of DI on the relationship between EA and Sales ................ 81
Figure 10: Moderating effect of DCE on the relationship between EA and Market share
...................................................................................................................................... 82
Figure 11: Proposed strategic framework for traditional organizations to consider in digital
transformations ............................................................................................................ 103
Figure 12: Ethical clearance ........................................................................................ 177
Figure 13: Consent form .............................................................................................. 178

xi
List of Tables
Table 1: Table showing the mean and 5% trimmed mean after outlier removal for the scale
scores ............................................................................................................................ 54
Table 2: Shapiro Wilk test for normality for the scales ................................................... 55
Table 3: KMO and Bartlett's testof sphericity for factor analysis .................................... 57
Table 4: Summary of survey respondents and data filtering .......................................... 61
Table 5: Gender characteristics of population ................................................................ 62
Table 6: Seniority of respondents within the sample ...................................................... 63
Table 7: Years of experience in the organisation within the sample .............................. 63
Table 8: Organisation size in terms of number of employees within the sample ............ 64
Table 9: Annual revenues of organisations within the sample ....................................... 64
Table 10: Bi-variate correlation using Spearman’s rank for scale validity for firm
performance .................................................................................................................. 65
Table 11: Bi-variate correlation using Spearman’s rank for scale validity for EA ............ 66
Table 12: Bi-variate correlation using Spearman’s rank for scale validity for digital
technology ..................................................................................................................... 66
Table 13: Bi-variate correlation using Spearman’s rank for scale validity for digital culture
...................................................................................................................................... 67
Table 14: Bi-variate correlation using Spearman’s rank for scale validity for digital
organisational structure ................................................................................................. 67
Table 15: Test for reliability of scales ............................................................................. 68
Table 16: Descriptive statistics of constructs used in correlation and moderated regression
analysis ......................................................................................................................... 72
Table 17: Test for normality for all variables prior to correlation and regression analysis
...................................................................................................................................... 73
Table 18: Research question 1: Correlation analysis between entrepreneurial agility and
firm performance (sales, market share, profit, ROI) relative to competitors ................... 74
Table 19: Summary of moderating effects of digital maturity for EA and Sales .............. 78
Table 20: Summary of the moderating effects of digital maturity on EA and Market Share
...................................................................................................................................... 82
Table 21: Moderated regression results for the DV, profit .............................................. 83
Table 22: Moderated regression results for the DV, ROI ............................................... 84
Table 23: Survey questionnaire ................................................................................... 121
Table 24: Coding catalogue ......................................................................................... 129

xii
Table 25: Detailed industry type .................................................................................. 131
Table 26: Spearmans rank Bi-variate correlation for Firm Performance scale validity . 132
Table 27: Spearmans rank Bi-variate correlation for validy tests of the entrepreneurial
agility scale. ................................................................................................................. 132
Table 28: Spearman rank bi-variate correlation to test validity of the digital technology
scale under digital maturity .......................................................................................... 133
Table 29: Spearman rank bi-variate correlation to test validity of the digital culture scale
under digital maturity ................................................................................................... 134
Table 30: Spearman rank bi-variate correlation to test validity of the digital organisational
structure scale under digital maturity ........................................................................... 136
Table 31: Spearman rank bi-variate correlation to test validity of the digital insights scale
under digital maturity ................................................................................................... 137
Table 32: Correlation matrix for Entrepreneurial agility scale ....................................... 139
Table 33: Correlation matrix for Digital Maturity- Digital technology scale ................... 139
Table 34: Correlation matrix for Digital Maturity- Digital culture scale .......................... 141
Table 35: Correlation matrix for Digital Maturity-Digital organisational structure scale . 142
Table 36: Correlation matrix for Digital Maturity- Digital insights scale ......................... 143
Table 37: KMO and Bartlett's test for sphericity results on construct scales ................ 144
Table 38: Component matrix for entrepreneurial agility ............................................... 145
Table 39: Total variance explained for entrepreneurial agility ...................................... 145
Table 40: Rotated component matrix for Digital Maturity- Digital technology ............... 146
Table 41: Total variance explained for Digital Maturity- Digital technology .................. 147
Table 42: Rotated component matrix for Digital Maturity- Digital culture ...................... 148
Table 43: Total variance explained for Digital Maturity: Digital Culture ........................ 150
Table 44: Component matrix for Digital maturity- Digital organisational structure ........ 150
Table 45: Total variance explained for Digital maturity-Digital Organisational structure.
.................................................................................................................................... 151
Table 46: Component matrix for Digital maturity-Digital insights .................................. 152
Table 47: Total variance explained for Digital maturity- Digital insights. ...................... 152
Table 48: Summary of tests for homoscedasticity ........................................................ 153
Table 49: Test for normality of residuals ...................................................................... 154
Table 50: Model summary for moderated regression for DTE-EA-Sales. .................... 155
Table 51: Coefficients of moderated regression for DTE-EA-Sales. ............................ 155
Table 52: Model summary for moderated regression for DTS-EA-Sales ..................... 156
Table 53: Model co-efficients and significance for DTS-EA-Sales ............................... 156

xiii
Table 54: Model summary for moderated regression for LS-EA-Sales. ....................... 157
Table 55: Model co-efficients and significance for LS-EA-Sales .................................. 157
Table 56: Model summary for moderated regression for DCE-EA-Sales ..................... 158
Table 57: Model co-efficients and significance for DCE-EA-Sales ............................... 158
Table 58: Model summary for moderated regression for DOS-EA-Sales ..................... 158
Table 59: Model co-efficients and significance for DOS-EA-Sales ............................... 159
Table 60: Model summary for moderated regression for DI-EA-Sales ......................... 159
Table 61: Model co-efficients and significance for DI-EA-Sales ................................... 160
Table 62: Model summary for moderated regression for DTE-EA-Market Share ......... 160
Table 63: Model co-efficients and significance for DTE-EA-Market Share ................... 161
Table 64: Model summary for moderated regression for DTS-EA-Market Share ......... 161
Table 65: Model co-efficients and significance for DTS-EA-Market Share ................... 162
Table 66: Model summary for moderated regression for LS-EA-Market Share ............ 162
Table 67: Model co-efficients and significance for LS-EA-Market Share ...................... 163
Table 68: Model summary for moderated regression for DCE-EA-Market Share ......... 163
Table 69: Model co-efficients and significance for DCE-EA-Market Share .................. 163
Table 70: Model summary for moderated regression for DOS-EA-Market Share ........ 164
Table 71: Model co-efficients and significance for DOS-EA-Market Share . ................ 165
Table 72: Model summary for moderated regression for DI-EA-Market Share............. 165
Table 73: Model co-efficients and significance for DI-EA-Market share ....................... 166
Table 74: Model summary for moderated regression for DTE-EA-Profit ...................... 166
Table 75: Model co-efficients and significance for DTE-EA-Profit ................................ 166
Table 76: Model summary for moderated regression for DTS-EA-Profit ...................... 167
Table 77: Model co-efficients and significance for DTS-EA-Profit ................................ 167
Table 78: Model summary for moderated regression for LS-EA-Profit ......................... 168
Table 79: Model co-efficients and significance for LS-EA-Profit ................................... 168
Table 80: Model summary for moderated regression for DCE-EA-Profit ...................... 168
Table 81: Model co-efficients and significance for DCE-EA-Profit ............................... 169
Table 82: Model summary for moderated regression for DOS-EA-Profit ..................... 169
Table 83: Model co-efficients and significance for DOS-EA-Profit ............................... 170
Table 84: Model summary for moderated regression for DI-EA-Profit .......................... 170
Table 85: Model co-efficients and significance for DI-EA-Profit ................................... 171
Table 86: Model summary for moderated regression for DTE-EA- ROI ....................... 171
Table 87: Model co-efficients and significance for DTE-EA-ROI .................................. 172
Table 88: Model summary for moderated regression for DTS-EA-ROI ........................ 172

xiv
Table 89: Model co-efficients and significance for DTS-EA-ROI .................................. 173
Table 90: Model summary for moderated regression for LS-EA-ROI ........................... 173
Table 91: Model co-efficients and significance for LS-EA-ROI ..................................... 173
Table 92: Model summary for moderated regression for DCE-EA-ROI ........................ 174
Table 93: Model co-efficients and significance for DCE-EA-ROI ................................. 174
Table 94: Model summary for moderated regression for DOS-EA-ROI ....................... 175
Table 95: Model co-efficients and significance for DOS-EA-ROI ................................. 175
Table 96: Model summary for moderated regression for DI-EA-ROI............................ 176
Table 97: Model co-efficients and significance for DI-EA-ROI ..................................... 176

xv
List of Abbreviations and symbols
AI: Artificial intelligence β: Moderation co-efficient
AVE: Average variance explained r: Correlation coefficient
CEO: Chief executive officer
CFA: Confirmatory factor analysis
CRM: Customer relationship management
DBS: Digital business strategy
DCE: Digital culture embeddedness
DCF: Dynamic capabilities framework
DI: Digital insights
DM: Digital maturity
DOS: Digital organisational structure
DT: Digital transformation
DTE: Digital technology embeddedness
DTS: Digital technology strategy
DV: Dependant variable
EA: Entrepreneurial agility
EFA: Exploratory factor analysis
FP: Firm performance
HBR: Harvard Business Review
IS: Information systems
IT: Information technology
IoT: Internet of Things
IV: Independent variable
LS: Leadership support
MV: Moderator variable
OA: Organisational agility
PCA: Principal component analysis
RBV: Resource based view
ROI: Return on investment
SMACIT: Social, mobile, analytics, cloud and internet of things
VRIN: Valuable, rare, inimitable, non-substitutable
WEF: World economic forum

Chapter 1: Introduction to the research problem
1.1 Context to the research problem
Digital transformation (DT) is concerned with the adoption of digital technologies and their
impacts on customer behaviour and industry competitive responses (Chanias, Myers, &
Hess, 2019; Ferreira, Fernandes, & Ferreira, 2019; Hess, Benlian, Matt, & Wiesböck,
2016; Matt, Hess, & Benlian, 2015; Remane, Andre, Florian, & Lutz, 2017; Sebastian,
Ross, & Beath, 2017; Verhoef et al., 2019; Vial, 2019). The disintermediation of value
chains caused by these technologies is transforming the way customers engage with firms
(Verhoef et al., 2019; Vial, 2019), which is creating disruptive changes that can threaten
the competitive advantage and business models of incumbent firms (Bughin & van
Zeebroeck, 2017; Gill & Van Boskirk, 2016; Matzler, von den Eichen, Anschober, & Kohler,
2018). Traditional organisations are driven to adopt digital technologies to compete with
changes in the environment, using a measure called digital maturity to gauge their
progress (Anderson & Ellerby, 2018; Gill & VanBoskirk, 2016; Gurumurthy, Schatsky, &
Camhi, 2020; Kane, Palmer, Phillips, Kiron, & Buckley, 2015; 2016; 2017), however their
progress has been slow, with these firms still largely operating with their traditional
business models (Hanelt, Piccinini, Gregory, Hildebrandt, & Lutz, 2015; Kane et al., 2015;
WEF, 2017). Considering this changing environment and proactively sensing and
responding to these changes through a capability called entrepreneurial agility (EA) may
be important for firms to understand how they can achieve competitive advantage through
the adoption of digital technologies (Chakravarty, Grewal, & Sambamurthy, 2013; Verhoef
et al., 2019; Vial, 2019).
The purpose of this research is to understand what the relationship between
entrepreneurial agility and digital maturity is with regard to competitive advantage and firm
performance for traditional firms that have embarked on digital transformations.
Digital transformation is a complex phenomenon because it occurs at multiple levels, i.e.
the firm, industry and society (Matt et al., 2015; Matzler et al., 2018; Remane, et al., 2017).
At the society level, the adoption of digital technologies is changing customers’ behaviours
and expectations of firms, as they prefer the use of online and omni-channel purchasing
(multiple channels) and expect more efficient and customer centric service (Parise,

2
Guinan, & Kafka, 2016). This is being enabled by the likes of social media, which has
increased the level of connectivity between people in society and between customers and
firms (Mhlungu, Chen, & Alkema, 2019; Vial, 2019; Westerman, Bonnet, & Mcafee, 2014).
For example, a negative social media post describing the bad quality of a firm can lead to
a widespread boycotting of their products.
At the industry level, digital companies are leveraging customers’ affinity for digital
products and services by developing business models that disrupt existing value chains
through disintermediation (Teece, 2018; Verhoef et al., 2019; Warner & Wäger, 2019). An
example of this is the disruption of the hotel industry by Airbnb, where customers opt to
stay in another individual’s personal home which provides them with a cheaper alternative
than a hotel, and that individual’s home becomes a source of revenue for them. This
business model is thus able to capture value for customers and suppliers are created.
Similarly, the car sharing service, Zipcar, is disrupting the ownership model of existing car
manufacturers, where an individual’s unused vehicle becomes a source of income for one
person and provides a cost efficient service to others. Digital technologies enable these
transactions to be facilitated with ease and efficiency (Verhoef et al., 2019).
At the firm level, incumbent firms are finding themselves under pressure to adapt to these
changing market trends; not having the digital capabilities to compete in this environment
puts them at a competitive disadvantage, where new, small digital firms can threaten to
steal their market share because they have stronger digital capabilities (Bughin & van
Zeebroeck, 2017; Karimi, 2015; Verhoef et al., 2019; Vial, 2019). This inability to compete
forces traditional firms to be reactive rather than proactive, thus firms need to develop
digital capabilities through a process called digital transformation. Digital transformation is
defined as the process of adopting digital technologies across an organisation,
fundamentally transforming business strategies, business models, business processes,
firm capabilities, products and services with the purpose of achieving competitive
advantage (Bhadradwaj, El Sawy, Pavlou, & Venkatraman, 2013; Matt et al., 2015; Vial,
2019).
Digital technologies, according to Bhadradwaj, El Sawy, Pavlou and Venkatraman (2013,
p. 471), are viewed as “combinations of information, computing, communication, and
connectivity technologies”. These digital technologies go by the acronym SMACIT which
includes social, mobile, analytics, cloud and internet of things. In last few years, the rapid

3
development and pervasiveness of these digital technologies have changed the strategic
approaches of firms, whereby in the past a firm’s organisational or business strategy had
an information technology (IT) functional strategy which supported the business strategy
(Kahre, Hoffmann, & Ahlemann, 2017). IT enabled capabilities in firms to better interact
with customers, e.g. through customer relationship management; helped streamline
internal processes; and improved strategies through computing technologies (Kahre et al.,
2017; Mithas, Krishnan, & Fornell, 2016), which had benefits for companies in terms of
improved firm performance (Tallon, Queiroz, Coltman, & Sharma, 2019). However, in
recent years, the strategic role of digital technologies has shifted to being integrated with
the organisational strategy, called the digital business strategy (Bhadradwaj et al., 2013).
Bhadradwaj et al. (2013, p. 41) defined a digital business strategy (DBS) as an
“organisational strategy formulated and executed by leveraging digital resources to create
differential value”. The key difference here is the overlap and integration into an
organisation’s operational strategy (processes, products, markets) and functional
strategies (IT, finance, human resource etc.) (Hess et al., 2016; Matt et al., 2015). The
DBS senses digital trends in the environment, assesses an organisation’s existing
capabilities in terms of being able to compete, defines what the digital capabilities required
are, and assesses how firms should compete in the changing digital environment
(Bhadradwaj et al., 2013; Sebastian et al., 2017). DT creates the digital resources and
capabilities firms need to compete as defined by the DBS, which are managed and
coordinated through the DT strategy (Chanias et al., 2019; Hess et al., 2016; Matt et al.,
2015).
Management consultants and practice based literature (Anderson & Ellerby, 2018;
Chanias & Hess, 2016; Gill & VanBoskirk, 2016; Gurumurthy et al., 2020; Kane et al.,
2015; Remane, et al., 2017; Valdez-de-Leon, 2016) have developed digital maturity
models to help firms manage their digital transformations. These instruments are based
on literature analysis, expert interviews and quantitative analysis (Remane, Hanelt,
Wiesboeck, & Lutz, 2017), which compares firms against a defined normative best
practice standard. DM is described as the status or progress made in a firm’s digital
transformation (Chanias & Hess, 2016). The results from these global executive surveys
and analyses indicate that there is a positive correlation between DM and a firm’s
performance, however these typically compare traditional firms in industries such as
finance, manufacturing, automotive, mining etc. with technology firms on the same scale.

4
As expected, technology firms outperform traditional firms (Kane et al., 2015), thus this
may not be a realistic comparison because of the industry and organisational specific
challenges that firms may face (Gao, Hakanen, Töytäri, & Rajala, 2019; Vogelsang, Liere-
netheler, & Packmohr, 2019; Warner & Wäger, 2019). Comparing all these firms with the
same yardstick may thus be an over-simplification of their digital maturities (Remane et
al., 2017). Furthermore, these digital maturities tell traditional firms what their capabilities
should be, but do not describe how these digital resources and capabilities can be used
to achieve competitive advantage. Developing these digital resources and capabilities
may thus not be enough for competitive advantage, as many firms have invested in DT
initiatives but few have seen the benefits (Sutcliff, Narsalay, & Sen, 2019; Westerman &
Davenport, 2018).
Considering the changing environments created by DT, this research will also aim to
understand whether there is a relationship between proactive and rapid responses to
market changes and competitive advantage through entrepreneurial agility. Furthermore,
it will also aim to understand whether the digital resources and capabilities developed in
at DT, as measured by digital maturity, can enhance the relationship between
entrepreneurial agility and firm performance in traditional firms. The next section will
discuss the theoretical need based on the above argument.
1.2 Theoretical need for the research
The phenomenon of DT at the level of the organisation is dynamic in that both the external
environment is driving change within the organisation, as well as the internal environment
itself through the adoption of digital technologies (Vial, 2019). The external environment
changes are being monitored by the firm through the DBS (Bhadradwaj et al., 2013), and
internal changes by being managed by the DTS (Hess et al., 2016; Matt et al., 2015). The
DT process creates digital capabilities for firms that they need in order to support the DBS
to achieve the firm’s competitive strategies. Hence, in order to understand this
phenomenon, the resource based view (RBV) of the firm was used where if a firm’s
resources are VRIN (valuable, rare, inimitable, non-substitutable) (Barney, 1991), these
.can lead to competitive advantage. Similarly, the dynamic capabilities framework (DCF)
which extends from the RBV, helps to understand how competitive advantage can be
achieved in dynamic environments through the use of dynamic capabilities (Teece &
Pisano, 1994). Teece and Pisano (1994, p. 6) described dynamic capabilities as, “the

5
subset of the competences/capabilities which allow the firm to create new products and
processes, and respond to changing market circumstances”.
Whilst the context for digital technologies is new, the adoption of IT in organisations is not
new in information science (IS) research. Over the last two decades, several studies have
been conducted on the impact of IT on competitive advantage and firm performance
through the concept of organisational agility (Sambamurthy, Bharadwaj, & Grover, 2003;
Overby, Bharadwaj & Sambamurty, 2006; Sambamurthy, Lim, Lee, Lee, & Lim, 2007; Lu
& Ramamurthy, 2011; Chakravarty et al., 2013; Chen et al., 2014; Tallon et al., 2019).
Organisational agility (OA) is defined as the ability of firms to sense competitive market
opportunities, and the use of its resources to seize these opportunities (Goldman, Nagel
& Preiss, 1995).
Organisational agility is seen in literature as a multi-dimensional construct, which is largely
described as having a proactive and reactive component (Chakravarty et al., 2013; Felipe,
Roldán, & Leal-Rodríguez, 2016; Overby, Bharadwaj, & Sambamurthy, 2006;
Sambamurthy, Bharadwaj, & Grover, 2003; Sambamurthy et al., 2007). These are called
entrepreneurial agility (EA) and adaptive agility (AA) respectively. EA anticipates changes
in the environment and responds by conducting strategic experiments with new business
models and approaches, in order to capitalise on first mover advantage through radical
changes (Sambamurthy et al., 2007). This has been found to correlate with improved
competitive advantage in firms, particularly in changing environments (Chakravarty et al.,
2013; Sambamurthy et al., 2007), AA is more reactive and is based on institutionalising
best practices in firms to recover from disruption, which leaves them vulnerable to
disruption from digital firms (Chakravarty et al., 2013; Sambamurthy et al., 2007). For
these reasons, EA is more suitable to the current environment created by DT.
Given that the strategic role of digital technologies have changed significantly, particularly
for DTs, this means that they have a much broader impact across the organisation in not
just supporting the business strategy of firms, but in defining the strategy for firms. This
illustrates the need for literature to understand what the relationship between EA and FP
is in the DT context. Several authors have indicated the value of organisational agility in
digital transformations (Verhoef et al., 2019; Vial, 2019; Warner & Wäger, 2019), but to
the researcher’s knowledge there has not been an empirical assessment of this
relationship .

6
The DM construct has been largely used by practice based literature and management
consultants. Chanias et al. (2016) defined DM as progress made in a DT. While this
correlates with improved FP, it is not clear what the relationships between the digital
resources and capabilities developed in a DT are on enabling competitive advantage in
firms. While the effects of DM on EA and firm performance have not been studied widely
in literature, Chakravarty et al. (2013) showed that IT competencies can have a
moderating effect between entrepreneurial agility and firm performance. This study was
conducted on DT, however, and there has not been any literature measuring the
moderating effects of the broader capabilities associated with DM on EA and firm
performance (Vial, 2019). Researchers have highlighted the relevance some of interactive
relationships between aspects of digital organisational structure and culture on enhancing
agility in DT, but these have not been tested empirically (Verhoef et al., 2019; Warner &
Wäger, 2019). Hence this research provides an empirical assessment of the moderating
effects based on the current definitions of DM in literature. This will help to validate some
of the concerns raised by Remane et al. (2017) on the construct validity of DM, which may
be oversimplified in practice by assuming all industries follow the same linear path.
1.3 Business need for the research
According to global executive surveys conducted by MIT’s Sloan Management Review
and Deloitte, the majority of senior leaders believe their organisations will be disrupted by
digital technologies, but few believe they are adequately prepared for it (Anderson &
Ellerby, 2018; Kane et al., 2016). There has been significant investment globally in DT
initiatives; a global executive survey by Accenture showed that between 2016 and 2018,
1,350 firms globally spent over $100 billion on digital transformation, but very few have
seen the returns expected on their investment (Sutcliff et al., 2019). The implementation
of digital transformations in practice thus do not always deliver the expected benefits for
firms (Westerman & Davenport, 2018). This has seen the rise of C-suite executive
positions such as Chief Digital Officers, as well as CEOs themselves leading the digital
transformation agenda (Siebel, 2020; Singh & Hess, 2017; Westerman & Davenport,
2018).
This research aimed to provide strategic insights to traditional firms undergoing digital
transformations. The first was to understand whether proactive and rapid strategic
responses through EA correlate with improved competitive advantage and firm

7
performance in DT. This may provide business leaders with insights as to whether they
should adjust their DBS to incorporate these strategic approaches, for example through
prospector/analyser strategies.
The second is to help understand the relationships between the digital resources and
capabilities developed in a DT, measured through the use of the concept digital maturity,
and the competitive advantage of traditional firms. This will provide insights to business
leaders on the use of digital maturity as a lever for competitive advantage.
1.4 Scope of research
The objective of this research is to understand: what is the effect of EA and DM on firm
performance for traditional firms undergoing digital transformations. The scope of the
research was limited to the definitions below for the purpose of this study:
Digital transformation: the process of the adoption of digital technologies across an
organisation which fundamentally transforms business strategies, business models,
business processes, firm capabilities, products and services, with the purpose of
achieving competitive advantage (Bhadradwaj, El Sawy, Pavlou, & Venkatraman, 2013;
Matt et al., 2015; Vial, 2019).
Digital maturity: the firm’s progress in developing digital resources and capabilities in a
digital transformation, as an outcome of the digital transformation strategy (Chanias &
Hess, 2016).
EA: a dynamic capability in a digital transformation that enables a firm to proactively sense
opportunities and reconfigure its internal resources and capabilities, which can include
assets, structure, strategy and resources, to bring about fundamental changes in the firm
to capitalise on those opportunities (Chakravarty et al., 2013; Lu & Ramamurthy, 2011;
Sambamurthy et al., 2003).
Digital technologies: are “combinations of information, computing, communication, and
connectivity technologies” (Bhadradwaj, El Sawy, Pavlou, & Venkatraman, 2013, p. 471).

8
Chapter 2: Literature review
2.1 Introduction
This literature review presents a discussion on the complex nature of digital
transformations and provides a definition of this phenomenon at the level of the
organisation (Verhoef et al., 2019; Vial, 2019; Warner & Wäger, 2019). The literature
review discusses the impact of digital transformation at the level of the organisation with
regard to its ability to create new digital resources and capabilities through the adoption
of digital technologies. This process is managed through the digital transformation
strategy (Hess et al., 2016; Matt et al., 2015), which is guided by the digital business
strategy of the firm (Bhadradwaj et al., 2013).
The competitive advantages that adopting digital technologies may bring to firms are
discussed and their links to firm performance. Two theoretical lenses, i.e. the resource
based view and dynamic capabilities, were used in this study to understand the
relationships between digital maturity, entrepreneurial agility and firm performance, as well
as the effects of digital maturity on the relationship between entrepreneurial agility and
firm performance. The purpose of the research was to understand how these constructs
can improve the competitive advantage of traditional firms undergoing digital
transformations.
The literature review further explores the applicability of organisational agility for digital
transformations, as well as what elements of it are most applicable to enable firms to
achieve a competitive advantage in digital transformations. The proactive construct of
entrepreneurial agility is then explored, as are its effects on firm performance in a digital
transformation. The construct digital maturity is discussed and a definition is provided for
the context of this study. The literature review goes on to explore the concept of digital
maturity and its relationship with improved firm performance. Lastly, it explores the effects
of digital maturity on the relationship between entrepreneurial agility and firm performance.
The next section begins with a description and definition of the phenomenon under study,
namely digital transformation.

9
2.2 Digital Transformation
2.2.1 Description and definition of the digital transformation phenomenon
Digital transformation (DT) is concerned with the adoption and impacts of digital
technologies on firms, industry and society (Chanias et al., 2019; Majchrzak, Markus, &
Wareham, 2016; Matt et al., 2015; Vial, 2019), i.e. it is a multiple-level, complex
phenomenon. Vial (2019) performed a literature review on digital transformation across a
total of 282 papers from journals and conferences in order to describe the phenomenon
of DT. Vial (2019) proposed a framework based on the literature findings, which still needs
to be validated empirically.
The framework describes the adoption of digital technologies at both the industry and
society levels fuels disruptions in the market place through changes in customer
behaviours and expectations (Vial, 2019), which triggers competitive changes in industry
and the availability of data these technologies provide (Porter & Heppelmann, 2015;
Verhoef et al., 2019; Vial, 2019). The complexity of DT thus lies in that it causes changes
in both the external environment through changing customer behaviours and industry
responses (Matzler, von den Eichen, Anschober, & Kohler, 2018), as well as changes
within the firm as it adopts digital technologies. This requires strategic alignment between
the firm and the environment, which is achieved through a digital business strategy
(Bhadradwaj et al., 2013) and digital transformation strategy (Matt et al., 2015). These are
dependent on the adoption of digital technologies within the organisation (Bhadradwaj et
al., 2013; Hess et al., 2016). At the firm level, the adoption of digital technologies enable
changes in value creation paths, which are affected by structural changes (organisational
culture, company structure, leadership, employee roles and responsibilities) and
organisational barriers (inertia and resistance to change) (Singh & Hess, 2017; Warner &
Wäger, 2019). This generates either positive effects which translate into firm performance
(Westerman & Bonnet, 2015; Westerman & Mcafee, 2012), or negative effects due to
security and privacy concerns (Majchrzak et al., 2016). This research focuses on digital
transformation at the level of the organisation.
There is lack of consensus and clarity on the definition of DT in literature, particularly
around the different impacts of adopting digital technologies across multiple units of
analysis, i.e. the firm, society and industry levels (Vial, 2019; Warner & Wäger, 2019). In

10
a literature review on the phenomenon DT, Vial (2019) reviewed definitions from 28
sources, which contained 23 definitions of DT in literature at multiple levels (society,
industry and organisational). The common themes across these definitions included the
use or adoption of digital technologies, the unit of analysis (society, industry or
organisation), the area of transformational change, and the purpose of the change.
Vial (2019, p. 121) provided a general conceptual definition of DT, i.e. it is “a process that
aims to improve an entity by triggering significant changes to its properties through
combinations of information, computing, communication, and connectivity technologies”.
Organisational level DT literature describes the outcomes as being fundamental changes
to a firm’s strategy, processes, capabilities, products and services, which may even result
in changes to the business model in order for the firm to be competitive in the environment
it operates in (Bhadradwaj et al., 2013; Hess, Benlian, Matt, & Wiesböck, 2016; Matt et
al., 2015; Vial, 2019). The following definition of the DT phenomenon at the level of the
organisation was used in this study: the process of the adoption of digital technologies
across an organisation, which fundamentally transforms business strategies, business
models, business processes, firm capabilities, products and services, with the purpose of
achieving competitive advantage.
2.2.2 Digital business strategy and digital transformation strategy
Bhadradwaj et al. (2013, p. 41) defined digital business strategy (DBS) as an
“organisational strategy formulated and executed by leveraging digital resources to create
differential value”. This has a much broader fundamental impact for the entire
organisation, since it integrates across the operational and functional components of the
organisation, and is based on how an organisation can create differentiated value from
the adoption of digital technologies (Bhadradwaj et al., 2013). The digital business
strategy detects digital trends in the external environment from the development and
adoption of digital technologies in the external environment, and also assesses the
organisational shifts required to create value from them. These organisational shifts are
be created through the DT process. DT may require fundamentally transforming business
strategies, business models, business processes, firm capabilities, products and services
to create the differentiated value (Bhadradwaj et al., 2013; Hess, Benlian, Matt, &
Wiesböck, 2016; Matt et al., 2015; Vial, 2019).

11
In order to help organisations manage this DT process, DT strategies (Hess et al., 2016;
Matt et al., 2015) and digital maturity models (DMM) (Anderson & Ellerby, 2018; Gill &
VanBoskirk, 2016; Kane et al., 2016; 2017) have been developed. Matt et al. (2015) and
Hess, Benlian, Matt and Wiesböck (2016) developed a DT strategy to help co-ordinate the
widespread changes and activities, as well as to manage the development of the firm
capabilities required by the organisation’s DBS. The elements of the DT strategy comprise
the use of digital technologies, changes in value creation, structural changes and financial
aspects (Chanias & Hess, 2016). The progress a firm makes through its DT has been
described by the concept called digital maturity (DM) (Kane & Kiron, 2015; Kane et al.,
2017). DM has been used as measure of progress in DT in terms of creating digital
resources and digital capabilities(Anderson & Ellerby, 2018; Gurumurthy et al., 2020;
Kane et al., 2017; Westerman & Mcafee, 2012).
Digital technologies, according to Bhadradwaj, El Sawy, Pavlou and Venkatraman (2013,
p. 471), are viewed as “combinations of information, computing, communication, and
connectivity technologies”. Based on this definition, research into the adoption of digital
technologies into organisations is not new, with the role of information technology (IT)
being a part of information systems literature (Bhadradwaj et al., 2013; Henderson &
Venkatraman, 1993; Mithas, Krishnan, & Fornell, 2016; Ngai, Chau, & Chan, 2011;
Nwankpa & Roumani, 2016; Overby et al., 2006; Ravichandran, 2018; Sabherwal &
Jeyaraj, 2015) Focussing on the alignment of IT strategy and business strategy, as well
as the strategic role of IT in organisations. The research by Chakravarty et al. (2013) and
Sambamurthy et al. (2007) identified the role of IT in enabling the concept, entrepreneurial
agility (EA), which was found to positively relate to firm performance by enabling firms to
proactively and rapidly respond to the changing environment. In recent years, however,
the rapid development and the pervasiveness of digital technologies (e.g. social media,
data analytics, internet of things, digital platforms, block chain, artificial intelligence,
machine learning) has caused a shift in the strategic role of IT, from aligning and being
subordinate to the business strategy, to an integrated strategy of both IT and business
strategy, i.e. a digital business strategy (Bhadradwaj et al., 2013; Kahre, Hoffmann, &
Ahlemann, 2017). This research thus aims to understand the relationship between EA,
DM and firm performance in DTs.
2.2.3 The need for digital transformation of traditional organisations
12
The adoption of digital technologies is creating both existential threats and opportunities
for organisations, particularly those that are still largely traditional (Sebastian et al., 2017),
due to customer behavioural changes, the resultant industry responses and the threats to
their existing business models. These organisations need to accelerate the adoption of
these digital technologies in order to better compete in the growing digital landscape or
risk being digitally disrupted (Karimi, 2015; Matzler et al., 2018; Shrivastava, 2017;
Westerman & Bonnet, 2015; Westerman & Mcafee, 2012). The potential benefits are
broad, including an increase in sales and productivity, creating innovative ways of creating
value, and improving interactions with customers (Dremel, Herterich, Wulf, Waizmann, &
Brenner, 2017;Fitzgerald, 2015; 2016a; 2016b; Gurumurthy, Schatsky, & Camhi, 2020).
The widespread impacts of DT can cause a company’s entire business model to change
(Chanias et al., 2019; Hess et al., 2016; Matt et al., 2015; Verhoef et al., 2019), thus firms
need to understand how they sense, respond to and capitalise on opportunities through
EA, and how developing digital capabilities through DM affects these fundamental
changes.
Digital disruption poses a major risk for incumbent firms in traditional industries (Bughin &
van Zeebroeck, 2017; Matzler et al., 2018; Verhoef et al., 2019; Vial, 2019), for example
the impact of online retailers like Amazon and Alibaba, which resulted in the bankruptcy
of Toys“R”Us, and the disruption by Booking.com and Airbnb on the hotel industry. These
digital organisations leverage digital technologies to disintermediate existing
organisation’s traditional products and value chains (Warner & Wäger, 2019). This is
where consumers use digital technologies to access products and services directly from
the suppliers without having the need to go through any traditional intermediaries like
wholesalers and retailers, for example. An example is Amazon, where consumers buy
their products through the platform that Amazon provides directly from the supplier,
without using the traditional physical wholesale and retail stores. Another example is the
car sharing market – digital companies like Zipcar can supply consumers with cars that
they do not own, bypassing the traditional ownership model between consumers and car
manufacturers, where the car in this model is a commodity that is shared and not owned
(Hanelt, Piccinini, Gregory, Hildebrandt, & Lutz, 2015). BMW and Daimler have had to
respond by developing their own digital capabilities to provide a car sharing service in this
market because of consumer demand, as well as the threat by this new market to their
existing business models. This disintermediation can also enable small digital firms to
disrupt large traditional firms by leveraging digital technologies (Bughin & van Zeebroeck,

13
2017; Vial, 2019). DM and EA are therefore important for understanding the level of digital
capabilities that a firm requires, as well as how to proactively respond to the disruptive
environment that digital technologies are creating.
Global executive surveys conducted by MIT’s Sloan Management Review and Deloitte
(Kane et al., 2016) indicate that nearly 90% of executives and managers believe that their
industries will be disrupted by digital technologies, but only 44% believe they are
adequately prepared for it. There has thus been a significant investment globally in DT
initiatives; a global executive survey by Accenture showed that between 2016 and 2018,
1,350 firms spent over $100 billion on DT, but few have reported achieving the expected
benefits (Sutcliff et al., 2019). The risks of digital disruption are thus major drivers of DT
in firms (Matzler et al., 2018; Vial, 2019), but companies need to understand how to gain
a competitive advantage through DT (Westerman & Davenport, 2018). This research is
thus relevant to help provide insights into how firms can gain these expected benefits in
performance through digital transformation, by understanding the role of DM and EA.
A popular example of a successful DT vs. a company that did not digitally transform is
Blockbuster and Netflix. Both these firms were once competing in the same industry,
however Blockbuster failed to adopt digital technologies with the emergence of the internet
and changes in customer preferences. Netflix, on the other hand, was proactive at
developing its digital capabilities through DT, and reconfigured its business model. Netflix
has continued to experience rapid growth and is now disrupting the TV broadcasting and
film industries (Verhoef et al., 2019), while Blockbuster went bankrupt.
In summary, DT is a process that involves the adoption of digital technologies across an
organisation, and as a result brings about fundamental changes within that organisation
as well as the products and services it provides (Bhadradwaj et al., 2013; Hess, Benlian,
Matt, & Wiesböck, 2016; Matt et al., 2015; Vial, 2019). DT creates capabilities which are
leveraged by the DBS to achieve a competitive advantage for the firm (Bhadradwaj et al.,
2013; Vial, 2019). The DT strategy co-ordinates and manages the development of the
digital capabilities, and is guided by an organisation’s DBS (Bhadradwaj et al., 2013; Matt
et al., 2015). DM measures the progress an organisation makes through a DT. The
purpose of this study is to understand the effects of DM and EA, which should help firms
to proactively respond to the environment to manage threats of disruption and create a
competitive advantage.

14
2.3 Firm performance and competitive advantage
Barney (1991) described competitive advantage as the outcome of a strategy that is not
yet implemented by other firms, which provides a reduction in costs, the exploitation of
market opportunities, and the neutralisation of competitive threats. This is viewed through
the economic lens, with a firm being able to generate more economic value by the
difference in perceived value and the economic costs to produce, when compared to
competitors (Peteraf & Barney, 2003). Newbert (2008) described this advantage as being
able to produce higher benefits for customers for the same costs as competitors, which
implies a differentiation competitive advantage. Similarly, being able to produce similar
benefits for lower costs implies an efficiency competitive advantage (Newbert, 2008). It is
expected that these competitive advantages would translate into improved financial
performance for a company, which was validated empirically by Newbert (2008) and Lin
and Wu (2014). In this way, a firm’s financial performance can be a measure of its
competitive advantage. The purpose of DT would thus be to enable firms to achieve
competitive advantage measured by improved firm performance through the adoption of
digital technologies, as guided by the DBS (Bhadradwaj et al., 2013). This study aimed to
understand the effect of DM and EA on achieving competitive advantage measured
through firm performance in DTs.
2.3.1 Firm performance and digital transformation
Firm performance has been measured through the use of financial measures by several
authors in information science literature (Chakravarty et al., 2013; Y. Chen et al., 2014;
Ferreira, Fernandes, & Ferreira, 2019; Mithas et al., 2016; Sambamurthy et al., 2007;
Wamba et al., 2017). These financial measures have included sales, market share, profit
and return on investment (ROI). Firm financial performance will be referred to as firm
performance going forward. Fitzgerald et al. (2013) indicated that firms capture value and
a competitive advantage by adopting digital technologies, enhancing customer experience
or engagement, streamlining their operations, generating new lines of business, and
developing new business models. Developing new business models is observed less
frequently in traditional companies, however (HBR Analytic Services, 2014; Fitzgerald et
al., 2013).
15
2.3.2 Firm performance in terms of sales
The most common use of digital technologies is for customer engagement and interaction
(Sebastian et al., 2017; Fitzgerald et al., 2013). This can be done through the use of social
media, apps or tools, such as those for customer relationship management (CRM), which
can improve customer satisfaction by increasing the level of interaction between a firm
and its customers (Mithas et al., 2016; Sebastian et al., 2017), including managing queries
(Gurumurthy et al., 2020; Mithas et al., 2016; Sebastian et al., 2017). Otto, Szymanski and
Varadarajan (2020) indicated that customer satisfaction can lead to improved customer
loyalty, positive word of mouth and an increased share of the customers’ wallet, which are
sources of competitive advantage that can lead to improved sales.
Firms may also use social media and internet search engines for their marketing and sales
channels (Vial, 2019), which can use the data generated through advanced analytics to
supply products and services based on customer needs (Bughin & van Zeebroeck, 2017).
Facebook and Google, for example, use data algorithms to suggest products and services
to customers on behalf of firms based on search patterns on their platforms, as well as
through search engine optimisation. These technologies can give firms a competitive
advantage, as customers and companies can be quickly connected through these
channels. Similarly, online sales platforms can allow customers to purchase items online,
which supports the customer behaviour change towards omni-channel purchases
(multiple channel, physical and online) for different products and services (Bughin & van
Zeebroeck, 2017; Parise, Guinan, & Kafka, 2016; Vial, 2019). This will broaden the firm’s
access to wider customer buying channels, which can enhance sales (Otto et al., 2020).
2.3.3 Firm performance in terms of market share
According to Edeling and Himme (2018), market share is an organisation’s share of the
total market, either monetary or volume. An organisation can increase its percentage of
sales, but still have a lower market share than its competitors. Sales and market share
are typically driven by similar factors, such as customer satisfaction (Edeling & Himme,
2018; Otto et al., 2020). Market share can also indicate an increase in competitive
advantage due to higher economies of scale, market power and quality (Edeling & Himme,
2018). More advanced digital technologies include remote experts and digital assistants,

16
which can provide real-time support to customers to improve their experience (Parise et
al., 2016). This, in turn, can increase customer satisfaction and improve market share.
Similarly, technologies like big data can provide firms with insights about customer trends
and buying patterns, giving them superior knowledge of new products or lines of business
that can help improve their market share (Wamba et al., 2017).
2.3.4 Firm performance in terms of profit
Profits can be increased when firms grow the difference between their revenues and costs,
or when they reduce costs. Digital technologies can reduce costs by streamlining internal
processes and improving efficiencies (Fitzgerald et al., 2013). These can include adopting
cloud services to increase the efficiency of business processes and reduce costs, where
these services are maintained outside of the organisation without needing a dedicated IT
team (Vial, 2019). Firms can also leverage the internet of things to improve the
connectivity of their products, which can provide them with insights to streamline their
internal business processes (Dremel et al., 2017; Porter & Heppelmann, 2015). As an
example, Audi has introduced connectivity into their vehicles, which allows them get
insights from their vehicles’ data to improve their maintenance, product and service
offerings. These can help reduce costs by improving efficiency, for example the design
process lead time of vehicles in the automotive industry can be significantly reduced using
simulation software (Hanelt et al., 2015). This can save costs in the design process and
give firms a competitive advantage in terms of the cost of producing their vehicles, which
increases their profitability. Similarly, digital technologies enable the automation of
business processes through technologies like robotic process automation (Gurumurthy et
al., 2020; Porter & Heppelmann, 2015; Westerman & Bonnet, 2015). This can add
efficiencies to existing processes and reduce labour costs, which can create competitive
advantage and improve profitability.
2.3.5 Firm performance in terms of ROI
ROI is an indication of an organisation’s ability to generate a higher return per unit capital
invested (Ward & Price, 2019), and can be measured by profit divided by capital invested.
ROI thus depends on the ability of firms to generate a higher profit, as discussed above,
but with the same or less capital invested to create a competitive advantage. This can be
achieved through the scalability of digital technologies such as cloud computing or digital

17
platforms (Bhadradwaj et al., 2013; Sebastian et al., 2017; Vial, 2019). This can result in
firms leveraging economies of scale without significantly changing their capital invested in
digital technologies. An example of a firm that uses digital platforms is First National Bank,
which has created a banking app. The company is able to add several features quickly to
the app to improve customers’ experiences and grow their customer base.
Cloud computing has the benefit of being-service based, where a firm does not need to
invest in the IT infrastructure required while still gaining the computing power it needs for
its business processes through service- and subscription-based payment structures.
These can enable firms to scale up their services with less capital, which increases their
competitive advantage through ROI.
In summary, competitive advantage can be measured through firm performance. The
adoption of digital technologies can provide firms with competitive advantages across all
the sub-constructs of firm performance. The next section discusses the theory base used
in this study to understand how the dependent variable in this study, firm performance,
relates to the variables EA and DM.
2.4 Theory: Resource based view and dynamic capabilities
As discussed earlier, firm performance is a measure of competitive advantage that
organisations can realise through DT. An organisation can create higher value for
customers by how it directs its digital resources and capabilities through the DBS
(Bhadradwaj et al., 2013). These resources and capabilities are developed as the
organisation progresses through the DT (Verhoef et al., 2019). This is co-ordinated and
managed by the DT strategy (Hess et al., 2016), which supports the DBS (Bhadradwaj et
al., 2013). Within a DT, these resources and capabilities are developed, configured and
reconfigured over time as the firm adopts new digital technologies (Chanias et al., 2019).
The DT environment within a firm is thus dynamic. Similarly, in the external environment,
which is also being impacted by digital technologies, as consumers and industries adopt
these technologies, this triggers changes in the environment (Vial, 2019). A company thus
needs to constantly sense these market changes, whilst also being cognisant of its internal
changes due to its DT. The external market changes are identified and managed through
the DBS (Bhadradwaj et al., 2013) in terms of how a organisation competes in the
environment (Sebastian et al., 2017). The DT strategy then guides the DT efforts, which

18
effects the changes required in the organisation (Hess et al., 2016; Matt et al., 2015). In
order to understand how these resources and capabilities change over time, the resource
based view (RBV) (Wernerfelt, 1984; Barney, 1991) and the dynamic capabilities
framework (DCF) (Teece & Pisano, 1994) were found to be appropriate theoretical lenses.
The RBV of a firm is a theoretical lens that analyses a firm based on its resources, which
was introduced by Penrose (1959) and further described by Wernerfelt (1984). A firm's
resources were defined by Barney (1991, p. 101) as “all assets, capabilities,
organisational processes, firm attributes, information and knowledge” that are controlled
by a firm, which enable strategies to be developed and implemented to improve its
effectiveness and efficiency. These resources can be divided into organisational, human
and physical resources. Organisational resources include a firm’s organisational structure;
planning, coordinating and controlling systems; and informal relationships between groups
within a firm and between the firm and the environment. Physical resources include
technology, plants and equipment, geographic location and raw materials, while human
resources include the experience, training, judgement, intelligence, relationships and
insights of both workers and individual managers in a firm. Barney (1991) noted that these
resources need to be valuable, rare, imperfectly imitable, and non-substitutable (VRIN) in
order to achieve sustained competitive advantage. A firm undergoing a DT would develop
new digital resources and capabilities as required (Verhoef et al., 2019) by the DBS, which
can span across the organisational, physical and human resources. The assumption with
Barney’s (1991) theory is that the firm’s resources remain stable over time, but this is not
the case with DT, as the firm is undergoing a continuous resource and capability
configuration and reconfiguration because of the changing environment.
Teece and Pisano (1994) identified adapting to changing environments as an important
component in achieving competitive advantage, which is why they introduced the dynamic
capabilities framework (DCF). The authors used the term “dynamic” to describe the
changing nature of the environment, the accelerating pace of innovation, and the future
competition and market that is difficult to determine. Thus this dynamic environment
applies to DTs. They emphasised “capabilities” as being able to adapt, integrate, and
reconfigure internal and external organisational skills, resources and functional
competencies to the changing environment through strategic management (Teece &
Pisano, 1994). Teece and Pisano (1994, p. 6) described dynamic capabilities as “the
subset of the competences/capabilities which allow the firm to create new products and

19
processes, and respond to changing market circumstances”. Teece et al. (2016) further
described dynamic capabilities as having sensing, seizing and transforming capabilities.
Sensing capabilities were described by the authors as identifying, developing, and
assessing market opportunities that are identified in relation to customer needs for
anticipating unknown future needs. Seizing, meanwhile, was described as being able to
mobilise resources to cater for these needs and opportunities, and being able to capture
value from them. Finally, transforming was described as the continued renewal of these
capabilities over time through implementing processes or systems. Hence considering the
changing environment created by DTs and the purpose of competitive advantage,
dynamic capabilities may be an important lever for firms undergoing DTs.
In summary, as a firm progresses through a DT, fundamental changes occur which can
result in new digital resources and capabilities being created across the organisation. The
RBV of the firm can help in understanding how these resources can be VRIN to enable a
competitive advantage, as well as how dynamic capabilities in terms of sensing, seizing
and transforming are required to respond to the changing environment to support DT in
achieving a competitive advantage. The capability that firms may use to respond to
environmental changes is called organisational agility, which will be discussed in the next
section.
2.5 Organisational agility
2.5.1 Organisational agility as a dynamic capability
Organisational agility (OA) can be defined as the ability of firms to sense competitive
market opportunities, and the use of their resources to seize these opportunities
(Goldman, Nagel & Preiss, 1995). Teece, Peteraf and Leih (2016) described agility simply
as being flexible to change and the valuable capability or competence that firms have to
face uncertainty. If firms were able to predict the future, they would reconfigure their
resources in order to best compete, but as they cannot, Teece, Peteraf and Leih (2016)
argued that firms need to continuously reconfigure and transform themselves ahead of
their competitors to achieve a competitive advantage. Felipe, Roldán and Leal-Rodríguez
(2016), meanwhile, described organisational agility as the ability to sense environmental
changes and respond effectively and efficiently, which is a dynamic capability (Teece,
20
Peteraf & Leih, 2016). Understanding how OA as a dynamic capability can lead to
competitive advantage in a DT is thus relevant for this study.
Several authors have used the DC framework to view OA as a dynamic capability because
of the continuous need to reconfigure a firm’s resources and capabilities in responding to
external market changes (Chakravarty et al., 2013; Felipe et al., 2016; Teece, Peteraf &
Leih, 2016; Overby, Bharadwaj & Sambamurty, 2006; Sambamurthy, Bharadwaj, &
Grover, 2003). A DT that requires a firm’s resources and capabilities to be reconfigured
over time because of the changing environment, organisational agility can be described
as dynamic capability that describes how these resources and capabilities can be
combined over time to achieve competitive advantage through sensing and seizing
dynamic capabilities.
2.5.2 Organisational agility and digital transformation
The majority of the information systems (IS) literature on organisational agility in the last
two decades have focused on the information technology (IT) context, where the role of
IT in enabling organisational agility and firm performance were investigated
(Sambamurthy, Bharadwaj, & Grover, 2003; Overby, Bharadwaj & Sambamurty, 2006;
Sambamurthy, Lim, Lee, Lee, & Lim, 2007; Lu & Ramamurthy, 2011; Chakravarty et al.,
2013; Chen et al., 2014; Tallon et al., 2019). This followed the findings of Sambamurthy
et al. (2003), who indicated that IT plays a significant role in enabling agility and digital
options for firms, while also enabling entrenpreneural actions. These digital options, agility
and entrepreneural actions were seen by the authors as possible sources of achieving
competitive advantage.
The literature largely demonstrates the significance of IT in enabling agility (Chakravarty
et al., 2013; Y. Chen et al., 2014; Lee, Sambamurthy, Lim, & Wei, 2015; Overby et al.,
2006; Sambamurthy et al., 2003; 2007; Tallon, Queiroz, Coltman, & Sharma, 2019), but
also describes the moderating effect of the external environment’s dynamism and hostility
between agility and firm performance (Chakravarty et al., 2013; Y. Chen et al., 2014). In
DT, the context is different because it focuses on more than just the IT function, i.e. it
impacts across the entire organisation through the DT strategy and DBS (Vial, 2019;
Chanias, Myers, & Hess, 2019; Matt, Hess, & Benlian, 2015). Furthermore, both Vial
(2019) and Warner and Wäger (2019) identified agility as an important lever in both being

21
able to generate new value creation paths, as well as being an ongoing mechanism for
dynamic capabilities to renew an organisation’s strategy through DTs. Similarly Verhoef
et al. (2021) identified agility as a critical component for a successful DT. In addition, Vial
(2019) called for further research in order to understand digital transformations using
dynamic capabilities. The subconstructs of organisational agility will be discussed in the
next section.
2.5.3 Adaptive agility and entrepreneurial agility as a function of organisational
agility
Organisational agility in literature is a multi-dimensional construct which is largely
described as having both proactive and reactive components (Chakravarty et al., 2013;
Felipe et al., 2016; Overby et al., 2006; Sambamurthy et al., 2003; 2007). Chakravarty,
Grewal and Sambamurthy (2013) and Sambamurthy, Lim, Lee, Lee and Lim (2007)
described these components as entrepreneural agility (EA) and adaptive agility (AA).
Similarly Lu and Ramamurthy (2011) described two types of agility which they called
market capitalising agility and operational adjustment agility, which demonstrate overlap
and similar thinking around the multi-dimensional constructs of agility.
2.5.4 The use of entrepreneurial agility as opposed to adaptive agility as a construct
of organizational agility for digital transformations
In the context of DTs, which are prompting organisations to introduce radical fundamental
changes to their business strategies, business models, business processes, firm
capabilities, products and services, both types of organisational agility are discussed in
this context to understand their relevance for DT. The differences in both types of OA lies
in how an organisation responds to DT.
EA anticipates changes in the environment and responds by conducting strategic
experiments with new business models and approaches, in order to capitalise on first
mover advantage through radical changes (Sambamurthy et al., 2007). Within EA, a firm
foresees future scenarios, modifies its strategic position, modifies or changes existing
strategic assets and resources, and rapidly takes advantage of opportunities. EA captures
an organisational entrepreneurial mindset (Sambamurthy et al., 2007), which according to

22
Lee et al. (2015) and Teece, Peteraf and Leih (2016) is necessary for a firm to remain
competitive in dynamic environments, which is the case in DT. EA manifests as a dynamic
capability both in the ability to sense trends in the environment, as well as its ability to
reconfigure the organisation rapidly to take advantage of opportunities (Teece et al.,
2016). This can result in new products, new markets, new business models, acquiring new
assets, changing organisational structure and changing strategy to be able to capitalise
on market opportunities (Chakravarty et al., 2013; D. Teece et al., 2016) which may arise
through the DBS. This aligns with the dynamic capabilities which are required in DT to
proactively sense changes and reconfigure digital resources and capabilities to respond
to the environment in order to achieve a competitive advantage.
AA is adaptive to environmental changes in order to maintain its competitive position, by
keeping industry best practices and to manage threats and emerging business
opportunities. It focuses on recovering quickly from disruption without fundamentally
changing products or processes (Chakravarty et al., 2013; Sambamurthy et al., 2003).
This capability can result in firms institutionalising best practice methods which enable
them to preserve competitive advantage and market changes, but it is incremental in its
approach rather than radical (Sambamurthy et al., 2007). This leaves firms at risk where
the external disruption requires a fundamental change to business models, strategies,
products and processes (Teece et al., 2016). When considering the requirements for a
DT, AA is thus not suitable.
Further to the above argument, the results of Chakravarty et al.’s (2013) study within the
electronic market place which simulated a digital operating environment, that EA played a
much stronger role than AA on firm performance in this environment which was dynamic
and required fundamental organisational changes. In fact, AA was found to have no
significant relationship with firm performance. Similarly, Sambamurthy et al. (2007)
demonstrated in separate study that EA was found to be superior to AA in terms of a firm’s
competitive position for similar reasons. Therefore, in the context of DT which involves
fundamental changes to an organisation, EA was used in this study to understand its
impact on firm performance in DTs. The following definition of EA was used for this
research: EA is a dynamic capability in a DT that enables a firm to proactively sense
opportunities and reconfigure its internal resources and capabilities, which can include
assets, structure, strategy, and resources, to bring about fundamental changes in the firm

23
to capitalise on those opportunities (Chakravarty et al., 2013; Lu & Ramamurthy, 2011;
Sambamurthy et al., 2003).
2.6 Entrepreneurial agility and firm performance
The effect of entrepreneurial agility on firm performance has been established in
information systems (IS) literature (Chakravarty et al., 2013; Lu & Ramamurthy, 2011;
Sambamurthy et al., 2003; Tallon et al., 2019) as having a positive relationship with firm
performance. This is particularly true in changing environments (Liu, Song, & Cai, 2014)
as it is able to actively sense changes in the market and respond quickly to them.
Sambamurthy et al. (2007) indicated that EA has a positive relationship with a firm’s
competitive position but no significant relationship with profitability, because EA favours
rapid responses to innovative market opportunities rather than focusing on improving
internal efficiencies. There may cases where both efficiency and effectiveness can be
achieved through digital technologies however, such as the examples of Uber and Airbnb,
which are able to scale up and down rapidly with low marginal costs. Nevertheless, the
majority of this research focused on the capabilities of IT within an organisation
(Chakravarty et al., 2013; Sabherwal & Jeyaraj, 2015; Sambamurthy et al., 2007; Tallon
et al., 2019; Tippins & Sohi, 2003).
The adoption of digital technologies in DTs are much broader and more integrated into
the firm’s business strategy (DBS), i.e. they are not a functional IT strategy supporting the
business strategy (Bhadradwaj et al., 2013; Chakravarty et al., 2013; Sambamurthy et al.,
2003; Tallon et al., 2019). The role of EA in a DT could therefore have much more profound
effects on the organisation with the adoption of digital technologies. This is relevant
considering the wider impacts of integrating IT and business strategies (Bhadradwaj et al.,
2013) on the organisation. The effect of EA on firm performance within a DT has not been
empirically determined, however, with recent literature noting the importance of agility in
DTs (Verhoef et al., 2019; Vial, 2019; Warner & Wäger, 2019). A contribution to the body
of knowledge would thus be to determine the relationships between EA and firm
performance in a DT.
In summary, EA is a dynamic capability of a firm’s ability to sense market opportunities,
and to seize these opportunities by being able to fundamentally reconfigure the resources
and capabilities in the organisation in order to rapidly capitalise on opportunities (Teece,

24
Pisano, & Shuen, 1997; Teece et al., 2016). These digital resources and capabilities
created within a DT will be reconfigured through EA to bring about fundamental changes
to strategies, assets, positioning, and the business model. The speed, breadth and impact
of the changes required in a DT enable EA to be more effective in uncertain changing
environments created by DT, which may require fundamental changes to the firm (Teece
et al., 2016). The key features of EA are proactive sensing, speed of response, breadth
of response, as well as the ability to capitalise and realise the value from opportunities.
The benefits of EA will be discussed in the next sections in terms of supporting proactive
market strategies for firms, as well as the DBS, to achieve competitive advantage.
2.6.1 Entrepreneurial agility and proactive market strategies
The ability to sense market changes and trends in a proactive way has benefits for the
firm, as it creates superior knowledge of the market and customers ahead of competitors
which can provide a valuable, rare and hard to imitate resource (Barney, 1991). This can,
in turn, lead to competitive advantage and improved firm performance (Cegarra-Navarro,
Soto-Acosta, & Wensley, 2016; Chung, Liang, Peng, & Chen, 2010; Liu et al., 2014).
In the case of DT, where the superior knowledge of customers and opportunities can
differentiate firms from their competitors, this is an importance source of competitive
advantage (Chung et al., 2010). Similarly, having the ability to reconfigure resources to
rapidly respond to this superior knowledge and capitalise on opportunities is a source of
competitive advantage (Teece & Pisano, 1994). Having superior knowledge ahead of
competitors and the ability to rapidly reconfigure resources and strategies can enable firms
to have first mover advantages and apply prospector or analyser organisational strategies
in a DT because of their suitability for changing environments (Feng & Feng, 2020; Miles,
Snow, Meyer, & Coleman Jr., 1978; Zachary, Gianiodis, & Markman, 2015).
Miles et al. (1978) developed a strategic type framework which divides a firm’s approaches
to strategy into prospectors, defenders, analysers or reactors. Prospectors tend to
continuously seek new opportunities in the market rather than just focus on what is
existing; analysers try to balance finding new opportunities with managing their firm’s
existing portfolio; defenders focus on maintaining their position in the market within their
existing domain; and reactors have an inconsistent and unstable response to their
environment (Lee et al., 2015; Miles et al., 1978). Prospectors and analysers are similar

25
in that both proactively seek market opportunities, with analysers also maintaining and
strengthening their existing portfolio. Defenders and reactors do not explore new
opportunities and are vulnerable to environmental changes such as digital disruption. In
the context of integrating a business and IT strategy, research by Sabherwal and Chan
(2001) indicated a positive correlation to firm financial performance for prospectors and
analysers, but not for defenders and reactors. Prospectors and analysers, through their
proactive search for new opportunities, are able to respond to market changes better by
understanding customer trends and changes, and by developing new products or
services. This enables firms to capitalise on entering new markets or developing new
products ahead of their competitors, which would improve sales and market share through
being the first to market (Miles et al., 1978; Sabherwal & Chan, 2001). These strategies
can form part of the overall DBS, which can also highlight requirements for the DT strategy
to prevent firms from being forced into a defender/reactor strategy due to disruption
because they did not develop the required digital resources and capabilities in order to
compete in new digital markets (Bughin & van Zeebroeck, 2017).
EA may also impact firm performance in a DT, as described above, by enabling first or
second mover advantage, by being able to sense market opportunities ahead of the
competition, and by being able to rapidly respond to them. First mover advantage refers
to the phenomenon where the first or early firms to enter a new market are more likely to
achieve better performance in terms of market share or profitability than later entrants,
while second mover advantage occurs when firms learn from the pioneering firm and are
better prepared to enter new markets or products (Feng & Feng, 2020; Lieberman &
Montgomery, 1988). Early entrants can establish a customer base, earn loyalty, learn from
customers and impose buyer switching costs onto competitors who have to invest to gain
market share (Feng & Feng, 2020; Lieberman & Montgomery, 1988). In the case where
profits improve through first mover advantage, Lieberman and Montgomery (1988)
considered this to be due to superior entrepreneurial action from the firm, since in practice
entrepreneurial decisions can lead to success or failure and therefore carry an element of
risk.
According to a report by HBR Analytic Services (2014), which surveyed 672 firms in
business and technology on the adoption of digital technologies and their business
performance, firms that are “pioneers” or that use first mover advantage with digital
offerings are more likely to lead in revenue growth and market share than the lagging

26
firms. These results also indicated that firms that are more likely to make first mover
advantages are also more “digitally transformed”, particularly with regards to their core
strategy, business model and changes to products and services offered (HBR Analytic
Services, 2014). Similarly, the first mover advantage strategy can exist in the DBS of firms
(Sebastian et al., 2017) to enable competitive advantages, which can be enhanced
through EA.
2.6.2 Entrepreneurial agility and digital business strategies
Sebastian et al. (2017) indicated that firms with a DBS commonly adopt either a customer
engagement strategy or a digitised solutions strategy in order to improve customer
satisfaction and firm performance. Customer satisfaction can be measured by perceived
quality, perceived value and customer expectations (Mithas et al., 2016; Otto et al., 2020).
Similarly, several other authors indicated that the majority of firms are trying to improve
customer interactions and satisfaction through the use of digital technologies (Gurumurthy
et al., 2020; Kane et al., 2016, 2017; Westerman et al., 2014). The customer engagement
strategy focuses on building customer loyalty and trust, as well as enhanced customer
experiences, through the improved understanding of customers (Sebastian et al., 2017).
The digitised solutions strategy focuses on proactively developing products for customers
based on digitising existing products or developing new products for customers based on
their needs (Sebastian et al., 2017).
Both of these strategies can be enhanced by EA, firstly through proactive sensing of the
market to better understand customer needs and trends. This improves the perceived
quality and value of products and services provided to customers by anticipating their
needs, which leads to improved customer satisfaction, customer loyalty and trust (Otto et
al., 2020; Sebastian et al., 2017). This can improve firm performance in terms of sales and
market share (Edeling & Himme, 2018; Otto et al., 2020). A digitised solutions strategy
would be enhanced by EA because it enables a rapid response by developing new
products and/or services, or possibly even business models. This would improve the
speed and effectiveness of translating opportunities into financially viable solutions for
customers, which can improve sales, profitability, market share and ROI (Sebastian et al.,
2017).
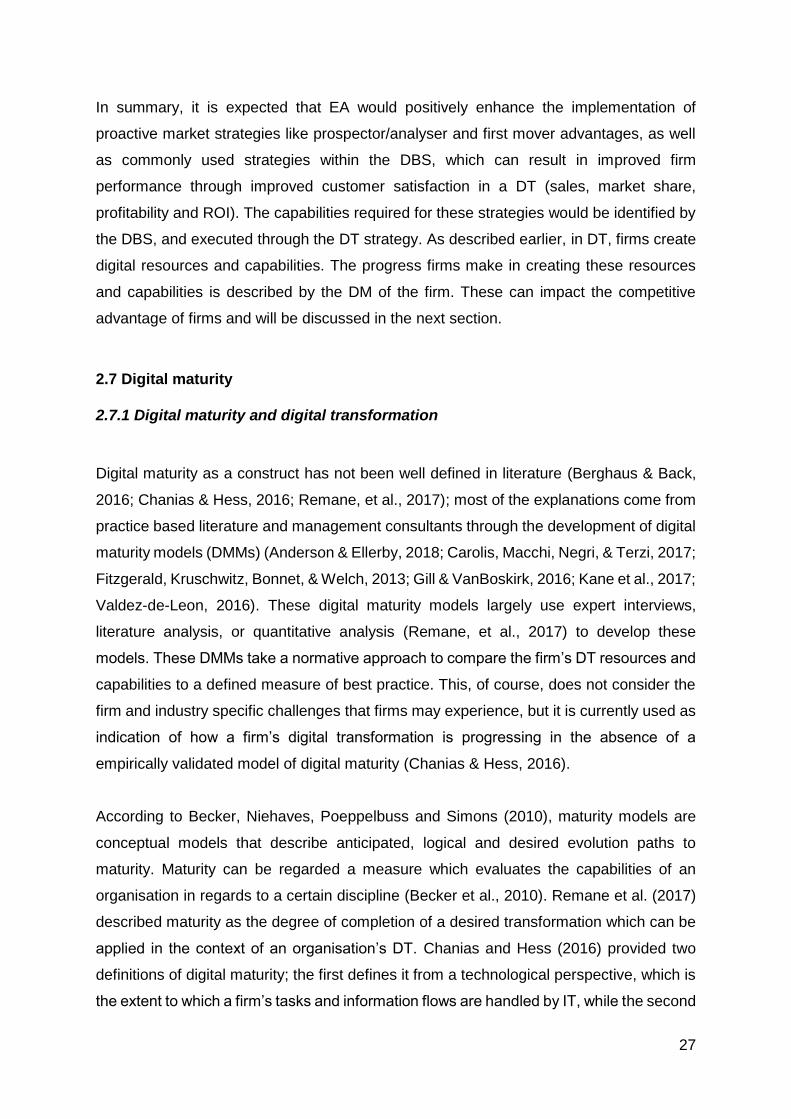
27
In summary, it is expected that EA would positively enhance the implementation of
proactive market strategies like prospector/analyser and first mover advantages, as well
as commonly used strategies within the DBS, which can result in improved firm
performance through improved customer satisfaction in a DT (sales, market share,
profitability and ROI). The capabilities required for these strategies would be identified by
the DBS, and executed through the DT strategy. As described earlier, in DT, firms create
digital resources and capabilities. The progress firms make in creating these resources
and capabilities is described by the DM of the firm. These can impact the competitive
advantage of firms and will be discussed in the next section.
2.7 Digital maturity
2.7.1 Digital maturity and digital transformation
Digital maturity as a construct has not been well defined in literature (Berghaus & Back,
2016; Chanias & Hess, 2016; Remane, et al., 2017); most of the explanations come from
practice based literature and management consultants through the development of digital
maturity models (DMMs) (Anderson & Ellerby, 2018; Carolis, Macchi, Negri, & Terzi, 2017;
Fitzgerald, Kruschwitz, Bonnet, & Welch, 2013; Gill & VanBoskirk, 2016; Kane et al., 2017;
Valdez-de-Leon, 2016). These digital maturity models largely use expert interviews,
literature analysis, or quantitative analysis (Remane, et al., 2017) to develop these
models. These DMMs take a normative approach to compare the firm’s DT resources and
capabilities to a defined measure of best practice. This, of course, does not consider the
firm and industry specific challenges that firms may experience, but it is currently used as
indication of how a firm’s digital transformation is progressing in the absence of a
empirically validated model of digital maturity (Chanias & Hess, 2016).
According to Becker, Niehaves, Poeppelbuss and Simons (2010), maturity models are
conceptual models that describe anticipated, logical and desired evolution paths to
maturity. Maturity can be regarded a measure which evaluates the capabilities of an
organisation in regards to a certain discipline (Becker et al., 2010). Remane et al. (2017)
described maturity as the degree of completion of a desired transformation which can be
applied in the context of an organisation’s DT. Chanias and Hess (2016) provided two
definitions of digital maturity; the first defines it from a technological perspective, which is
the extent to which a firm’s tasks and information flows are handled by IT, while the second

28
definition is from a management perspective, which is the status in an organisation’s DT,
or how much progress the firm has made in digitally transforming. The DT process occurs
when an organisation develops digital resources and capabilities guided by the DT
strategy. Based on the above, the following definition of DM is proposed in the context of
this study: DM is the firm’s progress in developing digital resources and capabilities in a
DT, as an outcome of the DT strategy.
Some of the shortcomings of the DMM approach include viewing the digital maturity as a
linear process; this assumes that all industries follow the same path, from low maturity to
high maturity, which is seen as an oversimplification (Remane et al., 2017). Empirical work
in IS research in industries such as healthcare, automotive, newspaper, photography and
commercial printing, indicate that digtal transformations depend on context and can have
their own digital maturity paths, which may be non-linear (Remane, Hanelt, Wiesboeck, &
Lutz, 2017). Similarly, research has also indicated internal and external barriers to digital
transformation paths in some asset intensitive industries like mining and manufacturing,
which can hinder digital maturity (Gao, Hakanen, Töytäri, & Rajala, 2019; Vogelsang,
Liere-netheler, & Packmohr, 2019). Furthermore, digital transformation and digital maturity
have a moving target, because as digital technologies advance, so the requirements for
digital maturity and DTs change (Chanias et al., 2019; Remane et al., 2017).
2.7.2 Digital technology, digital culture, digital organisational structure and digital
insights as a function of digital maturity
Digital maturity as a construct has not been well defined in literature (Berghaus & Back,
2016; Chanias & Hess, 2016; Remane, et al., 2017), however there are several themes
which are consistent in the way digital maturity is measured across DMM (Anderson &
Ellerby, 2018; Berghaus & Back, 2016; Carolis et al., 2017; Gill & VanBoskirk, 2016;
Valdez-de-Leon, 2016). These include the use of digital technology, digital organisational
culture, digital organisational structure and digital insights. Digital technology measures
the level of adoption of digital technologies in an organisation, while digital culture refers
to the extent to which an organisation’s behaviour has been adapted and changed to be
supportive of the DBS. Digital organisational structure, meanwhile, refers to the structure
of the organisation and how resources are configured to support the DBS. Finally, digital
insights refer to the use of customer insights in decision making, as well as feedback of
information incorporating lessons learned, for continuous improvement in the DT. These

29
common themes were used to measure digital maturity in this study, as adapted from the
DMM provided by Gill and Van Boskirk (2016).
The digital technology measure is a logical inclusion in the measure of digital maturity
because the adoption of digital technologies is driving DTs (Chanias & Hess, 2016; Hess
et al., 2016; Matt et al., 2015; Vial, 2019). This includes the extent of adoption of various
digital technologies within the firm. According to the RBV, digital technologies are
considered to be a resource of the firm because they can be considered to be physical
assets (Barney, 1991). These digital technologies are not unique to the firm and can be
imitated by others, hence it is not the digital technologies alone that impact DT (Kane et
al., 2016; Westerman & Davenport, 2018). It is therefore the knowledge of how to use
these digital technologies and how well they are adopted within the organisation that
create digital capabilities, which are important in that they can create economic value that
is difficult to imitate, which provides a competitive advantage. The digital technology
construct thus describes the types of digital technologies used, which are resources, the
level of adoption into their DBS, and the capabilities a firm develops in order to generate
value from these.
Digital culture is also considered to be critically important in the large scale change
processes associated with DTs (Anderson & Ellerby, 2018; Chanias et al., 2019; Dremel
et al., 2017; Fitzgerald et al., 2013; Kane et al., 2016; Teece et al., 2016; Vial, 2019).
Culture in an organisation can generally be defined as a set of unconscious basic
assumptions within a group based on its history of solving external and internal problems
(Schein, 1992), which is typically difficult to change. In the RBV of the firm, this is
considered an organisational resource that can leveraged for competitive advantage. For
DT, there is a preferred “digital culture” which fosters collaboration between employees
across functions, is innovation focused, is willing to take risks and experiment, is
aspirational, and is developed within the DT process (Chanias et al., 2019; Dremel et al.,
2017; Kane et al., 2016; Vial, 2019). For this reason, although culture is considered a
resource and is generally difficult to change (Schein, 1992; Warner & Wäger, 2019), digital
culture can be considered to be a set of strategic capabilities that an organisation needs
to develop as part of its DT strategy (Kane & Kiron, 2015), which is configured over time
with the long term strategic vision of changing the organisation’s culture (Warner & Wäger,
2019). Culture can hinder DT progress or the implementation of changes due to politics,
inertia or resistance to change within the organisation, thus the supportive role of

30
leadership is considered important in driving change efforts from the top down (Chanias
et al., 2019; Teece et al., 2016; Vial, 2019; Warner & Wäger, 2019). Organisations have
appointed change leaders, as well as Chief Digital Officers, to manage the DT process,
and in some cases the CEOs themselves take this role (Chanias et al., 2019; Hauari,
2020; Mckinstry, 2019; Singh & Hess, 2017; Vial, 2019). An element of creating a digital
culture can also include digital training and the talent development of employees, or some
rely on the skills of external contractors. More digitally mature companies invest in
equipping and developing these skills and knowledge internally (Kane et al., 2016).
The digital organisational structure measure is an indication of the organisational
structural changes required during DTs. Similarly, organisational structure can be
considered a capability of the firm which describes how activities, processes and human
resources are organised, which can be configured for competitive advantage (Barney,
1991). The digital organisational structure is the set of capabilities the organisation needs
to develop in order to be agile enough to operate and respond to changes required within
the DT process. These work on experimenting and integrating digital opportunities across
various business functions (Chanias et al., 2019; Vial, 2019; Verhoef et al., 2019). An
example of this is Audi, which has a dedicated data analytics team that operates outside
line management. The team is focused purely on its digital initiatives, which are integrated
with other functions to provide products and solutions (Dremel et al., 2017).
Dedicated teams are created to ensure independence from organisational politics and
resistance to change to support the long term sustainability of their DT efforts. Having the
right digital skills is important for work execution, and the digital organisational structure
may also be adapted to include the use of external consultants to help navigate the DT
process as they bring valuable expertise and experience (Chanias et al., 2019). Similarly,
the role of the Chief Digital Officer (CDO) has been introduced within the C-suite structure
to help the CEO manage DTs (Singh & Hess, 2017). Furthermore, a structure which is
less hierarchical to facilitate top down and bottom up engagement, as well as the
generation of ideas from employees, is preferred (Chanias et al., 2019; Kane et al., 2016,
2017). Some organisations also incorporate the use of dedicated management
committees, which adjudicate on and manage the flow of ideas into commercially ready
products through innovation processes (Chanias et al., 2019).

31
Digital insights refer to capturing customer insights and incorporating changes, continuous
feedback and learning processes through the DT process, which shapes all the other
components, including digital technology, digital culture, digital organisational structure,
and developing knowledge management processes (Chanias et al., 2019; Chung et al.,
2010; Kane et al., 2016; 2017). Hence digital insights can be defined as being able to
capture knowledge both internally and externally in a DT, and continuously learning and
acting on this within the organisation (Chanias et al., 2019; Chung et al., 2010; Gill & Van
Boskirk, 2016). Knowledge within an organisation, according to the RBV, is considered to
be a resource, which can be configured for competitive advantage if is valuable, unique
and difficult to imitate (Barney, 1991). Internally, this refers to learning from experimenting
on new products or services which feeds back into strategy, processes and products
(Chanias et al., 2019; Chung et al., 2010; Kane et al., 2016, 2017). Externally, this includes
capturing knowledge about customer needs and interacting with customers, which
generates data that can be used to better design products and services (Sebastian et al.,
2017). Digital technologies have been able to enhance this ability by enabling the
measurement of customer trends and preferences, which have been leveraged by digital
firms such as Amazon, Facebook, Netflix, and Google through the use social media
platforms, data captured on their platforms, machine learning and big data analytics, all of
which can improve firm performance (Vial, 2019; Wamba et al., 2017). This is providing
competitive advantages for these firms as they can better understand their own needs as
well as those of their customers. As such, their growth has been exponential over the last
few years (Verhoef et al., 2019).
2.8 The relationship between digital maturity and firm performance
This application of the digital maturity models in global executive surveys has shown that
there is a positive relationship between a firm’s digital maturity and its firm performance in
terms of sales, market share, profitability and return on investment. (Fitzgerald et al., 2013;
Gurumurthy et al., 2020). An alternative approach by Eremina, Lace and Bistrova (2019)
measured the financial performance of a sample of Baltic firms by analysing their financial
reports for key words, which was translated into a digital maturity score. This was
measured and compared against the reported corporate financial performance over time,
which indicated a positive relationship between the firm’s digital maturity scores and
financial performance across the dimensions of sales, market share, profit, and ROI. This
improved performance was attributed to a higher level of digital resources and capabilities.

32
The adoption and use of digital technologies such as cloud services increases efficiencies
(Dremel et al., 2017; Gurumurthy et al., 2020; Vial, 2019), while improved customer
interactions and engagements through the use of digital technologies also results in
improved customer experience (Anderson & Ellerby, 2018; Fitzgerald et al., 2013; Kane
et al., 2016; 2017). In turn, improved customer experience and engagement increases
customer satisfaction and loyalty (Gurumurthy et al., 2020; Kane et al., 2016; Sebastian
et al., 2017), which grows overall firm performance. A key observation by Kane et al.
(2016) is that DT is not only enhanced by the adoption of digital technologies, but also
through broader digital resources and capabilities such as digital culture, digital
organisational structure and integrating digital insights.
The link between customer satisfaction and firm performance has further been shown to
improve firm performance in terms of sales and market share (Otto et al., 2020), as well
as increasing customer lifetime value through customer loyalty (Gurumurthy et al., 2020).
In terms of digital technology, Mithas et al. (2016) demonstrated a positive link between
IT, customer satisfaction and firm performance. Similarly, more digitally mature firms have
stronger digital cultures which are more collaborative, integrated and innovation focused,
which enable the creation of new products and services, resulting in improved sales and
revenues as well as improved quality (Gurumurthy et al., 2020; Kane et al., 2016, 2017;
Sebastian et al., 2017). Furthermore, stronger leadership support from executive
leadership were a feature of more digitally mature and successful firms (Chanias et al.,
2019; Hauari, 2020; Mckinstry, 2019; Singh & Hess, 2017). The digital organisational
structures of more mature firms focus on developing in-house talent and digital skills by
investing in their own employees as opposed to external consultants. This improves
employee engagement (Gurumurthy et al., 2020) and provides the skills required for
developing new innovative products and services. The digital organisational structures
have the flexibility to respond to market needs quickly (Teece et al., 2016), support
innovation, and integrate with other functions to develop new products and services
(Dremel et al., 2017).
In summary, DM correlates with improved firm performance, which has been confirmed in
literature (Anderson & Ellerby, 2018; Eremina et al., 2019; B. M. Fitzgerald et al., 2013;
Gurumurthy et al., 2020; Kane et al., 2017; Westerman & Mcafee, 2012). The effect of DM
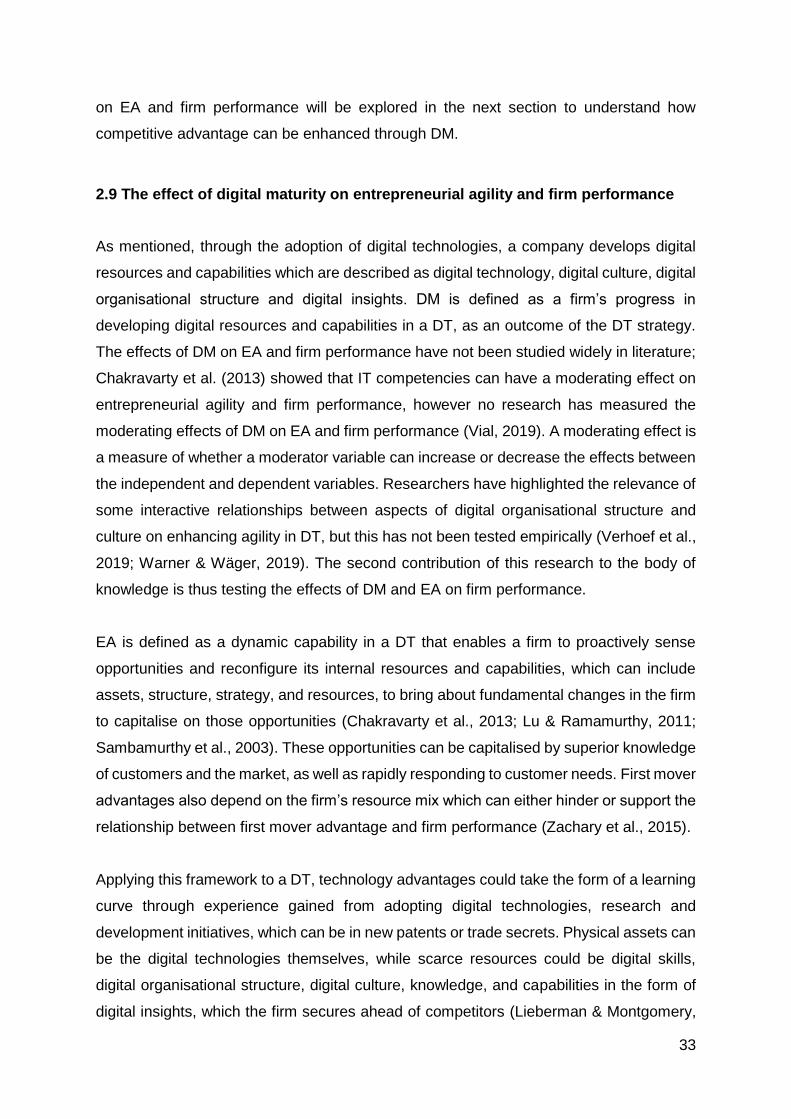
33
on EA and firm performance will be explored in the next section to understand how
competitive advantage can be enhanced through DM.
2.9 The effect of digital maturity on entrepreneurial agility and firm performance
As mentioned, through the adoption of digital technologies, a company develops digital
resources and capabilities which are described as digital technology, digital culture, digital
organisational structure and digital insights. DM is defined as a firm’s progress in
developing digital resources and capabilities in a DT, as an outcome of the DT strategy.
The effects of DM on EA and firm performance have not been studied widely in literature;
Chakravarty et al. (2013) showed that IT competencies can have a moderating effect on
entrepreneurial agility and firm performance, however no research has measured the
moderating effects of DM on EA and firm performance (Vial, 2019). A moderating effect is
a measure of whether a moderator variable can increase or decrease the effects between
the independent and dependent variables. Researchers have highlighted the relevance of
some interactive relationships between aspects of digital organisational structure and
culture on enhancing agility in DT, but this has not been tested empirically (Verhoef et al.,
2019; Warner & Wäger, 2019). The second contribution of this research to the body of
knowledge is thus testing the effects of DM and EA on firm performance.
EA is defined as a dynamic capability in a DT that enables a firm to proactively sense
opportunities and reconfigure its internal resources and capabilities, which can include
assets, structure, strategy, and resources, to bring about fundamental changes in the firm
to capitalise on those opportunities (Chakravarty et al., 2013; Lu & Ramamurthy, 2011;
Sambamurthy et al., 2003). These opportunities can be capitalised by superior knowledge
of customers and the market, as well as rapidly responding to customer needs. First mover
advantages also depend on the firm’s resource mix which can either hinder or support the
relationship between first mover advantage and firm performance (Zachary et al., 2015).
Applying this framework to a DT, technology advantages could take the form of a learning
curve through experience gained from adopting digital technologies, research and
development initiatives, which can be in new patents or trade secrets. Physical assets can
be the digital technologies themselves, while scarce resources could be digital skills,
digital organisational structure, digital culture, knowledge, and capabilities in the form of
digital insights, which the firm secures ahead of competitors (Lieberman & Montgomery,

34
1988; Zachary et al., 2015) to provide economic rents in the future. These are the current
economic rents the digital behemoths like Amazon, Google, and Facebook are enjoying.
Hence, as a firm increases its DM, its digital resources and capabilities can be expected
to be superior, which according to the above argument can be expected to enhance EA.
A positive moderating effect of DM on EA and firm performance was thus expected in this
study.
Teece (2007) and Warner and Wäger (2019) indicated that legacy-related organisational
inertia, where innovation investment decisions are being managed through corporate
finance, particularly with investments in products with uncertain outcomes as may be the
case in DT, may hinder investments and create resistances to change. This is quite
relevant for DT, as transforming organisations are largely traditional, i.e. their traditional
methods of determining investment decisions and their fear of cannibalising existing
traditional products may hinder them from making bold investments (Bughin & van
Zeebroeck, 2017; Warner & Wäger, 2019) in favour of incremental, smaller changes.
Warner and Wäger, (2019) identified change resistance, high levels of hierarchy and rigid
strategic planning as barriers to dynamic capabilities in DTs. In addition, Gao, Hakanen,
Töytäri and Rajala (2019) and Vogelsang, Liere-netheler and Packmohr (2019) indicated
that firms in specific asset-intensive industries like mining and manufacturing may have
industry specific barriers to investing in digital technologies, due to industry level skills
shortages; legacy cultures and legacy technologies; and legislative restrictions such as
employment, safety and health laws. These exogenous factors may influence the DT of
these firms, thereby impacting the effects of DM on EA and firm performance due to both
industry and organisational level factors. These factors are acknowledged but were
beyond the scope of this study.
The next section describes the effects of each of the subconstructs – digital technology,
digital culture, digital organisational structure and digital insights – on the relationship
between EA and firm performance.
2.9.1 The effect of digital technology on entrepreneurial agility and firm
performance
Porter and Heppelmann (2015) described how the use of smart connected devices can
improve how a firm communicates with its customers and senses, monitors and analyses

35
data. Digital technologies can impact the capabilities of firms to sense and interpret market
data by connecting with customers via software like customer relationship management
(CRM), social media platforms, big data analytics, machine learning and smart connected
devices (Porter & Heppelmann, 2015; Vial, 2019). More digitally mature organisations can
be expected to be more advanced with their adoption of digital technologies (HBR Analytic
Services, 2014; Kane & Kiron, 2015; Kane et al., 2016; 2017). An example of a digital
technology capability that is generating superior insights, both externally in terms of
customers and markets as well as internally in terms of a firm’s processes, is big data
analytics, which is the ability to process high volumes of unstructured (non-numerical) and
structured (numerical) data. This is creating value across several different industries
(Acharya, Singh, Pereira, & Singh, 2018; Chen & Zhang, 2014; Chen, Preston, & Swink,
2015; Dremel et al., 2017; Rehman, Chang, Batool, & Wah, 2016; Simchi-Levi & Wu,
2018; Vial, 2019; Wamba et al., 2017). Higher digital technology maturity in a firm results
in a stronger relationship between EA and firm performance, because it enhances the
sensing capabilities of EA. This enables firms to make better decisions than their
competitors because of superior knowledge (Chung et al., 2010), which can be expected
to enhance firm performance.
Similarly, a higher adoption of digital technologies can provide more advanced digital
infrastructures such as digital platforms and cloud computing, which can be used to
speedily develop new products and services through rapid prototyping and innovation
processes (Chanias et al., 2019; Sebastian et al., 2017) . The use of more advanced digital
technologies may be a feature of more digitally mature firms, especially those with a
greater understanding of the network effects that these technologies bring with regards to
synergies between the technologies themselves (Verhoef et al., 2019). The HBR Analytic
Services (2014) report indicated that the level of digital technology adoption may impact
whether a firm uses a first mover strategy. The results indicated that firms that are the
most likely to use first mover strategies are those that have the highest adoption of digital
technologies. These firms benefited the most from their first mover advantages, with
increases in their revenues and market share. A positive moderating effect between digital
technology on EA and firm performance can therefore be expected.
An additional finding was that the majority of firms that capitalised on their first mover
advantage and transformed their business models were largely in the technology industry,
and less so in financial services, manufacturing and the public sector. The technology

36
industry was also the most “digitally transformed” in terms of business model changes. In
addition, there were trends with the industry types where the majority of technology firms
were in the pioneer category, while financial services were followers, and the least likely
industry to be pioneers was the public sector (HBR Analytic Services, 2014). This indicates
that the industry type and industry digital maturity level may play a role in influencing the
EA and firm performance relationship.
2.9.2 The effect of digital insights on entrepreneurial agility and firm performance
Digital insights can offer enhancements to the end user experience; allow for the
customisation of product features; and capture trends on usage, reliability, customer
preferences and feedback, which provide insights to the firm as well as its partners and
customers (Dremel et al., 2017; Porter & Heppelmann, 2015). These insights can present
and interpret market opportunities for firms to capitalise on, which can enhance the
sensing capability of EA in terms of being able to determine what improvements/changes
should be made to products or services, the business model, and the digital organisational
structure. These digital insights can be used to provide more efficient and effective
products and services, which create a competitive advantage (Anderson & Ellerby, 2018;
Gurumurthy et al., 2020; Sebastian et al., 2017). The improved sensing capabilities,
feedback of digital insights and learning back into the organisation also adjust a firm’s DT
strategy, which can enhance other capabilities such as digital technologies, digital cultural
changes, and digital structural changes (Chanias et al., 2019). This ability to accurately
sense the environment would thus be enhanced by digital insights, which can be expected
to enhance EA which relies on sensing and interpreting the environment. Overall, this
would increase the customers’ perception of the quality of the firm by producing products
and services aligned to their needs. This, in turn, will improve loyalty, trust and share of
customers’ wallet, customer satisfaction and firm performance (Otto et al., 2020). The
expectation is thus for digital insights to have positive moderating effects on EA.
2.9.3 The effect of digital culture on entrepreneurial agility and firm performance
Digital culture depends on the levels of collaboration between employees across
functions, innovation focus, willingness to take risks and experiment, training and
development of talent, and leadership support (Chanias et al., 2019; Dremel et al., 2017;
Kane et al., 2016; Vial, 2019). These attributes will enable a digital culture that is suitable

37
for a changing environment like that of a DT (Warner & Wäger, 2019). EA can thus be
enhanced by this culture in terms of being able to reconfigure the human resources in the
firm to execute the changes required. Trained and competent employees and a
collaborative workforce can be expected to execute better (Chanias et al., 2019;
Gurumurthy et al., 2020; Kane et al., 2017; Vial, 2019) through innovation processes like
rapid prototyping to create new products or services. Recent research (Cai, Huang, Liu, &
Wang, 2018) found that the use of social media platforms like Slack has had psychological
benefits for teams that support agility by being proactive, adaptable and resilient. Digital
culture can therefore enhance the seizing aspect of EA in terms of being able to
reconfigure human resources and capabilities, as well as rapidly respond to opportunities.
This ability to respond quickly will result in faster responses to opportunities sensed in a
DT, which can result in improved customer satisfaction (Chen, Preston, & Swink, 2015;
Feng & Feng, 2020).
Similarly, leadership support from the C-suite can help the firm to overcome organisational
politics (Vial, 2019; Warner & Wäger, 2019), which is due to the organisation’s legacy
processes (Chanias, et al., 2019). In order to further support digital transformative
changes, organisations may appoint change leaders to manage the DT process. In some
cases the CEOs themselves take on this role, particularly to address organisational inertia
and to enable sustainable change efforts (Chanias et al., 2019; Hauari, 2020; Mckinstry,
2019; Singh & Hess, 2017; Vial, 2019). The ability to reconfigure resources and
capabilities and rapidly respond to changes within the firm can therefore be expected to
improve with an augmented digital culture, which can be expected to enhance the seizing
component of the EA and firm performance relationship. It is expected that a deeper digital
culture will enable more rapid EA responses compared to when digital culture is lower,
which will result in a positively moderating effect on EA and firm performance across sales,
market share, profit and ROI.
2.9.4 The effect of digital organisational structure on entrepreneurial agility and firm
performance
In DTs, the digital organisational structure should enable the organisation to be agile
enough to operate and respond to the changes required within the DT process that work
on experimenting and integrating digital opportunities across various functions (Chanias
et al., 2019; Verhoef et al., 2019; Vial, 2019; Warner & Wäger, 2019). This structure can

38
have dedicated DT teams, less hierarchical structures, C-suite Chief Digital Officers,
upskilled and trained internal teams, and/or external consultants (Chanias et al., 2019;
Kane et al., 2016; Singh & Hess, 2017; Vial, 2019). This structure enables the team to
respond to new opportunities quickly, and can also enhance the reconfiguration of
resources within the firm in terms of being able to experiment and develop prototypes,
adopt new digital technologies, improve engagement between senior management and
employees, and create dedicated innovation management committees to drive ideas from
inception into commercial products (Chanias et al., 2019; Dremel et al., 2017). More
mature digital organisational structures can thus be expected to enhance EA by improving
their responses to opportunities. This, in turn, can enable quicker turnaround on
opportunities ahead of the competition and enhance firm performance.
2.10 Conclusion
This literature review explored the multi-level impacts of the phenomenon digital
transformation, as well as the reasons for it and its purpose. The rapid development and
capabilities of these digital technologies in recent years was discussed, as was the
strategic role of IT shifting from supporting the business strategy to integrating with it
through what is termed digital business strategy. DT creates digital resources and
capabilities within in a firm, the process of which is co-ordinated and managed through a
DT strategy.
The literature identified organisational agility as an important aspect for digital
transformation, but the majority of the literature on this topic is based on the role of IT as
an antecedent of organisational agility and positive relationships with firm performance.
This study aimed to extend the knowledge regarding the relationship between the OA and
firm performance in the context of digital transformations, using the proactive component
of OA, i.e. entrepreneurial agility, using the RBV and DCF theories. The role of EA in
supporting proactive firm strategies, such as prospector/analyser and first mover
advantages and their associated benefits, were discussed in the context of DT. Similarly,
the role of EA in supporting commonly used DBS such as customer engagement and
digital solutions strategies, as described by Sebastian et al. (2017), was discussed. It was
hypothesised that EA will have a positive relationship with firm performance in DT.

39
The literature review further discussed the concept of digital maturity models and the
construct digital maturity. Digital maturity was defined in this study as a firm’s progress in
developing digital resources and capabilities in a DT, as an outcome of the DT strategy.
Digital maturity was viewed as not having a linear path due to the impact of contextual
factors like industry type, which influence how firms progress through a DT. Digital maturity
was concluded in the literature review to have a positive relationship with firm
performance.
Lastly, the literature review explored the moderating effects between these digital
resources and capabilities, which are measured in the organisation through digital
maturity, as well as how these interact with entrepreneurial agility and firm performance
as the organisation increases its digital maturity. These digital resources and capabilities
were described as digital technologies, digital culture, digital organisational culture and
digital insights. These were hypothesised to positively enhance the effects of EA and firm
performance as digital maturity increases. Other industry specific factors and barriers
were identified as possible inhibitors of these effects, which were beyond the scope of this
study.

40
Chapter 3: Research questions and hypotheses
DT is defined as the process of the adoption of digital technologies across an organisation,
which fundamentally transforms its business strategy, business processes, firm
capabilities, products and services, with the aim of achieving a competitive advantage
(Bhadradwaj et al., 2013; Hess, Benlian, Matt, & Wiesböck, 2016; Matt et al., 2015; Vial,
2019). The RBV (Wernerfelt, 1984; Barney, 1991) and the DCF (Teece & Pisano, 1994;
Teece et al., 2016) were used in this study as appropriate theoretical lenses to understand
the DT phenomenon. The following research questions and hypotheses were identified
through the literature review.
Research question 1:
What is the relationship between entrepreneurial agility and firm performance for firms
undergoing DT?
Based on the review of literature on organisational agility (Sambamurthy, Bharadwaj, &
Grover, 2003; Overby, Bharadwaj & Sambamurty, 2006; Sambamurthy, Lim, Lee, Lee, &
Lim, 2007; Lu & Ramamurthy, 2011; Chakravarty et al., 2013; Chen et al., 2014; Tallon et
al., 2019) and the defintion of DT, EA as a subconstruct of OA was identified as more
applicable for a DT in understanding how improved firm performance could be achieved.
EA is defined as a dynamic capability in a DT that enables a firm to proactively sense
opportunities and reconfigure its internal resources, which can include assets, structure,
strategy and resources, to bring about fundamental changes in the firm to capitalise on
those opportunities (Chakravarty et al., 2013; Lu & Ramamurthy, 2011; Sambamurthy et
al., 2003). EA enabled by IT has been shown to improve firm performance through a
functional IT strategy (Chakravarty et al., 2013; Sambamurthy et al., 2007), but its effect
on firm performance has not yet been measured empirically in a DT under a DBS. The
possible benefits of EA were discussed relative to proactive market strategies, such as
first mover advantage and prospector/analyser strategies, as well as the commonly used
digital business strategies to improve firm performance in DTs (HBR Analytic Services,
2014; Miles et al., 1978; Sebastian et al., 2017; Zachary et al., 2015). A positive
relationship between EA and firm performance was hypothesized by the researcher; this
study tested the relationship through the following hypotheses:

41
Hypotheses
H10: EA has a positive relationship with firm performance
H1A: EA does not have a positive relationship with firm performance
Research question 2:
What is the effect of digital maturity on the relationship between EA and firm performance
for firms undergoing DT?
DM can be a defined as a firm’s progress in developing digital resources and capabilities
in a DT, as an outcome of the DT strategy (Becker et al., 2010; Chanias & Hess, 2016;
Remane, et al., 2017). According to the literature (Anderson & Ellerby, 2018; Cai et al.,
2018; Chanias et al., 2019; Gurumurthy et al., 2020; HBR Analytic Services, 2014; Kane
et al., 2016, 2017; Verhoef et al., 2019; Vial, 2019;). It was also hypothesised by the
researcher that increased digital maturity may positively moderate the effect of EA on firm
performance in a DT.
Hypotheses:
H20: Digital maturity has a positive moderating effect on the relationship between EA and
firm performance
H2A: Digital maturity does not have a positive moderating effect on the relationship
between EA and firm performance
Research question 3:
What is the relationship between DM and firm performance for firms that have commenced
with DT initiatives?
The positive relationship between digital maturity and firm performance has been
established in the literature (Fitzgerald et al., 2013; Gurumurthy et al., 2020; Eremina,
Lace, & Bistrova, 2020; Anderson & Ellerby, 2018; Kane et al., 2016; 2017).

42
Chapter 4: Research methodology
4.1 Introduction
The purpose of this research was to understand the effect of digital maturity on
entrepreneurial agility and firm performance for firms that have commenced with digital
transformation initiatives. The research methodology describes the approach and
methods the researcher took in order to achieve the research objectives, which were
founded on the research philosophy.
The purpose of this section is to describe the research design and philosophy used by the
researcher in order to address the research objectives. This includes the choice of
methodology and its alignment with the researcher’s personal beliefs and assumptions of
the world; the unit of analysis in which the phenomena in this study occurs; the population,
sample size and sampling methods utilised to obtain the necessary data; the
measurement instrument used; the data gathering methods and analysis approach taken;
the quality controls; and the limitations of the research methods used.
4.2 Research philosophy
The philosophy used by the researcher in this study was positivism. This philosophy takes
a scientific view of social realities and uses data to objectively describe phenomena
(Saunders & Lewis, 2018; Wamba et al., 2017). This aligns with the researcher’s personal
philosophy of the world, which takes a scientific lens to objectively describe cause and
effect relationships due to the researcher’s engineering background. This is important
because it reveals the personal beliefs and assumptions made by the researcher in
developing knowledge, and because it shaped the researcher’s approach, his methods of
conducting the research, and how he interpreted the results. The positivistic philosophy is
indicative of the research methods being more quantitative in nature, which resulted in
findings that are more objective and generalizable (Delice, 2001). In this way, the
philosophy of the research and the personal philosophy of the researcher are aligned in
this study. This philosophy also aligns with the approach taken by other authors such as
Wamba et al. (2017), Mhlungu, Chen and Alkema (2019) and Chakravarty et al. (2013),
who had similar research questions. This researcher aimed to understand the

43
relationships of the constructs – entrepreneurial agility, digital maturity and firm
performance – in the phenomenon digital transformation in an objective and quantifiable
way in order for the findings to be replicated and generalizable.
4.3 Approach to theory development
In this study, the phenomenon ‘digital transformation’ was investigated, based on the
deductive review of literature set out in Chapter 2. Zikmund et al. (2010) defined deductive
reasoning as the logical process of developing a conclusion about a specific issue based
on something known to be true. A deductive review of literature led to the following
research questions based on what is currently known (Agresti & Franklin, 2007) to answer
research questions about what is unknown in measurable way. This approach was also
used by Wamba et al. (2017) and Chakravarty et al. (2013).
4.4 Research methodology
The research methodology used in this study was quantitative because it asserts and
assumes that the constructs within the phenomenon, digital transformation, can be
measured objectively with quantifiable data (Wamba et al., 2017). Zikmund, Babin, Carr,
and Griffin (2010) defined quantitative research as that which addresses the research
objectives by using empirical assessments which involve both numerical measurement
and analysis approaches. Similarly, the research questions required that the relationships
between the constructs entrepreneurial agility, digital maturity and firm performance be
quantified. Quantitative research was thus more suited to this study than qualitative,
because it uses numerical data to objectively measure relationships. This research study
is also descriptive in that it describes what the relationships are between the constructs,
and quantifies these (Zikmund et al., 2010; Sanders & Lewis, 2012).
A mono method was used to conduct the study as a single method had been sufficient to
answer similar research questions in previous studies (Wamba et al., 2017; Chakravarty
et al., 2013; Cegarra-Navarro, Soto-Acosta, & Wensley, 2016). A structured survey
questionnaire was considered best suited to this quantitative research as questionnaires
are objective, can be measured (Saunders & Lewis, 2018), and provide generalisable
results (Wamba et al., 2017). A structured survey questionnaire was administered online

44
for this study, similar to the approach taken by Wamba et al. (2017) and Mhlungu, Chen
and Alkema (2019).
The survey questionnaire was administered online via Google forms, i.e. it was an internet-
based questionnaire. The benefits of internet-based questionnaires are that they are
generally low cost, data entry is simple, and they provide format flexibility compared to
paper questionnaires (Saunders & Lewis, 2018; Granello & Wheaton, 2004). The
drawbacks of online questionnaires are difficulty in assessing the sampled population, a
lack of access to respondents’ details, and low response rates (Wright, 2005). A self-
completed questionnaire was used in this study because it is less intrusive and allows for
more respondent privacy. It also supported objectivity by eliminating the influence of
interviewer bias or variance, which can affect the responses of the interviewees (De
Leeuw, 2008). Other researchers in the same field have used self-completed
questionnaires (Mhlungu et al., 2019; Wamba et al., 2017). The negative consequences
of self-completed questionnaires is that the researcher has no control over the response
time to complete the surveys, nor can they clarify any ambiguities or lack of understanding
of the questions by the respondents, which could lead to response errors (Zikmund, Babin,
Carr, & Griffin, 2010). Low response rates were experienced in this research, which will
be discussed later.
The time horizon was cross-sectional, which is defined as a study of a subject at a moment
in time (Saunders & Lewis, 2018). This approach, which has been used by other
researchers in the field (Chakravarty et al., 2013; Mhlungu et al., 2019; Nwankpa &
Roumani, 2016; Wamba et al., 2017), was selected largely because the research
questions can be answered with a time horizon, which was necessary due to time
constraints. The limitation of a cross-sectional research design is that the findings may
change over time, however.
4.5 Population and sampling frame
A population can be defined as the complete set of members of the group under study
(Delice, 2001; Saunders & Lewis, 2018). The population for this study included all
companies that are undergoing digital transformations, whether they were private or
public. This was included as a qualifying question upfront to ensure that the respondents
would be able complete the survey questionnaire. The reason for the population is the

45
pervasive nature of digital transformations which impacts almost every industry size, type
and region (Matt et al., 2015; Pihir, Tomičić-Pupek, & Furjan, 2018), which makes it
impossible to determine the population size in this study. As it was not possible to
determine the sampling frame or the total list of companies that are undergoing digital
transformation initiatives, a probability-based sampling method had to be ruled out, as
selecting a representative sample was not possible because the population could not be
identified (Zikmund et al., 2010).
4.6 Unit of analysis
Li, Xiang, Chen, Xie and Li (2017) described the unit of analysis in a study as the level
where the research takes place. The unit of analysis in this study was at the level of the
organisation, as the digital transformation occurs at that level. What was being measured
was how an organisation responds within the DT process. Similarly, both the independent
variable and moderator, i.e. the EA and DM respectively, as well as the dependent
variable, i.e. firm performance, are measured at an organisational level
4.7 Sampling method and sample size
The sampling method and sample size are important factors in research because they
impact the generalisability of the results obtained to the population, as well as the
detection of significant differences, relationships and interactions (Bartlett II, Kotrlik, &
Higgins, 2001). They are thus important for determining the accuracy of the results
obtained, as well as if they can be generalised back to the larger population under study.
Purposive sampling is a non-probability sampling technique that relies on the researcher’s
judgement to select the sample members based on a set of reasons (Zikmund et al.,
2010). This sampling technique was used for this research as it specifically targeted
individuals in organisations that had commenced with digital transformation initiatives. On
an individual level, it targeted individuals who were familiar with their organisation’s digital
strategy who had more than a year of experience in the organisation. These were also
used as filters in the survey questionnaire to ensure that the individuals were from the
population being studied, and that they had an understanding of, and experience in, their
organisation’s digital strategies. The sampling technique also had an element of snowball
sampling in that the respondents were allowed to pass the survey questionnaire to others

46
whom they thought it would be relevant to. This was allowed due to the low response rates
achieved and the time constraints of the study, which will be discussed later.
The approach for the sampling method was heterogeneous (Saunders & Lewis, 2018) in
order to get as wide a variety as possible of respondents across different industries,
regions and organisation sizes. The sampling was done by posting on several LinkedIn
groups with a diverse audience in the digital transformation field across different regions
and geographies, using the GIBS MBA network, which has a diverse population. The
researcher also sent direct invitations to over 100 individuals, who according to their
LinkedIn profiles had characteristics of the target population. The limitations of the
sampling methods in this study are that the generalisability of the results are limited to the
characteristics of the sample population, because non-probability sampling methods and
snowball sampling can result in individual bias, where an individual may recommend
people similar to themselves (Zikmund et al., 2010).
When selecting a sample size, several factors need to be considered such as population
size, population variability, research objectives and design, analytical techniques used,
and sample size of similar research (Delice, 2001). In this study, the population
characteristics were not possible to determine. The research design was quantitative
analysis and the statistical methods required to answer the research questions were
correlation analysis and moderated regression. The researcher considered the sample
sizes of studies in a similar field of research, which was 95 for Mhlungu et al. (2019), while
Chakravarty et al. (2013) had samples of 73 and 36 across two sample populations, which
were analysed by regression. A sample size of 120 was thus targeted for the study in
order to collect more data than were required in the case of incomplete surveys or survey
errors, as well as to limit the impact of sample size on the analysis.
A sample size can cause type 1 and type 2 errors in statistical hypothesis testing (Bartlett
II et al., 2001), however an increasing sample size typically reduces the likelihood of
making both errors (Zikmund et al., 2010). Type 1 errors are made when the null
hypothesis is rejected when it is in fact true, while type 2 errors are made when the null
hypothesis is not rejected when the alternative hypothesis is true (Zikmund et al., 2010).
Typically, the risk of making a type 1 error can be improved by reducing the alpha or
significance level in in the statistical test, but a reduction in a type 1 error increases the
likelihood of making a type 2 error (Zikmund et al., 2010). According to Chakravarty et al.

47
(2013), a smaller sample is more likely to cause a type 2 error, thus given their smaller
sample sizes, they used the two tailed test of significance to mitigate this effect. A sample
size of 75 respondents was achieved in the study, which was below the target of 120 due
to low response rates and time constraints. The two tailed significance test for statistical
inference was also conducted, as per Chakravarty et al. (2013).
4.8 Measurement instrument
The measurement scale for entrepreneurial agility used in this study was adapted from
the work done by Chakravarty et al. (2013), who tested this scale with high convergent
validity as a construct using confirmatory factor analysis. The scale for firm performance
was adapted from Chakravarty et al. (2013) and Wamba et al. (2017), who used subjective
financial measures to describe firm performance, which have been validated as
acceptable measures of firm performance linked to the RBV (Newbert, 2008).
The measurement scale for digital maturity used in this study was largely adapted from
Gill and Van Boskirk (2016). This has also successfully been used in prior MBA research
(Niland, 2018) because of the absence of a developed empirically validated scale in
literature (Berghaus & Back, 2016; Chanias & Hess, 2016; Remane, et al., 2017). Whilst
the construct validity was not available, the researcher did validate the scale in this study.
The entrepreneurial agility construct was defined by measurement scales from
Chakravarty et al. (2013), who demonstrated validity using confirmatory factor analysis
and revealed the discriminant validity of the constructs. Using composite scale reliabilities,
Chakravarty et al. (2013) yielded values of 0.72 for EA and 0.93 for FP, with an AVE
(average variance explained) of 0.55 and 0.73 for EA and FP respectively, which were
found to be reliable and valid. For firm performance, Wamba et al. (2017) obtained
Cronbach’s α= 0.93; CR (composite reliability) = 0.95; and AVE = 0.78, which were
confirmed to be reliable and valid.
4.9 Data gathering process
The survey questionnaire, which had six sections, was administered online using Google
forms, as shown in Appendix A. The first section included two qualifying questions, which
were:

48
1. Has your organisation embarked on a digital transformation activity with the use of
digital technologies for its internal business processes or to develop new markets
and product offerings?
2. Are you familiar with your organisation’s digital strategies?
If the respondents qualified by answering yes to both questions, they went on to section
A, but if not, they were taken to the end of the survey. Section A consisted of demographic
questions, which included gender, seniority, years of experience in the organisation,
organisation size in terms of number of employees, annual revenue of the organisation,
and industry type. Sections B to D consisted of questions on firm performance (sales,
market share, profit and ROI), entrepreneurial agility, and digital maturity (digital
technology, digital culture, digital organisation and digital insights) respectively, which
were answered according to a five point Likert scale ranging from strongly disagree to
strongly agree. The five point Likert scale was used for the construct questions due its
wide use, ease of use and its validity (Preston & Coleman, 2000).
A pilot test was conducted, as this is considered critical for refining survey questions to
reduce the risk that a study will be flawed. It also provides guidance that the survey
instrument works as intended, and can be used to gain feedback to improve on the larger
study (Zikmund et al., 2010). A pilot test of the questionnaire was run over three weeks
with a pre-selected set of respondents, who were typical of the sample population being
tested from the researcher’s business network. A total of 13 respondents participated in
the pilot survey. The purpose was to test that the questions were properly understood,
were not leading, and would provide the required data (Saunders & Lewis, 2018). A pilot
test was also conducted by Wamba et al. (2017) in their research, to ensure that their
measures were reliable and valid. The feedback received from this study’s pilot test
included the following:
1. Three respondents to the pilot test indicated that it would be better to target people
who were knowledgeable about digital strategies in their organisations, as those
who were unsure might choose neutral for answers that they were not sure of. This
was addressed by qualifying question two in the questionnaire.

49
2. It was recommended that the researcher review some of the questions as some
sounded quite similar and the survey was repetitive. This was expected as the
scales selected were measuring a single construct. Hence no changes were made.
3. One respondent recommended changing the structure of the survey questions on
the survey instrument for those using mobile phones. The researcher considered
this, but as it was only the view of one respondent, it was not changed.
4. Some of the vocabulary used in the questionnaire was identified as potentially
being unclear, such as the terms “best in class” and “functional silos”. These terms
were thus explained for clarity in parentheses in the survey questionnaire.
5. The rest of the survey was considered easy to understand and quick to complete
(less than 10 minutes).
The researcher posted the survey on LinkedIn, targeting responses from businesspeople
who worked in organisations that had commenced with digital transformation initiatives.
The researcher also used selected digital transformation LinkedIn groups to target
respondents, and extended the invitation to the GIBS business network. The researcher
did not use other social media platforms in order to ensure a high quality of respondents,
as platforms such as Facebook and Twitter do not have a strictly business audience. The
following timeline for data collection was used:
1) Initial group post on LinkedIn inviting respondents to complete the survey (week
1).
2) Tagging the researcher’s supervisor in the post on LinkedIn to attract a wider
network of people (week 2).
3) Inviting the researcher’s GIBS MBA network to complete the survey (week 3).
4) Joining the following groups on LinkedIn and posting on the group (weeks 3 and
4):
a. Digital Strategy & Transformation (30,915 members);
b. It’s All About IoT, AI, and Digital Transformation (2,055 members);
c. Digital Transformation MENA (3,701 members); and
d. Change Consulting, Digital Transformation, Change Management,
Strategy, Social Distancing, Disruption (119,475 members).
5) Sending direct LinkedIn message requests to over 100 respondents, inviting them
to complete the survey (weeks 5 and 6)

50
There was an element of snowball sampling as some participants forwarded the survey to
other people in their network. This may have introduced sampling bias, both towards the
researcher’s network as well as the respondents themselves sharing with people who
were similar to them. The sample response rate was very low considering the size of the
groups and the networks used. Due to time constraints, the researcher had to end the
survey after 8 weeks (including two weeks for the pilot survey) of data collection. The total
number of respondents to the survey was 75, of which six did not meet the two qualifying
criteria and one had less than one year of experience in the organisation. These
respondents were thus removed from the sample population. The data retrieved were also
checked for any missing values for all the survey questions. As there were no missing
values, a total of 68 usable responses were recorded.
4.10 Analysis approach
Zikmund et al. (2010: 462) described the importance of the first stages of converting “raw
data” into “intelligence” by editing, coding and filing the data. Data need to be checked for
both respondent and non-respondent errors, which in this study occurred when the
researcher transferred the data into an electronic file. Editing is described as checking the
consistency, legibility and completeness of the data before coding and transferring to
storage. Editing was done to check for any missing values or errors in the raw data, before
being transferred to a Microsoft Excel spreadsheet. No errors or missing values were
picked up. Coding, which refers to the assignment of numerical scores to previously edited
data, was done according to the table shown in Appendix B. This was done to provide
meaning to the data for analysis using a computer (Zikmund et al., 2010). Coding for the
Likert scales used numerical numbers from 1 (strongly disagree) to 5 (strongly agree).
4.10.1 Detection and removal of outliers
As per the assumptions for linear regression, there must be no outliers in a sample
population as these could skew the results obtained from the statistical analysis (Osborne
& Overbay, 2004). Similarly, outliers can also have a negative impact on scale reliability
in the reported Cronbach’s alpha, which can skew higher values (Y. Liu, Wu, & Zumbo,
2010) and create an incorrect measure of scale reliability. Outliers can further impact the
results obtained from correlation analysis and normality, which may skew the results
obtained and also risk type 1 and type 2 errors in the hypothesis testing (Osborne &

51
Overbay, 2004). Outliers may be due to response bias, which can compromise the
reliability of measurements (Zikmund et al., 2010). Considering that the research
objectives in this study were dependent on statistical methods that would be compromised
by outliers, their removal was considered critical to generate reliable results.
The methodology followed for detecting outliers included plotting them on Box and
Whisker plots on IBM SPSS, which is a common method using statistical software that
identifies the variables that are outside of the interquartile range as potential outliers
(Pallant, 2001). In order to simplify the process, the item total scores for each scale, except
the dependent variables of firm performance (sales, market share, profit, ROI), were
computed. This was plotted together with the firm performance items to identifier outliers
outside of the interquartile range. Error! Reference source not found. and Error!
Reference source not found. indicate the plots before outlier removal; the points sitting
outside the range on the Box and Whisker plots, identified by the circles, were considered
outliers. The outliers detected were then checked against the actual data measurements
to see if there were any anomalous records for either of the constant values, which could
be due to response biases that were not representative of the majority of the data.
Examining the recorded data also revealed extremely low scores across several of the
items, which were considered to be caused by extremity bias. The process was followed
a few more times, and saw a total of eight outliers being removed from the dataset. Error!
Reference source not found. and Error! Reference source not found. show the plots
after all the outliers were removed and there are no more circles highlighted outside the
Box and Whisker plots.
52
Figure 1: Box and Whisker plot for firm performance construct scores (before outlier removal)
Figure 2: Box and Whisker plot for item total scores for EA and DM constructs (before outlier removal)

53
Figure 3: Box and Whisker plot for firm performance construct scores (after outlier removal)
Figure 4: Box and Whisker plot for item total scores for EA and DM constructs (after outlier removal)
The above analysis was cross-checked with the mean and a 5% trimmed mean, which by
removing the top and bottom 5% of values is also an indicator of effect of the upper and

54
lower 5% of data on the mean (Pallant, 2001). The mean and 5% trimmed mean were
compared after the outliers were removed using IBM SPSS, as cross checked on the Box
and Whisker plots shown in Error! Reference source not found. below. The means and
5% trimmed means were found to be very similar, indicating minimal impact of any outlying
values on the mean as a check on the Box and Whisker plots. A total of eight outliers were
removed through this process, leaving a total of 60 usable responses.
Table 1: Table showing the mean and 5% trimmed mean after outlier removal for the scale scores
Mean
5% trimmed
mean
Sales 3.80 3.83
Market share 3.65 3.67
Profit 3.68 3.70
ROI 3.68 3.70
Item total score - EA 14.47 14.54
Item total score - DM technology 26.30 26.43
Item total score - DM culture 26.25 26.33
Item total score - DM
organisation 24.32 24.30
Item total score - DM insights 23.98 23.94
4.10.2 Test for normality
The next part of the process involved testing for normality. Normality refers to the central
tendency data in distribution and is an assumption for several statistical parametric tests
(Ghasemi & Zahediasl, 2012; Pallant, 2001) to ensure the validity of the results obtained.
According to the central limit theorem, large enough samples of greater than 30 can be
assumed to approximate a normal distribution, but the extent of the deviations from
normality should be assessed when using parametric tests (Ghasemi & Zahediasl, 2012;
Pallant, 2001). The characteristics of the shape of the distribution can be determined by
the kurtosis and skewness parameters from the descriptive statistics, which indicate the
peaks and skewness of the distribution. For normal distributions these values are close to

55
0 (Pallant, 2001). The first approach was to plot the histograms; the box and whisker plots
from the earlier outlier detection was also useful in identifying the spread and central
tendency of the data, as well as to what extent the data deviated from normality. The
Shapiro Wilk test was used to test for normality, which influenced the statistical tests used
for further analysis in the study. The Shapiro-Wilk test indicates non-normal data if the sig
value is below 0.05. It can be seen in Error! Reference source not found. below that
only two out of the nine scales used (digital technology and digital organisational structure)
showed normally distributed data. Non-parametric statistical tests were thus used when
required.
The researcher did closely examine the histograms, as well as skewness and kurtosis
values, which indicated slight deviations from normality. For the regression analysis, the
researcher thus decided to continue noting that one of the key assumptions for regression
analysis later on in the study was the normality of the residuals and not the strict normality
of all the variables (Pallant, 2001).
Table 2: Shapiro Wilk test for normality for the scales
Tests of Normality
Shapiro-Wilk
Statistic df Sig.
Sales 0,837 60 0,000
Market share 0,862 60 0,000
Profit 0,846 60 0,000
ROI 0,866 60 0,000
Item total score - EA 0,963 60 0,066
Item total score - Digital technology 0,974 60 0,228
Item total score - Digital culture 0,945 60 0,009
Item total score - Digital organisational
structure
0,974 60 0,219
Item total score - Digital insights 0,958 60 0,038
*. This is a lower bound of the true significance.
a. Lilliefors Significance Correction
56
4.10.3 Reliability and validity
Validity measures the accuracy of a measure and the extent to which a score truthfully
measures a concept (Zikmund et al., 2010). Construct validity in this study was important
to ensure that the scales adopted from the literature accurately measured the constructs
which were hypothesised in order to answer the research questions. Validity was tested
using bi-variate correlation of the item total score per question, as well as the score for
each question, to ensure that all the questions were measuring the same construct.
Validity was tested for each construct and the respective sets of questions.
The reliability of the scales used in this study is an indication of a measure’s internal
consistency, which is important to ensure homogeneity of measurements (Zikmund et al.,
2010). This homogeneity is the ability of the questions in a scale to consistently measure
the same thing (Wamba et al., 2017; Mhlungu, Chen & Alkema, 2019). In order to measure
the reliability of the scales used, Zikmund et al. (2010) indicated that Cronbach’s alpha is
the most commonly used method to test multiple-item scale reliability. Cronbach’s alpha
was used to test the reliability of the measurement scales in this study which was also
used byWamba et al. (2017), Mhlungu, Chen and Alkema (2019), and Chakravarty,
Grewal and Sambamurthy (2013). This ensures that the measurement scale is, in fact,
reliably measuring the construct of interest and is internally consistent (Wamba et al.,
2017; Mhlungu, Chen & Alkema, 2019). This means that the set of questions per
measurement scale are measuring the same variable.
4.10.4 Descriptive statistics
Once a clean data set was obtained, descriptive statistics of the sample population
characteristics were plotted in Microsoft Excel to check for the spread of data and sample
skewness. The central tendency of the data was examined by using descriptive statistics
such as the mean, standard deviation and shapes and characteristics of the histograms,
such as skewness and kurtosis. Skewness indicates whether the data are skewed to the
left or right, while kurtosis refers to the peaks of the histogram; for normally distributed
data these values should be close to 0. Normality is an important consideration for
deciding whether parametric or non-parametric statistical tests will be applied (Pallant,
2001). These statistical tests are important to test the hypotheses and answer the
research questions with confidence.
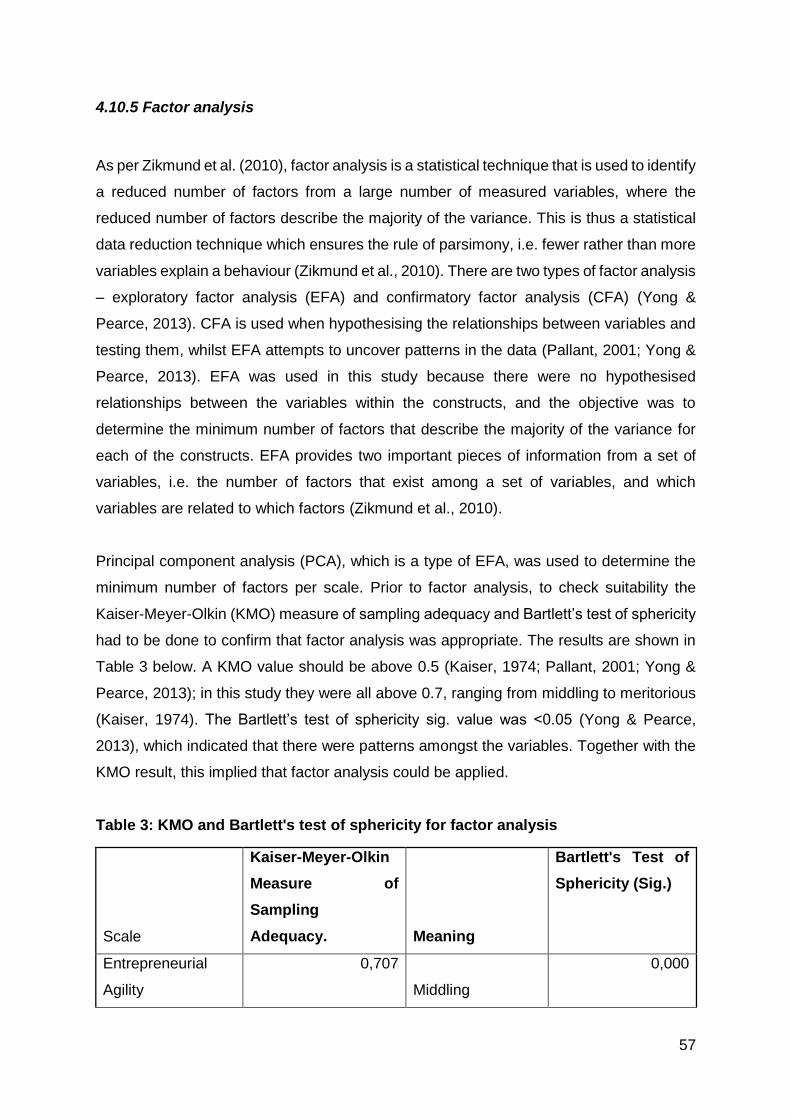
57
4.10.5 Factor analysis
As per Zikmund et al. (2010), factor analysis is a statistical technique that is used to identify
a reduced number of factors from a large number of measured variables, where the
reduced number of factors describe the majority of the variance. This is thus a statistical
data reduction technique which ensures the rule of parsimony, i.e. fewer rather than more
variables explain a behaviour (Zikmund et al., 2010). There are two types of factor analysis
– exploratory factor analysis (EFA) and confirmatory factor analysis (CFA) (Yong &
Pearce, 2013). CFA is used when hypothesising the relationships between variables and
testing them, whilst EFA attempts to uncover patterns in the data (Pallant, 2001; Yong &
Pearce, 2013). EFA was used in this study because there were no hypothesised
relationships between the variables within the constructs, and the objective was to
determine the minimum number of factors that describe the majority of the variance for
each of the constructs. EFA provides two important pieces of information from a set of
variables, i.e. the number of factors that exist among a set of variables, and which
variables are related to which factors (Zikmund et al., 2010).
Principal component analysis (PCA), which is a type of EFA, was used to determine the
minimum number of factors per scale. Prior to factor analysis, to check suitability the
Kaiser-Meyer-Olkin (KMO) measure of sampling adequacy and Bartlett’s test of sphericity
had to be done to confirm that factor analysis was appropriate. The results are shown in
Table 3 below. A KMO value should be above 0.5 (Kaiser, 1974; Pallant, 2001; Yong &
Pearce, 2013); in this study they were all above 0.7, ranging from middling to meritorious
(Kaiser, 1974). The Bartlett’s test of sphericity sig. value was <0.05 (Yong & Pearce,
2013), which indicated that there were patterns amongst the variables. Together with the
KMO result, this implied that factor analysis could be applied.
Table 3: KMO and Bartlett's test of sphericity for factor analysis
Scale
Kaiser-Meyer-Olkin
Measure of
Sampling
Adequacy. Meaning
Bartlett's Test of
Sphericity (Sig.)
Entrepreneurial
Agility
0,707
Middling
0,000

58
DM: Technology 0,733 Middling 0,000
DM: Culture 0,772 Middling 0,000
DM: Organisation 0,835 Meritorious 0,000
DM: Insights 0,848 Meritorious 0,000
4.10.6 Correlation analysis
In order to test hypothesis H10 on the relationship between EA and FP (sales, market
share, profit, ROI), a test for correlation was performed. Correlation analysis is used to
test the strength and direction of a linear relationship between variables (Pallant, 2001).
The two correlation tests that were considered for this study were Pearson’s product
moment correlation and Spearman’s ranked correlation (Pallant, 2001). Pearson’s has the
requirement that the data need to be normally distributed, however since the majority of
the data were not normally distributed, Spearman’s ranked correlation was used for the
analysis. It is important to note that the significance of the correlation analysis between
EA and FP was a pre-requisite to test the second hypothesis in this study.
4.10.7 Moderated linear regression
In order to test the second hypothesis, which concerned the moderating effect of digital
maturity (digital technology, digital culture, digital organisation structure, digital insights)
on the relationship between EA and FP (sales, market share, profit, ROI), a moderated
linear regression analysis was performed. There are several statistical assumptions for a
moderated regression which are described below (Laerd Statistics, 2020):
Assumption 1: The dependent variable should be measured on a continuous scale, i.e. it
is either an interval or ratio data.
Assumption 2: There is at least one continuous independent variable and one moderator
variable.
Assumption 3: There is independence of observations.
Assumption 4: Linear relationships exist between the dependent and independent
variables.

59
Assumption 5: The data must show homoscedasticity, which is where for all combinations
of independent and moderator variables, the error variances are the same.
Assumption 6: The data must not show multi-collinearity, which occurs when two or more
independent variables are highly correlated with each other.
Assumption 7: No significant outliers, high leverage points or highly influential points
should be included in the data.
Assumption 8: The residuals must be normally distributed.
It is important to highlight that moderated linear regression does not explicitly require the
variables to be normally distributed, but does require that the residuals are approximately
normally distributed (Pallant, 2001). This was considered important for validating the
assumptions in the moderated linear regression tests, which would indicate the level of
confidence in the result obtained, to help prevent type 1 or type 2 errors.
4.11 Quality controls
The researcher was cognisant of potential errors and biases during the data collection,
which included subject biases and errors that may have impacted the reliability of the
study. These included subject error, subject bias, observer error and observer bias.
Subject error, which considers the impact of a survey that is administered at different
times, was mitigated by conducting the survey over a continuous fixed period of eight
weeks. This was considered adequate for the subject under study. Subject bias occurs
when respondents may give unreliable information because they think telling the truth may
show them in a negative light. This was mitigated by administering the survey
anonymously and only reporting the aggregate data. Observer error occurs when the
researcher asks a question in different ways or in a way that may be misinterpreted. The
pilot survey was done to ensure the questions would be easily understood and any
ambiguity or misunderstanding of the questions was addressed. Observer bias is due to
the way different researchers may interpret the same data (Saunders & Lewis, 2018),
however this was not the case in this study as quantitative research aims to measure
responses in an objective way.
Additional biases which were considered in the data analysis were non response errors
and response biases. Non response error is caused by respondents not completing the
survey, thus the survey was administered for eight weeks and to an extensive sample

60
population to increase the number of respondents. Response biases are caused by
deliberate falsification, i.e. by misinterpreting the answers or knowingly responding falsely,
and unconscious misinterpretation, which could be due to the format of questions, the
content of questions and the possible ambiguity of questions (Zikmund et al., 2010). In
order to mitigate response bias, a pilot survey was tested to ensure that the questions
were not leading or ambiguous, and could be easily understood. The findings from the
pilot survey were incorporated into the full study. In order to manage deliberate
falsifications, the analysis included the detection of outliers in the data.
In order to test the validity of the constructs in this study, bivariate correlation was used
between the item total scores of the scales. In order to ensure the internal reliability of the
data and constructs, Cronbach’s alpha was used to test the reliability of the measurement
scale, as per Wamba et al. (2017) and Mhlungu et al. (2019). This was necessary to
ensure that the measurement scale was, in fact, reliably measuring the construct of
interest and was internally consistent (Wamba et al., 2017; Mhlungu, Chen & Alkema,
2019).
4.12 Limitations
Since a non-probability sampling method was used, the findings cannot be generalised to
the entire population, i.e. the findings are based on individual responses and thus carry
individual bias. The survey approach, i.e. using social media and elements of snowball
sampling, may also have contributed to individual bias. The survey required individuals to
answer on behalf of their organisations, which may have influenced their responses
depending on their experience of the organisation. This issue was filtered out by removing
individuals with less than a year of experience in the organisation. Finally, the experience
of the researcher plays a role in performing quantitative research and non-probability
sampling, therefore the researcher may not have had adequate experience in this field.

61
Chapter 5: Results
5.1 Introduction
This chapter discusses the results obtained in this study. The purpose of this section is to
provide a description of the sample population, which is relevant for the generalisability of
the results based on non-probability sampling. The scales results are then presented in
terms of reliability and validity. Factor analysis through principal component analysis, and
statistical inferential statistics were performed in order to test the hypotheses, which was
necessary to answer the research questions.
The study had two hypotheses, the first of which was aimed at testing the relationship
between entrepreneurial agility and the constructs of firm performance (sales, market
share, profit and ROI). The second was aimed at testing the moderating effect of the latent
constructs of digital maturity (digital technology, digital culture, digital organisational
structure and digital insights) on the constructs of firm performance as described above.
5.2 Details of the sample collected
5.2.1 Total data sample
The total data sample was comprised of 75 respondents, of which only 60 useful surveys
were analysed. Six of the respondents did not qualify based on their inability to positively
respond to the two qualifying questions asked upfront. One respondent did not meet the
qualifying criteria in terms of years of experience in the organisation, and eight were
removed as outliers.
Table 4: Summary of survey respondents and data filtering
Total responses 75
Non qualifying
questions 6
Remove
respondents < 1 1

62
year of experience in
firm
Outlier removal 8
Useful data 60
The survey response rate was very difficult to quantify given the use of the social media
platform, LinkedIn. This was due to the network effect and snowball sampling, which made
it difficult to quantify how many people were reached as people may have shared the
survey link numerous times. However, based on the number of members in the LinkedIn
groups and all the other channels explored, it can be considered that the response rate in
this study was very low. There could be several reasons for this, which the researcher did
not analyse, including survey fatigue, a lack of time to respond due to other commitments,
a lack of incentives, or the respondents may have found the topic too complex or abstract
(Fan & Yan, 2010).
5.3 Demographics of the sample
5.3.1 Gender
The total sample consisted of predominantly male respondents (73.5%). One quarter
(25%) were female, with 1.5% preferring not to respond (see Table 5).
Table 5: Gender characteristics of population
Number
Percentage
(%)
Male 46 76,67
Female 13 21,67
Prefer not to say 1 1,67
Total 60 100,00
5.3.2 Seniority in organisation

63
At 93%, middle, senior and executive managers made up the majority of the sample; just
7% were in junior management (see Table 6). This was favourable as the more senior
managers would have a better understanding and visibility of their organisation’s digital
strategy and firm performance.
Table 6: Seniority of respondents within the sample
Number
Percentage
(%)
Junior manager 5 8,33
Middle manager 17 28,33
Senior manager 22 36,67
Executive manager 16 26,67
Total 60 100,00
5.3.3 Years of experience in organisation
The respondents’ years of experience in their organisation were more evenly spread, as
seen in Table 7 below. The highest weighting was in the 10 to 15 years category, while
the lowest was in the > 15 years category.
Table 7: Years of experience in the organisation within the sample
Number
Percentage
(%)
1 to 5 years 17 28,33
5 to 10 years 13 21,67
10 to 15 years 21 35,00
>15 years 9 15,00
60 100,00

64
5.3.4 Organisation size
The organisation size in terms of number of employees saw 53% of the sample being
>5,000 employees, while the remainder were relatively evenly spread across the other
size categories (see Table 8).
Table 8: Organisation size in terms of number of employees within the sample
Organisation size
(no of employees) Number
Percentage
(%)
0-99 10 16,67
100-499 9 15,00
500-999 4 6,67
1,000-4,999 5 8,33
5,000 or more 32 53,33
60 100,00
5.3.5 Annual revenues
The annual revenues of the organisations in the sample were largely > R1,000m at 66%,
with R100-999.9m being 19% and R10-99.99m being 12%. The least common were in the
<R0.99m and R1m-R9.9m categories, i.e. the sample was skewed towards high annual
revenue organisations.
Table 9: Annual revenues of organisations within the sample
Annual revenues in
organisations Number
Percentage
(%)
<R0.99m 1 1,67
R1m - R9.9m 1 1,67
R10m - R99.99m 5 8,33
R100m - R999.99m 13 21,67
>R1,000m 40 66,67
Total 60 100,00

65
5.3.6 Industry type
Several industries were covered within the sample, as shown in Appendix B. The majority
of organisations were in mining at 35.3%, while financial services were at 13.2%,
manufacturing was at 6.7%, and the automotive industry was at 5%. The rest of the
organisations were spread across a wide variety of different industries. The spread of the
data were aligned to the researcher’s heterogeneous approach, which was taken in order
to measure the effects of the phenomenon being studied.
5.4 Validity of the constructs used in the study
Validity measures the accuracy of a measure and the extent to which a score truthfully
measures a concept (Zikmund et al., 2010). Construct validity in this study was important
to ensure that the scales accurately measured the constructs which were hypothesised in
order to answer the research questions. Validity was tested using bi-variate correlation of
the item total score per question and the score for each question to ensure all the
questions were measuring the same construct. Since all the data were not normally
distributed, a Spearman’s rank correlation was run for all of the scales (see Appendix C).
There were four questions for FP, four questions for EA, seven questions for DM
Technology, seven questions for DM Culture, seven questions for DM Organisation, and
seven questions for DM Insights.
Table 10: Bi-variate correlation using Spearman’s rank for scale validity for firm performance
N
Spearman’s rho coefficient (against item total score)
Sig. (2-tailed)
Firm Performance
Q1. Sales 60 .762** 0,000
Q2. Market Share 60 .850** 0,000
Q3. Profit 60 .796** 0,000
Q4. ROI 60 .875** 0,000
Table 10 shows significant positive correlations for all questions on firm performance,
which implies that the scale was a valid measure of firm performance.

66
Table 11: Bi-variate correlation using Spearman’s rank for scale validity for EA
N
Spearman’s rho coefficient (against item total score)
Sig. (2-tailed)
Entrepreneurial Agility
Q5. EA-Scenarios 60 .622** 0,000
Q6. EA-Opportunities 60
.725** 0,000
Q7. EA-Strategic assets 60
.826** 0,000
Q8. EA-Positioning 60 .879** 0,000
Table 11 shows significant positive correlations for all questions on EA, which implies that
the scale was a valid measure of EA.
Table 12: Bi-variate correlation using Spearman’s rank for scale validity for digital technology
N
Spearman’s rho coefficient (against item total score)
Sig. (2-tailed)
DM: Digital Technology
Q9. Technology-Fluid budget 60
.495** 0,000
Q10. Technology-Road map 60
.699** 0,000
Q11. Technology- Approach 60
.770** 0,000
Q12. Technology-Modern architecture 60
.628** 0,000
Q13. Technology-Measurement 60
.745** 0,000
Q14. Technology-Customer experience assets 60
.641** 0,000
Q15. Technology-Digital tools 60
.740** 0,000
Table 12 shows significant positive correlations for all questions on digital technology,
which implies that the scale was a valid measure of digital technology.

67
Table 13: Bi-variate correlation using Spearman’s rank for scale validity for digital culture
N
Spearman’s rho coefficient (against item total score)
Sig. (2-tailed)
DM: Digital Culture
Culture-Competitive strategy 60
.577** 0,000
Culture-Board support 60 .648** 0,000
Culture-Right leaders 60 .650** 0,000
Culture-Education and training investment 60
.792** 0,000
Culture-Communicate digital vision 60
.740** 0,000
Culture-Measured risks 60 .604** 0,000
Culture-Customer experience 60
.670** 0,000
Table 13 shows significant positive correlations for all questions regarding digital culture,
which implies that the scale is a valid measure.
Table 14: Bi-variate correlation using Spearman’s rank for scale validity for digital organisational structure
N
Spearman’s rho coefficient (against item total score)
Sig. (2-tailed)
DM: Digital organisational structure
Organisation-Customer journeys 60
.672** 0,000
Organisation-Resources 60
.844** 0,000
Organisation-Best in class staff 60
.824** 0,000
Organisation-Digital skills 60 .778** 0,000
Organisation-Collaboration 60 .704** 0,000
Organisation-Processes 60 .770** 0,000
Organisation-Vendor partners 60
.670** 0,000
Table 14 shows significant positive correlations for all questions of digital organisational
structure, and hence implies that the scale is a valid measure.
N
Spearman’s rho coefficient (against item total score)
Sig. (2-tailed)

68
DM: Digital Insights
Insights-Quantifiable goals 60
.754** 0,000
Insights-Employee understanding of contribution 60
.804** 0,000
Insights-Customer centred measures 60
.744** 0,000
Insights-Multiple channels 60
.881** 0,000
Insights-Digital strategy 60 .843** 0,000
Insights-Digital tools 60 .802** 0,000
Insights-Lessons learned 60 .826** 0,000
5.5 Reliability of the constructs used in the study
The reliability of the scales used in this study is an indication of a measure’s internal
consistency. Internal consistency of the measurement scales is important to ensure the
homogeneity of measurements (Zikmund et al., 2010), which is the ability of the questions
in a scale to consistently measure the same thing (Wamba et al., 2017; Mhlungu, Chen &
Alkema, 2019). A Cronbach’s alpha of above 0.7 was obtained for all constructs, which
was considered a good indication of reliability (Wamba et al., 2017; Mhlungu, Chen &
Alkema, 2019, Zikmund et al., 2010, Gliem & Gliem, 2003).
Table 15: Test for reliability of scales
Scale Number of questions Cronbach's Alpha Decision
Firm performance 4 0,852 Acceptable
Entrepreneurial agility 4 0,787 Acceptable
DM: Digital technology 7 0,816 Acceptable
DM: Digital culture 7 0,799 Acceptable
DM: Digital organisational
structure 7 0,879 Acceptable
DM: Digital Insights 7 0,908 Acceptable
5.6 Exploratory factor analysis

69
As discussed in Chapter 4, exploratory factor analysis was conducted to reduce the
number of factors in the measurement scales to ensure the rule of parsimony. The KMO
and Bartlett’s test for sphericity indicated that factor analysis was appropriate, while a
principal component analysis was conducted to reduce the number of variables into a
smaller set of factors that described the majority of the variance. The first step in the
analysis was plotting the correlation matrix between the variables for each scale, which is
shown in Table 32 to Table 36 in Appendix D. The correlation matrices for all the scales
indicated that the majority of coefficients were greater than 0.3, which was indicative that
there were linear relationships.
For the entrepreneurial agility scale, the PCA analysis resulted in just a single factor, as
shown in the component matrix in Table 38 in Appendix D.1. The total variance explained
was 61.14% and the factor was termed entrepreneurial agility (EA), as shown in Table 39
in Appendix D.1.
For the digital technology scale, the PCA analysis resulted in two factors being identified,
as shown in the rotated component matrix in Table 40 in Appendix D.2. These two factors
were defined as digital technology strategy (DTS) and digital technology embeddedness
(DTE), which explained 48.07% and 15.53% respectively, as shown in Table 41 in
Appendix D.2.
For the digital culture scale, the PCA analysis resulted in two factors being identified, as
shown in the rotated component matrix in Table 42 in Appendix D.3. These two factors
were defined as digital culture embeddedness (DCE) and leadership support (LS), which
explained 48.07% and 15.53% respectively, as shown in Table 43 in Appendix D.3.
For the digital organisational structure scale, the PCA analysis resulted in just a single
factor, as shown in the component matrix in Table 44 in Appendix D.4. The total variance
explained was 58.15%, and the factor was termed digital organisational structure (DOS),
as shown in Table 45 in Appendix D.4.
For the digital maturity insights scale, the PCA analysis resulted in just a single factor, as
shown in the component matrix in Table 46 in Appendix D.5. The total variance explained
was 65.27% and the factor was termed digital insights, as shown in Table 47 in Appendix
D.5.

70
These results led to the creation of the following conceptual model for testing the
correlation and regression analyses, in order to test the hypotheses and answer the
research questions as shown in Figure 5 below.

71
Figure 5: Conceptual model to be tested with correlation and moderated regression analysis
Entrepreneurial
Agility (IV)
Digital Maturity (IV)
Digital technology
embeddedness
Digital Culture
embeddedness
DIgital
organizational structure
Digital Insights
Firm Performance
(DV) Sales
Market Share
Profit relative
to goals
Return on
Investment
H2
H1
Digital technology strategy
Leadership
support

72
5.7 Descriptive statistics
Table 16: Descriptive statistics of constructs used in correlation and moderated regression analysis
Descriptive statistics
Sales
Market
Share Profit ROI EA DTE DTS DCE LS DOS DI
Mean 3,80 3,65 3,68 3,72 3,62 3,68 3,82 3,68 3,85 3,47 3,43
95%
Confidence
Interval for
Mean
Lower
Bound
3,61 3,44 3,49 3,50 3,40 3,46 3,63 3,46 3,65 3,27 3,20
Upper
Bound
3,99 3,86 3,88 3,93 3,83 3,90 4,00 3,89 4,05 3,68 3,65
5%
Trimmed
Mean
3,83 3,67 3,70 3,74 3,63 3,72 3,84 3,69 3,89 3,47 3,42
Median 4,00 4,00 4,00 4,00 3,75 3,67 3,88 3,75 4,00 3,50 3,50
Variance 0,57 0,64 0,56 0,68 0,68 0,74 0,51 0,68 0,57 0,61 0,77
Std.
Deviation
0,75 0,80 0,75 0,83 0,82 0,86 0,72 0,82 0,76 0,78 0,88
Minimum 2,0 2,0 2,0 2,0 1,75 1,33 2,0 2,0 1,7 2,00 2,00
Maximum 5,0 5,0 5,0 5,0 5,00 5,00 5,0 5,0 5,0 5,00 5,00
Range 3,0 3,0 3,0 3,0 3,25 3,67 3,0 3,0 3,3 3,00 3,00
Interquartile
Range
1,0 1,0 1,0 1,0 1,19 1,00 0,8 1,0 1,0 1,21 1,29
Skewness -0,38 -0,10 -0,16 -
0,17
-
0,28
-
0,61
-
0,62
-
0,36
-
0,74
0,04 0,05
Kurtosis 0,10 -0,38 -0,17 -
0,45
-
0,61
0,19 0,38 -
0,59
0,28 -
0,59
-
1,02
Table 16 shows the descriptive statistics for the dependent variables (sales, market share,
profit, ROI), the independent variable EA, and the moderator variables, DTE, DTS, DCE,
LS, DOS and DI, which are sub-constructs of digital maturity. The general means for all

73
the variables were between 3.43 and 3.85. For sales, market share, profit and ROI, the
respondents felt on average that their performance in these financial measures were
better than their competitors over the last three years, leaning closer to agree on the Likert
scale. For the remaining variables, the respondents on average were also closer to agree
for the majority of the questions. This shows a general skew of the data to the right, which
is also indicated by the negative skewness for the majority of the variables. The standard
deviations across all the data were fairly similar, ranging from 0.72 to 0.88 across all the
variables, indicating that the spread of data for all the variables were fairly similar. The
mean and 5% trimmed mean are close to each other for all variables, indicating the
minimal impact of the outlying variables on the mean.
5.8 Recheck for normality after factor analysis
Table 17: Test for normality for all variables prior to correlation and regression analysis
Tests of Normality
Kolmogorov-Smirnova
Shapiro-
Wilk
Statistic df Sig. Statistic df Sig.
Sales 0,305 60 0,000 0,837 60 0,000
MShare 0,253 60 0,000 0,862 60 0,000
Profit 0,281 60 0,000 0,846 60 0,000
ROI 0,251 60 0,000 0,866 60 0,000
EA 0,163 60 0,000 0,963 60 0,066
DTE 0,145 60 0,003 0,951 60 0,017
DTS 0,196 60 0,000 0,934 60 0,003
DCE 0,149 60 0,002 0,947 60 0,011
LS 0,162 60 0,000 0,938 60 0,005
DOS 0,100 60 .200* 0,974 60 0,219
DI 0,107 60 0,082 0,958 60 0,038
*. This is a lower bound of the true significance.
a. Lilliefors Significance Correction

74
All the variables were tested for normality using the Shapiro-Wilk test; only two variables
with p<0.05 showed normal data, which were EA and DOS. A non-parametric test, i.e. the
Spearman’s rank, was thus used for correlation analysis to answer research question 1.
For regression analysis, the decision was made to continue since the assumptions for
regression required the residuals to be normally distributed, and not necessarily that the
data should be normally distributed.
5.9 Correlation analysis
5.9.1 Research Question 1
What is the relationship between entrepreneurial agility and firm performance for firms
undergoing DT?
H1: Entrepreneurial agility has a significant positive relationship with firm performance
(sales, market share, profit and ROI)
In order to answer this research question, a Spearman’s rank correlation analysis was run
between the construct entrepreneurial agility and the sub-constructs of firm performance,
being sales, market share, profit and ROI. The analysis of results was at a confidence
level of 95% (p<0.05).The correlation table is shown in Table 18 below.
Table 18: Research question 1: Correlation analysis between entrepreneurial agility and firm performance (sales, market share, profit, ROI) relative to competitors
Correlations
EA
Spearman's rho Sales Correlation Coefficient
.502**
Sig. (2-tailed) 0
N 60
Market Share
Correlation Coefficient
.370**
Sig. (2-tailed) 0,004
N 60
Profit Correlation Coefficient
.331**
Sig. (2-tailed) 0,01
N 60
ROI Correlation Coefficient
.403**

75
Sig. (2-tailed) 0,001
N 60
**. Correlation is significant at the 0.01 level (2-tailed).
There was a strong positive correlation, i.e. r = 0.502, p (two tailed) <0.05, between sales
and entrepreneurial agility, as shown in Table 18.
There was a moderate positive correlation, i.e. r = 0.370, p (two tailed) <0.05, between
market share and entrepreneurial agility, as shown in Table 18.
There was a moderate positive correlation, i.e. r = 0.331, p (two tailed) <0.05, between
profit and entrepreneurial agility, as shown in Table 18.
There was a moderate positive correlation, i.e. r = 0.403, p (two tailed) <0.05, between
profit and entrepreneurial agility, as shown in Table 18.
5.10 Moderated regression analysis
5.10.1 Research Question 2
What is the effect of digital maturity on the relationship between entrepreneurial agility and
firm performance for firms undergoing digital transformations?
H20: Digital maturity has a positive moderating effect between entrepreneurial agility and
firm performance (sales, market share, profit, ROI)
In order to answer this research question, a moderated regression analysis was run with
all the sub-constructs of digital maturity. Moderated regression, as discussed in Chapter
4, was run using the process macro for moderated regression by Hayes (2020). The
assumptions for the regression analysis were also tested using IBM SPSS to confirm the
validity of the regression models. A total of 24 moderated regressions were run.
Assumption 1: The dependent variable should be measured on a continuous scale,
i.e. it is either an interval or ratio data

76
Yes, measurements are on a continuous scale.
Assumption 2: There is at least one continuous independent variable and one
moderator variable
Yes, the continuous variable is EA, and each of the digital maturity constructs (DTE, DTS,
DCE, LS, DOS, DI) form the moderator variables.
Assumption 3: There is independence of observations
Yes, there were no relationships between the samples taken.
Assumption 4: There are linear relationships between the dependent and
independent variables
Figure 6 below shows the linear relationships between the dependent and independent
variables through a scatter plot and trend lines. It can be seen that a straight lines can be
plotted against the dependant and independent variables which shows the relationships
generally follow a straight line.
Figure 6: Matrix scatter plot showing the linear relationships between the dependent and independent variables

77
Assumption 5: The data must show homoscedasticity, which is when for all
combinations of independent and moderator variables, the error variances are the
same
All the data were mean centred in the regression analysis to minimise the impact of multi-
collinearity, which did not impact the analysis of moderator variable (Pallant, 2001). This
was first inspected on the scatter plots of residuals against predicted values. From the
scatter plot, there was no clear shape that indicated heteroscedastic data, hence the
Breusch pagan test for homoscedastic data was used. The tests wer done by running a
regression analysis between the square of the unstandardized residuals and the
independent variables in each of the regression analyses; a sig value of >0.05 indicated
that the null hypothesis cannot be rejected and the data are homoscedastic. For all the
regression analyses run, the data was homoscedastic, as per Table 48 in Appendix E.1.
Assumption 6: The data must not show multi-collinearity, which occurs when two
or more independent variables are highly correlated with each other
All regressions collinearity statistics had low tolerances and VIF (variance inflation factor)
values within acceptable range, where tolerances are >0.1 and VIF<10 (Hair, 1995)
Assumption 7: Data must not contain any significant outliers or high influence
points
All outliers were removed from the dataset, as discussed in Chapter 4.
Assumption 8: All the residuals (errors) are approximately normally distributed
Tests for normality were conducted for the residuals from each regression (see Table 49
in Appendix E.1), with most of the residual data being normally distributed. The exceptions
were two moderator variables, i.e. Sales – EA and DCE, and Sales – EA and DOS. Due
to all the other assumptions being met for the remaining 22 regressions, the researcher
decided to continue with the analysis with consideration of the impacts on type 1 and type
2 errors for these two regressions.

78
5.10.1.1 Moderated regression results for DV, sales
Table 19 below provides a summary of the moderated regression results for the
dependent variable sales. For the detailed regression tables, please refer to Appendix E.2.
The results indicate three significant moderating effects, which are for digital technological
embeddedness (p <0.05; β = 0.28), leadership support (p <0.05; β = 0.24), and digital
insights (p <0.05; β = 0.32). The regression models explained 29%, 23% and 29% of the
variance respectively for the above moderating effects.
Table 19: Summary of moderating effects of digital maturity for EA and Sales
Moderation Coefficient Regression Model
DV IV MV Moderation effect (Y/N) P value Coefficient
Adjusted R2
P value
Sales EA DTE Y 0,01 0,28 0,29 0,00
Sales EA DTS N 0,34 0,11 0,22 0,00
Sales EA DCE N 0,08 0,21 0,23 0,00
Sales EA LS Y 0,05 0,24 0,23 0,00
Sales EA DOS N 0,18 0,16 0,21 0,00
Sales EA DI Y 0,01 0,32 0,29 0,00
These moderating effects are shown graphically below:

79
Figure 7: Moderating effect of DTE on the relationship between EA and Sales
Figure 7 shows the moderating effect of DTE on EA and Sales. An increase in DTE
increases the slope of the Sales vs. the EA relationship. This implies that an increased
DTE positively improves the effect of EA on Sales.

80
Figure 8: Moderating effect of LS on the relationship between EA and Sales
Figure 8 shows the moderating effect of LS on EA and Sales. An increase in LS increases
the slope of the Sales vs. EA relationship, which implies that an increase in LS positively
improves the effect of EA on Sales.

81
Figure 9: Moderating effect of DI on the relationship between EA and sales
Figure 9 shows the moderating effect of DI on EA and Sales. At low levels of DI, the
relationship between Sales and EA is negatively sloped. As DI increases, the relationship
becomes positive and increases the slope of the Sales vs. the EA relationship. This implies
that an increase in DI positively improves the effect of EA on Sales, whereas without DI
or with low levels of DI, the relationship between EA and Sales is negative.
5.10.1.2 Moderated regression results for DV, market share
Table 20 provides a summary of the moderated regression results for the dependent
variable, market share. For the detailed regression tables, please refer to Appendix E.3.
All the regression models were significant (p<0.05); the results indicate just one significant
positive moderating effect, which was for digital culture embeddedness (p <0.05; β = 0.24).
The regression model explains 20% of the variance between DCE, EA and Market share,
which is considered low.

82
Table 20: Summary of the moderating effects of digital maturity on EA and Market Share
Moderation Coefficient Regression Model
DV IV MV Moderation effect (Y/N) P value Coefficient
Adjusted R2 P value
Market Share EA DTE N 0,55 0,07 0,17 0,00
Market Share EA DTS N 0,86 -0,02 0,16 0,01
Market Share EA DCE Y 0,04 0,24 0,20 0,00
Market Share EA LS N 0,40 0,11 0,14 0,01
Market Share EA DS N 0,39 0,10 0,15 0,01
Market Share EA DI N 0,10 0,20 0,19 0,00
The moderating effect of digital culture embeddedness on EA and market share is shown
graphically below:
Figure 10: Moderating effect of DCE on the relationship between EA and Market share

83
Figure 10 shows the moderating effect of DCE on EA and Market share. At low levels of
DCE, the relationship between Market share and EA is almost flat, with a very small
positive slope. As DCE increases, the relationship becomes positive and increases the
slope of the Market share vs. the EA relationship. This implies that an increase in DCE
positively improves the effect of EA on Market share.
5.10.1.3 Moderated regression results for DV, profit
Table 21 below indicates a summary of the moderated regression results for the
dependent variable, Profit. For the detailed regression tables, please refer to Appendix
E.4. All the regression models were significant (p<0.05); the results indicate no significant
moderating effects, with no coefficients being statistically significant (p>0.05).
Table 21: Moderated regression results for the DV, profit
Moderation Coefficient Regression Model
DV IV MV Moderation effect (Y/N) P value Coefficient Adjusted R2 P value
Profit EA DTE N 0,93 0,01 0,10 0,03
Profit EA DTS N 0,90 0,02 0,10 0,03
Profit EA DCE N 0,47 0,09 0,10 0,03
Profit EA LS N 0,15 0,18 0,17 0,00
Profit EA DOS N 0,77 0,04 0,08 0,05
Profit EA DI N 0,42 0,10 0,09 0,04
5.10.1.4 Moderated regression results for DV, ROI
Table 21 below indicates a summary of the moderated regression results for the
dependent variable, ROI. For the detailed regression tables, please refer to Appendix E.5.
All the regression models were significant (p<0.05); the results indicate no significant
moderating effects with no coefficients being statistically significant (p>0.05).

84
Table 22: Moderated regression results for the DV, ROI
Moderation Coefficient Regression Model
DV IV MV Moderation effect (Y/N) P value Coefficient
Adjusted R2 P value
ROI EA DTE N 0,76 0,04 0,13 0,01
ROI EA DTS N 0,88 0,02 0,19 0,00
ROI EA DCE N 0,08 0,22 0,18 0,00
ROI EA LS N 0,06 0,24 0,21 0,00
ROI EA DOS N 0,15 0,17 0,17 0,00
ROI EA DI N 0,10 0,20 0,17 0,00

85
Chapter 6: Discussion of results
6.1 Introduction
The purpose of the research was to understand the relationship between DM and EA on
firm performance for firms undergoing DTs, and as well as the effect of DM on the EA and
firm performance relationship. This chapter discusses the results obtained in the study
relative to the research questions and hypotheses developed in Chapter 3 which was
guided by the literature review in Chapter 2. The results are discussed in the context of
the theoretical lens which is the resourced based view of the firm and dynamic capabilities.
Comparisons with extant literature will be made to describe the relationships between
constructs and to draw insights from the study.
6.2 Research question 1: What is the relationship between entrepreneurial agility and firm performance?
The purpose of this research question was to understand whether EA as a dynamic
capability in a firm can improve firm performance within digital transformations. The results
indicate that across all constructs of firm performance which are sales, market share, profit
and ROI, that there were significant positive correlations. This is as expected in the study
which is agreement with prior literature showed positive relationships between EA and
overall firm performance (Chakravarty et al., 2013) and positive relationships between EA
and a firm’s competitive position (Sambamurthy et al., 2007), however these results
extends the findings to digital transformations. This supports the framework by Vial (2019)
where EA was described as a mechanism for new value creation paths in a digital
transformation and Verhoef et al. (2019) that indicates agility as an important capability
for firms undergoing digital transformations. This finding also agrees and is supported by
theory through the DCF (Teece & Pisano, 1994; Teece et al., 2016). The ability of EA to
improve firm performance may be described by its ability to enhance first mover and
prospector/analyser strategies (Miles et al., 1978; Zachary et al., 2015) which has been
observed to improve firm performance (Fitzgerald et al., 2013; HBR Analytic Services,
2014). This corroborates with the findings in this study. Similarly EA may through proactive
sensing of the market, rapidly produce products better suited to customer needs in
changing environments, hence this may improve customer satisfaction through the
customer engagement and digitized solutions strategies that are typical of common DBS’s

86
(Sebastian et al., 2017). These DBS strategies have been found to improve firm
performance which corroborates with the findings in the study. The next sections discuss
the results in terms of sales, market share, profit and ROI.
6.2.1 Entrepreneurial agility and sales
The positive correlation between EA and increase in sales relative to competitors (r =
0.502, p <0.05) is supported by the DCF (Teece & Pisano, 1994; Teece et al., 2016) where
EA as a dynamic capability may enhance competitive advantage of firms. Similarly the
work done by Sambamurthy et al. (2007) also indicated the postive relationship between
entrepreneurial agility and competitive position of firms particularly in changing
environments which supports the DT context of this study.
EA may enhance sales in a DT both in being able to proactively sense the market and
also being able to rapidly respond to customer needs. The ability to sense market changes
and trends in proactive way has benefits for the firm in creating superior knowledge of the
market and customers ahead of competitors which may provide a valuable, rare and hard
to imitate resource (Barney, 1991) that leads to competitive advantage and improved firm
performance (Cegarra-Navarro, Soto-Acosta, & Wensley, 2016; Chung, Liang, Peng, &
Chen, 2010; Liu et al., 2014) which is supported in this study. This may enable firms to
create products that are aligned to customer needs and as a result improve customer
satisfaction through improved perception of value and quality (Mithas et al., 2016). Some
of the benefits of improving customer satisfaction in digital transformations have been
discussed by several authors (Fitzgerald et al., 2013; Gurumurthy et al., 2020; HBR
Analytic Services, 2014; Westerman & Mcafee, 2012). Similarly, sales may increase when
rapid responses to opportunities may result in more frequent innovative digital products or
services being produced, which may improve customer satisfaction and firm performance
(Mithas et al., 2016; Otto et al., 2020; Sambamurthy et al., 2007) through the customer
engagement and digitized solutions strategies of the DBS (Sebastian et al., 2017).
These proactive sensing capabilities and rapid responses may enable proactive strategies
like first mover/prospector strategies which enable first/second mover advantages. The
reasons are that early entrants may establish customer base, loyalty, learning from

87
customers and also impose buyer switching costs from competitors who have to invest to
gain market share (Feng & Feng, 2020; Lieberman & Montgomery, 1988).
6.2.2 Entrepreneurial agility and market share
Similarly increased market share relative to competitors is considered a measure of
improved competitive advantage (Edeling & Himme, 2018). The positive correlation
between EA and market share (r = 0.502, p <0.05) is supported by the DCF (Teece &
Pisano, 1994; Teece et al., 2016) where EA as a dynamic capability can enhance
competitive advantage of firms. According to Edeling & Himme (2018), market share in an
organisation is the share of the total market either monetary or volume. Similarly to sales,
if an organisation is generating more market share relative to its competitors, it is an
indication of customer preference to their products and services over their competitors
(Edeling & Himme, 2018) which is driven by improved customer satisfaction (Otto et al.,
2020). Similarly as firm’s progress through a DT, being able to sense customer needs in
terms of digital products or services that may add value to them, firms may introduce new
product offerings which may differentiate themselves from their competitors. These may
increase their perceived levels of innovation and value which can increase customer’s
perception of value which links to improved customer satisfaction, loyalty and trust (Otto
et al., 2020). This in turn may improve metrics customer lifetime value, word of mouth
marketing and increasing the share of the customer’s wallet which improves market share
(Otto et al., 2020). This is provided their offerings are unique and not easily imitated. For
example, the use of digital assistants and remote experts in the retail industry who can
communicate with customers in real time about products through video conferencing to
enhance the overall customer experience. These are differentiated benefits that may draw
customers to a firm’s product, if their perceived value from that product exceeds others.
6.2.3 Entrepreneurial agility and Profit
The increase in profit relative to competitors is a measure of competitive advantage of
firms (Newbert, 2008). The results also show that profitability had a positive correlation
with EA profit (r = 0.331, p <0.05) which was expected based on the DCF (Teece & Pisano,
1994; Teece et al., 2016) where EA as a dynamic capability may enhance competitive
advantage of firms in DT. EA however had the weakest correlation with profit compared
to other measures. This may be expected as an outcome of proactive and prospective
88
strategies (Miles, Snow, Meyer, & Coleman Jr., 1978) where more frequent responses to
changes is favoured over driving efficiencies. This supports the findings in the study.
Hence firms may proactively release several products to customers to favour sales and
market share ahead of profitability (Edeling & Himme, 2018). This may be the case for
firms trying to enter a new market or developing new markets identified through the DBS
(Bhadradwaj et al., 2013). However, the benefits EA provides in terms of enabling
prospector/analyser strategies may allow firms to benefit from first and second mover
advantages which may result in them enjoying economic rents of high profitability until
new market entrants compete (Feng & Feng, 2020), this can improve firm profitability and
competitive advantage.
6.2.4 Entrepreneurial agility and ROI
An increase in a firm’s ROI relative competitors is considered a competitive advantage
because the firm is able to generate a higher return on their investment. The results
indicate a positive relationship between EA and ROI (r = 0.403, p < 0.05) which was
expected based on the DCF (Teece & Pisano, 1994; Teece et al., 2016) where EA as a
dynamic capability can enhance competitive advantage of firms in DT. ROI was expected
to be strongly correlated through improved decision making through the sensing
capabilities of EA support by creating superior knowledge for the firm (Chung et al., 2010)
which enables the right investments and the ability to rapidly respond and capitalise on
these opportunities particularly in a DT (Fitzgerald et al., 2013; Sebastian et al., 2017;
Westerman & Mcafee, 2012).
6.3 Research question 2: What is the effect of digital maturity on the relationship between EA and firm performance for firms in DT?
The purpose of this research question was to understand what effects digital maturity has
on the relationship between EA and firm performance. In a DT, a firm is developing digital
resources and capabilities as required by the DBS. As the level of DM increases it is
expected that these digital resources and capabilities will improve in firms as they execute
and adapt their DT strategies as required by the DBS (Chanias et al., 2019).
Factor analysis was done in Chapter 5 on the sub-constructs of DM which reduced the
constructs digital technology into two constructs digital technology embeddedness (DTE),

89
and digital technology strategy (DTS). Digital culture was reduced into digital culture
embeddedness (DCE) and leadership support (LS). Digital organisational structure (DOS)
and digital insights (DI) were reduced to one construct respectively. The results are
discussed below in order of the dependant variables in the study.
6.3.1 Effect of digital maturity on EA and sales
The results indicate that there are three significant moderating effects (at 95% confidence)
which are DTE (β = 0.28, p<0.05), LS (β = 0.24, p < 0.05) and DI (β = 0.32, p<0.05). DI
appears to have the strongest moderating effect, followed by DTE and LS.
6.3.1.1 The moderating effect of digital technological embeddedness on the
relationship between EA and sales.
The results indicate that digital technological embeddedness in firms has a positive
moderating effect (β = 0.28, p<0.05) on the relationship between EA and sales. This
relationship is explained by Figure 7, and implies firms with higher DTE would have a
stronger relationship between EA and Sales. The results indicate that firms with higher
levels of adoption of digital technologies can expect higher competitive advantages
reflected in sales for the same levels of EA. This finding aligns with the expectations of
the study which describes that higher digital technology embeddedness in the firm will
enable more advanced digital resources and capabilities due to more advanced digital
technologies. The implications are that DTE can enhance the firm’s capability to
proactively be able to pick up trends in the market, this can relate to customer trends,
industry trends or global trends (Chanias et al., 2019; Teece, Pisano, & Shuen, 1997;
Teece et al., 2016). For example, the big data analytics capabilities can improve the ability
of firms to better sense market opportunities, understand customer needs and correctly
respond to them (Wamba et al., 2017). Similarly the use of social media platforms and
interacting with customers through digital technologies like CRM tools or apps can
enhance customer satisfaction which supports the customer engagement strategy of the
DBS (Sebastian et al., 2017). The improvement of customer satisfaction will lead to
improved sales (Anderson & Ellerby, 2018; Gurumurthy et al., 2020; Kane et al., 2017;
Westerman & Mcafee, 2012).
90
Higher adoption of digital technologies can provide more advanced digital infrastructures
and capabilities which can be used to rapidly develop new products and services through
rapid prototyping and innovation processes (Chanias et al., 2019; Sebastian et al., 2017).
For example through using digital platforms and cloud computing, can support rapid
prototyping and scaling up of products. This can support the digitized solutions strategies
of the DBS (Sebastian et al., 2017) to supply more innovative digital products, services or
features required by the market.
6.3.1.2 The moderating effect of digital insights (DI) on the relationship between EA
and sales
The results indicate that digital insights has a positive moderating effect (β = 0.32, p<0.05)
on the relationship between EA and Sales. This moderating effect is the highest when
compared to digital technology and leadership support, which may be attributed to to
enhancing the sensing capabilities of EA by providing superior knowledge and a
competitive advantage (Barney, 1991). This is due to the importance of firm’s having the
right insights to make correct decisions. This superior knowledge may enable proactive
strategies prospector/analyser strategies especially with changing environments which
corroborates with improving sales and firm performance (Miles et al., 1978; Zachary et al.,
2015).
The moderating effect was shown in Figure 8. It can be seen at low levels of DI, the
relationship between EA and Sales is negatively sloped, where increasing EA may result
in lower sales relative to competitors. This is an interesting finding and could describe the
importance of digital insights in enhancing the sensing capability of EA, as described
above. It can be rationalized in the following way, if a firm has low levels of digital insights,
it may result in the incorrect interpretation of opportunities. This may result in the
organisation responding to incorrect information and therefore not be able to capitalise on
the opportunities explored and lose sales with customers because their needs were not
well understood. This corroborates with Westerman & Davenport (2018) which indicated
indicate some of the reasons for failed DT initiatives included lack of management
understanding of the opportunity.

91
With higher digital insights the slope of the EA and firm performance becomes positive
and continues to increase in slope with increasing digital insights. Similarly, this is an
indication that digital insights enhances the effect on EA, and considering digital insights
provides superior knowledge, this enhances the sensing component of EA. At higher
levels of digital insights, a firm may benefit from having superior knowledge compared to
competitors which provides a VRIN resource to firms in a DT. This may provide superior
knowledge about customers. This may result in rapidly pursuing opportunities more
closely aligned to the required customer needs and therefore increase the ability of firms
to capitalise on their opportunities. Examples of these applications include the use of smart
connected devices by manufacturers which through the use of the internet can capture
valuable insights about their product usage, customer behaviour and further
improvements which can be made to their products (Porter & Heppelmann, 2015). These
new digital insights from the data may feedback into the firm to improve product life and
adapt their products to customer needs which may improve customer satisfaction. . Other
sources of revenue could result from the data generated, for example smart connected
devices in cars can provide traffic related information from the vehicles can attract atypical
customers like government who may benefit from this information in their infrastructure
planning (Hanelt et al., 2015).
6.3.1.3 The moderating effect of leadership support (LS) on the relationship between
EA and sales
The results obtained indicate the positive moderating effect of LS (β = 0.24, p<0.05) on
the relationship between EA and Sales. At low levels of LS, the slope of the relationship
between EA and Sales, is positive but low, as LS increases the slope gets increasingly
steeper indicating that LS increases the strength of the relationship between EA and sales.
This may be explained by the role of management in enhancing EA as a dynamic
capability which describes the ability of firms to take the opportunities discovered in the
sensing step, and being able to co-ordinate and re-organize themselves to take advantage
of them (Teece et al., 2016). Within a DT, internal resources such as culture, digital
organisational structure, human resources, technology, knowledge processes are being
configured and changed by the organisation’s leadership and management teams to
capitalise on the market opportunities offered by digital technologies (Vial, 2019, Teece et
al., 2016). However, this change may conflict with the organisation’s existing processes,

92
systems and culture which can cause organisational inertia or resistance to change (Vial,
2019; Chanias et al., 2019) which requires senior leadership support to overcome.
Having the support from senior leadership has also been found to be critical to drive the
DT process and the implementation thereof (Kane et al., 2016, 2017; Nickisch, 2019) and
indicative of more digitally mature firms, which corroborates with the results. For example,
leadership support would help drive the development of new digital products and services
especially with an existing pipeline of traditional products and services still in operation,
managers within the firm may prioritise traditional offerings over the digital offerings due
to a legacy culture which requires leadership support to drive (Chanias et al., 2019). The
improved leadership support, particularly if it’s made public that the firm is digitally
transforming, may attract other industry players to want to partner with the firm for digital
projects (Chanias et al., 2019). This may present opportunities that EA can leverage to
increase sales.
6.3.1.4 Effect of digital technology strategy, digital culture embeddedness and
digital organisational structure on the relationship between EA and sales
The results indicate that there is no moderating effects between DTS, DCE and DOS on
the relationship between EA and Sales. This indicates that the relationship between EA
and Sales in unaffected by these constructs. This is contrary to the expectation of the
literature review (Anderson & Ellerby, 2018; Fitzgerald et al., 2013; Kane et al., 2016,
2017) which anticipated that developing these digital resources and capabilities would
enhance the sensing and/or seizing capability of EA which translates into better sales.
Considering the industry types in the sample, which were largely mining, financial
services, automotive and manufacturing; majority of firms in these industries may have
not fundamentally transformed their business models yet (Hanelt et al., 2015; Sebastian
et al., 2017; WEF, 2017) which may be due to industry specific inertias or barriers (Gao et
al., 2019; Vogelsang et al., 2019) and organisational inertias which may be inhibiting their
effects on EA (Warner & Wäger, 2019). This is described by Remane et al. (2017) which
emphasizes that perhaps the hype of digital maturity created by practice based literature
may be an oversimplification and overstating of their value in the more complex
organisational transformative changes. These results may corroborate with some of the
concerns raised by Remane et al. (2017) and perhaps the need for more construct
definition and clarity in the use of digital maturity as a gauge for general firm progress in

93
a DT and its impact on enabling fundamental transformative changes required to enhance
EA.
6.3.2 Effect of digital maturity on entrepreneurial agility and market share
6.3.2.1 The moderating effect of digital culture embeddedness (DCE) on the
relationship between EA and market share
The results indicate a positive moderating effect (p <0.05; β = 0.24) between DCE and the
relationship between EA and market share. Figure 10 shows the moderating effect of DCE
on EA and Market share. At low levels of DCE, the relationship between Market Share
and EA is almost flat with a very small positive slope. As DCE increases, the relationship
becomes positive and increases the slope of the Market share vs. EA relationship. This
implies with low digital culture embedded, the firm is less likely to see a benefit from EA
on market share. As the DCE increases the relationship between EA and market share
becomes stronger.
DCE is enhanced by having the right leaders on a day to day basis, investing in digital
training and education, collaborative teams and having measured risks for innovation.
Similarly this encompasses an innovation focus, engaged and collaborative work
environments, and a willingness to experiment with new ideas which have been reported
to improve DT and firm performance which corroborates with the findings in literature
(Chanias et al., 2019; Dremel et al., 2017; Kane et al., 2016; Vial, 2019). These attributes
of DCE is suitable for changing environments like that of a DT and can be expected to
support quick responses required by the firm (Vial, 2019). Hence EA may be enhanced
by DCE in being able to more easily configure the human resources in the firm to rapidly
execute the opportunities identified. The availability of digital skills from employees, and a
collaborative workforce may be expected to execute better when the environment
changes (Chanias et al., 2019; Gurumurthy et al., 2020; Kane et al., 2017; Vial, 2019) and
through innovation processes like rapid prototyping to create new products or services
(Sebastian et al., 2017) which may be an outcome of EA. Providing more innovative
offerings to customers has been strategies firms have used to gain additional market share
(Otto et al., 2020) through improved customer satisfaction (Chen, Preston, & Swink, 2015;
Feng & Feng, 2020). This corroborates with the findings in this analysis.

94
6.3.2.2 Effect of DTE, DTS, LS, DOS and DI on the relationship between EA and
market share
The remainder of the digital maturity constructs which are digital technology
embeddedness, digital technology strategy, leadership support, digital organisational
structure and digital insights were found to have no moderating effects between EA and
market share. This is contrary to the expectations in this study which were that these
capabilities would enhance of EA in capturing more market share (Gurumurthy et al.,
2020; Fitzgerald et al., 2013, Westerman & Mcafee, 2012, HBR Analytics, 2014). A closer
examination of the sample demographics showed the firms in the study were from
traditional industries that were asset intensive and people intensive like mining, financial
services, manufacturing and automotive. Possible reasons for why these digital
capabilities did not enhance EA and market share relationships, as well as considering
that there were no moderating effects on Profit and ROI across all the DM constructs will
be discussed below.
6.3.3 Effect of digital maturity on EA and profit and ROI
There were no moderating effects between all the constructs of digital maturity which are
digital technology embeddedness, digital technology strategy, digital culture
embeddedness, leadership support, digital organisational structure and digital insights on
the relationship between EA and Profit as well as ROI. This does not agree with literature
(Chanias et al., 2019; B. M. Fitzgerald et al., 2013; Kane et al., 2016, 2017; Vial, 2019;
Westerman & Mcafee, 2012) and reasons for this may include the industry types in the
sample. The predominant industries in the sample were mining, financial services,
automotive and manufacturing. These industries are still considered to be in the early
stages transforming their business models and themselves from their core products
(Kane, Palmer, Phillips, Kiron, et al., 2015; Sebastian et al., 2017; WEF, 2017) and are
still largely selling traditional products in their markets. The possible reasons for these
findings are discussed below:
The report by Kane, Palmer, Phillips, Kiron, & Buckley (2015) on the digital maturity scores
of industries placed IT and technology firms at the top of digital maturity. A separate report
by HBR analytic services reported that the majority of firms that capitalised on first mover
advantages and that transformed their business models were those in the technology

95
industry, and less so in the financial services, manufacturing and the public sector. The
technology industry was also the most “digitally transformed” in terms of their business
model changes. In addition, there were trends with the industry types where majority of
technology firms were in the pioneer category, financial services were followers, and the
least likely industry to be pioneers were the public sector (HBR Analytic Services; 2014).
Hence indicating that the industry type and industry digital maturity level may play a role
in influencing the EA and firm performance relationship, and whether the DM measure is
a realistic comparison of digital maturity for traditional firms.
The recent paper by Gao, Hakanen, Töytäri, & Rajala (2019) provides insights on digital
transformation in physical asset intensive industries specifically mining and metals
industries. The results showed that digital transformation is inhibited by four aspects lack
of capabilities to change, goal ambiguity, technological constraints, and external
constraints such as legislation. These were specific to the nature of the environment for
example, access to basic IT services like Wifi underground, change management across
the organisation, legacy technology systems, and legislative restrictions (Gao, Hakanen,
Töytäri, & Rajala, 2019). Hence these barriers could be responsible inhibiting these digital
resources and capabilities from being developed, and also limiting their use across the
entire organisation. Similar findings were found by Vogelsang, Liere-netheler, & Packmohr
(2019) for manufacturing industries where in addition to the above, lack of industry related
skills was identified as an inhibitor. Hence this was indicative that possibly with industry
specific challenges with digital transformations in their specific industries, digital maturity
may be more unique to firms rather than a general measure of progress on digital
transformations that firms should aspire towards. Furthermore, this indicates that current
views on digital maturity may place unrealistic expectations on certain industries because
of the industry specific organisational inertia both internally to the firm and externally which
may inhibit the overly stated value of digital maturity in these firms (Remane, Andre, et al.,
2017). This aligns with the assertion Remane et al. (2017) that the digital maturity path
may be different for different industries.
This also aligns with the work done on dynamic capabilities in digital transformations by
Warner & Wäger (2019) which indicated that internal organisational factors like rigid
strategic planning, high levels of hierarchy, and change resistances may be barriers to
dynamic capabilities in the DT process. This may be more pronounced for traditional
industries due to the legacy of entrenched cultures and behaviours that may require time

96
through a process of continued strategic renewal (Warner & Wäger, 2019). As Warner &
Wäger (2019) indicates before more significant changes to deeply entrenched beliefs like
culture and traditional business models can take time. Remane et al. (2017) describe
factors like management perception and cognitive path dependencies of management that
need to be overcome, where DM as a measure of DT progress in a firm may overlook and
oversimplify.
Similarly Teece (2007) indicates that these biases may influence the way organisations
make decisions traditionally on investing on new innovations, because these are
traditionally managed through project finance and corporate finance methods which are
rule based and subject to assumptions of project cash flows and understanding of the
value cases in their business. In DT, particularly with traditional firms that are physical
asset intensive, the value cases for physical products may be easier to model than the
value cases for intangible assets like digital insights or sensing. Teece (2007) indicates in
these cases management judgement and decision making skills take precedence. This
aligns with Remane et al. (2017)’s argument around the management perception and
cognitive path dependencies that may need to shift, and well as the internal barriers
(Warner & Wäger, 2019) that may inhibit dynamic capabilities and the renewal of more
fundamental changes required for traditional firms. Hence in their context, DM may not
have consideration of all the complexities involved in transforming their organisation
towards achieving the benefits that are described in digital transformations. This may be
why majority of firms embark of DT initiatives and few have seen the expected benefits of
it (Sutcliff et al., 2019; Westerman & Davenport, 2018).
Hence an important consideration is the benefits that are stated for digital maturity models
because they take a “blanket approach” across several industries (Remane et al., 2017).
Several reports show significant benefits of digital transformation but these link to firms
changing their business models as an outcome (HBR Analytic Services, 2014; Kane,
Palmer, Phillips, Kiron, et al., 2015) which may be required to manage disruptive change
and achieve the stated benefits (Bughin & van Zeebroeck, 2017; Matzler et al., 2018).
Hence the benefits of digital maturity could be skewed towards much more fundamental
changes such as business model changes which are challenging for traditional firms. DM
does not consider the industry specific barriers and obstacles particularly for traditional
industries that are still physically asset intensive (Hanelt et al., 2015). This may

97
oversimplify the use of a “global” digital maturity metric as a realistic metric for digital
transformation of traditional firms.
Hanelt et al. ( 2015) describes the digital transformation path relevant to physical asset
intensive industries for their business model change, which business model creation,
extension, revision and termination. The latter two processes require changing existing
processes and which are more challenging because of the uncertainty, ambiguity, path
dependencies, cognitive shifts, and resistance for firms (Cavalcante, Kesting, & Ulhøi,
2011). These can be both firm (Warner & Wäger, 2019) and industry specific (Gao et al.,
2019; Vogelsang et al., 2019) challenges. For example, replacing the parts of the
workforce with automation may encounter internal resistance and inertia or industry
specific regulatory restrictions, which may be not much of a barrier for other less asset
intensive industry types e.g. technology firms. Hence business model changes of these
traditional firms are not commonly seen in digital transformations (HBR Analytic Services,
2014; Fitzgerald, 2013). These challenges may not be considered in the metric for digital
maturity, and as such simplifies its definition of true progress made in digital transformation
particularly with regards to changes in the business models of physical asset intensive
industries. Hence Warner & Wäger (2019) propose that digital transformation may be a
process of continuous renewal of the firms business model. Therefore supporting Remane
et al. (2017) in that digital maturity paths may not be a “one size fits all”.
6.4 Entrepreneurial agility and digital maturity in traditional organisations
The results obtained in the study indicate that entrepreneurial agility correlated positively
with firm performance across the various dimensions of sales, market share, profit and
ROI. This is indicative that proactively sensing, reconfiguring of resources and rapidly
responding to opportunities for these traditional firms can create competitive advantages
and improved firm performance particularly in digital transformations. This research
extends the application of entrepreneurial agility to the context of digital transformation to
help understand this complex phenomenon and how firms can achieve competitive
advantages. The research however does not deal with the antecedents of entrepreneurial
agility in digital transformations in this study. This may form part of future research to
understand how firms can develop this capability in order to leverage it for competitive
advantage in a DT context.
98
Traditional firms also have industry specific and firm specific organisational challenges
and inertias that may inhibit entrepreneurial agility as a dynamic capability which may
compete with the digital capabilities that are being built as a firm undergoes digital
transformation (Gao, Hakanen, Töytäri, & Rajala, 2019; Vogelsang, Liere-netheler, &
Packmohr, 2019; Warner & Wäger, 2019). Hence the use of “global” digital maturity as a
measure of the progress of the firm’s digital transformation may be misleading and present
unrealistic expectations of firm performance (Remane et al., 2017). Whilst there were
some moderating effects of the capabilities created through digital maturity on sales and
market share, majority of these capabilities did not have moderating effects. The
implications of this for firms, is that there may be oversimplification of the expectations of
the digital maturity path that firm’s take. Hence a one size fits all measure of digital maturity
may not be indicative of the firm specific and industry specific realities of progress made
in a firms digital transformation. This is relevant for traditional organisations that have
challenges with legacy cultures, systems and industry challenges that inhibit the
fundamental changes to their business models. The best performing firms in terms which
are being compared are firms in the technology industries which may have different
organisational challenges and industry barriers which enables them to be more
entrepreneurially agile to change their business models fundamentally. However these
challenges are not the same for traditional firms and should not be used as the same
yardstick. Hence further research should explore the construct definition of digital maturity
to understand the scope of its use as a measure of firms to gauge their progress in digital
transformations.

99
Chapter 7: Conclusions
7.1 Introduction
The purpose of this chapter is integrate the findings and literature into a cohesive set of
conclusions in order to effectively answer the research questions. This chapter
synthesises those conclusions into the contributions of this study to theory as well as the
business implications of the study, as discussed in the research objectives in Chapter 1.
The limitations of this study are also discussed, as are recommendations for future
research.
This study aimed at answering the overall research question, which was: “What is the
effect of digital maturity and entrepreneurial agility on the performance of traditional firms
undergoing DT initiatives?”
7.1 Contributions to theory
7.1.1 Effect of EA on firm performance
The results in this study indicated that EA is positively correlated with firm performance
across all the constructs of sales, market share, profit and ROI. This indicates that EA is
an important source of competitive advantage for firms undergoing a digital
transformation.
The effect of entrepreneurial agility on firm performance and competitive advantage was
established in the information systems (IS) literature (Chakravarty et al., 2013; Lu &
Ramamurthy, 2011; Sambamurthy et al., 2003; 2007; Tallon et al., 2019). However, the
capabilities created in a DT are much broader and more integrated into the firm’s business
strategy (DBS), as opposed to a functional IT strategy that supports the business strategy
(Bhadradwaj et al., 2013; Chakravarty et al., 2013; Sambamurthy et al., 2003; Tallon et
al., 2019). To the researcher’s knowledge, this effect of EA on firm performance within a
DT has not been empirically determined, with recent literature noting the importance of
entrepreneurial agility in DTs (Verhoef et al., 2019; Vial, 2019). A contribution to the body
100
of knowledge by this research is the extension of the existing theory of entrepreneurial
agility and firm performance to the digital transformation context.
7.1.2 Effect of DM on the relationship between EA and firm performance
The study showed that there were some positive moderating effects between the variables
digital technology embeddedness, digital insights and leadership support on the EA and
sales relationship. Similarly, there was a positive moderating effect between digital culture
embeddedness and the relationship between EA and market share. These may be due to
the customer engagement strategies that are commonly executed through the DBS, which
may provide these competitive advantages through improved customer satisfaction.
However, the study showed that the majority of the DM variables did not have moderating
effects on firm performance through sales (DTS, DOS, DCE) and market share (DTE,
DTS, LS, DOS, DI). None of the DM variables (DTE, DTS, DCE, LS, DOS, DI) moderated
the relationships between EA and profit, or EA and ROI. This may be due to the
organisational barriers (Warner & Wäger, 2019) and industry related barriers (Gao et al.,
2019; Vogelsang et al., 2019) associated with traditional firms.
The effects of DM on EA and firm performance have not been studied widely in the
literature, although Chakravarty et al. (2013) showed that IT competencies can have a
moderating effect between entrepreneurial agility and firm performance. This was not in a
DT, however, and there has not been any literature measuring the moderating effects of
the broader capabilities associated with DM on EA and firm performance (Vial, 2019).
Researchers have highlighted the relevance of some of the interactive relationships
between aspects of digital organisational structure and culture on enhancing agility in DT,
but this has not been tested empirically (Verhoef et al., 2019; Warner & Wäger, 2019).
Hence this provides an empirical assessment of the moderating effects based on the
current definitions of DM in literature.
These findings also support those of Remane et al. (2017), who studied the complexity
and scope of use for the digital maturity construct in traditional industries, which may
currently be an oversimplification of the complexities involved in DT. As a result, some of
the stated benefits of DM may be unrealistic expectations for traditional firms, because
technology firms may be used as a benchmark for DM and may not share the same
organizational and industry barriers to fundamentally changing their business models.

101
7.2 Implications for managers
7.2.1 Potential benefits of EA for managers
Considering the positive relationships between EA and firm performance, firms
undergoing DT should thus consider developing EA as a dynamic capability to allow the
changes occurring within the DT process to be leveraged via the DBS to create new
opportunities. Teece et al. (2016) indicated that there are two requirements for effective
dynamic capabilities, i.e. a management team that is entrepreneurially minded and a
platform that is flexible and can easily be reconfigured by the management team. EA
would therefore need to be driven from the top down from senior leadership, but also
supported from the bottom up where the resources and structure of the firm allow for a
rapid response to opportunities identified in the changing environment. Therefore, within
a DT, EA should be leveraged as well as targeted as part of the organisational capabilities
and strategies that are desired by leaders through the DBS. EA will enhance the ability of
firms to adopt more proactive market strategies in a DT, such as the first mover and
prospector/analyser strategies, which can be included in the firm’s DBS.
These strategic changes in an organisation would need to consider the risk appetite of the
organisation because rapid responses to market changes will also bring risks of uncertain
market responses. Leaders with a low risk appetite or low risk tolerance may not be willing
to experiment or take risks in completely unchartered territories where typical
entrepreneurs at times find themselves. At the organisational level, therefore, EA will
require a change in strategic mind-set, risk tolerance and a longer term view, which may
be an iterative process of development rather than a linear one.
For firms that are in defender/reactor strategies currently and trying to develop digital
capabilities and resources in their DT strategy, EA may be a strategic organizational
dynamic capability that is required to enable improved firm performance in digital
transformations (Miles et al., 1978). Considering the disruptive effects of digital
technologies and the changes in the environment, this would be a consideration for firms
that are looking to remain competitive in the longer term.

102
7.2.2 Potential issues with using only digital maturity to measure levels of digital
transformation for managers in traditional organisations
The use of digital maturity as a measure of digital transformation, as well as its correlation
with firm performance, has been widely published in practice based literature and by
management consultants (Anderson & Ellerby, 2018; Gurumurthy et al., 2020; Kane et al.,
2015; 2017; 2016). While there are benefits of DM, as were seen through some of the
moderating effects of EA on market share and sales in this study, these can occur through
improved customer engagement and interaction strategies in the DBS. These may not
provide the full suite of expected benefits that come from transforming an organisation’s
business model (Bughin & van Zeebroeck, 2017; Fitzgerald et al., 2013; HBR Analytic
Services, 2014; Teece, 2018; Westerman & Davenport, 2018).
Other factors that might impact the use of digital resources and capabilities developed in
a DT may be at the organisational and industry levels, particularly for traditional firms (Gao
et al., 2019; Vogelsang et al., 2019; Warner & Wäger, 2019). The majority of the benefits
in DM have been reported using technology companies as benchmarks of high DM (HBR
Analytic Services, 2014; Kane et al., 2015), which may be able to more easily transform
their business models because they do not have the same barriers to changing their
business models as traditional firms. Similarly, a linear path to digital maturity is assumed
(Remane, et al., 2017), but this seems unlikely for traditional firms which may need a
continuous state of renewal of its digital transformation over time as it aims to change its
legacy business models and cultures (Warner & Wäger, 2019).
Managers may also need to change their cognitive processes in terms of how they view
their organisation and the long term strategic plans needed to overcome any barriers.
Traditional firms that are developing these digital capabilities but are not able to
fundamentally change their business models because of these barriers may not realise
their expected returns. It may well be that the existing organisation may take too long
before it is able to proactively and rapidly take advantage of the digital capabilities it
develops, due to these barriers. Other strategic decisions to capitalise on EA may be more
beneficial in the short term to compete in the digital environment. Some traditional
organisations are starting to develop completely new business units separate from the
parent firm, e.g. BMW-Daimler is creating a new business unit for mobility services,
Goldman Sach’s Marcus and Wells Fargo’s greenhouse (Gurumurthy et al., 2020). These

103
are two fully digital banking offerings for their customers that operate as a separate entity
to their parent firm. Marcus by Goldman Sachs was launched in 2016, and has seen
significant growth by providing a low cost digital banking solution for customers, they had
grown (2016-2019) from 0.2 to 5 million customers, increased their revenue from $2m to
$860m; they are now partnering with the likes of Apple and Google to scale up their
offerings and gain even more efficiencies to reduce costs and increase competitive
advantage (Marcus, 2020). This may be a more viable option for traditional companies
looking to benefit from being able to rapidly respond to a changing market driven by digital
technologies, which the large technology companies (Amazon, Google, Facebook etc.)
are enjoying economic rents from. These strategic options need to be considered in the
DBS to enable the business model to provide value to, and capture value from, customers.
Ultimately, the firm has to be able to create more value for customers as well as
themselves (Teece, 2018) if it is to achieve a competitive advantage over others in digitally
changing world.
7.2.3 Proposed strategic framework for the digital transformation of traditional
organizations
EA
Change
Resistance
Low
High
Low
High
Innovate
Entrepreneurial
Respond
React
Develop digital capabilities outside the organisation
firmfirmporganisation
Develop digital capabilities inside the organisation
Figure 11: Proposed strategic framework for traditional organizations
to consider in digital transformations

104
The above framework is proposed for traditional industries for strategic planning of their
DBS. The purpose is to extend this study’s conclusions into a practical application for
managers of traditional firms so that they are able to leverage entrepreneurial agility and
understand the change barriers to their business models, which can be used to develop
strategic responses for competitive advantage in digital transformations.
There are four stages to the framework, each of which is characterised by the state of the
firm in terms of the levels of change resistance, as well as the level of entrepreneurial
agility. Change resistance includes all the organisational- and industry-related barriers.
The firms with high change resistance and low EA may find themselves in a reactive
strategy. This means that they are threatened by digital disruption because they are
“reactors” in terms of sensing market changes, and are also unable to fundamentally
change their organisation or business model. These firms thus need to understand how
they can overcome these barriers to enable the change, or if they cannot overcome the
resistance and have high entrepreneurial agility, they need to explore developing digital
capabilities outside the organisation as “entrepreneurs”. This may involve developing
these digital capabilities needed for the DBS in an environment that is not constrained by
these change resistances, e.g. by developing a start-up, creating a new division,
purchasing, or outsourcing to a firm that has the required capabilities. This will give these
firms the ability to rapidly capitalise on market opportunities without being constrained by
the parent company. This may also involve developing strategic partnerships with firms
that have the digital capabilities they require.
If firms are able to overcome their change resistance or reduce it, they may build digital
capabilities internally. These may enable them to be “responders” to market changes or
defend their market share or competitive advantage, because they are able to change
their organisation as required by the DBS. Lastly, if firms are able to overcome their
change resistance and build high levels of entrepreneurial agility, they may focus on
innovating and fundamentally changing their business models as “innovators” in order to
better compete in the changing environment. These four options in the framework may
assist traditional firms to develop their strategic options when defining their digital business
strategy.

105
7.3 The limitations of the research
The limitations of this research include the non-probability sampling method used, which
limits the findings to the characteristics of the sample in this study. The sample size was
also a limitation in that only 60 responses were included in the data analysis. This
influenced the likelihood of the researcher making a type 1 or type 2 error in the hypothesis
testing, because of the increased variance associated with smaller samples.
Further, the findings are based on individual responses and thus carry individual bias. The
survey also required individuals to answer on behalf of their organisations, which may
have influenced their responses depending on their experience in the organisation. This
limitation was filtered out by removing individuals with less than a year of experience in
the organisation. The survey approach, which used social media streams such as
LinkedIn, included elements of snowball sampling as the interviewees passed on the
survey to people who may have had similar views, which may have also contributed to
individual bias.
The researcher’s use of only subjective financial measures to measure firm performance
was a limitation. Other views on firm performance such as the “shared value approach”
proposed by Porter and Kramer (2011), which considers social and environmental
performance measures, may have yielded different research outcomes. These measures
may have included constructs such as corporate social responsibility and environmental
and sustainability metrics in the measure of firm performance. These have been reported
as outcomes that other firms are using digital technologies to address (Gurumurthy et al.,
2020). Similarly, this study was based on a fixed number of constructs, i.e. there may be
other constructs that can influence the dependent variable.
The researcher’s experience in performing quantitative research and non-probability
sampling can be a limitation, i.e. the researcher may not have had adequate experience
in this field. Finally, the research did not consider the antecedents of EA in a DT to explain
the enablers of EA for traditional firms in this context.

106
7.4 Future research
Future research can focus on further understanding the antecedents of entrepreneurial
agility in a digital transformation context, to better understand what the enablers of
entrepreneurial agility are for traditional firms in digital transformations. The relationships
between the digital maturity constructs themselves were not explored in this study,
however there may be interdependencies between the constructs and how they may
combine to influence digital maturity, EA and firm performance. Further research could
provide more clarity on the scope and use of the construct digital maturity, particularly in
terms of its relevance for traditional firms.

107
References
Acharya, A., Singh, S. K., Pereira, V., & Singh, P. (2018). Big data, knowledge co-creation
and decision making in fashion industry. International Journal of Information
Management, 42, 90–101. https://doi.org/10.1016/j.ijinfomgt.2018.06.008
Agresti, A., & Franklin, C. (2007). Statistics: The Art and Science of Learning from Data.
New Jersey: Pearson Education, Inc.
Anderson, C., & Ellerby, W. (2018). Digital Maturity Model: Achieving digital maturity to
drive growth [powerpoint slides]. Retrieved:
https://www2.deloitte.com/content/dam/Deloitte/global/Documents/Technology-
Media-Telecommunications/deloitte-digital-maturity-model.pdf
Barney, J. (1991). Firm Resources and Sustained Competitive Advantage. Journal of
Management, 17(1), 99–120. https://doi.org/10.1177/014920639101700108
Bartlett II, J. E., Kotrlik, J. W., & Higgins, C. C. (2001). Determing appropriate sample size
in survey research. Information Technology, Learning, and Performance Journal,
19(1), 43–50.
Becker, J., Niehaves, B., Poeppelbuss, J., & Simons, A. (2010). Maturity Models in IS
Research [Paper presentation]. 18th European Conference on Information Systems,
Pretoria, South Africa. http://aisel.aisnet.org/ecis2010/42
Berghaus, S., & Back, A. (2016). Stages in Digital Business Transformation: Results of an
Empirical Maturity Study. Twenty-Fifth European Conference on Information Systems
(ECIS), Guimarães, Portugal, 2017.
https://doi.org/10.1109/TWC.2011.121911.101960
Bhadradwaj, A., El Sawy, O. A., Pavlou, P. A., & Venkatraman, N. (2013). Digital Business
Strategy: Toward a Next Generation of Insights. MIS Quarterly, 37(2), 471–482.
Bughin, J., & van Zeebroeck, N. (2017). The Best Response to Digital Disruption. MIT
Sloan Management Review, 58(4), 80–86. http://mitsmr.com/2oFlYgE

108
Cai, Z., Huang, Q., Liu, H., & Wang, X. (2018). Improving the agility of employees through
enterprise social media: The mediating role of psychological conditions. International
Journal of Information Management, 38(1), 52–63.
https://doi.org/10.1016/j.ijinfomgt.2017.09.001
De Carolis A., Macchi M., Negri E., Terzi S. (2017). A Maturity Model for Assessing the
Digital Readiness of Manufacturing Companies. In Lödding H., Riedel R., Thoben
KD., von Cieminski G., Kiritsis D. (eds), Advances in Production Management
Systems: The Path to Intelligent, Collaborative and Sustainable Manufacturing, APMS
2017, IFIP Advances in Information and Communication Technology, vol 513.
Springer. https://doi.org/10.1007/978-3-319-66923-6_2
Cavalcante, S., Kesting, P., & Ulhøi, J. (2011). Business model dynamics and innovation:
(re)establishing the missing linkages. Management Decision, 49(8), 1327–1342.
https://doi.org/10.1108/00251741111163142
Cegarra-Navarro, J. G., Soto-Acosta, P., & Wensley, A. K. P. (2016). Structured
knowledge processes and firm performance: The role of organizational agility.
Journal of Business Research, 69(5), 1544–1549.
https://doi.org/10.1016/j.jbusres.2015.10.014
Chakravarty, A., Grewal, R., & Sambamurthy, V. (2013). Information Technology
Competencies, Organizational Agility, and Firm Performance: Enabling and
Facilitating Roles. Information Systems Research, 24(4), 976–997.
Chanias, S., & Hess, T. (2016). How digital are we? Maturity models for the assessment
of a company’s status in the digital transformation (Management Report 2/2016).
Munich: Ludwig-Maximilians-Universität München
Chanias, S., Myers, M. D., & Hess, T. (2019). Digital transformation strategy making in
pre-digital organizations: The case of a financial services provider. Journal of
Strategic Information Systems, 28(1), 17–33.
https://doi.org/10.1016/j.jsis.2018.11.003

109
Chen, C. L. P., & Zhang, C. Y. (2014). Data-intensive applications, challenges, techniques
and technologies: A survey on Big Data. Information Sciences, 275, 314–347.
https://doi.org/10.1016/j.ins.2014.01.015
Chen, D. Q., Preston, D. S., & Swink, M. (2015). How the use of big data analytics affects
value creation in supply chain management. Journal of Management Information
Systems, 32(4), 4–39. https://doi.org/10.1080/07421222.2015.1138364
Chen, Y., Wang, Y., Nevo, S., Jin, J., Wang, L., & Chow, W. S. (2014). IT capability and
organizational performance: The roles of business process agility and environmental
factors. European Journal of Information Systems, 23(3), 326–342.
https://doi.org/10.1057/ejis.2013.4
Chung, T. T. R., Liang, T. P., Peng, C. H., & Chen, D. N. (2010). Knowledge creation and
firm performance: Mediating processes from an organizational agility perspective. In
Proceedings of the Sixteenth Americas Conference on Information Systems. Lima,
Peru (pp. 1–11).
Delice, A. (2001). The sampling issues in quantitative research. Educational Sciences:
Theory & Practices, 10(4), 2001–2019.
De Leeuw, E. (2008). Chapter 18: Self-administered questionnaires and standardized
interviews. In: P. Alasuutari, L. Bickman, & J. Brannon (eds.). Handbook of Social
Research Methods. London: Sage Publications, pp. 313-327.
Dremel, C., Herterich, M. M., Wulf, J., Waizmann, J. C., & Brenner, W. (2017). How AUDI
AG established big data analytics in its digital transformation. MIS Quarterly
Executive, 16(2), 81–100.
Edeling, A., & Himme, A. (2018). When does market share matter? New empirical
generalizations from a meta-analysis of the market share-performance relationship.
Journal of Marketing, 82(3), 1–24. https://doi.org/10.1509/jm.16.0250
Eremina, Y., Lace, N., & Bistrova, J. (2019). Digital Maturity and Corporate Performance :
The Case of the Baltic States. Journal of Open Innovation: Technology, Market and

110
Complexity, 5(54), 1–13.
Fan, W., & Yan, Z. (2010). Factors affecting response rates of the web survey: A
systematic review. Computers in Human Behavior, 26(2), 132–139.
https://doi.org/10.1016/j.chb.2009.10.015
Felipe, C. M., Roldán, J. L., & Leal-Rodríguez, A. L. (2016). An explanatory and predictive
model for organizational agility. Journal of Business Research, 69(10), 4624–4631.
https://doi.org/10.1016/j.jbusres.2016.04.014
Feng, H., & Feng, N. (2020). First-or Second-Mover Advantage? The case of IT-Enabled
Platform Markets. MIS Quarterly, 44(3), 1107–1141.
https://doi.org/10.25300/MISQ/2020/15273
Ferreira, J. J. M., Fernandes, C. I., & Ferreira, F. A. F. (2019). To be or not to be digital ,
that is the question: Firm innovation and performance. Journal of Business Research,
101, 583–590. https://doi.org/10.1016/j.jbusres.2018.11.013
Fitzgerald, B. M., Kruschwitz, N., Bonnet, D., & Welch, M. (2013). Embracing Digital
Technology: A New Strategic Imperative. MIT Sloan Management Review, 55(2), 1-
12.
Fitzgerald, M. (2015). Viewing Data as a Liquid Asset. MIT Sloan Management Review,
57(2),1-4. http://mitsmr.com/1WCNOji
Fitzgerald, M. (2016a). Building a Better Car Company With Analytics. MIT Sloan
Management Review, 57(4), 1-4. http://mitsmr.com/1pIrmvx
Fitzgerald, M. (2016b). General Motors Relies on IoT to Keep Its Customers Safe and
Secure. MIT Sloan Management Review, 57(4), 86–91. http://mitsmr.com/1Tk5T3J
Gao, S., Hakanen, E., Töytäri, P., & Rajala, R. (2019). Digital Transformation in Asset-
intensive Businesses: Lessons Learned from the Metals and Mining Industry.
Proceedings of the 52nd Hawaii International Conference on System Sciences, USA.
https://doi.org/10.24251/hicss.2019.593

111
Ghasemi, A., & Zahediasl, S. (2012). Normality tests for statistical analysis: A guide for
non-statisticians. International Journal of Endocrinology and Metabolism, 10(2), 486–
489. https://doi.org/10.5812/ijem.3505
Gill, M., & Van Boskirk, S. (2016). Digital Maturity Model 4.0 [online]. Retrieved from:
https://forrester.nitro-digital.com/pdf/Forrester-s Digital Maturity Model 4.0.pdf
Goldman, S. L., Nagel, R. N., & Preiss, K. (1995). Agile competitors and virtual
organizations: strategies for enriching the customer (Vol. 8). New York: Van
Nostrand Reinhold.
Granello, D. H., & Wheaton, J. E. (2004). Online data collection: Strategies for
research. Journal of Counselling & Development, 82(4), 387-393.
Gurumurthy, R., Schatsky, D., & Camhi, J. (2020). Uncovering the connection between
digital maturity and financial performance: How digital transformation can lead to
sustainable high performance [online]. Retrieved from:
https://www2.deloitte.com/us/en/insights/topics/digital-transformation/digital-
transformation-survey.html
Hair, J. F. Jr., Anderson, R. E., Tatham, R. L. & Black, W. C. (1995). Multivariate Data
Analysis (3rd ed.). New York: Macmillan
Hanelt, A., Piccinini, E., Gregory, R. W., Hildebrandt, B., & Lutz, M. (2015). Digital
Transformation of Primarily Physical Industries – Exploring the Impact of Digital
Trends on Business Models of Automobile Manufacturers. 12th International
Conference on Wirtschaftsinformatik, Osnabrück, Germany.
https://aisel.aisnet.org/wi2015/88/
Hauari, B. G. (2017). Rise of CDO role confirms commitments to digital transformation
[online]. Retrieved from: https://www.information-management.com/news/rise-of-
cdo-role-confirms-commitments-to-digital-transformation.

112
Hayes, A., F. (2020). The PROCESS macro for SPSS, SAS, and R [online]. Retrieved
from:
https://www.processmacro.org/download.html
HBR Analytic Services. (2014). The Digital Dividend : First-Mover Advantage [online].
Retrieved from:
https://hbr.org/resources/pdfs/comm/verizon/18832_HBR_Verizon_Report_IT_rev3
_webview.pdf
Henderson, J. C., & Venkatraman, N. (1993). Strategic alignment : Leveraging information
technology for transforming organizations. IBM Systems Journal, 38(1), 472–484.
Hess, T., Benlian, A., Matt, C., & Wiesböck, F. (2016). Options for formulating a digital
transformation strategy. MIS Quarterly Executive, 15(2), 123–139.
https://doi.org/10.4324/9780429286797-7
Kahre, C., Hoffmann, D., & Ahlemann, F. (2017). Beyond Business-IT Alignment - Digital
Business Strategies as a Paradigmatic Shift : A Review and Research Agenda. In
Proceedings of the 50th Hawaii International Conference on System Sciences,
Hawaii: Association for Information Systems.
Kaiser, H. F. (1974). An index of factorial simplicity. Psychometrika, 39(1), 31–36.
https://doi.org/10.1007/BF02291575
Kane, G. C., Palmer, D., Phillips, A. N., & Kiron, D. (2015). Is Your Business Ready for a
Digital Future? MIT Sloan Management Review, (56), 37-44.
Kane, G. C., Palmer, D., Phillips, A. N., Kiron, D., & Buckley, N. (2015). Strategy, not
Technology, Drives Digital Transformation. MIT Sloan Management Review and
Deloitte University Press, (14), 1-25. https://doi.org/10.1176/appi.ajp.159.9.1620
Kane, G. C., Palmer, D., Phillips, A. N., Kiron, D., & Buckley, N. (2016). Aligning the
Organization for Its Digital Future. MIT Sloan Management Review, 58(1), 1-29.
Kane, G. C., Palmer, D., Phillips, A. N., Kiron, D., & Buckley, N. (2017). Achieving Digital

113
Maturity. MIT Sloan Management Review, 59(1). 1-31.
Karimi, J. (2015). The Role of Dynamic Capabilities in Responding to Digital Disruption: A
Factor-Based Study of the Newspaper Industry. Journal of Information Management
Systems, 32(1), 39–81. https://doi.org/10.1080/07421222.2015.1029380
Laerd Statistics. (2020). Moderator Analysis with a Dichotomous Moderator using SPSS
Statistics [online]. Retrieved from: https://statistics.laerd.com/spss-
tutorials/dichotomous-moderator-analysis-using-spss-statistics.php
Lee, O. K., Sambamurthy, V., Lim, K. H., & Wei, K. K. (2015). How does IT ambidexterity
impact organizational agility? Information Systems Research, 26(2), 398–417.
https://doi.org/10.1287/isre.2015.0577
Li, W., Xiang, P., Chen, Y. J., Xie, X., & Li, Y. (2017). Unit of analysis: Impact of Silverman
and Solmon’s article on field-based intervention research in physical education in
the USA. Journal of Teaching in Physical Education, 36(2), 131-141.
Lieberman, M. B., & Montgomery, D. B. (1988). First-Mover Advantages. Strategic
Management Journal, 9(1988), 41–58.
Lin, Y., & Wu, L. Y. (2014). Exploring the role of dynamic capabilities in firm performance
under the resource-based view framework. Journal of Business Research, 67(3),
407–413. https://doi.org/10.1016/j.jbusres.2012.12.019
Liu, H., Song, D., & Cai, Z. (2014). Knowledge Management Capability and Firm
Performance: The Mediating Role of Organizational Agility. 18th Pacific Asia
Conference on Information Systems (PACIS 2014), Chengdu, China.
Liu, Y., Wu, A. D., & Zumbo, B. D. (2010). The Impact of Outliers on Cronbach’s Coefficient
Alpha Estimate of Reliability: Ordinal/Rating Scale Item Responses. Educational and
Psychological Measurement, 70(1), 5–21.
https://doi.org/10.1177/0013164409344548
Lu, Y., & Ramamurthy, K. R. (2011). The Link Between IT Capability & Organizational

114
Agility Introduction. MIS Quarterly, 35(4), 931–954.
Majchrzak, A., Markus, L. M., & Wareham, J. (2016). Desiging for Digital Transformation.
MIS Quarterly, 40(2), 1187–1200.
Marcus, J. (2020, February 7). Marcus, a digital bank that should keep rivals up at night
[online]. Retrieved from: https://thefinancialbrand.com/92681/marcus-goldman-
sachs-digital-banking-checking-strategy/
Matt, C., Hess, T., & Benlian, A. (2015). Digital Transformation Strategies. Business and
Information Systems Engineering, 57(5), 339–343. https://doi.org/10.1007/s12599-
015-0401-5
Matzler, K., von den Eichen, S. F., Anschober, M., & Kohler, T. (2018). The crusade of
digital disruption. Journal of Business Strategy, 39(6), 13–20.
https://doi.org/10.1108/JBS-12-2017-0187
Mhlungu, N. S. M., Chen, J. Y. J., & Alkema, P. (2019). The underlying factors of a
successful organisational digital transformation. SA Journal of Information
Management, 21(1), 1–10. https://doi.org/10.4102/sajim.v21i1.995
Miles, R. E., Snow, C. C., Meyer, A. D., & Coleman Jr., H. J. (1978). Organizational
Strategy, Structure, and Process. The Academy of Management Review, 3(3), 546–
562.
Mithas, S., Krishnan, M. S., & Fornell, C. (2016). Information technology, customer
satisfaction, and profit: Theory and evidence. Information Systems Research, 27(1),
166–181. https://doi.org/10.1287/isre.2015.0609
Newbert, S. L. (2008). Value, rareness, competitive advantage, and performance: a
conceptual‐level empirical investigation of the resource‐based view of the
firm. Strategic Management Journal, 29(7), 745-768.
Ngai, E. W. T., Chau, D. C. K., & Chan, T. L. A. (2011). Information technology,
operational, and management competencies for supply chain agility: Findings from

115
case studies. Journal of Strategic Information Systems, 20(3), 232–249.
https://doi.org/10.1016/j.jsis.2010.11.002
Nickisch, C. (2019). How One CEO Successfully Led a Digital Transformation [online].
Retrieved from: https://hbr.org/podcast/2019/12/how-one-ceo-successfully-led-a-
digital-transformation
Niland, M. J. (2018). Toward the influence of the organisation on big data
analytics (Master's Thesis). University of Pretoria, Pretoria. Retrieved from:
https://repository.up.ac.za/handle/2263/64902?show=full
Nwankpa, J. K., & Roumani, Y. (2016). IT Capability and Digital Transformation: A Firm
Performance Perspective [Paper presentation]. In Thirty Seventh International
Conference on Information Systems (ICIS), Dublin, Ireland.
https://aisel.aisnet.org/icis2016/ISStrategy/Presentations/4/
Penrose, E. T. (1959). The Theory of the Growth of the Firm. New York: John Wiley.
Porter, M. E., & Kramer, M. R. (2011). Creating shared value. Harvard Business Review,
89, 62-77.
Preston, C. C., & Colman, A. M. (2000). Optimal number of response categories in rating
scales: reliability, validity, discriminating power, and respondent preferences. Acta
Psychologica, 104(1), 1-15.
Osborne, J. W., & Overbay, A. (2004). The power of outliers (and why researchers should
ALWAYS check for them). Practical Assessment, Research and Evaluation, 9(6), 1–
8.
Otto, A. S., Szymanski, D. M., & Varadarajan, R. (2020). Customer satisfaction and firm
performance: insights from over a quarter century of empirical research. Journal of
the Academy of Marketing Science, 48(3), 543–564. https://doi.org/10.1007/s11747-
019-00657-7
Overby, E., Bharadwaj, A., & Sambamurthy, V. (2006). Enterprise agility and the enabling

116
role of information technology. European Journal of Information Systems, 15(2), 120–
131. https://doi.org/10.1057/palgrave.ejis.3000600
Pallant, J. (2001). SPSS survival manual: A step by step guide to data analysis using
SPSS (Versions 1). Philadelphia: Open University Press.
Parise, S., Guinan, P. J., & Kafka, R. (2016). Solving the crisis of immediacy: How digital
technology can transform the customer experience. Business Horizons, 59(4), 411–
420. https://doi.org/10.1016/j.bushor.2016.03.004
Pihir, I., Tomičić-Pupek, K., & Furjan, M. T. (2018). Digital Transformation Insights and
Trends. Proceedings of the 29th Central European Conference on Information and
Intelligent Systems, Varaždin, Croatia.
Porter, M. E., & Heppelmann, J. E. (2015). How smart, connected products are
transforming companies. Harvard Business Review, 93(10), 96–114.
Ravichandran, T. (2018). Exploring the relationships between IT competence, innovation
capacity and organizational agility. Journal of Strategic Information Systems, 27(1),
22–42. https://doi.org/10.1016/j.jsis.2017.07.002
Rehman, M. H. U., Chang, V., Batool, A., & Wah, T. Y. (2016). Big data reduction
framework for value creation in sustainable enterprises. International Journal of
Information Management, 36(6), 917–928.
https://doi.org/10.1016/j.ijinfomgt.2016.05.013
Remane, G., Andre, H., Florian, W., & Lutz, K. (2017). Digital Maturity in Traditional
Industries – An Exploratory Analysis. In Twenty-Fifth European Conference on
Information Systems (ECIS), Guimarães, Portugal.
https://aisel.aisnet.org/ecis2017_rp/10
Sabherwal, R., & Jeyaraj, A. (2015). Information technology impacts on firm performance:
An extension of Kohli and Devaraj (2003). MIS Quarterly: Management Information
Systems, 39(4), 809–836. https://doi.org/10.25300/MISQ/2015/39.4.4

117
Sambamurthy, V., Bharadwaj, A., & Grover, V. (2003). Shaping agility through digital
options: Reconceptualizing the role of information technology in contemporary firms.
MIS Quarterly: Management Information Systems, 27(2), 237–264.
https://doi.org/10.2307/30036530
Sambamurthy, V., Wei, K.-K., Lim, K., & Lee, D. (2007). IT-Enabled Organizational Agility
and Firms’ Sustainable Competitive Advantage. Twenty Eighth International
Conference on Information Systems (ICIS), Montreal, Canada.
https://aisel.aisnet.org/icis2007/91
Saunders, M., & Lewis, P. (2018). Doing research in business & management: An
essential guide to planning your project (2nd ed.). Harlow: Pearson Education.
Schein, E.H. (1992). Organization Culture and Leadership (2nd ed.). San Francisco:
Jossey-Bass.
Sebastian, I. M., Ross, J. W., & Beath, C. (2017). How Big Old Companies Navigate Digital
Transformation. MIS Quarterly Executive, 16(3), 197–214.
Shrivastava, S. (2017). Digital Disruption is Redefining the Customer Experience: The
Digital Transformation Approach of the Communications Service Providers. Telecom
Business Review, 10(1), 41–52.
Siebel, T. M. (2017). Why digital transformation is now on the CEO’s shoulders [online].
Retrieved from: https://www.mckinsey.com/business-functions/mckinsey-digital/our-
insights/why-digital-transformation-is-now-on-the-ceos-shoulders
Simchi-Levi, D., & Wu, M. X. (2018). Powering retailers’ digitization through analytics and
automation. International Journal of Production Research, 56(1–2), 809–816.
https://doi.org/10.1080/00207543.2017.1404161
Singh, A., & Hess, T. (2017). How Chief Digital Officers Promote the Digital
Transformation of their Companies. MIS Quarterly Executive, 16(1), 1–17.
Sutcliff, M., Narsalay, R., & Sen, A. (2019). The Two Big Reasons That Digital
Transformations Fail [online]. Retrieved from: https://hbr.org/2019/10/the-two-big-

118
reasons-that-digital-transformations-fail
Tallon, P., Queiroz, M., Coltman, T., & Sharma, R. (2019). Information Technology and
the Search for Organizational Agility : A Systematic Review with Future Research
Possibilities. Journal of Strategic Information Systems, 28(2), 218–237.
https://doi.org/10.1016/j.jsis.2018.12.002
Teece, D. J. (2007). Explicating dynamic capabilities: the nature and microfoundations of
(sustainable) enterprise performance. Strategic Management Journal. 28(13),
1319–1350.
Teece, D. J. (2018). Business models and dynamic capabilities. Long Range Planning,
51(1), 40–49. https://doi.org/10.1016/j.lrp.2017.06.007
Teece, D. J., & Pisano, G. (1994). The dynamic capabilities of firms: an
introduction. Industrial and Corporate Change, 3(3), 537-556.
Teece, D., Peteraf, M., & Leih, S. (2016). Dynamic capabilities and organizational agility:
Risk, uncertainty, and strategy in the innovation economy. California Management
Review, 58(4), 13–35. https://doi.org/10.1525/cmr.2016.58.4.13
Teece, D. J., Pisano, G., & Shuen, A. (1997). Dynamic capabilities and strategic
management, Strategic Management Journal, 18(7), 509-533.
https://doi.org/10.1142/9789812796929_0004
Tippins, M. J., & Sohi, R. S. (2003). IT competency and firm performance: Is organizational
learning a missing link? Strategic Management Journal, 24(8), 745–761.
https://doi.org/10.1002/smj.337
Valdez-de-Leon, O. (2016). A Digital Maturity Model for Telecommunications Service
Providers. Technology Innovation Management Review, 6(8), 19–32.
https://doi.org/10.22215/timreview1008
Verhoef, P. C., Broekhuizen, T., Bart, Y., Bhattacharya, A., Dong, J. Q., Fabian, N., &
Haenlein, M. (2019). Digital transformation : A multidisciplinary reflection and

119
research agenda. Journal of Business Research, 122, 889–901.
https://doi.org/10.1016/j.jbusres.2019.09.022
Vial, G. (2019). Understanding digital transformation: A review and a research agenda.
Journal of Strategic Information Systems, 28(2), 118–144.
https://doi.org/10.1016/j.jsis.2019.01.003
Vogelsang, K., Liere-Netheler, K., & Packmohr, S. (2019). Barriers to Digital
Transformation in Manufacturing: Development of a Research Agenda. In
Proceedings of the 52nd Hawaii International Conference on System Sciences
(HICSS), Honolulu, USA. http://hdl.handle.net/10125/59931
Wamba, S. F., Gunasekaran, A., Akter, S., Ren, S. J., Dubey, R., & Childe, S. J. (2017).
Big data analytics and firm performance: Effects of dynamic capabilities. Journal of
Business Research, 70, 356–365. https://doi.org/10.1016/j.jbusres.2016.08.009
Ward, M., & Price, A. (2019). Turning vision into value: corporate finance for non-financial
executives (19th ed.). Pretoria: Van Schaik.
Warner, K. S. R., & Wäger, M. (2019). Building dynamic capabilities for digital
transformation: An ongoing process of strategic renewal. Long Range Planning,
52(2019), 326–349. https://doi.org/10.1016/j.lrp.2018.12.001
WEF. (2017). Digital Transformation: Initiative Mining and Metals Industry [online].
Retrieved from: http://reports.weforum.org/digital-transformation/wp-
content/blogs.dir/94/mp/files/pages/files/wef-dti-mining-and-metals-white-paper.pdf
Wernerfelt, B. (1984). A Resource based view of the firm. Strategic Management Journal,
5(2), 171-180. https://www.jstor.org/stable/2486175?seq=1
Westerman, G., & Bonnet, D. (2015). Revamping your business through digital
transformation. MIT Sloan Management Review, 56(3), 2–5.
Westerman, G., Bonnet, D., & McAfee, A. (2014). The nine elements of digital
transformation. MIT Sloan Management Review, 55(3), 1-6.

120
Westerman, G., & Davenport, T. H. (2018, March 09). Why so many high-profile digital
transformations fail [online]. Retrieved: https://hbr.org/2018/03/why-so-many-high-
profile-digital-transformations-fail
Westerman, G., & Mcafee, A. (2012). The Digital Advantage: How Digital Leaders
Outperform their peers in every industry. Cambridge: The MIT Center for Digital
Business. https://doi.org/10.1097/01.HJ.0000293820.91405.31
Wright, K. B. (2005). Researching Internet-based populations: Advantages and
disadvantages of online survey research, online questionnaire authoring software
packages, and web survey services [online]. Journal of Computer-mediated
Communication, 10(3), 1 April 2005. https://doi.org/10.1111/j.1083-
6101.2005.tb00259.x
Yong, A. G., & Pearce, S. (2013). A Beginner’s guide to Factor Analysis: Focusing on
Exploratory Factor Analysis. Tutorials in Quantitative Methods for Psychology, 9(2),
79–94. https://doi.org/10.20982/tqmp.09.2.p079
Zachary, M. A., Gianiodis, P. T., Payne, G. T., & Markman, G. D. (2015). Entry Timing :
Enduring Lessons and Future Directions. Journal of Management, 41(5), 1388–1415.
https://doi.org/10.1177/0149206314563982
Zikmund, W. G., Babin, B. J., Carr, J. C., & Griffin, M. (2010). Business Research Methods
(8th ed.). Mason: South Western, Cengage Learning.

121
Appendix A: Questionnaire
Table 23: Survey questionnaire
Survey Questionnaire
Qualifying Questions
1. Has your organisation embarked on
a digital transformation activity with
the use of digital technologies for its
internal business processes or to
develop new markets and product
offerings?
Yes No
If Yes, go to
section A
If no, go to end
2. Are you familiar with your
organisations digital strategies?
Yes No
If Yes, go to
section A
If no, go to end
Section A- Demographic and control
variables (Tick the relevant box)
3. What is
your
gender?

122
Male
Female
Prefer not to say
4. What is your seniority in the
organisation?
Junior manager
Middle manager
Senior manager
Executive
manager
5. How many years of experience do
you have in your organisation?
<1 year
1-5 years
5-10 years
10-15 years
>15 years
6. How large is your organisation in
terms of number of employees?
0-99
100-499
500-999
1000-4999
5000 or more

123
7. How large is the estimated annual
revenue in your organisation?
R0-0.99m
R1,0-R9.99m
R10-99.99m
R100-1000m
>R1000m
8. What industry is
your firm
operating in?
Tick the relevant
box
Advertising, Marketing
and sales
Agriculture and food
production
Airlines and support
services
Automotive
Business support and
services (consulting,
advisory services)
Construction and
building
Education
Entertainment &
Hospitality
Financial Services
(insurance, banking,
finance)
Food & Beverages

124
Government and public
sector
Healthcare &
Pharmaceuticals
Manufacturing
Mining
Non for profit
Retail
Real Estate
Telecommunications
and internet service
providers
Transportation &
Logistics
Utilities and energy
I am currently
unemployed
Section B- Firm Performance Score
Answer: On a 5 point Likert scale from
Strongly Disagree, Disagree, Neutral,
Agree, Strongly Agree
Use of agility and digital transformation in
the organisation over the last three years
have improved the following relative to
competitors: (Please answer on a 5 point
likert scale from Strongly Disagree,
Disagree, Neutral, Agree, Strongly Agree):
9. Sales or Revenue relative to competitors
Strongly
Disagree Disagree Neutral Agree
Strongly
Agree

125
10. Market share relative to competitors
Strongly
Disagree Disagree Neutral Agree
Strongly
Agree
11. Profits relative to competitors
Strongly
Disagree Disagree Neutral Agree
Strongly
Agree
12. Return on investment (ROI) relative to
competitors
Strongly
Disagree Disagree Neutral Agree
Strongly
Agree
Section C- Entrepreneurial Agility
Answer: On a 5 point Likert scale from
strongly disagree, Disagree, Neutral,
Agree, Strongly Agree
13. We believe that our strategy places
emphasis on building capabilities to
anticipate and predict a wide range of
possible scenarios.
Strongly
Disagree Disagree Neutral Agree
Strongly
Agree
14. Our organisation believes in quickly and
rapidly taking advantage of opportunities.
Strongly
Disagree Disagree Neutral Agree
Strongly
Agree
15. We can convert our strategic assets into
alternate forms easily.
Strongly
Disagree Disagree Neutral Agree
Strongly
Agree
16. Our positioning strategy can be easily
modified
Strongly
Disagree Disagree Neutral Agree
Strongly
Agree
Section D- Digital Maturity
Answer: On a 5 point Likert scale from
strongly disagree, Disagree, Neutral, Agree,
Strongly Agree
Technology
Answer the following statements about
Technology on a 5 point Likert scale from
Strongly Disagree, Disagree, Neutral,
Agree, Strongly Agree

126
17. Our organisation has a budget for
technology that is fluid to allow for shifting
priorities
Strongly
Disagree Disagree Neutral Agree
Strongly
Agree
18. Our digital technology road map is
created by both marketing and technology
resources working together
Strongly
Disagree Disagree Neutral Agree
Strongly
Agree
19. Our approach to technology
development is flexible, collaborative and
iterative
Strongly
Disagree Disagree Neutral Agree
Strongly
Agree
20. Our organisation leverages modern data
architectures like the cloud or application
programming interfaces (APIs) for
increased speed and flexibility
Strongly
Disagree Disagree Neutral Agree
Strongly
Agree
21. Technology teams are measured by
business outcomes and not just by the
digital system reliability
Strongly
Disagree Disagree Neutral Agree
Strongly
Agree
22. Our organisation uses customer
experience assets like personas and
journey maps to drive our technology design
Strongly
Disagree Disagree Neutral Agree
Strongly
Agree
23. Our organisation makes use of digital
tools to promote innovation, collaboration,
and mobility of our employees.
Strongly
Disagree Disagree Neutral Agree
Strongly
Agree
Culture
Answer the following statements about
Culture on a 5 point Likert scale from
Strongly Disagree, Disagree, Neutral,
Agree, Strongly Agree
24. Our organisation's competitive strategy
depends on digital
Strongly
Disagree Disagree Neutral Agree
Strongly
Agree
25. Our digital strategy is backed by our
board and C-level executives
Strongly
Disagree Disagree Neutral Agree
Strongly
Agree

127
26. We believe the organisation has the
right leaders to execute our digital strategy
on a day to day basis
Strongly
Disagree Disagree Neutral Agree
Strongly
Agree
27. Our organisation invests in digital
training and education at all levels
Strongly
Disagree Disagree Neutral Agree
Strongly
Agree
28. Our organisations digital vision is
communicated both internally and externally
Strongly
Disagree Disagree Neutral Agree
Strongly
Agree
29. Our organisation takes measured risks
to drive innovation
Strongly
Disagree Disagree Neutral Agree
Strongly
Agree
30. Overall customer experience is
prioritised holistically over a single
distribution channel
Strongly
Disagree Disagree Neutral Agree
Strongly
Agree
Organisation
Answer the following statements about
Organisation on a 5 point Likert scale from
Strongly Disagree, Disagree, Neutral,
Agree, Strongly Agree
31. In our organisation, customer journeys
are prioritised over functional silos
Strongly
Disagree Disagree Neutral Agree
Strongly
Agree
32. Our organisation dedicates appropriate
resources to digital strategy, execution and
governance
Strongly
Disagree Disagree Neutral Agree
Strongly
Agree
33. We have the best in class staff
supporting the critical digital functions
Strongly
Disagree Disagree Neutral Agree
Strongly
Agree
34. Our organisation has digital skills
embedded throughout.
Strongly
Disagree Disagree Neutral Agree
Strongly
Agree
35. Collaboration across functions is
encouraged by our organisations model
Strongly
Disagree Disagree Neutral Agree
Strongly
Agree
36. Our processes for digital programs are
well defined and are repeatable.
Strongly
Disagree Disagree Neutral Agree
Strongly
Agree

128
37. We have vendor partners that deliver
value to enhance our digital competencies.
Strongly
Disagree Disagree Neutral Agree
Strongly
Agree
Insights
Answer the following statements about
Insights on a 5 point Likert scale from
Strongly Disagree, Disagree, Neutral,
Agree, Strongly Agree
38. Our digital strategy has clear and
quantifiable goals for measuring success
Strongly
Disagree Disagree Neutral Agree
Strongly
Agree
39. Every employee has an understanding
of their performance contribution to the
corporate goals of the digital strategy
Strongly
Disagree Disagree Neutral Agree
Strongly
Agree
40. Our organisation makes use of
customer-centered measures such as Net
Promoter Score or customer lifetime value
to measure success.
Strongly
Disagree Disagree Neutral Agree
Strongly
Agree
41. Our organisation measures how multiple
channels work together towards a desired
outcome
Strongly
Disagree Disagree Neutral Agree
Strongly
Agree
42. We actively use customer insights to
steer our digital strategy
Strongly
Disagree Disagree Neutral Agree
Strongly
Agree
43. We use our customer insights to develop
and design our digital tools
Strongly
Disagree Disagree Neutral Agree
Strongly
Agree
44. Our strategy is updated with lessons
learned feedback from digital programs
Strongly
Disagree Disagree Neutral Agree
Strongly
Agree
END

129
Appendix B: Coding catalogue
Table 24: Coding catalogue
Coding
Gender
Male 0
Female 1
Prefer not to say 2
Seniority
Junior manager 0
Middle manager 1
Senior manager 2
Executive manager 3
Years of experience in organisation
< 1 year 0
1 to 5 years 1
5 to 10 years 2
10 to 15 years 3
>15 years 4
Organziation size (number of employees)
0-99 0
100-499 1
500-999 2
1000-4999 3
5000 or more 4
Annual Revenue
<R0.99m 0
R1m - R9.9m 1
R10m - R99.99m 2

130
R100m - R999.99m 3
>R1000m 4
Industry Type
Advertising, Marketing and sales 1
Agriculture and food production 2
Airlines and support services 3
Automotive 4
Business support and services (consulting, advisory services) 5
Construction and building 6
Education 7
Entertainment & Hospitality 8
Financial Services (insurance, banking, finance) 9
Food & Beverages 10
Government and public sector 11
Healthcare & Pharmaceuticals 12
Manufacturing 13
Mining 14
Non for profit 15
Retail 16
Real Estate 17
Telecommunications and internet service providers 18
Transportation & Logistics 19
Utilities and energy 20
I am currently unemployed 0
Likert Scale
Strongly Disagree 1
Disagree 2
Neutral 3
Agree 4
Strongly Agree 5

131
Table 25: Detailed industry type
Industry type Number Percentage
Advertising, Marketing and sales 1 1,7
Advertising, Marketing and sales, Business support and services (consulting, advisory services), Financial Services (insurance, banking, finance), Healthcare & Pharmaceuticals, Mining, Retail, Telecommunications and internet service providers, Transportation & Logistics, Utilities and energy 1 1,7
Advertising, Marketing and sales, Business support and services (consulting, advisory services), Manufacturing, Mining 1 1,7
Advertising, Marketing and sales, Manufacturing 1 1,7
Automotive 3 5,0
Automotive, Construction and building, Not for Profit, Transportation & Logistics, Utilities and energy 1 1,7
Business support and services (consulting, advisory services) 1 1,7
Education 2 3,3
Education, Not for Profit 1 1,7
Financial Services (insurance, banking, finance) 9 15,0
Government and public sector 2 3,3
Government and public sector, Utilities and energy 1 1,7
Healthcare & Pharmaceuticals 2 3,3
Manufacturing 4 6,7
Manufacturing, Mining 1 1,7
Manufacturing, Retail, Transportation & Logistics, Utilities and energy 1 1,7
Mining 23 38,3
Telecommunications and internet service providers 3 5,0
Utilities and energy 2 3,3
Total 60 100

132
Appendix C: Validity test (Bi-variate correlation)
Table 26: Spearmans rank Bi-variate correlation for Firm Performance scale validity
Correlations
Item-total score FP
Spearman's
rho
Sales Correlation Coefficient .762**
Sig. (2-tailed) 0,000
N 60
MShare Correlation Coefficient .850**
Sig. (2-tailed) 0,000
N 60
Profit Correlation Coefficient .796**
Sig. (2-tailed) 0,000
N 60
ROI Correlation Coefficient .875**
Sig. (2-tailed) 0,000
N 60
Item-total
score FP
Correlation Coefficient 1,000
Sig. (2-tailed)
N 60
**. Correlation is significant at the 0.01 level (2-tailed).
Table 27: Spearmans rank Bi-variate correlation for validy tests of the entrepreneurial agility scale.
Correlations
Item-total
score EA
Spearman's rho EA-Scenarios Correlation
Coefficient
.622**
Sig. (2-tailed) 0,000
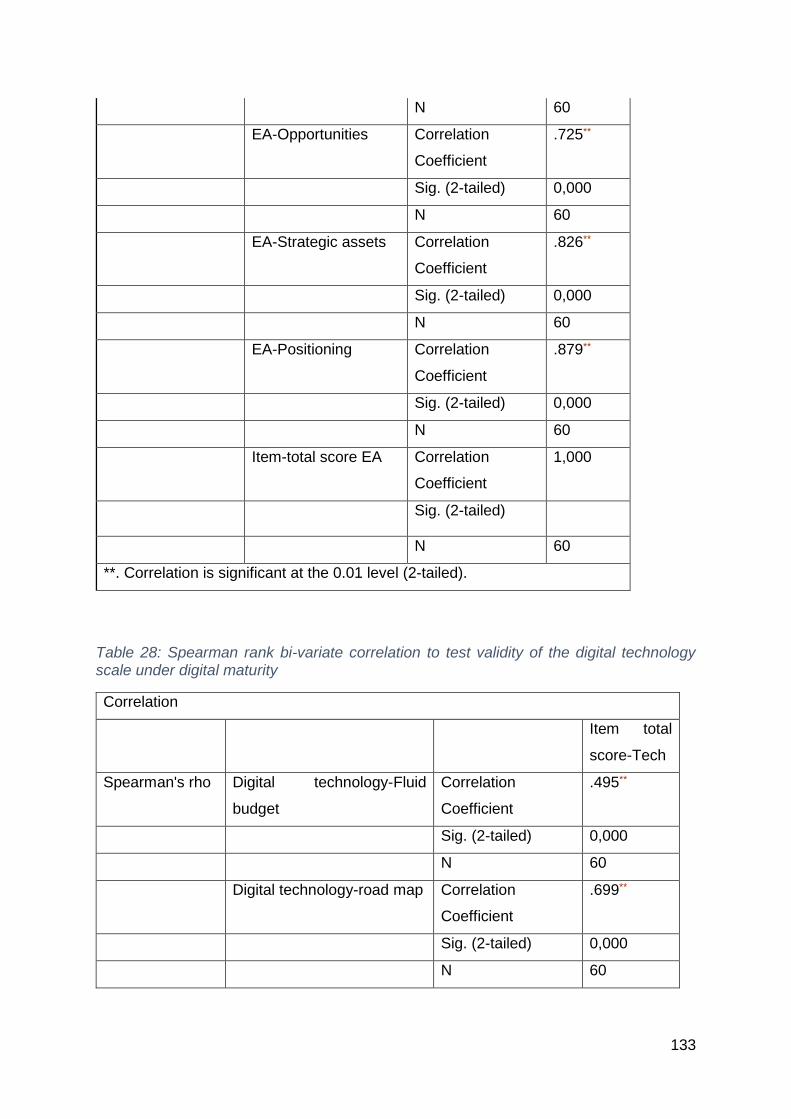
133
N 60
EA-Opportunities Correlation
Coefficient
.725**
Sig. (2-tailed) 0,000
N 60
EA-Strategic assets Correlation
Coefficient
.826**
Sig. (2-tailed) 0,000
N 60
EA-Positioning Correlation
Coefficient
.879**
Sig. (2-tailed) 0,000
N 60
Item-total score EA Correlation
Coefficient
1,000
Sig. (2-tailed)
N 60
**. Correlation is significant at the 0.01 level (2-tailed).
Table 28: Spearman rank bi-variate correlation to test validity of the digital technology scale under digital maturity
Correlation
Item total
score-Tech
Spearman's rho Digital technology-Fluid
budget
Correlation
Coefficient
.495**
Sig. (2-tailed) 0,000
N 60
Digital technology-road map Correlation
Coefficient
.699**
Sig. (2-tailed) 0,000
N 60

134
Digital technology- Approach Correlation
Coefficient
.770**
Sig. (2-tailed) 0,000
N 60
Digital technology-Modern
architecture
Correlation
Coefficient
.628**
Sig. (2-tailed) 0,000
N 60
Technology-measurement Correlation
Coefficient
.745**
Sig. (2-tailed) 0,000
N 60
Digital technology-customer
experience assets
Correlation
Coefficient
.641**
Sig. (2-tailed) 0,000
N 60
Digital technology-digital
tools
Correlation
Coefficient
.740**
Sig. (2-tailed) 0,000
N 60
Item total score-Tech Correlation
Coefficient
1,000
Sig. (2-tailed)
N 60
Table 29: Spearman rank bi-variate correlation to test validity of the digital culture scale under digital maturity
Correlations
Item total score-
Digital culture

135
Spearman's rho Digital culture-competitive
strategy
Correlation
Coefficient
.577**
Sig. (2-tailed) 0,000
N 60
Digital culture-board support Correlation
Coefficient
.648**
Sig. (2-tailed) 0,000
N 60
Digital culture-right leaders Correlation
Coefficient
.650**
Sig. (2-tailed) 0,000
N 60
Digital culture-education and
training investment
Correlation
Coefficient
.792**
Sig. (2-tailed) 0,000
N 60
Digital culture-communicate
digital vision
Correlation
Coefficient
.740**
Sig. (2-tailed) 0,000
N 60
Digital culture- measured
risks
Correlation
Coefficient
.604**
Sig. (2-tailed) 0,000
N 60
Digital culture-customer
experience
Correlation
Coefficient
.670**
Sig. (2-tailed) 0,000
N 60
Item total score-Digital
culture
Correlation
Coefficient
1,000
Sig. (2-tailed)
N 60

136
**. Correlation is significant at the 0.01 level (2-tailed).
*. Correlation is significant at the 0.05 level (2-tailed).
Table 30: Spearman rank bi-variate correlation to test validity of the digital organisational structure scale under digital maturity
Correlations
Item total score-
Organisation
Spearman's
rho
Organisation- customer
journeys
Correlation
Coefficient
.672**
Sig. (2-
tailed)
0,000
N 60
Organisation-resources Correlation
Coefficient
.844**
Sig. (2-
tailed)
0,000
N 60
Organisation- best in class
staff
Correlation
Coefficient
.824**
Sig. (2-
tailed)
0,000
N 60
Organisation- digital skills Correlation
Coefficient
.778**
Sig. (2-
tailed)
0,000
N 60
Organisation-
collaboration
Correlation
Coefficient
.704**
Sig. (2-
tailed)
0,000
N 60

137
Organisation- processes Correlation
Coefficient
.770**
Sig. (2-
tailed)
0,000
N 60
Organisation-vendor
partners
Correlation
Coefficient
.670**
Sig. (2-
tailed)
0,000
N 60
Item total score-
Organisation
Correlation
Coefficient
1,000
Sig. (2-
tailed)
N 60
**. Correlation is significant at the 0.01 level (2-tailed).
*. Correlation is significant at the 0.05 level (2-tailed).
Table 31: Spearman rank bi-variate correlation to test validity of the digital insights scale under digital maturity
Correlations
Item total
score-
Insights
Spearman's rho Insights- quantifiable goals Correlation
Coefficient
.754**
Sig. (2-tailed) 0,000
N 60
Insights- employee
understanding of
contribution
Correlation
Coefficient
.804**
Sig. (2-tailed) 0,000
N 60

138
Insights- customer
centered measures
Correlation
Coefficient
.744**
Sig. (2-tailed) 0,000
N 60
Insights- multiple channels Correlation
Coefficient
.881**
Sig. (2-tailed) 0,000
N 60
Insights-digital strategy Correlation
Coefficient
.843**
Sig. (2-tailed) 0,000
N 60
Insights-digital tools Correlation
Coefficient
.802**
Sig. (2-tailed) 0,000
N 60
Insights-lessons learned Correlation
Coefficient
.826**
Sig. (2-tailed) 0,000
N 60
Item total score- Insights Correlation
Coefficient
1,000
Sig. (2-tailed)
N 60
**. Correlation is significant at the 0.01 level (2-tailed).

139
Appendix D: Factor analysis
Table 32: Correlation matrix for Entrepreneurial agility scale
Correlation Matrix
EA-
Scenarios
EA-
Opportunities
EA-
Strategic
assets
EA-
Positioning
Correlation EA-Scenarios 1,000 0,454 0,313 0,420
EA-
Opportunities
0,454 1,000 0,427 0,527
EA-Strategic
assets
0,313 0,427 1,000 0,718
EA-
Positioning
0,420 0,527 0,718 1,000
Table 33: Correlation matrix for Digital Maturity- Digital technology scale
Correlation Matrix
Digital
technol
ogy-
Fluid
budget
Digital
technol
ogy-
road
map
Digital
technol
ogy-
Approa
ch
Digital
technol
ogy-
Moder
n
archite
cture
Digital
technolo
gy-
measure
ment
Digital
technol
ogy-
custom
er
experie
nce
assets
Digital
technol
ogy-
digital
tools
Correl
ation
Digital
technolo
gy-Fluid
budget
1,000 0,382 0,413 0,207 0,465 0,122 0,311
Digital
technolo
0,382 1,000 0,385 0,159 0,368 0,452 0,397

140
gy-road
map
Digital
technolo
gy-
Approac
h
0,413 0,385 1,000 0,616 0,519 0,352 0,338
Digital
technolo
gy-
Modern
architect
ure
0,207 0,159 0,616 1,000 0,457 0,197 0,341
Digital
technolo
gy-
measure
ment
0,465 0,368 0,519 0,457 1,000 0,421 0,622
Digital
technolo
gy-
custome
r
experien
ce
assets
0,122 0,452 0,352 0,197 0,421 1,000 0,611
Digital
technolo
gy-
digital
tools
0,311 0,397 0,338 0,341 0,622 0,611 1,000

141
Table 34: Correlation matrix for Digital Maturity- Digital culture scale
Correlation Matrix
Digital
culture-
compet
itive
strateg
y
Digital
culture-
board
support
Digital
culture-
right
leaders
Digital
culture-
educati
on and
training
investm
ent
Digital
culture-
commu
nicate
digital
vision
Digital
culture-
measur
ed risks
Digital
culture-
custom
er
experie
nce
Correl
ation
Digital
culture-
compet
itive
strateg
y
1,000 0,411 0,133 0,398 0,320 0,002 0,266
Digital
culture-
board
support
0,411 1,000 0,476 0,439 0,375 0,259 0,476
Digital
culture-
right
leaders
0,133 0,476 1,000 0,531 0,297 0,428 0,344
Digital
culture-
educati
on and
training
investm
ent
0,398 0,439 0,531 1,000 0,595 0,436 0,448
Digital
culture-
commu
nicate
0,320 0,375 0,297 0,595 1,000 0,441 0,369

142
digital
vision
Digital
culture-
measur
ed risks
0,002 0,259 0,428 0,436 0,441 1,000 0,293
Digital
culture-
custom
er
experie
nce
0,266 0,476 0,344 0,448 0,369 0,293 1,000
Table 35: Correlation matrix for Digital Maturity-Digital organisational structure scale
Correlation Matrix
Organis
ation-
custom
er
journey
s
Organis
ation-
resourc
es
Organis
ation-
best in
class
staff
Organis
ation-
digital
skills
Organis
ation-
collabor
ation
Organis
ation-
process
es
Organis
ation-
vendor
partner
s
Co
rrel
ati
on
Organis
ation-
custom
er
journey
s
1,000 0,637 0,530 0,417 0,384 0,458 0,291
Organis
ation-
resourc
es
0,637 1,000 0,674 0,501 0,393 0,580 0,545
Organis
ation-
0,530 0,674 1,000 0,613 0,577 0,522 0,477

143
best in
class
staff
Organis
ation-
digital
skills
0,417 0,501 0,613 1,000 0,582 0,558 0,513
Organis
ation-
collabor
ation
0,384 0,393 0,577 0,582 1,000 0,616 0,381
Organis
ation-
process
es
0,458 0,580 0,522 0,558 0,616 1,000 0,428
Organis
ation-
vendor
partner
s
0,291 0,545 0,477 0,513 0,381 0,428 1,000
Table 36: Correlation matrix for Digital Maturity- Digital insights scale
Correlation Matrix
Insights
-
quantifi
able
goals
Insights-
employee
understan
ding of
contributi
on
Insight
s-
custo
mer
center
ed
measu
res
Insigh
ts-
multipl
e
chann
els
Insigh
ts-
digital
strate
gy
Insigh
ts-
digital
tools
Insigh
ts-
lesso
ns
learn
ed

144
Correla
tion
Insights-
quantifiabl
e goals
1,000 0,509 0,466 0,647 0,538 0,458 0,650
Insights-
employee
understan
ding of
contributi
on
0,509 1,000 0,566 0,687 0,557 0,557 0,670
Insights-
customer
centered
measures
0,466 0,566 1,000 0,669 0,491 0,441 0,469
Insights-
multiple
channels
0,647 0,687 0,669 1,000 0,646 0,539 0,675
Insights-
digital
strategy
0,538 0,557 0,491 0,646 1,000 0,863 0,672
Insights-
digital
tools
0,458 0,557 0,441 0,539 0,863 1,000 0,662
Insights-
lessons
learned
0,650 0,670 0,469 0,675 0,672 0,662 1,000
Table 37: KMO and Bartlett's test for sphericity results on construct scales
KMO and
Bartlett's Test
Entreprene
urial Agility
DM
Digital
technol
ogy
DM Digital
culture DM Organisation
DM
Insig
hts
Kaiser-Meyer-
Olkin Measure
0,707 0,733 0,772 0,835 0,848
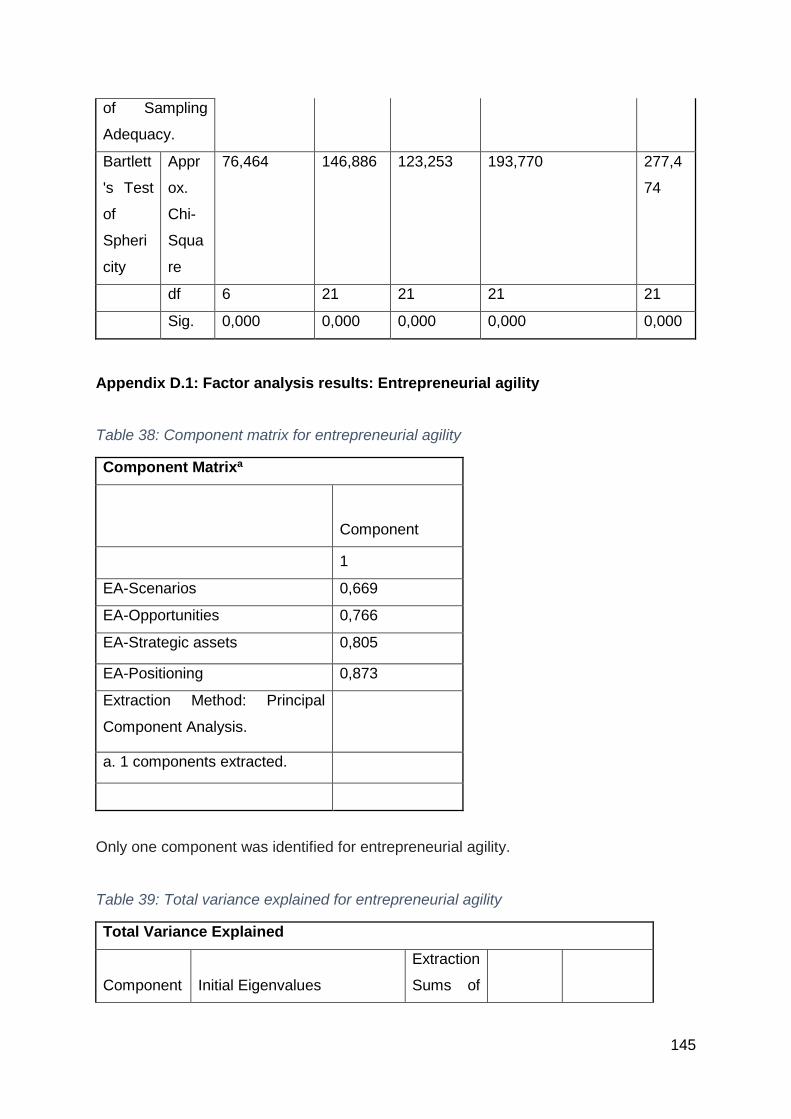
145
of Sampling
Adequacy.
Bartlett
's Test
of
Spheri
city
Appr
ox.
Chi-
Squa
re
76,464 146,886 123,253 193,770 277,4
74
df 6 21 21 21 21
Sig. 0,000 0,000 0,000 0,000 0,000
Appendix D.1: Factor analysis results: Entrepreneurial agility
Table 38: Component matrix for entrepreneurial agility
Component Matrixa
Component
1
EA-Scenarios 0,669
EA-Opportunities 0,766
EA-Strategic assets 0,805
EA-Positioning 0,873
Extraction Method: Principal
Component Analysis.
a. 1 components extracted.
Only one component was identified for entrepreneurial agility.
Table 39: Total variance explained for entrepreneurial agility
Total Variance Explained
Component Initial Eigenvalues
Extraction
Sums of

146
Squared
Loadings
Total
% of
Variance
Cumulative
% Total
% of
Variance
Cumulative
%
1 2,45 61,14 61,14 2,45 61,14 61,14
2 0,77 19,20 80,34
3 0,52 12,99 93,33
4 0,27 6,67 100,000
The total variance explained for factor 1 is 61.14%.
Appendix D.2: Factor analysis results: Digital technology
Table 40: Rotated component matrix for Digital Maturity- Digital technology
Rotated Component Matrixa
Component
1 2 Questions/variables Factors
Digital
technology-
customer
experience
assets
0,856 0,073
Our organisation uses
customer experience
assets like personas and
journey maps to drive
our technology design
Digital
Technology
strategy
Digital
technology-
digital tools
0,780 0,299
Our organisation makes
use of digital tools to
promote innovation,
collaboration, and
mobility of our
employees.
Digital
technology-road
map
0,692 0,211
Our digital technology
road map is created by
both marketing and
technology resources
working together

147
Digital
technology-
measurement
0,529 0,623
Technology teams are
measured by business
outcomes and not just by
the system reliability
Digital
Technology
embeddedness
Digital
technology-Fluid
budget
0,264 0,560
Our organisation has a
budget for technology
that is fluid to allow for
shifting priorities
Digital
technology-
Approach
0,240 0,823
Our approach to
technology development
is flexible, collaborative
and iterative
Digital
technology-
Modern
architecture
0,027 0,840
Our organisation
leverages modern data
architectures like the
cloud or application
programming interfaces
(APIs) for increased
speed and flexibility
Extraction Method: Principal Component Analysis.
Rotation Method: Varimax with Kaiser Normalization.
a. Rotation converged in 3 iterations.
There were two factors identified for Digital Maturity- Digital technology which were termed
Digital technology strategy and Digital technology embeddedness. These factor scores
were calculated by taking the average of the item scores for the set of questions per factor.
Table 41: Total variance explained for Digital Maturity- Digital technology
Total Variance Explained
Comp
onent
Initial Eigenvalues Extract
ion
Sums
Rotati
on
Sums

148
of
Square
d
Loadin
gs
of
Squar
ed
Loadi
ngs
Total % of
Varian
ce
Cumula
tive %
Total % of
Varian
ce
Cumula
tive %
Total % of
Varian
ce
Cumula
tive %
1 3,36 48,07 48,07 3,36 48,07 48,07 2,23 31,83
2 1,09 15,53 63,59 1,09 15,53 63,59 2,22 31,76
3 0,90 12,91 76,50
4 0,67 9,51 86,02
5 0,40 5,69 91,70
6 0,34 4,80 96,51
7 0,24 3,49 100,00
Extraction Method: Principal Component Analysis
The total variance explained for factors 1 is 48.066% and factor 2 is 15.527% with a total
variance explained of 63.593%.
Appendix D.3: Factor analysis results: Digital Culture
Table 42: Rotated component matrix for Digital Maturity- Digital culture
Rotated Component Matrixa
Component
1 2 Questions/variables Factors
Digital culture-
measured risks
0,856 -
0,075
Our organisation takes
measured risks to drive
innovation
Digital culture
embeddedness

149
Digital culture-
right leaders
0,721 0,214 We believe the
organisation has the right
leaders to execute our
digital strategy on a day to
day basis
Digital culture-
education and
training
investment
0,639 0,525 Our organisation invests
in digital training and
education at all levels
Digital culture-
communicate
digital vision
0,574 0,443 Our organisations digital
vision is communicated
both internally and
externally
Digital culture-
customer
experience
0,444 0,517 Overall customer
experience is prioritised
holistically over a single
distribution channel
Leadership
support
Digital culture-
board support
0,383 0,666 Our digital strategy is
backed by our board and
C-level executives
Digital culture-
competitive
strategy
-0,104 0,885 Our organisation's
competitive strategy
depends on digital
Extraction Method: Principal Component Analysis.
Rotation Method: Varimax with Kaiser Normalization.
a. Rotation converged in 3 iterations.
There were two factors identified which were defined as Digital culture embeddedness
and Leadership support. These factor scores were calculated by taking the average of the
item scores for the set of questions per factor.

150
Table 43: Total variance explained for Digital Maturity: Digital Culture
Total Variance Explained
Compo
nent Initial Eigenvalues
Extrac
tion
Sums
of
Squar
ed
Loadin
gs
Rotati
on
Sums
of
Squar
ed
Loadi
ngs
Total
% of
Varia
nce
Cumul
ative % Total
% of
Varia
nce
Cumul
ative % Total
% of
Varia
nce
Cumul
ative %
1 3,27 46,67 46,67 3,27 46,67 46,67 2,34 33,49 33,49
2 1,10 15,65 62,32 1,10 15,65 62,32 2,02 28,84 62,32
3 0,79 11,26 73,58
4 0,64 9,19 82,77
5 0,48 6,88 89,65
6 0,44 6,22 95,87
7 0,29 4,13 100,00
Extraction Method: Principal Component Analysis.
The total variance explained for factors 1 is 46.67% and factor 2 is 15.65% with a total
variance explained of 62,32%.
Appendix D.4: Factor analysis results: Digital organisational structure
Table 44: Component matrix for Digital maturity- Digital organisational structure
Component Matrixa
Component
1

151
Organisation- customer
journeys
0,693
Organisation-resources 0,817
Organisation- best in class
staff
0,832
Organisation- digital skills 0,788
Organisation- collaboration 0,737
Organisation- processes 0,784
Organisation-vendor partners 0,672
Extraction Method: Principal
Component Analysis.
a. 1 components extracted.
There was only one factor identified, an average of all the item scores were taken to
calculate the single factor and this factor was defined as organisational structure.
Table 45: Total variance explained for Digital maturity-Digital Organisational structure.
Total Variance Explained
Component Initial Eigenvalues
Extractio
n Sums
of
Squared
Loadings
Total
% of
Varianc
e
Cumulativ
e % Total
% of
Varianc
e
Cumulativ
e %
1 4,07 58,15 58,15 4,07 58,15 58,15
2 0,80 11,37 69,52
3 0,71 10,07 79,59
4 0,48 6,84 86,43
5 0,38 5,49 91,93
6 0,36 5,13 97,06
7 0,21 2,94 100,00
Extraction Method: Principal Component Analysis.

152
The single factor explained 58.15% of the total variance.
Appendix D.5: Factor analysis results: Digital Insights
Table 46: Component matrix for Digital maturity-Digital insights
Component Matrixa
Component
1
Insights- quantifiable goals 0,752
Insights- employee understanding
of contribution
0,805
Insights- customer centered
measures
0,716
Insights- multiple channels 0,862
Insights-digital strategy 0,849
Insights-digital tools 0,805
Insights-lessons learned 0,854
Extraction Method: Principal
Component Analysis.
a. 1 components extracted.
There was only one factor identified, an average of all the item scores were taken to
calculate the single factor and this factor was defined as Digital insights.
Table 47: Total variance explained for Digital maturity- Digital insights.
Total Variance Explained
Component Initial Eigenvalues
Extractio
n Sums
of
Squared
Loadings

153
Total
% of
Varianc
e
Cumulativ
e % Total
% of
Varianc
e
Cumulativ
e %
1 4,57 65,27 65,27 4,57 65,27 65,27
2 0,78 11,10 76,37
3 0,58 8,27 84,64
4 0,45 6,44 91,08
5 0,26 3,73 94,80
6 0,25 3,54 98,34
7 0,12 1,66 100,00
Extraction Method: Principal Component Analysis.
The single factor explained 65.27% of the total variance.
Appendix E: Moderated regression
Appendix E.1: Moderated regression assumptions
Assumption 5: The data must show homoscedasticity, which is when for all combinations
of independent and moderator variables, the error variances are the same.
Table 48: Summary of tests for homoscedasticity
Dependent Variable
Moderator variable
Independent variable Sig.
Sales
DTE EA 0,259
DTS EA 0,644
DCE EA 0,467
LS EA 0,385
DOS EA 0,42
DI EA 0,066
Market Share
DTE EA 0,425
DTS EA 0,92
DCE EA 0,146
LS EA 0,332
DOS EA 0,749
DI EA 0,361
Profit DTE EA 0,173

154
DTS EA 0,224
DCE EA 0,376
LS EA 0,039
DOS EA 0,233
DI EA 0,304
ROI
DTE EA 0,662
DTS EA 0,498
DCE EA 0,336
LS EA 0,142
DOS EA 0,271
DI EA 0,671
Table 48 shows that the p values were greater >0.05 for all regression tests using the
Breusch pagan test, which tests for homoscedasticity. The null hypothesis in this test is
that the data is homoscedastic hence, all the regressions had homoscedastic data.
Assumption 8: All the residuals (errors) are approximately normally distributed.
Table 49: Test for normality of residuals
Tests of Normality
Residual ID DV IV MV Kolmogorov-Smirnova Shapiro-
Wilk
Statistic df Sig. Statistic df Sig.
RE_TE_SA Sales EA DTE 0,097 60 .200* 0,955 60 0,027
RE_TE_MS Market Share
EA DTE 0,092 60 .200* 0,980 60 0,447
RE_TE_PR Profit EA DTE 0,092 60 .200* 0,984 60 0,639
RE_TE_RO ROI EA DTE 0,087 60 .200* 0,987 60 0,772
RE_TS_SA Sales EA DTS 0,101 60 .200* 0,956 60 0,030
RE_TS_MS Market Share
EA DTS 0,083 60 .200* 0,979 60 0,371
RE_TS_PR Profit EA DTS 0,077 60 .200* 0,987 60 0,783
RE_TS_RO ROI EA DTS 0,089 60 .200* 0,982 60 0,539
RE_DCE_S Sales EA DCE 0,116 60 0,043 0,957 60 0,034
RE_DCE_M Market Share
EA DCE 0,105 60 0,099 0,975 60 0,250
RE_DCE_P Profit EA DCE 0,081 60 .200* 0,984 60 0,622
RE_DCE_R ROI EA DCE 0,096 60 .200* 0,983 60 0,576
RE_LS_SA Sales EA LS 0,083 60 .200* 0,962 60 0,062
RE_LS_MS Market Share
EA LS 0,088 60 .200* 0,982 60 0,498
RE_LS_PR Profit EA LS 0,056 60 .200* 0,985 60 0,679
RE_LS_RO ROI EA LS 0,088 60 .200* 0,986 60 0,708
RE_DOS_S Sales EA DOS 0,118 60 0,038 0,959 60 0,040

155
RE_DOS_M Market Share
EA DOS 0,103 60 0,180 0,975 60 0,266
RE_DOS_P Profit EA DOS 0,097 60 .200* 0,982 60 0,535
RE_DOS_R ROI EA DOS 0,100 60 .200* 0,982 60 0,539
RE_DI_SA Sales EA DI 0,111 60 0,063 0,963 60 0,067
RE_DI_MS Market Share
EA DI 0,098 60 .200* 0,972 60 0,193
RE_DI_PR Profit EA DI 0,089 60 .200* 0,982 60 0,539
RE_DI_RO ROI EA DI 0,080 60 .200* 0,992 60 0,967
*. This is a lower bound of the true significance.
a. Lilliefors Significance Correction
Both the Shapiro Wilk test and Kolmogorov-Smirnov tests were used to test the normality
of the residuals, all the tests except for the regression analysis of Sales, EA and DOS; as
well as Sales, EA and DCE were found to have non normal residuals.
Appendix E.2: Moderated regression DV, Sales.
E.2.1 DTE, EA and Sales
Table 50: Model summary for moderated regression for DTE-EA-Sales.
Model Summaryb
Model R
R
Squar
e
Adjuste
d R
Square
Std.
Error of
the
Estimat
e
Change
Statistic
s
R
Square
Change
F
Chang
e
df
1
df
2
Sig. F
Chang
e
1 .568
a
0,322 0,286 0,638 0,322 8,869 3 56 0,000
a. Predictors: (Constant), TE_EA_C, TE_Cen, EA_cen
b. Dependent Variable: Sales
Table 51: Coefficients of moderated regression for DTE-EA-Sales.
Coefficientsa

156
Model
Unstandardized
Coefficients
Standardized
Coefficients t Sig.
Collinearity
Statistics
B
Std.
Error Beta Partial Part Tolerance VIF
1 (Constant) 3,73 0,09 43,32 0,00
EA_cen 0,34 0,11 0,37 3,16 0,00 0,39 0,35 0,89 1,12
TE_Cen 0,17 0,10 0,20 1,70 0,09 0,22 0,19 0,90 1,11
TE_EA_C 0,29 0,11 0,28 2,56 0,01 0,32 0,28 0,99 1,01
a. Dependent Variable: Sales
E.2.2 DTS, EA and Sales
Table 52: Model summary for moderated regression for DTS-EA-Sales
Model Summaryb
Model R
R
Squar
e
Adjuste
d R
Square
Std.
Error of
the
Estimat
e
Change
Statistic
s
R
Square
Change
F
Chang
e
df
1
df
2
Sig. F
Chang
e
1 .507
a
0,257 0,217 0,668 0,257 6,453 3 56 0,001
a. Predictors: (Constant), TS_EA_C, EA_cen, TS_Cen
b. Dependent Variable: Sales
Table 53: Model co-efficients and significance for DTS-EA-Sales
Coefficientsa
Model
Unstandardized
Coefficients
Standardized
Coefficients t Sig.
Collinearity
Statistics
B
Std.
Error Beta Partial Part Tolerance VIF
1 (Constant) 3,77 0,09 41,53 0,00
EA_cen 0,35 0,11 0,39 3,20 0,00 0,39 0,37 0,91 1,10
TS_Cen 0,20 0,13 0,19 1,53 0,13 0,20 0,18 0,89 1,13

157
TS_EA_C 0,16 0,16 0,11 0,96 0,34 0,13 0,11 0,97 1,04
a. Dependent Variable: Sales
E.2.3 Moderated regression between Leadership Support, Entrepreneurial agility and the
dependent variable Sales.
Table 54: Model summary for moderated regression for LS-EA-Sales.
Model Summaryb
Model R
R
Squar
e
Adjuste
d R
Square
Std.
Error of
the
Estimat
e
Change
Statistic
s
R
Square
Change
F
Chang
e df1 df2
Sig. F
Chang
e
1 .519
a
0,27 0,23 0,66 0,27 6,89 3,0
0
56,0
0
0,00
a. Predictors: (Constant), LS_EA_C, EA_cen, LS_Cen
b. Dependent Variable: Sales
Table 55: Model co-efficients and significance for LS-EA-Sales
Coefficientsa
Model
Unstandardized
Coefficients
Standardized
Coefficients t Sig.
Collinearity
Statistics
B
Std.
Error Beta Partial Part Tolerance VIF
1 (Constant) 3,72 0,09 39,62 0,00
EA_cen 0,32 0,12 0,35 2,61 0,01 0,33 0,30 0,74 1,36
LS_Cen 0,19 0,14 0,19 1,37 0,18 0,18 0,16 0,71 1,42
LS_EA_C 0,27 0,13 0,24 2,03 0,05 0,26 0,23 0,92 1,09
a. Dependent Variable: Sales
E.2.4 Moderated regression between digital culture embeddedness, entrepreneurial
agility and the dependent variable Sales.

158
Table 56: Model summary for moderated regression for DCE-EA-Sales
Model Summaryb
Model R
R
Squar
e
Adjuste
d R
Square
Std.
Error of
the
Estimat
e
Change
Statistic
s
R
Square
Change
F
Chang
e
df
1
df
2
Sig. F
Chang
e
1 .520
a
0,271 0,232 0,661 0,271 6,932 3 56 0,000
a. Predictors: (Constant), CE_EA_C, CulE_Cen, EA_cen
b. Dependent Variable: Sales
Table 57: Model co-efficients and significance for DCE-EA-Sales
Coefficientsa
Model
Unstandardized
Coefficients
Standardized
Coefficients t Sig.
Collinearity
Statistics
B
Std.
Error Beta Partial Part Tolerance VIF
1 (Constant) 3,73 0,09 39,77 0,00
EA_cen 0,30 0,12 0,33 2,49 0,02 0,32 0,28 0,75 1,34
CulE_Cen 0,18 0,12 0,19 1,49 0,14 0,19 0,17 0,77 1,30
CE_EA_C 0,22 0,12 0,21 1,77 0,08 0,23 0,20 0,97 1,03
a. Dependent Variable: Sales
E.2.5 Moderated regression between digital organisational structure, entrepreneurial
agility and the dependent variable Sales.
Table 58: Model summary for moderated regression for DOS-EA-Sales
Model Summaryb

159
Model R
R
Squar
e
Adjuste
d R
Square
Std.
Error of
the
Estimat
e
Change
Statistic
s
R
Square
Change
F
Chang
e
df
1
df
2
Sig. F
Chang
e
1 .496
a
0,247 0,206 0,672 0,247 6,107 3 56 0,001
a. Predictors: (Constant), DOS_EA_cen, DOS_cen, EA_cen
b. Dependent Variable: Sales
Table 59: Model co-efficients and significance for DOS-EA-Sales
Coefficientsa
Model
Unstandardized
Coefficients
Standardized
Coefficients t Sig.
Collinearity
Statistics
B
Std.
Error Beta Partial Part Tolerance VIF
1 (Constant) 3,73 0,10 36,73 0,00
EA_cen 0,33 0,13 0,36 2,57 0,01 0,32 0,30 0,69 1,44
DOS_cen 0,15 0,13 0,15 1,08 0,28 0,14 0,13 0,70 1,43
DOS_EA_cen 0,21 0,15 0,16 1,36 0,18 0,18 0,16 0,99 1,01
a. Dependent Variable: Sales
E.2.5 Moderated regression between digital insights, entrepreneurial agility and the
dependent variable Sales.
Table 60: Model summary for moderated regression for DI-EA-Sales
Model Summaryb
Mode
l R
R
Squar
e
Adjuste
d R
Square
Std.
Error of
the
Change
Statistic
s

160
Estimat
e
R
Square
Change
F
Chang
e df1 df2
Sig. F
Chang
e
1 .575
a
0,330 0,295 0,634 0,330 9,210 3 56 0,000
a. Predictors: (Constant), DI_EA_cen, DI_cen, EA_cen
b. Dependent Variable: Sales
Table 61: Model co-efficients and significance for DI-EA-Sales
Coefficientsa
Model
Unstandardized
Coefficients
Standardized
Coefficients t Sig.
Collinearity
Statistics
B
Std.
Error Beta Partial Part Tolerance VIF
1 (Constant) 3,64 0,10 36,97 0,00
EA_cen 0,27 0,13 0,29 2,09 0,04 0,27 0,23 0,60 1,66
DI_cen 0,20 0,12 0,23 1,63 0,11 0,21 0,18 0,61 1,65
DI_EA_cen 0,36 0,12 0,32 2,89 0,01 0,36 0,32 0,99 1,01
a. Dependent Variable: Sales
Appendix E.3: Moderated regression DV, Market share
E.3.1: Moderated regression between DTE, EA and the dependent variable Market Share.
Table 62: Model summary for moderated regression for DTE-EA-Market Share
Model Summaryb
Model R
R
Squar
e
Adjuste
d R
Square
Std.
Error of
the
Estimat
e
Change
Statistic
s
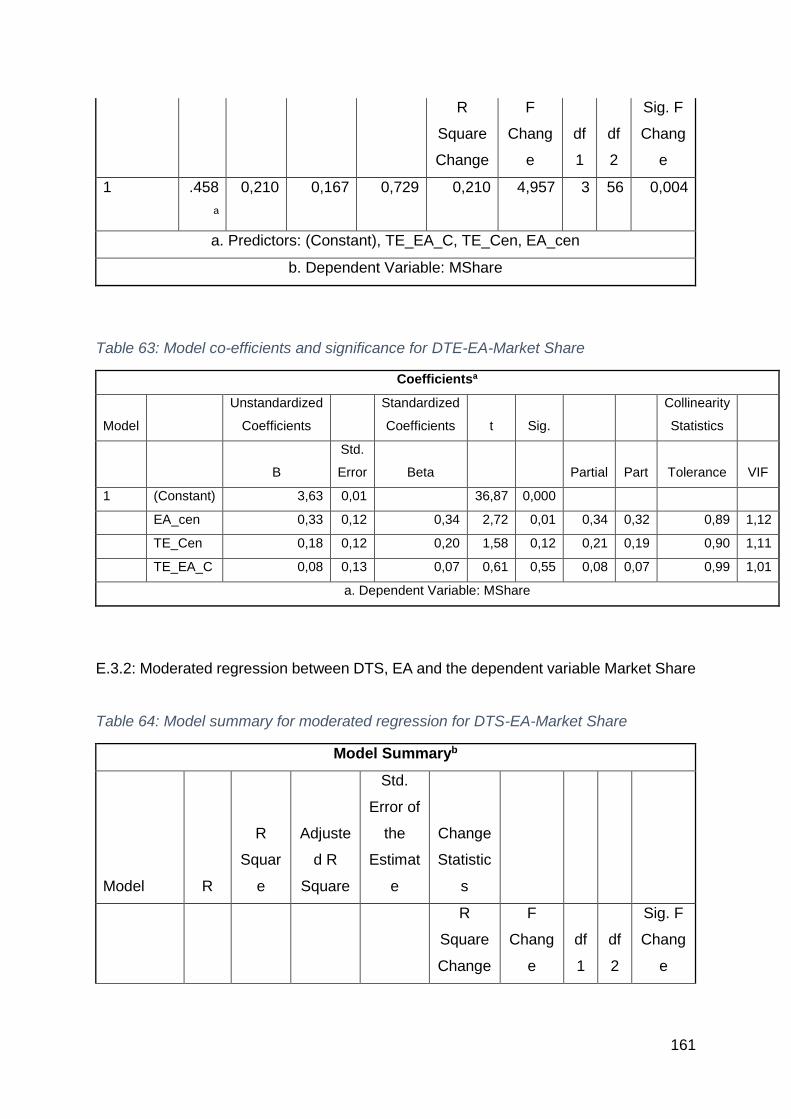
161
R
Square
Change
F
Chang
e
df
1
df
2
Sig. F
Chang
e
1 .458
a
0,210 0,167 0,729 0,210 4,957 3 56 0,004
a. Predictors: (Constant), TE_EA_C, TE_Cen, EA_cen
b. Dependent Variable: MShare
Table 63: Model co-efficients and significance for DTE-EA-Market Share
Coefficientsa
Model
Unstandardized
Coefficients
Standardized
Coefficients t Sig.
Collinearity
Statistics
B
Std.
Error Beta Partial Part Tolerance VIF
1 (Constant) 3,63 0,01 36,87 0,000
EA_cen 0,33 0,12 0,34 2,72 0,01 0,34 0,32 0,89 1,12
TE_Cen 0,18 0,12 0,20 1,58 0,12 0,21 0,19 0,90 1,11
TE_EA_C 0,08 0,13 0,07 0,61 0,55 0,08 0,07 0,99 1,01
a. Dependent Variable: MShare
E.3.2: Moderated regression between DTS, EA and the dependent variable Market Share
Table 64: Model summary for moderated regression for DTS-EA-Market Share
Model Summaryb
Model R
R
Squar
e
Adjuste
d R
Square
Std.
Error of
the
Estimat
e
Change
Statistic
s
R
Square
Change
F
Chang
e
df
1
df
2
Sig. F
Chang
e

162
1 .446
a
0,199 0,156 0,734 0,199 4,625 3 56 0,006
a. Predictors: (Constant), TS_EA_C, EA_cen, TS_Cen
b. Dependent Variable: MShare
Table 65: Model co-efficients and significance for DTS-EA-Market Share
Coefficientsa
Model
Unstandardized
Coefficients
Standardized
Coefficients t Sig.
Collinearity
Statistics
B
Std.
Error Beta Partial Part Tolerance VIF
1 (Constant) 3,66 0,10 36,60 0,00
EA_cen 0,35 0,12 0,36 2,86 0,01 0,36 0,34 0,91 1,10
TS_Cen 0,20 0,14 0,18 1,43 0,16 0,19 0,17 0,89 1,13
TS_EA_C -0,03 0,18 -0,02 -0,18 0,86 -0,02 -
0,02
0,97 1,04
a. Dependent Variable: MShare
E.3.3: Moderated regression between Leadership support, entrepreneurial agility and the
dependent variable Market Share
Table 66: Model summary for moderated regression for LS-EA-Market Share
Model Summaryb
Model R
R
Squar
e
Adjuste
d R
Square
Std.
Error of
the
Estimat
e
Change
Statistic
s
R
Square
Change
F
Chang
e
df
1
df
2
Sig. F
Chang
e
1 .431
a
0,186 0,142 0,740 0,186 4,262 3 56 0,009
a. Predictors: (Constant), LS_EA_C, EA_cen, LS_Cen

163
b. Dependent Variable: MShare
Table 67: Model co-efficients and significance for LS-EA-Market Share
Coefficientsa
Model
Unstandardized
Coefficients
Standardized
Coefficients t Sig.
Collinearity
Statistics
B
Std.
Error Beta Partial Part Tolerance VIF
1 (Constant) 3,61 0,10 34,43 0,00
EA_cen 0,33 0,14 0,34 2,45 0,02 0,31 0,30 0,74 1,36
LS_Cen 0,13 0,15 0,12 0,86 0,39 0,11 0,10 0,71 1,42
LS_EA_C 0,13 0,15 0,11 0,85 0,40 0,11 0,10 0,92 1,09
a. Dependent Variable: MShare
E.3.4: Moderated regression between Digital culture embeddedness, entrepreneurial
agility and the dependent variable Market Share
Table 68: Model summary for moderated regression for DCE-EA-Market Share
Model Summaryb
Model R
R
Squar
e
Adjuste
d R
Square
Std.
Error of
the
Estimat
e
Change
Statistic
s
R
Square
Change
F
Chang
e
df
1
df
2
Sig. F
Chang
e
1 .491
a
0,241 0,201 0,714 0,241 5,937 3 56 0,001
a. Predictors: (Constant), CE_EA_C, CulE_Cen, EA_cen
b. Dependent Variable: MShare
Table 69: Model co-efficients and significance for DCE-EA-Market Share
Coefficientsa

164
Model
Unstandardized
Coefficients
Standardized
Coefficients t Sig.
Collinearity
Statistics
B
Std.
Error Beta Partial Part Tolerance VIF
1 (Constant) 3,56 0,10 35,17 0,00
EA_cen 0,29 0,13 0,30 2,19 0,03 0,28 0,26 0,75 1,34
CulE_Cen 0,16 0,13 0,16 1,20 0,23 0,16 0,14 0,77 1,30
CE_EA_C 0,27 0,13 0,24 2,07 0,04 0,27 0,24 0,97 1,03
a. Dependent Variable: MShare
The above moderated regression summary indicates that the model is statistically
significant (p = 0,001), with adjusted R2 = 0.201 as shown in Error! Reference source
not found. above. There was homoscedasticity, as assessed by Breusch pagan test
shown in Table 48. There was no evidence of multi-collinearity as the tolerance and
variance inflation factors (VIF) were >0.1 and <10 respectively shown in Error! Reference
source not found.. The test for normality of residuals indicated with the Kolmogorov-
Smirnov test, that the data is not normally distributed with same result achieved with the
Shapiro Wilk-test. The moderator variable CE_EA_C was found to be statistically
significant (p = 0.044) with a coefficient of 0.245.
E.3.5: Moderated regression between DOS, EA and the dependent variable Market Share
Table 70: Model summary for moderated regression for DOS-EA-Market Share
Model Summaryb
Model R
R
Squar
e
Adjuste
d R
Square
Std.
Error of
the
Estimat
e
Change
Statistic
s
R
Square
Change
F
Chang
e
df
1
df
2
Sig. F
Chang
e
1 .442
a
0,195 0,152 0,736 0,195 4,520 3 56 0,007

165
a. Predictors: (Constant), DOS_EA_cen, DOS_cen, EA_cen
b. Dependent Variable: MShare
Table 71: Model co-efficients and significance for DOS-EA-Market Share .
Coefficientsa
Model
Unstandardized
Coefficients
Standardized
Coefficients t Sig.
Collinearity
Statistics
B
Std.
Error Beta Partial Part Tolerance VIF
1 (Constant) 3,60 0,11 32,41 0,00
EA_cen 0,31 0,14 0,32 2,23 0,03 0,29 0,27 0,69 1,44
DOS_cen 0,15 0,15 0,15 1,04 0,30 0,14 0,12 0,70 1,43
DOS_EA_cen 0,14 0,17 0,10 0,86 0,39 0,11 0,10 0,99 1,01
a. Dependent Variable: MShare
E.3.6: Moderated regression between DI, EA and the dependent variable Market Share
Table 72: Model summary for moderated regression for DI-EA-Market Share
Model Summaryb
Model R
R
Squar
e
Adjuste
d R
Square
Std.
Error of
the
Estimat
e
Change
Statistic
s
R
Square
Change
F
Chang
e
df
1
df
2
Sig. F
Chang
e
1 .476
a
0,227 0,186 0,721 0,227 5,480 3 56 0,002
a. Predictors: (Constant), DI_EA_cen, DI_cen, EA_cen
b. Dependent Variable: MShare

166
Table 73: Model co-efficients and significance for DI-EA-Market share
Coefficientsa
Model
Unstandardized
Coefficients
Standardized
Coefficients t Sig.
Collinearity
Statistics
B
Std.
Error Beta Partial Part Tolerance VIF
1 (Constant) 3,55 0,11 31,67 0,00
EA_cen 0,27 0,15 0,27 1,82 0,07 0,24 0,21 0,60 1,66
DI_cen 0,18 0,14 0,20 1,33 0,19 0,18 0,16 0,61 1,65
DI_EA_cen 0,23 0,14 0,20 1,65 0,10 0,22 0,19 0,99 1,01
a. Dependent Variable: MShare
Appendix E.4: Moderated regression DV, Profit.
E.4.1: Moderated regression between DTE, EA and the dependent variable Profit.
Table 74: Model summary for moderated regression for DTE-EA-Profit
Model Summaryb
Model R
R
Squar
e
Adjuste
d R
Square
Std.
Error of
the
Estimat
e
Change
Statistic
s
R
Square
Change
F
Chang
e
df
1
df
2
Sig. F
Chang
e
1 .376
a
0,141 0,095 0,711 0,141 3,076 3 56 0,035
a. Predictors: (Constant), TE_EA_C, TE_Cen, EA_cen
b. Dependent Variable: Profit
Table 75: Model co-efficients and significance for DTE-EA-Profit
Coefficientsa

167
Model
Unstandardized
Coefficients
Standardized
Coefficients t Sig.
Collinearity
Statistics
B
Std.
Error Beta Partial Part Tolerance VIF
1 (Constant) 3,68 0,10 38,29 0,00
EA_cen 0,29 0,12 0,32 2,42 0,02 0,31 0,30 0,89 1,12
TE_Cen 0,11 0,11 0,12 0,94 0,35 0,13 0,12 0,90 1,11
TE_EA_C 0,01 0,13 0,01 0,09 0,93 0,01 0,01 0,99 1,01
a. Dependent Variable: Profit
E.4.2: Moderated regression between DTS, EA and the dependent variable Profit.
Table 76: Model summary for moderated regression for DTS-EA-Profit
Model Summaryb
Model R
R
Squar
e
Adjuste
d R
Square
Std.
Error of
the
Estimat
e
Change
Statistic
s
R
Square
Change
F
Chang
e
df
1
df
2
Sig. F
Chang
e
1 .383
a
0,147 0,101 0,709 0,147 3,206 3 56 0,030
a. Predictors: (Constant), TS_EA_C, EA_cen, TS_Cen
b. Dependent Variable: Profit
Table 77: Model co-efficients and significance for DTS-EA-Profit
Coefficientsa
Model
Unstandardized
Coefficients
Standardized
Coefficients t Sig.
Collinearity
Statistics
B
Std.
Error Beta Partial Part Tolerance VIF
1 (Constant) 3,68 0,10 38,15 0,00
EA_cen 0,28 0,12 0,31 2,42 0,02 0,31 0,30 0,91 1,10
TS_Cen 0,15 0,14 0,14 1,08 0,29 0,14 0,13 0,89 1,13
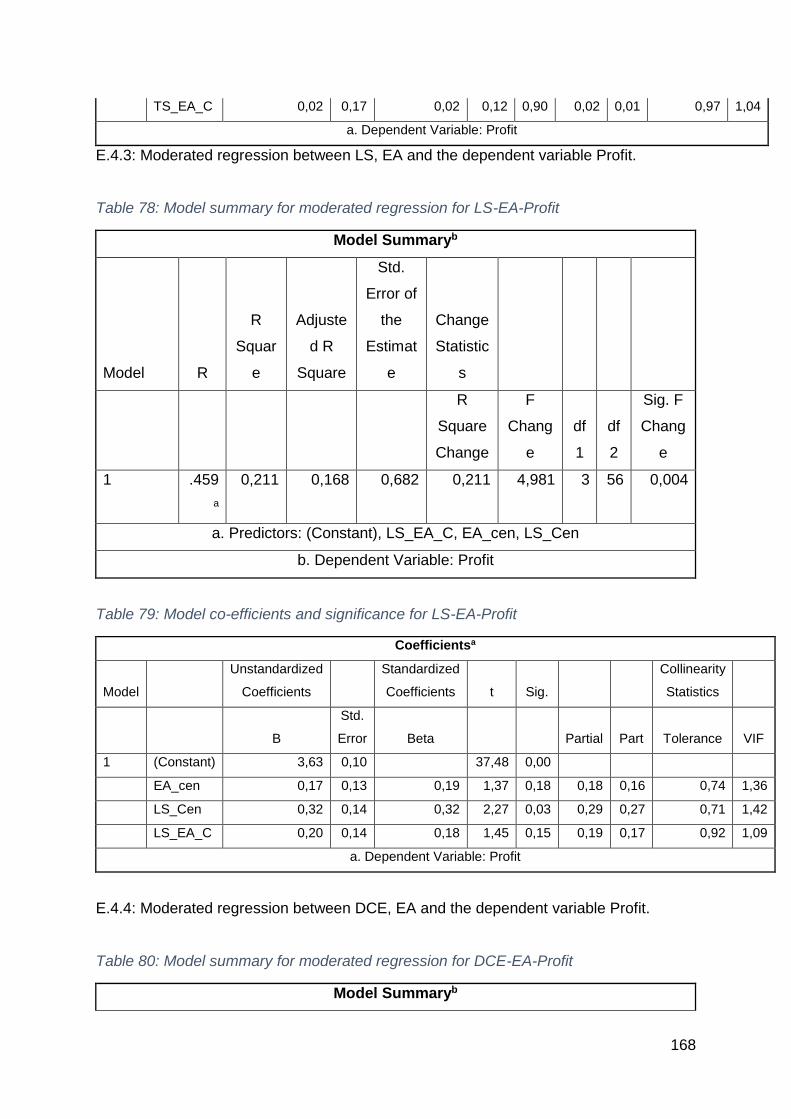
168
TS_EA_C 0,02 0,17 0,02 0,12 0,90 0,02 0,01 0,97 1,04
a. Dependent Variable: Profit
E.4.3: Moderated regression between LS, EA and the dependent variable Profit.
Table 78: Model summary for moderated regression for LS-EA-Profit
Model Summaryb
Model R
R
Squar
e
Adjuste
d R
Square
Std.
Error of
the
Estimat
e
Change
Statistic
s
R
Square
Change
F
Chang
e
df
1
df
2
Sig. F
Chang
e
1 .459
a
0,211 0,168 0,682 0,211 4,981 3 56 0,004
a. Predictors: (Constant), LS_EA_C, EA_cen, LS_Cen
b. Dependent Variable: Profit
Table 79: Model co-efficients and significance for LS-EA-Profit
Coefficientsa
Model
Unstandardized
Coefficients
Standardized
Coefficients t Sig.
Collinearity
Statistics
B
Std.
Error Beta Partial Part Tolerance VIF
1 (Constant) 3,63 0,10 37,48 0,00
EA_cen 0,17 0,13 0,19 1,37 0,18 0,18 0,16 0,74 1,36
LS_Cen 0,32 0,14 0,32 2,27 0,03 0,29 0,27 0,71 1,42
LS_EA_C 0,20 0,14 0,18 1,45 0,15 0,19 0,17 0,92 1,09
a. Dependent Variable: Profit
E.4.4: Moderated regression between DCE, EA and the dependent variable Profit.
Table 80: Model summary for moderated regression for DCE-EA-Profit
Model Summaryb

169
Model R
R
Squar
e
Adjuste
d R
Square
Std.
Error of
the
Estimat
e
Change
Statistic
s
R
Square
Change
F
Chang
e
df
1
df
2
Sig. F
Chang
e
1 .379
a
0,144 0,098 0,710 0,144 3,136 3 56 0,032
a. Predictors: (Constant), CE_EA_C, CulE_Cen, EA_cen
b. Dependent Variable: Profit
Table 81: Model co-efficients and significance for DCE-EA-Profit
Coefficientsa
Model
Unstandardized
Coefficients
Standardized
Coefficients t Sig.
Collinearity
Statistics
B
Std.
Error Beta Partial Part Tolerance VIF
1 (Constant) 3,65 0,10 36,26 0,00
EA_cen 0,35 0,13 0,39 2,70 0,01 0,34 0,33 0,75 1,34
CulE_Cen -0,08 0,13 -0,09 -0,66 0,51 -0,09 -
0,08
0,77 1,30
CE_EA_C 0,10 0,13 0,09 0,73 0,47 0,10 0,09 0,97 1,03
a. Dependent Variable: Profit
E.4.5: Moderated regression between Digital organisational structure, entrepreneurial
agility and the dependent variable Profit.
Table 82: Model summary for moderated regression for DOS-EA-Profit
Model Summaryb
Model R
R
Squar
e
Adjuste
d R
Square
Std.
Error of
the
Change
Statistic
s
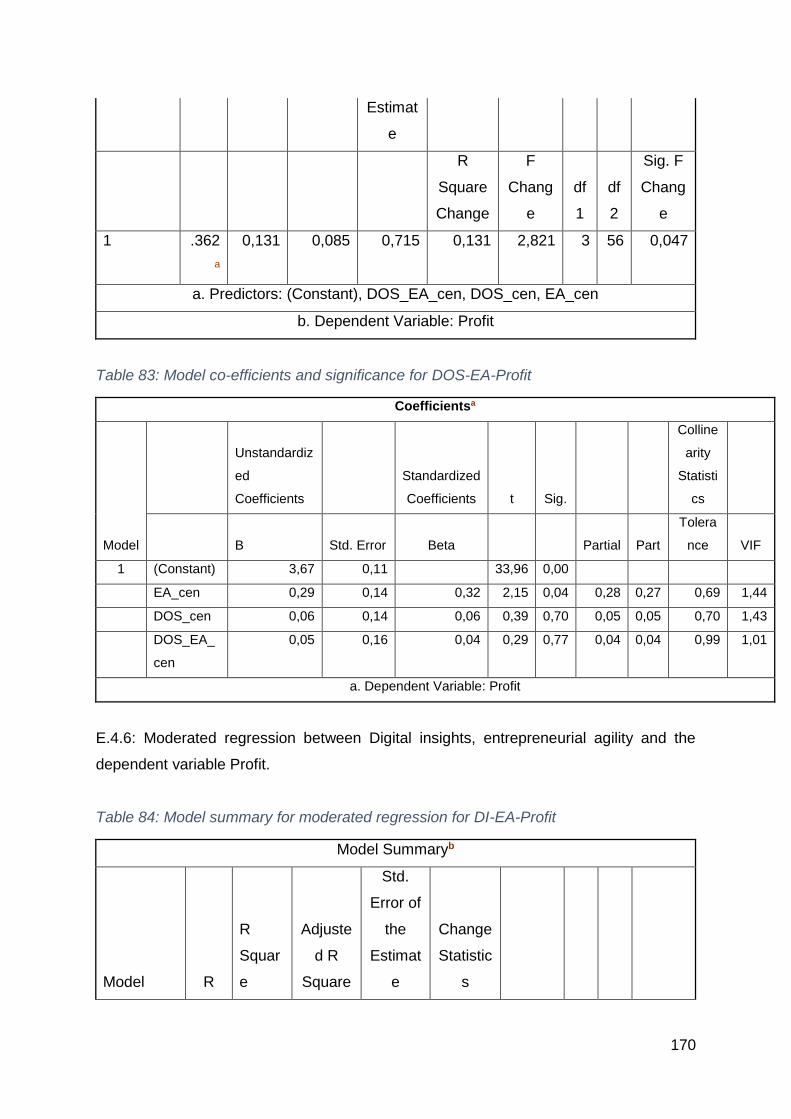
170
Estimat
e
R
Square
Change
F
Chang
e
df
1
df
2
Sig. F
Chang
e
1 .362
a
0,131 0,085 0,715 0,131 2,821 3 56 0,047
a. Predictors: (Constant), DOS_EA_cen, DOS_cen, EA_cen
b. Dependent Variable: Profit
Table 83: Model co-efficients and significance for DOS-EA-Profit
Coefficientsa
Model
Unstandardiz
ed
Coefficients
Standardized
Coefficients t Sig.
Colline
arity
Statisti
cs
B Std. Error Beta Partial Part
Tolera
nce VIF
1 (Constant) 3,67 0,11 33,96 0,00
EA_cen 0,29 0,14 0,32 2,15 0,04 0,28 0,27 0,69 1,44
DOS_cen 0,06 0,14 0,06 0,39 0,70 0,05 0,05 0,70 1,43
DOS_EA_
cen
0,05 0,16 0,04 0,29 0,77 0,04 0,04 0,99 1,01
a. Dependent Variable: Profit
E.4.6: Moderated regression between Digital insights, entrepreneurial agility and the
dependent variable Profit.
Table 84: Model summary for moderated regression for DI-EA-Profit
Model Summaryb
Model R
R
Squar
e
Adjuste
d R
Square
Std.
Error of
the
Estimat
e
Change
Statistic
s

171
R
Square
Change
F
Chang
e
df
1
df
2
Sig. F
Chang
e
1 .371
a
0,138 0,092 0,713 0,138 2,986 3 56 0,039
a. Predictors: (Constant), DI_EA_cen, DI_cen, EA_cen
b. Dependent Variable: Profit
Table 85: Model co-efficients and significance for DI-EA-Profit
Coefficientsa
Model
Unstandardized
Coefficients
Standardized
Coefficients t Sig.
Collinearity
Statistics
B
Std.
Error Beta Partial Part Tolerance VIF
1 (Constant) 3,63 0,11 32,81 0,00
EA_cen 0,31 0,15 0,35 2,16 0,03 0,28 0,27 0,60 1,66
DI_cen 0,01 0,14 0,01 0,07 0,95 0,01 0,01 0,61 1,65
DI_EA_cen 0,11 0,14 0,10 0,82 0,42 0,11 0,10 0,99 1,01
a. Dependent Variable: Profit
Appendix E.5: Moderation regression DV, ROI
E.5.1: Moderated regression between Digital Technology embeddedness, entrepreneurial
agility and the dependent variable ROI.
Table 86: Model summary for moderated regression for DTE-EA- ROI
Model Summaryb
Model R
R
Squar
e
Adjuste
d R
Square
Std.
Error of
the
Estimat
e
Change
Statistic
s
R
Square
Change
F
Chang
e
df
1
df
2
Sig. F
Chang
e

172
1 .416
a
0,173 0,129 0,770 0,173 3,913 3 56 0,013
a. Predictors: (Constant), TE_EA_C, TE_Cen, EA_cen
b. Dependent Variable: ROI
Table 87: Model co-efficients and significance for DTE-EA-ROI
Coefficientsa
Model
Unstandardized
Coefficients
Standardized
Coefficients t Sig.
Collinearity
Statistics
B
Std.
Error Beta Partial Part Tolerance VIF
1 (Constant) 3,71 0,10 35,61 0,00
EA_cen 0,39 0,13 0,39 3,04 0,00 0,38 0,37 0,89 1,12
TE_Cen 0,05 0,12 0,05 0,41 0,68 0,06 0,05 0,90 1,11
TE_EA_C 0,04 0,14 0,04 0,31 0,76 0,04 0,04 0,99 1,01
a. Dependent Variable: ROI
E.5.2: Moderated regression between Digital Technology strategy, entrepreneurial agility
and the dependent variable ROI.
Table 88: Model summary for moderated regression for DTS-EA-ROI
Model Summaryb
Model R
R
Squar
e
Adjuste
d R
Square
Std.
Error of
the
Estimat
e
Change
Statistic
s
R
Square
Change
F
Chang
e
df
1
df
2
Sig. F
Chang
e
1 .482
a
0,232 0,191 0,742 0,232 5,645 3 56 0,002
a. Predictors: (Constant), TS_EA_C, EA_cen, TS_Cen
b. Dependent Variable: ROI

173
Table 89: Model co-efficients and significance for DTS-EA-ROI
Coefficientsa
Model
Unstandardized
Coefficients
Standardized
Coefficients t Sig.
Collinearity
Statistics
B
Std.
Error Beta Partial Part Tolerance VIF
1 (Constant) 3,71 0,10 36,75 0,00
EA_cen 0,33 0,12 0,33 2,70 0,01 0,34 0,32 0,91 1,10
TS_Cen 0,30 0,14 0,26 2,09 0,04 0,27 0,24 0,89 1,13
TS_EA_C 0,03 0,18 0,02 0,16 0,88 0,02 0,02 0,97 1,04
a. Dependent Variable: ROI
E.5.3: Moderated regression between Leadership support, entrepreneurial agility and the
dependent variable ROI.
Table 90: Model summary for moderated regression for LS-EA-ROI
Model Summaryb
Model R
R
Squar
e
Adjuste
d R
Square
Std.
Error of
the
Estimat
e
Change
Statistic
s
R
Square
Change
F
Chang
e
df
1
df
2
Sig. F
Chang
e
1 .499
a
0,249 0,209 0,734 0,249 6,190 3 56 0,001
a. Predictors: (Constant), LS_EA_C, EA_cen, LS_Cen
b. Dependent Variable: ROI
Table 91: Model co-efficients and significance for LS-EA-ROI
Coefficientsa

174
Model
Unstandardized
Coefficients
Standardized
Coefficients t Sig.
Collinearity
Statistics
B
Std.
Error Beta Partial Part Tolerance VIF
1 (Constant) 3,63 0,10 34,88 0,00
EA_cen 0,27 0,14 0,27 1,96 0,05 0,25 0,23 0,74 1,36
LS_Cen 0,29 0,15 0,27 1,95 0,06 0,25 0,23 0,71 1,42
LS_EA_C 0,28 0,15 0,24 1,95 0,06 0,25 0,23 0,92 1,09
a. Dependent Variable: ROI
E.5.4 Moderated regression between Digital culture embeddedness, entrepreneurial
agility and the dependent variable ROI.
Table 92: Model summary for moderated regression for DCE-EA-ROI
Model Summaryb
Model R
R
Squar
e
Adjuste
d R
Square
Std.
Error of
the
Estimat
e
Change
Statistic
s
R
Square
Change
F
Chang
e
df
1
df
2
Sig. F
Chang
e
1 .470
a
0,221 0,179 0,748 0,221 5,297 3 56 0,003
a. Predictors: (Constant), CE_EA_C, CulE_Cen, EA_cen
b. Dependent Variable: ROI
Table 93: Model co-efficients and significance for DCE-EA-ROI
Coefficientsa
Model
Unstandardized
Coefficients
Standardized
Coefficients t Sig.
Collinearity
Statistics
B
Std.
Error Beta Partial Part Tolerance VIF
1 (Constant) 3,64 0,11 34,30 0,00

175
EA_cen 0,32 0,14 0,32 2,36 0,02 0,30 0,28 0,75 1,34
CulE_Cen 0,11 0,14 0,11 0,84 0,40 0,11 0,10 0,77 1,30
CE_EA_C 0,25 0,14 0,22 1,80 0,08 0,23 0,21 0,97 1,03
a. Dependent Variable: ROI
E.5.5: Moderated regression between Digital organisational structure, entrepreneurial
agility and the dependent variable ROI.
Table 94: Model summary for moderated regression for DOS-EA-ROI
Model Summaryb
Model R
R
Squar
e
Adjuste
d R
Square
Std.
Error of
the
Estimat
e
Change
Statistic
s
R
Square
Change
F
Chang
e
df
1
df
2
Sig. F
Chang
e
1 .463
a
0,214 0,172 0,751 0,214 5,080 3 56 0,004
a. Predictors: (Constant), DOS_EA_cen, DOS_cen, EA_cen
b. Dependent Variable: ROI
Table 95: Model co-efficients and significance for DOS-EA-ROI
Coefficientsa
Model Unstandardized
Coefficients
Standardized
Coefficients
t Sig. Collinearity
Statistics
B Std.
Error
Beta Partial Part Tolerance VIF
1 (Constant) 3,63 0,11 32,03 0,00
EA_cen 0,31 0,14 0,31 2,21 0,03 0,28 0,26 0,69 1,44
DOS_cen 0,16 0,15 0,15 1,06 0,29 0,14 0,13 0,70 1,43
DOS_EA_cen 0,25 0,17 0,17 1,45 0,15 0,19 0,17 0,99 1,01
a. Dependent Variable: ROI

176
E.5.6: Moderated regression between Digital insights, entrepreneurial agility and the
dependent variable ROI.
Table 96: Model summary for moderated regression for DI-EA-ROI
Model Summaryb
Model R
R
Squar
e
Adjuste
d R
Square
Std.
Error of
the
Estimat
e
Change
Statistic
s
R
Square
Change
F
Chang
e
df
1
df
2
Sig. F
Chang
e
1 .462
a
0,213 0,171 0,751 0,213 5,055 3 56 0,004
a. Predictors: (Constant), DI_EA_cen, DI_cen, EA_cen
b. Dependent Variable: ROI
Table 97: Model co-efficients and significance for DI-EA-ROI
Coefficientsa
Model Unstandardized
Coefficients
Standardized
Coefficients
t Sig. Collinearity
Statistics
B Std.
Error
Beta Partial Part Tolerance VIF
1 (Constant) 3,61 0,12 30,90 0,00
EA_cen 0,44 0,15 0,44 2,89 0,01 0,36 0,34 0,60 1,66
DI_cen -0,06 0,14 -0,06 -0,42 0,68 -0,06 -
0,05
0,61 1,65
DI_EA_cen 0,24 0,15 0,20 1,68 0,10 0,22 0,20 0,99 1,01
a. Dependent Variable: ROI

177
Appendix F: Ethical clearance
Figure 12: Ethical clearance

178
Appendix G: Consent form
Figure 13: Consent form