The effect of different log P algorithms on the modeling of the soil sorption coefficient of...
9
The effect of different log P algorithms on the modeling of the soil sorption coefficient of nonionic pesticides Ralpho Rinaldo dos Reis a,b , Silvio Ce ´sar Sampaio a , Eduardo Borges de Melo b, * a Graduate Program in Agricultural Engineering (PGEAGRI), Western Parana ´ State University (Universidade Estadual do Oeste do Parana ´, UNIOESTE), Cascavel, Parana ´, Brazil b Theoretical Medicinal and Environmental Chemistry Laboratory (LQMAT), UNIOESTE, Cascavel, Parana ´, Brazil article info Article history: Received 18 January 2013 Received in revised form 26 April 2013 Accepted 27 June 2013 Available online xxx Keywords: Environmental risks Models Hydrophobic parameter Soil contamination QSPR abstract Collecting data on the effects of pesticides on the environment is a slow and costly process. Therefore, significant efforts have been focused on the development of models that predict physical, chemical or biological properties of environmental interest. The soil sorption coefficient normalized to the organic carbon content (K oc ) is a key parameter that is used in environmental risk assessments. Thus, several log K oc prediction models that use the hy- drophobic parameter log P as a descriptor have been reported in the literature. Often, al- gorithms are used to calculate the value of log P due to the lack of experimental values for this property. Despite the availability of various algorithms, previous studies fail to describe the procedure used to select the appropriate algorithm. In this study, models that correlate log K oc with log P were developed for a heterogeneous group of nonionic pesticides using different freeware algorithms. The statistical qualities and predictive power of all of the models were evaluated. Thus, this study was conducted to assess the effect of the log P algorithm choice on log K oc modeling. The results clearly demonstrate that the lack of a selection criterion may result in inappropriate prediction models. Seven algorithms were tested, of which only two (ALOGPS and KOWWIN) produced good results. A sensible choice may result in simple models with statistical qualities and predictive power values that are comparable to those of more complex models. Therefore, the selection of the appropriate log P algorithm for modeling log K oc cannot be arbitrary but must be based on the chemical structure of compounds and the characteristics of the available algorithms. ª 2013 Elsevier Ltd. All rights reserved. 1. Introduction In modern society, chemicals make important contributions to the quality of life. Chemical compounds, including pesti- cides, drugs and solvents, are found in virtually all sectors of economic activity. Thus, the ideal of a world free of chemicals is incompatible with the current way of life. As a result of this widespread use, concern regarding the final destination of and the health and environmental risks associated with these substances is increasing in certain segments of society (Mackay and Webster, 2003). Therefore, studies that collect data on chemical properties are needed to plan the recovery of * Corresponding author. Dept of Pharmacy, 2069 Universita ´ ria St., 85819-110 Cascavel, PR, Brazil. Tel.: þ55 45 32203256. E-mail address: [email protected] (E.B. de Melo). Available online at www.sciencedirect.com journal homepage: www.elsevier.com/locate/watres water research xxx (2013) 1 e9 Please cite this article in press as: dos Reis, R.R., et al., The effect of different log P algorithms on the modeling of the soil sorption coefficient of nonionic pesticides, Water Research (2013), http://dx.doi.org/10.1016/j.watres.2013.06.053 0043-1354/$ e see front matter ª 2013 Elsevier Ltd. All rights reserved. http://dx.doi.org/10.1016/j.watres.2013.06.053
-
Upload
eduardo-borges -
Category
Documents
-
view
218 -
download
3
Transcript of The effect of different log P algorithms on the modeling of the soil sorption coefficient of...

ww.sciencedirect.com
wat e r r e s e a r c h x x x ( 2 0 1 3 ) 1e9
Available online at w
journal homepage: www.elsevier .com/locate/watres
The effect of different log P algorithms on themodeling of the soil sorption coefficient of nonionicpesticides
Ralpho Rinaldo dos Reis a,b, Silvio Cesar Sampaio a,Eduardo Borges de Melo b,*aGraduate Program in Agricultural Engineering (PGEAGRI), Western Parana State University (Universidade
Estadual do Oeste do Parana, UNIOESTE), Cascavel, Parana, BrazilbTheoretical Medicinal and Environmental Chemistry Laboratory (LQMAT), UNIOESTE, Cascavel, Parana, Brazil
a r t i c l e i n f o
Article history:
Received 18 January 2013
Received in revised form
26 April 2013
Accepted 27 June 2013
Available online xxx
Keywords:
Environmental risks
Models
Hydrophobic parameter
Soil contamination
QSPR
* Corresponding author. Dept of Pharmacy, 2E-mail address: eduardo.b.de.melo@gmai
Please cite this article in press as: dos Reiscoefficient of nonionic pesticides, Water
0043-1354/$ e see front matter ª 2013 Elsevhttp://dx.doi.org/10.1016/j.watres.2013.06.053
a b s t r a c t
Collecting data on the effects of pesticides on the environment is a slow and costly process.
Therefore, significant efforts have been focused on the development of models that predict
physical, chemical or biological properties of environmental interest. The soil sorption
coefficient normalized to the organic carbon content (Koc) is a key parameter that is used in
environmental risk assessments. Thus, several log Koc prediction models that use the hy-
drophobic parameter log P as a descriptor have been reported in the literature. Often, al-
gorithms are used to calculate the value of log P due to the lack of experimental values for
this property. Despite the availability of various algorithms, previous studies fail to
describe the procedure used to select the appropriate algorithm. In this study, models that
correlate log Koc with log Pwere developed for a heterogeneous group of nonionic pesticides
using different freeware algorithms. The statistical qualities and predictive power of all of
the models were evaluated. Thus, this study was conducted to assess the effect of the log P
algorithm choice on log Koc modeling. The results clearly demonstrate that the lack of a
selection criterion may result in inappropriate prediction models. Seven algorithms were
tested, of which only two (ALOGPS and KOWWIN) produced good results. A sensible choice
may result in simple models with statistical qualities and predictive power values that are
comparable to those of more complex models. Therefore, the selection of the appropriate
log P algorithm for modeling log Koc cannot be arbitrary but must be based on the chemical
structure of compounds and the characteristics of the available algorithms.
ª 2013 Elsevier Ltd. All rights reserved.
1. Introduction is incompatible with the current way of life. As a result of this
In modern society, chemicals make important contributions
to the quality of life. Chemical compounds, including pesti-
cides, drugs and solvents, are found in virtually all sectors of
economic activity. Thus, the ideal of a world free of chemicals
069 Universitaria St., 858l.com (E.B. de Melo).
, R.R., et al., The effect ofResearch (2013), http://d
ier Ltd. All rights reserved
widespread use, concern regarding the final destination of and
the health and environmental risks associated with these
substances is increasing in certain segments of society
(Mackay and Webster, 2003). Therefore, studies that collect
data on chemical properties are needed to plan the recovery of
19-110 Cascavel, PR, Brazil. Tel.: þ55 45 32203256.
different log P algorithms on themodeling of the soil sorptionx.doi.org/10.1016/j.watres.2013.06.053
.

Nomenclature
ARE Average relative error (%)
Co Concentration in the organic phase (mol L�1)
Cs Concentration in soil (mg kg-1)
Cw Concentration in the aqueous phase (mg L�1 and
mol L�1)
F F statistic
k Slope of the regression line without intercept
Kd Linear soil sorption coefficient (L kg�1)
Koc Soil sorption coefficient normalized to organic
carbon content (L kg�1)
LOO Leave-one-out validation
LNO Leave-N-out validation
P Octanol/water partitioning coefficient
PRESScal Residual sum of squares of the calibration
PRESSev Residual sum of squares of the external validation
PRESSval Residual sum of squares of the cross validation
Q2LNO Coefficient of determination for the leave-N-out
validation
Q2LOO Coefficient of determination for the leave-one-out
validation
QSPR Quantitative StructureeProperty Relationships
R2 Coefficient of determination
R20 Coefficient of determination of the regression line
without intercept
r2m Modified coefficient of determination
R2PRED Coefficient of determination of the external
validation
S Solubility in water (mol L�1)
SEC Standard error of calibration
SEV Standard error of the validation
SEP Standard error of the prediction
wa t e r r e s e a r c h x x x ( 2 0 1 3 ) 1e92
contaminated areas or the preservation of sites not yet
degraded.
Pesticides are widely used in agriculture to increase yields
and cropquality anddecrease labor and energy costs. However,
only a small fraction (approximately 0.1%) of the pesticides
applied in farming reach their targets. The remainder tends to
move through the environment and may thus contaminate
surface and groundwater (Arias-Estevez et al., 2008).
The soil sorption coefficient normalized to organic carbon
content (Koc) is a key physicochemical parameter that can be
used to determine the mobility and the final destination of
chemicals released into the environment. This coefficient is
expressed by the following equation:
Koc ¼ Kd=OC ¼ Cs=ðCw � OCÞCs and Cw are respectively the concentration of the chemical
component sorbed by the soil (mg kg-1) and the concentration
in the surrounding aqueous phase (mg L�1), OC is organic
carbon content in units of g OC/g dry soil, and Kd is the linear
sorption coefficient (Doucette, 2003). The smaller Koc value of a
given compound is, the higher its soil mobility and the higher
its potential to contaminate groundwater (Dearden, 2002;
Arias-Estevez et al., 2008).
The Koc coefficient value of a chemical can be experimen-
tally measured using the batch equilibrium (ASTM, 2001) or
the soil column (Lee et al., 1991) methods. The extent of the
sorption of a chemical is determined by the chemical’s mo-
lecular structure but also depends on factors related to soil
characteristics, including particle size, porosity, pH and
organic carbon content (Dearden, 2002). Organic carbon con-
tent is a determining factor in the sorption of nonionic com-
pounds. Thus, the hydrophobicity of these compounds is the
driving force of the soil sorption process (Wen et al., 2012).
Hydrophobic interaction is the main mechanism in the sorp-
tion of nonionic compounds, whereas for more polar com-
pounds, hydrophilic interactions are important. In these
circumstances, the interactions of clays and silica with the
polar functional groups of these substances become signifi-
cant. It is important to note that Kd varies from soil to soil and
Please cite this article in press as: dos Reis, R.R., et al., The effect ofcoefficient of nonionic pesticides, Water Research (2013), http://d
is usually normalized when determining Koc because, for
many compounds such as hydrophobic organics, sorption is
directly proportional to the organic carbon content. Thus,
when OC > 0.001 and the chemical is nonionic or neutral, Koc
can be considered a constant for a given chemical. Koc reflects
the fact that soil organic carbon is the major sorption domain
for hydrophobic compounds. However, the Koc approach may
not be suitable when soils have low organic carbon contents
or high clay contents and may not be applicable for chemicals
that have highly polar functional groups that significantly
interact with polar or charged sites on soil surfaces (Doucette,
2003; Wen et al., 2012). A further detailed description of
intermolecular interactions involved in the soil sorption pro-
cess of organic compounds can be found in the studies of von
Oepen et al. (1991) and Allen-King et al. (2002).
The need for a complete, reliable and updated database of
Koc values has led to the development of a large number of
models to predict this parameter (Gramatica et al., 2000).
Several quantitative structureeproperty relationship (QSPR)
studies, based on the molecular structure of chemical com-
pounds, have been published in the last decades. Thus,
various descriptors, including physicochemical properties,
chromatographic factors, steric factors, linear solvation en-
ergy relationships (LSER), topological indices and quantum
parameters have been used in Koc modeling (Gawlik et al.,
1997; Muller, 1997; Doucette, 2003; Huuskonen, 2003; Nguyen
et al., 2005; Gramatica et al., 2007; Razzaque and Grathwohl,
2008; Goudarzi et al., 2009; Wen et al., 2012). However, most
QSPR models were designed using small datasets and are
class-specific or have not been properly validated. The non-
validation of a prediction model precludes its application
given the lack of knowledge on its predictive power. There-
fore, to be considered reliable, a model must be properly
validated (Kiralj and Ferreira, 2009; Chirico and Gramatica,
2011; Roy et al., 2012).
Manymodels have been based on the relationship between
log Koc and the logarithmof water solubility (log S; S inmol L�1)
or the logarithm of octanol/water partition coefficient (log P)
(Gawlik et al., 1997; Doucette, 2003; Razzaque and Grathwohl,
different log P algorithms on themodeling of the soil sorptionx.doi.org/10.1016/j.watres.2013.06.053

Table 1 e Chemical classes of pesticides used in the
wat e r r e s e a r c h x x x ( 2 0 1 3 ) 1e9 3
2008). This important partition coefficient is given by the
equation:
P ¼ Co=Cw
Co and Cw are the concentrations of the compound in the
organic and aqueous phases of an octanol/water system at
equilibrium.
The strong correlation between these two descriptors (log P
and log S ) indicates that such models may be considered
identical or parallel. The log P parameter is a satisfactory
descriptor for modeling the soil sorption coefficient and has
been used in QSPR studies for various classes of organic
compounds, including pesticides (Lohninger, 1994; Sabljic
et al., 1995). The use of log P in soil sorption modeling is
common in uni- and multivariate models. Baker et al. (2000)
demonstrated that the relationship between log Koc and log P
deviates from linearity for compounds with log P > 5. Wen
et al. (2012) proposed a nonlinear model based on the rela-
tionship between log Koc and log P for a heterogeneous set of
594 organic compounds but also noted the existence of line-
arity in the log P range from 0.5 to 7.5.
The use of experimental log P values enables researchers to
obtain further realistic QSPRmodels. However, inmany cases,
the experimental data are not available, and the assessment
of these values can be extremely laborious and consume
substantial time and resources. These circumstances, com-
bined with the large number of new natural and synthesized
substances, complicate the creation of an updated database.
Thus, computational approaches to log P calculation are
valuable tools in QSPR studies (Melo and Ferreira, 2009).
Currently, there are several commercial and freeware algo-
rithms available for calculating log P. The two main methods
used for this calculation are (a) the fragment- or atom-type-
based substructure method and (b) the whole-molecule
method, which is based on molecular properties (Mannhold
and van de Waterbeemd, 2001).
QSPR studies on the soil sorption coefficient simply omit
how or why a given algorithmwas chosen for calculating log P
or whether any objective criterion with respect to the choice
ensures that the best regressionmodel is generated. Thus, the
aim of this study was to assess different freeware algorithms
for calculating log P in log Koc modeling to determine which
one or ones are best suited for use in these models. The use of
these freeware algorithms aimed to obtain log P values in a
quick and easy way in order to facilitate the reproduction of
results. The models obtained were tested and validated ac-
cording to guidelines from the literature (Kiralj and Ferreira,
2009; Chirico and Gramatica, 2011; Roy et al., 2012) to ensure
that the models are reliable and useful for prediction.
training set.Pesticide classes n Range of log Koc values
Acetonitriles 6 1.57e2.86
Carbamates 29 0.42e3.35
Dinitroanilines 8 2.92e4.01
Organochlorinates 8 3.00e5.31
Organophosphates 28 1.20e4.66
Phenylureas 44 1.29e3.55
Triazines 13 1.71e3.07
Di- and Triazoles 7 1.83e3.73
Total 143 0.42e5.31
2. Materials and methods
2.1. Experimental Koc data
The experimental values of the soil sorption coefficients
(log Koc) of 163 nonionic organic pesticides were obtained from
the literature (Sabljic et al., 1995; Gramatica et al., 2000). These
data were divided into a training set of 143 compounds and an
Please cite this article in press as: dos Reis, R.R., et al., The effect ofcoefficient of nonionic pesticides, Water Research (2013), http://d
external validation set of 20 compounds (test set A). These
same sets were used in the studies by Gramatica et al. (2000),
Huuskonen (2003) and Duchowicz et al. (2007). The com-
pounds that comprised the training set are heterogeneous and
belong to different classes (Table 1), and the log Koc values
range from 0.42 to 5.31, whereas the test set A values range
from 0.56 to 4.50. A second external validation set (test set B),
which comprised data from 38 pesticides, was extracted from
Huuskonen (2003). The test set B log Koc values range from 0.30
to 6.00. Therefore, a training set of 143 pesticides was used for
the model design, and two external validation sets (A and B)
were used to evaluate the predictive capabilities. The experi-
mental log Koc values of all compounds used in the present
work are shown in Table S1 (SupplementaryMaterial). The use
of these datasets from previous studies facilitated the com-
parison of our results with those from the literature
(Gramatica et al., 2000; Huuskonen, 2003; Duchowicz et al.,
2007).
2.2. Assessment of log P and QSPR models
The following freeware algorithms were used to assess the
log P values of each compound: ALOGP, ALOGPS, ACLOGP,
MLOGP, KOWWIN, XLOGP2 and XLOGP3. Details about all al-
gorithms are presented in Table 2 (Mannhold and van de
Waterbeemd, 2001; Tetko et al., 2001; Cheng et al., 2007;
Todeschini and Consonni, 2009).
The log P values of each algorithm and the experimental
values were obtained by entering the simplified molecular
input line entry specification (SMILES) of each compound in
ALOGPS 2.1 software (http://www.vcclab.org/lab/alogps). The
log P values of all of the compounds from the training set and
test sets A and B are shown in Table S1 (Supplementary
Material).
Themodels for estimating log Koc as a function of log Pwere
developed by simple linear regression using Minitab 15.0
(Minitab Inc., USA) and QSAR Modeling (freeware developed
and donated by the Laboratory for Theoretical and Applied
Chemometrics at State University of Campinas, Brazil) soft-
ware. Thus, seven models could be designed for predicting
log Koc because seven algorithms were used to calculate log P.
Next, the statistical qualities of themodelswere assessed, and
the models were compared with one another.
different log P algorithms on themodeling of the soil sorptionx.doi.org/10.1016/j.watres.2013.06.053
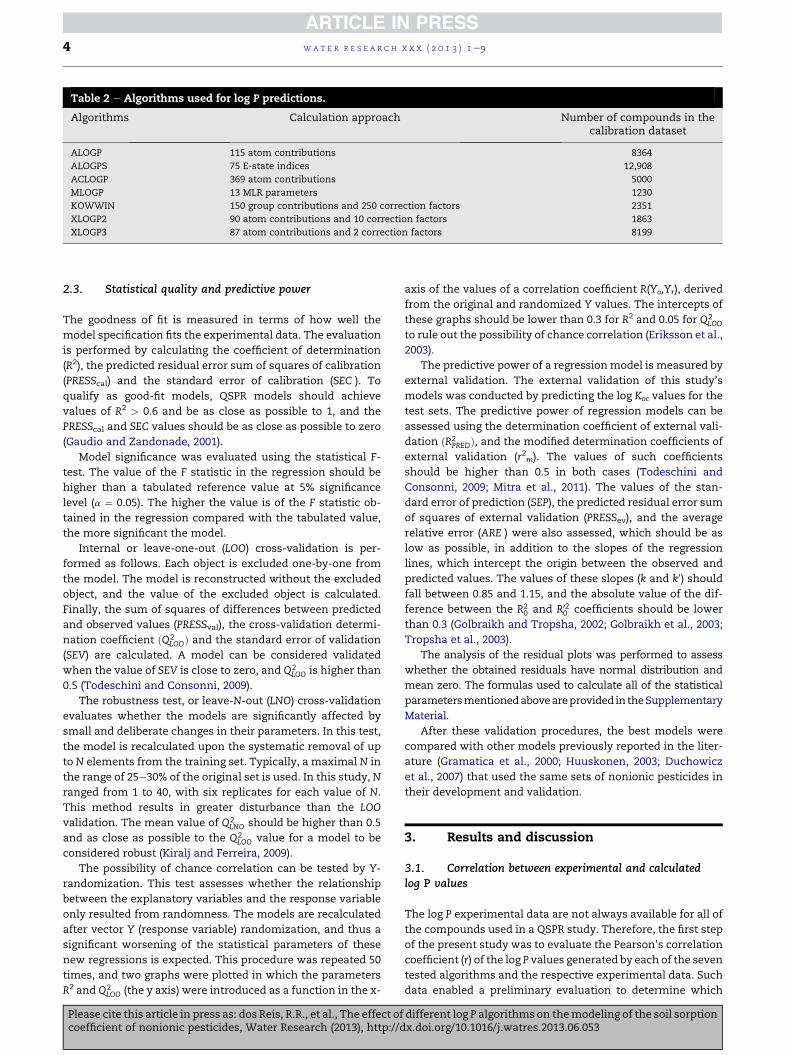
Table 2 e Algorithms used for log P predictions.
Algorithms Calculation approach Number of compounds in thecalibration dataset
ALOGP 115 atom contributions 8364
ALOGPS 75 E-state indices 12,908
ACLOGP 369 atom contributions 5000
MLOGP 13 MLR parameters 1230
KOWWIN 150 group contributions and 250 correction factors 2351
XLOGP2 90 atom contributions and 10 correction factors 1863
XLOGP3 87 atom contributions and 2 correction factors 8199
wa t e r r e s e a r c h x x x ( 2 0 1 3 ) 1e94
2.3. Statistical quality and predictive power
The goodness of fit is measured in terms of how well the
model specification fits the experimental data. The evaluation
is performed by calculating the coefficient of determination
(R2), the predicted residual error sum of squares of calibration
(PRESScal) and the standard error of calibration (SEC ). To
qualify as good-fit models, QSPR models should achieve
values of R2 > 0.6 and be as close as possible to 1, and the
PRESScal and SEC values should be as close as possible to zero
(Gaudio and Zandonade, 2001).
Model significance was evaluated using the statistical F-
test. The value of the F statistic in the regression should be
higher than a tabulated reference value at 5% significance
level (a ¼ 0.05). The higher the value is of the F statistic ob-
tained in the regression compared with the tabulated value,
the more significant the model.
Internal or leave-one-out (LOO) cross-validation is per-
formed as follows. Each object is excluded one-by-one from
the model. The model is reconstructed without the excluded
object, and the value of the excluded object is calculated.
Finally, the sum of squares of differences between predicted
and observed values (PRESSval), the cross-validation determi-
nation coefficient ðQ2LOOÞ and the standard error of validation
(SEV) are calculated. A model can be considered validated
when the value of SEV is close to zero, and Q2LOO is higher than
0.5 (Todeschini and Consonni, 2009).
The robustness test, or leave-N-out (LNO) cross-validation
evaluates whether the models are significantly affected by
small and deliberate changes in their parameters. In this test,
the model is recalculated upon the systematic removal of up
to N elements from the training set. Typically, a maximal N in
the range of 25e30% of the original set is used. In this study, N
ranged from 1 to 40, with six replicates for each value of N.
This method results in greater disturbance than the LOO
validation. The mean value of Q2LNO should be higher than 0.5
and as close as possible to the Q2LOO value for a model to be
considered robust (Kiralj and Ferreira, 2009).
The possibility of chance correlation can be tested by Y-
randomization. This test assesses whether the relationship
between the explanatory variables and the response variable
only resulted from randomness. The models are recalculated
after vector Y (response variable) randomization, and thus a
significant worsening of the statistical parameters of these
new regressions is expected. This procedure was repeated 50
times, and two graphs were plotted in which the parameters
R2 and Q2LOO (the y axis) were introduced as a function in the x-
Please cite this article in press as: dos Reis, R.R., et al., The effect ofcoefficient of nonionic pesticides, Water Research (2013), http://d
axis of the values of a correlation coefficient R(Yo,Yr), derived
from the original and randomized Y values. The intercepts of
these graphs should be lower than 0.3 for R2 and 0.05 for Q2LOO
to rule out the possibility of chance correlation (Eriksson et al.,
2003).
The predictive power of a regressionmodel is measured by
external validation. The external validation of this study’s
models was conducted by predicting the log Koc values for the
test sets. The predictive power of regression models can be
assessed using the determination coefficient of external vali-
dation ðR2PREDÞ, and the modified determination coefficients of
external validation (r2m). The values of such coefficients
should be higher than 0.5 in both cases (Todeschini and
Consonni, 2009; Mitra et al., 2011). The values of the stan-
dard error of prediction (SEP), the predicted residual error sum
of squares of external validation (PRESSev), and the average
relative error (ARE ) were also assessed, which should be as
low as possible, in addition to the slopes of the regression
lines, which intercept the origin between the observed and
predicted values. The values of these slopes (k and k0) shouldfall between 0.85 and 1.15, and the absolute value of the dif-
ference between the R20 and R02
0 coefficients should be lower
than 0.3 (Golbraikh and Tropsha, 2002; Golbraikh et al., 2003;
Tropsha et al., 2003).
The analysis of the residual plots was performed to assess
whether the obtained residuals have normal distribution and
mean zero. The formulas used to calculate all of the statistical
parametersmentionedaboveareprovided in theSupplementary
Material.
After these validation procedures, the best models were
compared with other models previously reported in the liter-
ature (Gramatica et al., 2000; Huuskonen, 2003; Duchowicz
et al., 2007) that used the same sets of nonionic pesticides in
their development and validation.
3. Results and discussion
3.1. Correlation between experimental and calculatedlog P values
The log P experimental data are not always available for all of
the compounds used in a QSPR study. Therefore, the first step
of the present study was to evaluate the Pearson’s correlation
coefficient (r) of the log P values generated by each of the seven
tested algorithms and the respective experimental data. Such
data enabled a preliminary evaluation to determine which
different log P algorithms on themodeling of the soil sorptionx.doi.org/10.1016/j.watres.2013.06.053
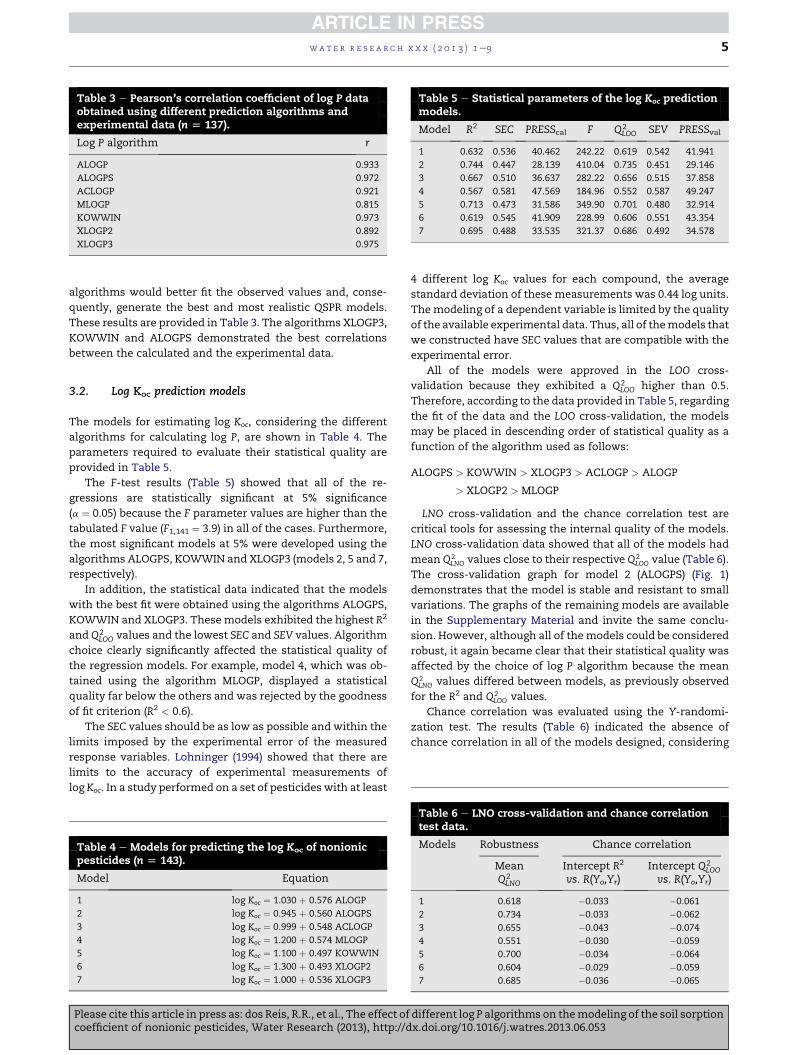
Table 3 e Pearson’s correlation coefficient of log P dataobtained using different prediction algorithms andexperimental data (n [ 137).
Log P algorithm r
ALOGP 0.933
ALOGPS 0.972
ACLOGP 0.921
MLOGP 0.815
KOWWIN 0.973
XLOGP2 0.892
XLOGP3 0.975
Table 5 e Statistical parameters of the log Koc predictionmodels.
Model R2 SEC PRESScal F Q2LOO SEV PRESSval
1 0.632 0.536 40.462 242.22 0.619 0.542 41.941
2 0.744 0.447 28.139 410.04 0.735 0.451 29.146
3 0.667 0.510 36.637 282.22 0.656 0.515 37.858
4 0.567 0.581 47.569 184.96 0.552 0.587 49.247
5 0.713 0.473 31.586 349.90 0.701 0.480 32.914
6 0.619 0.545 41.909 228.99 0.606 0.551 43.354
7 0.695 0.488 33.535 321.37 0.686 0.492 34.578
wat e r r e s e a r c h x x x ( 2 0 1 3 ) 1e9 5
algorithms would better fit the observed values and, conse-
quently, generate the best and most realistic QSPR models.
These results are provided in Table 3. The algorithms XLOGP3,
KOWWIN and ALOGPS demonstrated the best correlations
between the calculated and the experimental data.
3.2. Log Koc prediction models
The models for estimating log Koc, considering the different
algorithms for calculating log P, are shown in Table 4. The
parameters required to evaluate their statistical quality are
provided in Table 5.
The F-test results (Table 5) showed that all of the re-
gressions are statistically significant at 5% significance
(a ¼ 0.05) because the F parameter values are higher than the
tabulated F value (F1,141 ¼ 3.9) in all of the cases. Furthermore,
the most significant models at 5% were developed using the
algorithms ALOGPS, KOWWIN and XLOGP3 (models 2, 5 and 7,
respectively).
In addition, the statistical data indicated that the models
with the best fit were obtained using the algorithms ALOGPS,
KOWWIN and XLOGP3. These models exhibited the highest R2
and Q2LOO values and the lowest SEC and SEV values. Algorithm
choice clearly significantly affected the statistical quality of
the regression models. For example, model 4, which was ob-
tained using the algorithm MLOGP, displayed a statistical
quality far below the others and was rejected by the goodness
of fit criterion (R2 < 0.6).
The SEC values should be as low as possible and within the
limits imposed by the experimental error of the measured
response variables. Lohninger (1994) showed that there are
limits to the accuracy of experimental measurements of
log Koc. In a study performed on a set of pesticides with at least
Table 4 e Models for predicting the log Koc of nonionicpesticides (n [ 143).
Model Equation
1 log Koc ¼ 1.030 þ 0.576 ALOGP
2 log Koc ¼ 0.945 þ 0.560 ALOGPS
3 log Koc ¼ 0.999 þ 0.548 ACLOGP
4 log Koc ¼ 1.200 þ 0.574 MLOGP
5 log Koc ¼ 1.100 þ 0.497 KOWWIN
6 log Koc ¼ 1.300 þ 0.493 XLOGP2
7 log Koc ¼ 1.000 þ 0.536 XLOGP3
Please cite this article in press as: dos Reis, R.R., et al., The effect ofcoefficient of nonionic pesticides, Water Research (2013), http://d
4 different log Koc values for each compound, the average
standard deviation of these measurements was 0.44 log units.
Themodeling of a dependent variable is limited by the quality
of the available experimental data. Thus, all of themodels that
we constructed have SEC values that are compatible with the
experimental error.
All of the models were approved in the LOO cross-
validation because they exhibited a Q2LOO higher than 0.5.
Therefore, according to the data provided in Table 5, regarding
the fit of the data and the LOO cross-validation, the models
may be placed in descending order of statistical quality as a
function of the algorithm used as follows:
ALOGPS > KOWWIN > XLOGP3 > ACLOGP > ALOGP
> XLOGP2 > MLOGP
LNO cross-validation and the chance correlation test are
critical tools for assessing the internal quality of the models.
LNO cross-validation data showed that all of the models had
mean Q2LNO values close to their respective Q2
LOO value (Table 6).
The cross-validation graph for model 2 (ALOGPS) (Fig. 1)
demonstrates that the model is stable and resistant to small
variations. The graphs of the remaining models are available
in the Supplementary Material and invite the same conclu-
sion. However, although all of the models could be considered
robust, it again became clear that their statistical quality was
affected by the choice of log P algorithm because the mean
Q2LNO values differed between models, as previously observed
for the R2 and Q2LOO values.
Chance correlation was evaluated using the Y-randomi-
zation test. The results (Table 6) indicated the absence of
chance correlation in all of the models designed, considering
Table 6 e LNO cross-validation and chance correlationtest data.
Models Robustness Chance correlation
MeanQ2
LNO
Intercept R2
vs. R(Yo,Yr)Intercept Q2
LOO
vs. R(Yo,Yr)
1 0.618 �0.033 �0.061
2 0.734 �0.033 �0.062
3 0.655 �0.043 �0.074
4 0.551 �0.030 �0.059
5 0.700 �0.034 �0.064
6 0.604 �0.029 �0.059
7 0.685 �0.036 �0.065
different log P algorithms on themodeling of the soil sorptionx.doi.org/10.1016/j.watres.2013.06.053

Fig. 1 e Graph of the LNO cross-validation of model 2
(ALOGPS).
wa t e r r e s e a r c h x x x ( 2 0 1 3 ) 1e96
that the values of the intercepts of the R2 and Q2LOO graphs as a
function of R(Yo,Yr) are within the range (lower than 0.3 and
0.05, respectively) proposed by Eriksson et al. (2003).
The external validation results for test set A (Table 7)
clearly demonstrated that the predictive power of the models
was significantly affected by the choice of log P algorithm. The
best models were those designed using the KOWWIN and
ALOGPS algorithms. Such models showed the highest R2PRED
values and the lowest SEP, PRESSev and ARE values. ARE is a
statistical parameter that indicates the mean percentage of
variation between the predicted and observed values. That is,
ARE is a relative measure, whereas PRESSev is an absolute
measure of residuals (the difference between the predicted
and the observed values). Thus, the ARE values can be
considered critical to the choice of the best model for models
with similar PRESSev values.
The model constructed using the MLOGP algorithm was
rejected by external validation (R2PRED < 0.5). The predictive
power of the models in relation to the algorithm used can be
expressed in descending order:
KOWWIN > ALOGPS > ACLOGP > XLOGP3 > XLOGP2
> ALOGP > MLOGP
Regarding the k, k0 and��R2
0 � R020
�� parameters, all of the
models are within the range proposed by Tropsha et al. (2003).
However, upon analysis of themodified correlation coefficient
(r2m) values, the models generated using the ALOGP, MLOGP
and XLOGP3 algorithms were rejected because they exhibited
r2m values lower than 0.5 in both regression graphs (observed
versus predicted values and predicted versus observed
values).
Table 7 e Statistical data of the first external validation (test se
Model R2PRED SEP PRESSev ARE (%)
1 0.522 0.644 8.29 28.6 0
2 0.668 0.536 5.75 16.1 0
3 0.638 0.560 6.27 24.0 0
4 0.437 0.698 9.75 28.1 0
5 0.733 0.481 4.62 18.0 0
6 0.550 0.624 7.80 26.4 0
7 0.563 0.615 7.57 22.3 0
Please cite this article in press as: dos Reis, R.R., et al., The effect ofcoefficient of nonionic pesticides, Water Research (2013), http://d
To assist in the selection of the best models, the results
were also analyzed considering the stricter criteria proposed
by Chirico and Gramatica (2011): R2 higher than 0.7 and Q2LOO
and R2PRED higher than 0.6. Thus, only models obtained using
the ALOGPS and KOWWIN algorithms can be considered to
display a good fit and an effective predictive capability.
Therefore, out of the seven initial models, only two meet the
statistical criteria regarding the data fit, internal validation
and predictive power. Regarding the analysis of the residuals,
the graphs provided in the Supplementary Material demon-
strate that the residuals may be regarded as having normal
distribution and mean zero.
Tests were conductedwith a second external validation set
(test set B). The results are provided in Table 8 for the two best
models (2 and 5). Both models presented similar results.
However, model 2 (ALOGPS) was slightly superior to model 5
(KOWWIN) regarding ARE. The graphs of the observed values
as a function of the predicted values of log Koc for thesemodels
are shown in Figs. 2 and 3.
The concordance between the predicted values of each
model was reasonable. For 34 of the 38 compounds tested, the
differences between the predicted values in model 2 and the
predicted values in model 5 were less than 0.5. Oxydemeton-
methyl presented the greatest difference between the pre-
dicted values (0.81), but this difference was compatible with
the SEC values ofmodels 2 and 5 (0.447 and 0.473 respectively).
In other hands, amitrole and fluvalinate were outliers in
bothmodels (differences between predicted and experimental
values >2.5 � SEC ). The log Koc experimental values in the
training set were in the range 0.42e5.31 (Table 1). Fluvalinate
(experimental log Koc ¼ 6) is outside in this range. For amitrole,
Huuskonen (2003) reported there might be experimental error
in value used.
Considering the results obtained, it was evident that using
a particular algorithm to calculate log P without a prior se-
lection or comparison could lead to poor results in a QSPR
study. Therefore, it was observed that different algorithms
could contribute different types and quantities of log P-enco-
ded information, thus leading to models with significant dif-
ferences in their statistical qualities and predictive power
(Melo and Ferreira, 2009).
The soil sorption of nonionic compounds occurs through a
mechanism involving hydrophobic interactions because the
primary domain of this sorption is soil organic matter. Thus,
van der Waals forces are the main forces acting on the in-
teractions between sorbedmolecules and the sorbent surface.
Therefore, the hydrophobicity of amolecule is fundamental in
t A, n [ 20).
r2m r02m��Dr2m
�� k k0
��R2
0 � R020
��
.491 0.406 0.085 0.93 1.01 0.067
.558 0.685 0.127 0.97 0.99 0.050
.588 0.523 0.065 0.95 1.00 0.033
.390 0.279 0.111 1.04 0.90 0.139
.663 0.632 0.031 1.00 0.97 0.011
.527 0.495 0.032 0.92 1.03 0.020
.475 0.498 0.023 0.99 0.95 0.016
different log P algorithms on themodeling of the soil sorptionx.doi.org/10.1016/j.watres.2013.06.053

Table 8e Statistical data of the second external validation(test set B, n [ 38).
Model R2PRED SEP PRESSev ARE (%)
Model 2 e ALOGPS 0.768 0.621 14.66 20.5
Model 5 e KOWWIN 0.769 0.620 14.62 23.8
Fig. 3 e Graph of observed values as a function of predicted
values of log Koc for validation set B of model 5.
wat e r r e s e a r c h x x x ( 2 0 1 3 ) 1e9 7
this process and can be measured by log P. The correct mea-
surement of the value of log P is essential in the determination
of a soil sorption coefficient of a given chemical compound.
In QSPR studies in which the hydrophobic parameter
significantly affects the mechanism of the investigated phe-
nomenon, the experimental values of log P, when available,
should always be the first choice for the descriptor. Thus, a
prediction model should only be employed when the experi-
mental values are impossible to use because experimental
values are more accurate and reliable than predicted values.
In the present study, log Koc modeling was performed using
estimated log P data. Algorithms that are able to generate the
best estimates of log P with respect to its true value (experi-
mental value) are the most suitable. The predictive power of
algorithms is affected by the amount and structural diversity
of compounds used in their calibrations. In this way, the
chosen algorithmmust be calibrated in such away tomeet the
chemical space of relevant substances. An algorithm that has
been calibrated for a particular class of compounds will not be
suitable for the estimation of log P values for structurally
different compounds.
Thus, in the analysis of data related to the characteristics
of each algorithm (Table 2), ALOGPS was calibrated from a
dataset with 12,908 compounds (the largest calibration data-
set used). Therefore, due to the extent of its chemical space,
this algorithm has a good chance of producing acceptable
predictions of log P. Namely, as the calibration datasets im-
proves, the chemical spaces serviced by the algorithm
increase.
The log P calculation approach is also an important feature
for consideration. Many previous studies (Mannhold and van
de Waterbeemd, 2001) have demonstrated that algorithms
that sum group/fragment contributions produce better results
than those that add atom-type contributions. In addition,
additive methods that contain correction factors are more
accurate thanmethods that do not use these factors. Thus, the
Fig. 2 e Graph of observed values as a function of predicted
values of log Koc for validation set B of model 2.
Please cite this article in press as: dos Reis, R.R., et al., The effect ofcoefficient of nonionic pesticides, Water Research (2013), http://d
number of classified contributions of fragments or atoms-
types and the number of correction factors can affect the
predictions. Accordingly, among these algorithms (Table 2),
KOWWIN is more suitable than the other algorithms. There-
fore, the choice of algorithm for log P predictions cannot be
arbitrary but must be based on the chemical structure of the
compounds of interest and the characteristics of the available
algorithms.
The best Pearson’s correlation (Table 3) between experi-
mental and calculated log P was obtained using the XLOGP3
algorithm. However, this outcome did not ensure that this
algorithm was the most appropriate for modeling log Koc.
Therefore, all of the results should be considered when
choosing the best algorithm, and the most appropriate algo-
rithm should be selected using thoroughly tested and vali-
dated models. Furthermore, as observed in the present study,
more than one algorithm can be considered adequate to
developing statistically reasonable models.
3.3. Comparison with QSPR models from the literature
Models 2 and 5were comparedwith othermodels found in the
literature that were obtained using the same dataset. The
main statistical parameters of these models and their
respective external predictive power (sets A and B) are sum-
marized in Table 9. Although their R2 and Q2LOO were lower
than in the literature models, models 2 and 5 exhibit a pre-
dictive power similar to that of the remainder.
In addition, the SEC values of models 2 and 5 were higher
than those of the models from the literature. However, the
development of prediction models with errors that are much
lower than the experimental error is not appropriate. Thus,
models 2 and 5 may be considered reliable for estimating
log Koc because they present SEC values that are consistent
with the experimental error (0.44) (Lohninger, 1994).
The goodness of fit of a regression model can be improved
by increasing the number of explanatory variables. However,
the inclusion of an excessive number of these variables can
cause overfitting (an artificial increase in R2 values) of the
model. In QSPR studies, one explanatory variable is conven-
tionally included per each group of five compounds of the
dataset (Gaudio and Zandonade, 2001). The models from the
literature have 6 or 12 explanatory variables. That is, they are
different log P algorithms on themodeling of the soil sorptionx.doi.org/10.1016/j.watres.2013.06.053

Table 9 e Comparison of log Koc models.
Model No. of variables R2 SEC Q2LOO R2
PRED(A) ARE (%) R2PRED(B) ARE (%)
Model 2 e ALOGPS 1 0.744 0.447 0.735 0.668 16.1 0.768 20.5
Model 5 e KOWWIN 1 0.713 0.473 0.701 0.733 18.0 0.769 23.8
Gramatica et al. (2000) 6 0.843 0.35 0.824 0.67 27.4a NA NA
Huuskonen (2003) 12 0.82 0.37 0.79 0.79 20.0a 0.74 29.6a
Duchowicz et al. (2007) 6 0.90 0.29 0.89 0.71 21.7a NA NA
NA ¼ not available in the source article.a Calculated by the authors of the present study using experimental and predicted values available in the literature.
wa t e r r e s e a r c h x x x ( 2 0 1 3 ) 1e98
within the predefined range. The univariate models 2 and 5,
although with lower R2 and Q2LOO values, display better ARE
values. The use of a large number of descriptors can lead to a
false impression that the model is well fitted. Thus, the better
goodness of fit of the models from the literature can be simply
explained by the use of a larger number of explanatory vari-
ables. However, the higher goodness of fit did not translate
into the respective predictive powers of these models. The
models had values similar to those obtained by univariate
models 2 and 5.
Another positive aspect of models 2 and 5 compared with
the others is that the models from the literature were devel-
oped using molecular descriptors that required chemically
more complex mechanistic interpretation than the log P
parameter. Thus, the appropriate choice of log P algorithm
enabled the design of mathematically simpler models with
straightforward physicochemical interpretation and with
predictive powers similar to those ofmore complexmodels. In
such situations, the principle of Occam’s razor is applicable:
when there are several possible solutions for the same prob-
lem, the simplest explanation should be adopted (Gaudio and
Zandonade, 2001). Therefore, the models proposed in the
present study fulfill this simplicity requirement and are reli-
able in relation to their statistical quality and predictive
power.
4. Conclusions
The results of this study clearly demonstrated that when the
experimental log P values are unavailable, the choice of the
algorithm to calculate such values based on the molecular
structure could affect the final result of a QSPR study. There-
fore, this choice cannot be arbitrary because it could result in
the design of models that are inadequate to predict the
property under study. Thus, many of the models reported in
the literature that did not consider algorithm choice might be
improved if the best-suited log P algorithm is determined.
In this study, the best QSPR models for predicting the soil
sorption coefficient of nonionic pesticides were obtained
using the algorithms ALOGPS and KOWWIN. However, these
two methods should not be generalized to any QSPR study.
This study demonstrated that only the algorithms selected
herein were the best-suited algorithms for the log Koc
modeling of this dataset. Thus, the choice of the best log P
algorithm for a QSPRmodel should bemade on a case-by-case
basis, considering the propertymodeled, the training set used,
and the characteristics of available algorithms.
Please cite this article in press as: dos Reis, R.R., et al., The effect ofcoefficient of nonionic pesticides, Water Research (2013), http://d
Acknowledgments
The authors thank the MCT/CNPq/Fundacao Araucaria (www.
fundacaoaraucaria.org.br) and the National Counsel of Tech-
nological and Scientific Development (CNPq, www.cnpq.br)
for providing the financial support for this study.
In addition, the authors thank the Laboratory for Theo-
retical and Applied Chemometrics at State University of
Campinas (LQTA/UNICAMP) for providing the QSAR Modeling
software.
Appendix A. Supplementary material
Supplementary data related to this article can be found at
http://dx.doi.org/10.1016/j.watres.2013.06.053.
r e f e r e n c e s
Allen-King, R.M., Grathwohl, P., Ball, W.P., 2002. New modelingparadigms for the sorption of hydrophobic organic chemicalsto heterogeneous carbonaceous matter in soils, sediments,and rocks. Advances in Water Resources 25 (8e12), 985e1016.
Arias-Estevez, M., Lopez-Periago, E., Martinez-Carballo, E., Simal-Gandara, J., Mejuto, J.C., Garcia-Rio, L., 2008. The mobility anddegradation of pesticides in soils and the pollution ofgroundwater resources. Agriculture, Ecosystems &Environment 123 (4), 247e260.
ASTM, 2001. Standard Test Method 24-hour Batch-typeMeasurement Containment Sorption by Soils and Sediments.American Society for Testing and Materials, Philadelphia, PA.
Baker, J.R., Mihelcic, J.R., Shea, E., 2000. Estimating Koc forpersistent organic pollutants: limitations of correlations withKow. Chemosphere 41 (6), 813e817.
Cheng, T., Zhao, Y., Li, X., Lin, F., Xu, Y., Zhang, X., Li, Y., Wang, R.,Lai, L., 2007. Computation of octanol-water partitioncoefficients by guiding an additive model with knowledge.Journal of Chemical Information and Modeling 7 (6),2140e2148.
Chirico, N., Gramatica, P., 2011. Real external predictivity of QSARmodels: how to evaluate it? Comparison of different validationcriteria and proposal of using the concordance correlationcoefficient. Journal of Chemical Information and Modeling 51(9), 2320e2335.
Dearden, J.C., 2002. Prediction of environmental toxicity and fateusing quantitative structure-activity relationships (QSARs).Journal of the Brazilian Chemical Society 13 (6), 754e762.
Doucette, W.J., 2003. Quantitative structureeactivityrelationships for predicting soilesediment sorption
different log P algorithms on themodeling of the soil sorptionx.doi.org/10.1016/j.watres.2013.06.053

wat e r r e s e a r c h x x x ( 2 0 1 3 ) 1e9 9
coefficients for organic chemicals. Environmental Toxicologyand Chemistry 22 (8), 1771e1788.
Duchowicz, P.R., Gonzalezb, M.P., Helguerab, A.M.,Cordeirod, M.N.D.S., Castroa, E.A., 2007. Application of thereplacement method as novel variable selection in QSPR. 2.Soil sorption coefficients. Chemometrics and IntelligentLaboratory Systems 88 (2), 197e203.
Eriksson, L., Jaworska, J., Worth, A.P., Cronin, M.T.D.,McDowell, R.M., Gramatica, P., 2003. Methods for reliabilityand uncertainty assessment and for applicability evaluationsof classification and regression-based QSARs. EnvironmentalHealth Perspectives 111 (10), 1361e1375.
Gaudio, A.C., Zandonade, E., 2001. Proposition, validation andanalysis of QSAR models. Quımica Nova 24 (5), 658e671.
Gawlik, B.M., Sotiriou, N., Feicht, E.A., Schulte-Hostede, S.,Kettrup, A., 1997. Alternatives for the determination of the soiladsorption coefficient, Koc of non-ionicorganic compounds e areview. Chemosphere 34 (12), 2525e2551.
Golbraikh, A., Shen, M., Xiao, Z., Xiao, Y., Lee, K., Tropsha, A.,2003. Rational selection of training and test set for thedevelopment of validated QSAR models. Journal of Computer-aided Molecular Design 17 (2e4), 241e253.
Golbraikh, A., Tropsha, A., 2002. Beware of q2! Journal ofMolecular Graphics and Modelling 20 (4), 269e276.
Goudarzi, N., Goodarzi, M., Araujo, M.C., Galvao, R.K., 2009. QSPRmodeling of soil sorption coefficients (Koc) of pesticides usingSPA-ANN and SPA-MLR. Journal of Agricultural and FoodChemistry 57 (15), 7153e7158.
Gramatica, P., Corradi, M., Consonni, V., 2000. Modelling andprediction of soil sorption coefficients of non-ionic organicpesticides by molecular descriptors. Chemosphere 41 (5),763e777.
Gramatica, P., Giani, E., Papa, E., 2007. Statistical externalvalidation and consensus modeling: a QSPR case study for Koc
prediction. Journal of Molecular Graphics and Modelling 25 (6),755e766.
Huuskonen, J., 2003. Prediction of soil sorption coefficient oforganic pesticides from the atom-type electrotopological stateindices. Environmental Toxicology and Chemistry 22 (4),816e820.
Kiralj, R., Ferreira, M.M.C., 2009. Basic validation procedures forregression models in QSAR and QSPR studies: theory andapplication. Journal of the Brazilian Chemical Society 20 (4),770e787.
Lee, L.S., Rao, P.S.C., Brusseau, M.L., 1991. Nonequilibriumsorption and transport of neutral and ionized chlorophenols.Environmental Science & Technology 25 (4), 722e729.
Lohninger, H., 1994. Estimation of soil partition coefficients ofpesticides from their chemical structure. Chemosphere 29 (8),1611e1626.
Please cite this article in press as: dos Reis, R.R., et al., The effect ofcoefficient of nonionic pesticides, Water Research (2013), http://d
Mackay, D., Webster, E., 2003. A perspective on environmentalmodels and QSARs. SAR and QSAR in Environmental Research14 (1), 7e16.
Mannhold, R., van de Waterbeemd, H., 2001. Substructure andwhole molecule approaches for calculating log P. Journal ofComputer-aided Molecular Design 15 (4), 337e354.
Melo, E.B., Ferreira, M.M.C., 2009. Nonequivalent effects of diverselog P algorithms in three QSAR studies. QSAR & CombinatorialScience 28 (10), 1156e1165.
Mitra, I., Saha, A., Roy, K., 2011. Chemometric QSARmodeling andin silico design of antioxidant NO donor phenols. ScientiaPharmaceutica 79 (1), 31e57.
Muller, M., 1997. Quantum chemical modelling of soil sorptioncoefficients: multiple linear regression models. Chemosphere35 (1e2), 365e377.
Nguyen, T.H., Goss, K.U., Ball, P.W., 2005. Polyparameter linearfree energy relationships for estimating the equilibriumpartition of organic compounds between water and thenatural organic matter in soils and sediments. EnvironmentalScience & Technology 39 (4), 913e924.
Razzaque, M.M., Grathwohl, P., 2008. Predicting organic carbon-water partitioning of hydrophobic organic chemicals in soilsand sediments based on water solubility. Water Research 42(14), 3775e3780.
Roy, K., Mitra, I., Kar, S., Ojha, P.K., Das, R.N., Kabir, H., 2012.Comparative studies on some metrics for external validationof QSPR models. Journal of Chemical Information andModeling 52 (2), 396e408.
Sabljic, A., G}usten, H., Verhaar, H., Hermens, J., 1995. QSARmodeling of soil sorption. Improvements and systematics oflog Koc vs log Kow correlations. Chemosphere 31 (11e12),4489e4514.
Tetko, I.V., Tanchuk, V.Y., Villa, A.E., 2001. Prediction of n-octanol/water partition coefficients from PHYSPROP databaseusing artificial neural networks and E-state indices. Journal ofChemical Information Computer Science 41 (5), 1407e1421.
Todeschini, R., Consonni, V., 2009. Molecular Descriptors forChemoinformatics. Wiley-VCH, Weinheim.
Tropsha, A., Gramatica, P., Gombar, V.K., 2003. The importance ofbeing earnest: validation is the absolute essential forsuccessful application and interpretation of QSPR models.QSAR & Combinatorial Science 22 (1), 69e77.
von Oepen, B., Kordel, W., Klein, W., 1991. Sorption of nonpolarand polar compounds to soil processes measurements andexperience with the applicability of the modified OECD-guideline 106. Chemosphere 22 (3e4), 285e304.
Wen, Y., Su, L.M., Qin, W.C., Fu, L., He, J., Zhao, Y.H., 2012. Linearand non-linear relationships between soil sorption andhydrophobicity: model, validation and influencing factors.Chemosphere 86 (6), 634e640.
different log P algorithms on themodeling of the soil sorptionx.doi.org/10.1016/j.watres.2013.06.053