THE EFFECT OF CUSTOMER SATISFACTION ON ... - jurnal.ibmt.ac.id
23
Jurnal EKSEKUTIF Volume 10 No. 2 Desember 2013 365 THE EFFECT OF CUSTOMER SATISFACTION ON ATTITUDINAL LOYALTY IN SONY ERICSSON MOBILE PHONES Yudithia Dian Putra & Tommy Rahardjo STIE IBMT Surabaya Abstract : The number of mobile phone users in Indonesia was initially expected to reach 100 million by 2010. In 2008, the number is expected to top 120 million , signifying a huge potential market .Among the mobile phone companies, there is also the emergence of smaller companies, capable of overtaking “bigger “rivals .In order to stay companies to deliver customer satisfaction. This paper suggests that attitudinal loyalty is influenced by customer satisfaction, while the latter, in turn, is influenced by variables product quality and perceived value. The objective of the paper is to determine the strength of the satisfaction-loyalty link among Sony Ericsson mobile phone users, and the forms of loyalty expressed. The research method used is the causal research, using both primary and secondary data. To gather the data, 100 questionnaires are distributed, while complemented with face - to – face interviews. Convenience, judgment, and snowball sampling methods are employed .The processing of data is carried out using SPSS 13.0 and AMOS 5.0. from the study, it is observed that there is a positive correlation between customer satisfaction and attitudinal loyalty among Sony Ericsson mobile phone users. In addition, It is also observed that the internal reference of customer s is the most influential contributing to perceived value, while the product quality of Sony Ericsson mobile phone has contributed to the biggest consideration of product performance. Keyword : Product Performance, Perceived Value, Customer Satisfaction, Attitudinal Loyalty INTRODUCTION According to report by Gartner (see table 1), the worldwide sales of mobile phones surpassed 1.15 billion units in 2007, a 16 percent increase from 2006`s 990.9 million. Mobile phone sales at the year were consistent with the yearly trend, as fourth quarter sales reached 330 million units. Emerging markets provided much of the growth , while in mature markets ,consumers` appetite for feature –laden phones was met with new models packed with TV tuners, global positioning satellite (GPS)functions, touch screens and high –resolution cameras. In Asia/Pacific alone, 112 million mobile devices were sold in the fourth quarter, representing a 9.6 per cent growth over the previous quarter.
Transcript of THE EFFECT OF CUSTOMER SATISFACTION ON ... - jurnal.ibmt.ac.id

Jurnal EKSEKUTIF Volume 10 No. 2 Desember 2013
365
THE EFFECT OF CUSTOMER SATISFACTION ON ATTITUDINAL
LOYALTY IN SONY ERICSSON MOBILE PHONES
Yudithia Dian Putra & Tommy Rahardjo
STIE IBMT Surabaya
Abstract : The number of mobile phone users in Indonesia was initially expected to reach 100 million by
2010. In 2008, the number is expected to top 120 million , signifying a huge potential market .Among the
mobile phone companies, there is also the emergence of smaller companies, capable of overtaking “bigger
“rivals .In order to stay companies to deliver customer satisfaction. This paper suggests that attitudinal
loyalty is influenced by customer satisfaction, while the latter, in turn, is influenced by variables product
quality and perceived value. The objective of the paper is to determine the strength of the satisfaction-loyalty
link among Sony Ericsson mobile phone users, and the forms of loyalty expressed. The research method used
is the causal research, using both primary and secondary data. To gather the data, 100 questionnaires are
distributed, while complemented with face - to – face interviews. Convenience, judgment, and snowball
sampling methods are employed .The processing of data is carried out using SPSS 13.0 and AMOS 5.0. from
the study, it is observed that there is a positive correlation between customer satisfaction and attitudinal
loyalty among Sony Ericsson mobile phone users. In addition, It is also observed that the internal reference
of customer s is the most influential contributing to perceived value, while the product quality of Sony
Ericsson mobile phone has contributed to the biggest consideration of product performance.
Keyword : Product Performance, Perceived Value, Customer Satisfaction, Attitudinal Loyalty
INTRODUCTION
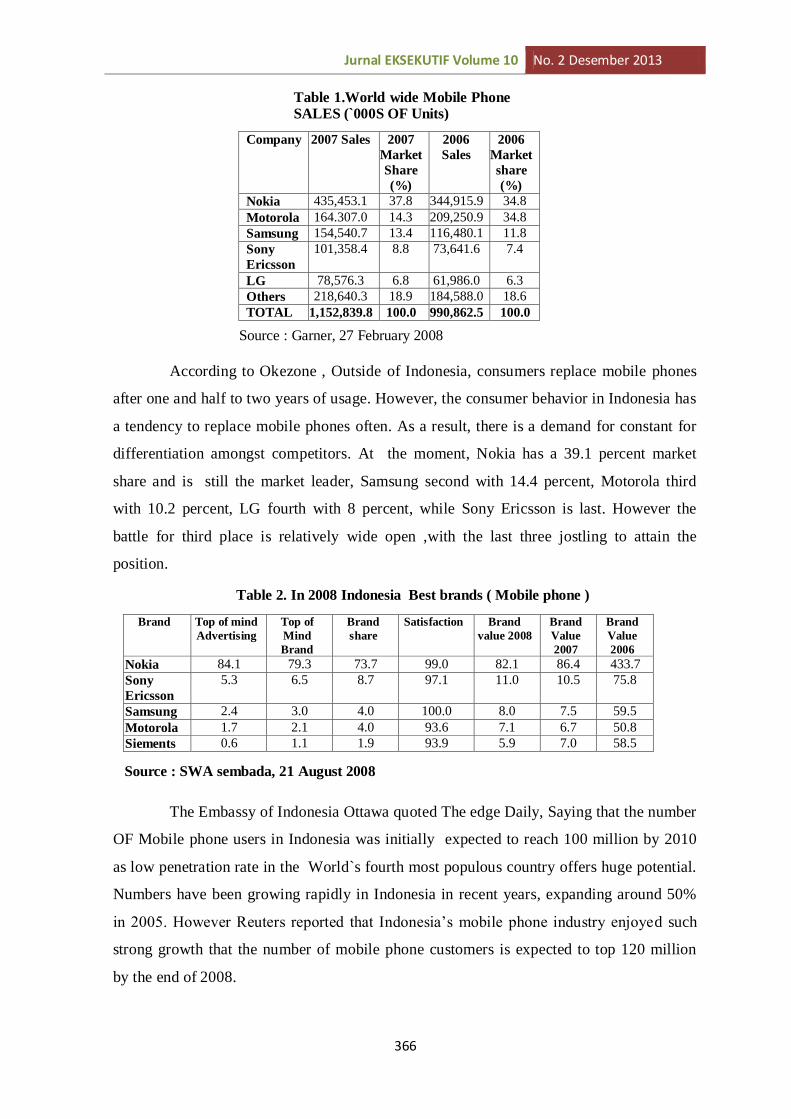
According to report by Gartner (see table 1), the worldwide sales of mobile
phones surpassed 1.15 billion units in 2007, a 16 percent increase from 2006`s 990.9
million. Mobile phone sales at the year were consistent with the yearly trend, as fourth
quarter sales reached 330 million units. Emerging markets provided much of the growth ,
while in mature markets ,consumers` appetite for feature –laden phones was met with new
models packed with TV tuners, global positioning satellite (GPS)functions, touch screens
and high –resolution cameras. In Asia/Pacific alone, 112 million mobile devices were sold
in the fourth quarter, representing a 9.6 per cent growth over the previous quarter.
Jurnal EKSEKUTIF Volume 10 No. 2 Desember 2013
366
Company 2007 Sales 2007
Market
Share
(%)
2006
Sales
2006
Market
share
(%)
Nokia 435,453.1 37.8 344,915.9 34.8
Motorola 164.307.0 14.3 209,250.9 34.8
Samsung 154,540.7 13.4 116,480.1 11.8
Sony
Ericsson
101,358.4 8.8 73,641.6 7.4
LG 78,576.3 6.8 61,986.0 6.3
Others 218,640.3 18.9 184,588.0 18.6
TOTAL 1,152,839.8 100.0 990,862.5 100.0
According to Okezone , Outside of Indonesia, consumers replace mobile phones
after one and half to two years of usage. However, the consumer behavior in Indonesia has
a tendency to replace mobile phones often. As a result, there is a demand for constant for
differentiation amongst competitors. At the moment, Nokia has a 39.1 percent market
share and is still the market leader, Samsung second with 14.4 percent, Motorola third
with 10.2 percent, LG fourth with 8 percent, while Sony Ericsson is last. However the
battle for third place is relatively wide open ,with the last three jostling to attain the
position.
The Embassy of Indonesia Ottawa quoted The edge Daily, Saying that the number
OF Mobile phone users in Indonesia was initially expected to reach 100 million by 2010
as low penetration rate in the World`s fourth most populous country offers huge potential.
Numbers have been growing rapidly in Indonesia in recent years, expanding around 50%
in 2005. However Reuters reported that Indonesia’s mobile phone industry enjoyed such
strong growth that the number of mobile phone customers is expected to top 120 million
by the end of 2008.
Table 1.World wide Mobile Phone SALES (`000S OF Units)
Source : Garner, 27 February 2008
Brand Top of mind
Advertising
Top of
Mind
Brand
Brand
share
Satisfaction Brand
value 2008
Brand
Value
2007
Brand
Value
2006
Nokia 84.1 79.3 73.7 99.0 82.1 86.4 433.7
Sony
Ericsson
5.3 6.5 8.7 97.1 11.0 10.5 75.8
Samsung 2.4 3.0 4.0 100.0 8.0 7.5 59.5
Motorola 1.7 2.1 4.0 93.6 7.1 6.7 50.8
Siements 0.6 1.1 1.9 93.9 5.9 7.0 58.5
Table 2. In 2008 Indonesia Best brands ( Mobile phone )
Source : SWA sembada, 21 August 2008

Jurnal EKSEKUTIF Volume 10 No. 2 Desember 2013
367
According to the central statistic Agency, the total value of cell phones imported
into Indonesia increased from $89 million in 2004 to 120 million active mobile phone units
in Indonesia. A recent survey conducted by the Indonesia Development Monitoring
Research, in fact, Indonesia presents such a massive market opportunity that three Cellular
Phone manufacturers have already started constructing plants in Indonesia. According to
the Jakarta Post, the manufacturers have started building plants on a combined 6.5- hectare
plot of land in an industrial zone in West Java, each having a total capacity of around two
million units per year.
Brand Quality
Satisf
action
Score
Value satisfac
tion
score
Perceived
best
score
Expectatio
n
score
Total safisf
actio
n
score
Nokia 4.703 4.493 4.637 4.344 4.543
Sony
Ericsson
3.948 3.383 3.880 3.601 3.381
3
Samsung 3.683 3.636 3.719 3.538 3.648
Motorola 3.563 3.707 3.613 3.398 3.564
Siements 3.667 3.596 3.637 3.273 3.538
BenQ
Siemens
3.648 3.530 3.570 3.124 3.461
As observed from the table, there is a significantly large gap between the fist-and
second –ranked mobile phone brands, Nokia and Sony Ericsson, respectively. In a
customer satisfactions report (Table 3) published, there is surprise inclusion of another
mobile phone company, Huawei, into the rankings. In the process, Huawei has overtaken
two of its ”bigger’’ rivals, in terms of total satisfaction score this signifies that even
“smaller” brands are capable of delivering satisfactions to.
Kotler( 2005) says, customer satisfaction is a key influence on the future purchasing
behavior of customers. Satisfied customers have a higher tendency to repurchase and tell
other about their good experiences. Meanwhile, dissatisfied customer often switch to
competitors and disparage the product to others. In addition, Mellens ( 1996) believes that
the attitudinal approach to customer behavior is rational being concerned with underlying
attitudinal process and evaluation criteria of a given purchase. This can means that even
Table 3 – In 2008 Indonesia Customer Satisfaction
Award (Mobile Phone)
Source : SWA sembada, 18 September 2008

Jurnal EKSEKUTIF Volume 10 No. 2 Desember 2013
368
established brands have reason to fear the loss of customer to competitors if satisfactions
cannot be delivered.
Much of the growth can be attributed to operations and distributions offering a
wide range of mobile phone options at reasonable prices, tempting new users to sign up to
service plans. Meanwhile, driving factors the growth in emerging markets in Asia/Pacific
included huge numbers of new subscribers, lower-priced phone based on wideband code
division multiple access(WCDMA)technology ,as well as ultra-low-cost CDMA phones
and low –cost global system for mobile (GSM) phones.
As a result of these phenomena, there exists the need to explore need to explore
the factors that may influence customer satisfactions in mobile phone company, Sony
Ericson in particular and analyses the strength and relations that may exist within the
customer satisfactions-attitudinal loyalty link.
Problem statement
To find out the effect of customer satisfaction on attitudinal loyalty of Sony
Ericsson mobile phone users
Research Objective
To develop a strategy to increase Sony Ericsson mobile phone users’ resistance to
switch in order to raise the likelihood of repeat purchases
Product Performance
Kotler (2006) describes a product as anything that can be offered or sold to a
market to satisfy a want or need existing within. A product is more that just a tangible
offering; a product can existing in the form of physical goods, services, experiences,
events, persons, places, properties, organizations, Information and ideas. In general, a
product may refer to a single item or unit, a group of equivalent products, or grouping of
goods or services.
Additionally, Bearden (2011) say customers purchase to products to satisfy needs
and wants another way to say this is that customer want a” bundle “of benefits from the
same type of product. As result, companies have to ensure that all the benefits that
customers may want can be derived from the components that are incorporated built intro
the products themselves.
Jurnal EKSEKUTIF Volume 10 No. 2 Desember 2013
369
Perceived performance is the customer’s evaluations of a product or service
performance after consumptions. As such, product performance is defined as the subjective
evaluations of the core attributes that make up a product, including both intrinsic and
extrinsic features. The attributes may consist of the product and customer service features.
Product components include quality, design, branding and packaging while customer
service encompasses various purchase and usage services.
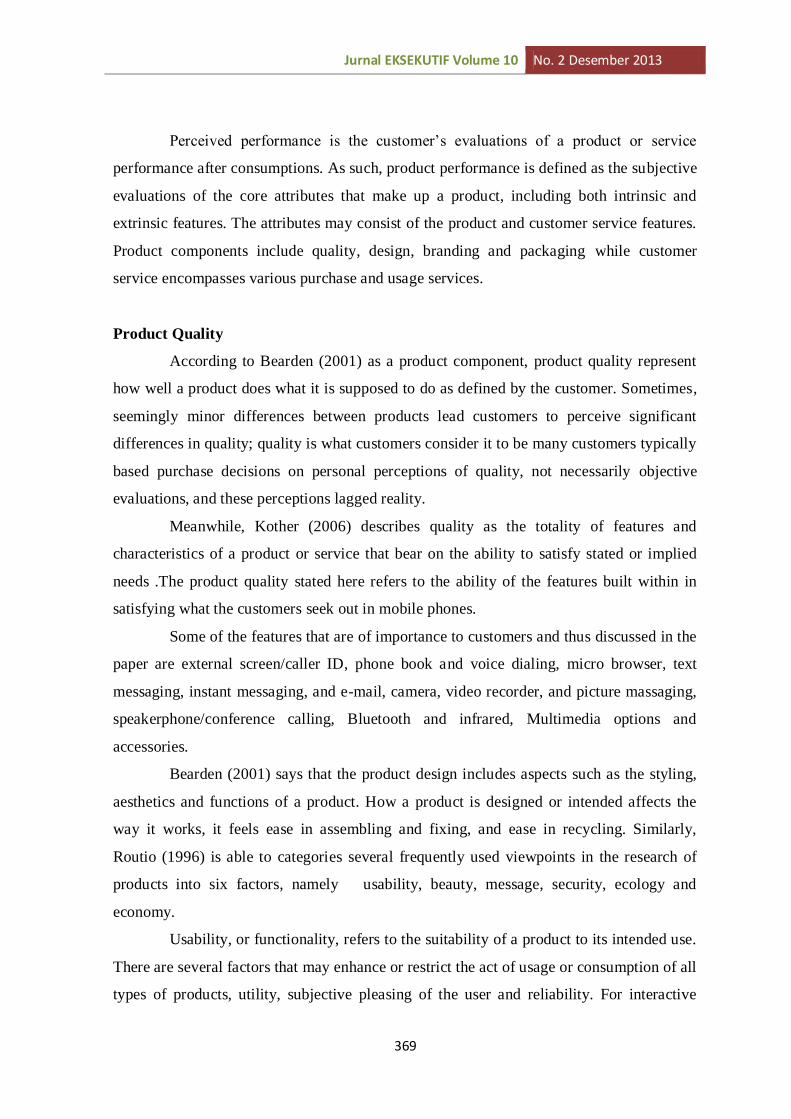
Product Quality
According to Bearden (2001) as a product component, product quality represent
how well a product does what it is supposed to do as defined by the customer. Sometimes,
seemingly minor differences between products lead customers to perceive significant
differences in quality; quality is what customers consider it to be many customers typically
based purchase decisions on personal perceptions of quality, not necessarily objective
evaluations, and these perceptions lagged reality.
Meanwhile, Kother (2006) describes quality as the totality of features and
characteristics of a product or service that bear on the ability to satisfy stated or implied
needs .The product quality stated here refers to the ability of the features built within in
satisfying what the customers seek out in mobile phones.
Some of the features that are of importance to customers and thus discussed in the
paper are external screen/caller ID, phone book and voice dialing, micro browser, text
messaging, instant messaging, and e-mail, camera, video recorder, and picture massaging,
speakerphone/conference calling, Bluetooth and infrared, Multimedia options and
accessories.
Bearden (2001) says that the product design includes aspects such as the styling,
aesthetics and functions of a product. How a product is designed or intended affects the
way it works, it feels ease in assembling and fixing, and ease in recycling. Similarly,
Routio (1996) is able to categories several frequently used viewpoints in the research of
products into six factors, namely usability, beauty, message, security, ecology and
economy.
Usability, or functionality, refers to the suitability of a product to its intended use.
There are several factors that may enhance or restrict the act of usage or consumption of all
types of products, utility, subjective pleasing of the user and reliability. For interactive

Jurnal EKSEKUTIF Volume 10 No. 2 Desember 2013
370
products that are useful only when users are in command, several additional usability
factors are included, ease of learning, ease of remembering, and low rate of errors.
Beauty is an important goal in the product and defining beauty is easier if there
is a universal method of designing and measuring. However,’’beauty” is not a permanent
property of an object. Instead, beauty is relative to perception and the goal is not to create
beautiful products, but to create a perception and its significance in the user’s social
context. The pleasant feeling is directly caused by the consciousness of a human being
working hard and attaining its goal perception.
Communication where message gets transferred from a person to another with
minimal changes is possible only when both parties of the communication agree on the
words used and their meaning. Similarly, people have also learned symbols and meanings
that relate to products. Such meaning of a product can be created in two ways: either there
is obvious physical reason for the relation between the physical property of the object and
is meaning of there is not such justification and the meaning is simply learned in the
community, concerning symbols.
In the product‘s design, the avoiding of danger or risk of injury to users is
something more compelling that other goals. The consequences of substandard safety are
often graver than other inferior standards of the product. From the safety viewpoint, it
desirable to consider other people who can possibly use the product.
After reviewing all the different viewpoints in Routio’s theory product design,
there is the decisions not to incorporate and include the theories of the ecology, economy
and safety aspects into the discussion. These viewpoints deal with the production side of
goods and often are in the considerations of the customers when choosing between mobile
phones.
Brand
Brand (2001) explains that the term “brand “ refers to a name, term, symbol, sign
or design to identify a product. A company may use any of these types of marking or
combine them as a form of product identification. A distinguished mark helps to
differentiate the product being offered by a company from those of its competitions.
From a customer’s viewpoint, brand facilitate in the purchasing process of goods.
If there are no brands, customers have to evaluate from all the available the non-branded

Jurnal EKSEKUTIF Volume 10 No. 2 Desember 2013
371
products every time they go shopping. Customers can never be sure of purchasing the
specific desired products and have difficulty evaluating the quality of some. When
selecting from among product s, customers can purchase specific ones of particular brands
and be reasonably certain of the quality. A brand can viewed as the promise of a company
to deliver qualities that the consumer looks for in a product every time a need arises.
Furthermore, established brand of certain goods can also provide psychological benefits to
customers and the psychological power that is offered by brands is often enormous. In
certain cases, brands names actually derive satisfactions from owning brands with images
of prestige .
Packaging
Packaging is an important component for many products. A package is the
container or wrapper for a product. It typically includes a label, a printed description of the
product in the package. Czinkota (2004) describes packaging is serving there major
functions: protection, promotions and user convenience. Bearden (2001) adds on that
packaging is important to customer of a product. A product’s package might perform
number of different functions, including protecting the product until consumed, facilitating
consumptions of the product and promoting the product .
A product’s package must also be able to communicate the brand‘s image and help to
sell the product. Distinctive packages can also help in capturing the attention of customers
when comparing between competitive products. Both packages and labels also provide
important information that customers can use in evaluating competing brands. Innovations
in packing also offer ways to differentiate that customers might otherwise perceive as very
similar.
Customer Service
According to Bearden (2001) customer service describes the assistance provided
to help a customer with the purchase or use of a product. Customer service applies to both

Jurnal EKSEKUTIF Volume 10 No. 2 Desember 2013
372
goods and services. Important elements of customer service during the purchasing process
include providing information about product alternative, training in product use, and
include providing information about product alternatives, training inn product use and
credit and financing services. Important elements of customers service after the purchase
include fast and reliable delivery, quick installations, accessible technical information and
advice, repair services and warranties .
Perceived Value
Kotler (2005) describes customer’s value as the difference between the values the
customer gains from owning and using product and the costs of obtaining the product.
Customers make choices based on the perceptions of the value and satisfactions that
various products and services deliver. Customers from expectations about the value of
based on past purchasing experiences, the opinions of my friends, and marketer and
competitor information and promise. However, customer often does not judge product
values and costs accurately and objectively, acting on perceived value instead.
According to Bearden (2001) perceived the buyer ‘overall assessment of a
product’s utility based on what is received and given. There is a trade-off between the
“give” and the get components of a purchase transactions. Customers base brand decisions
on the nations of a “reasonable price” and compare prices regularly. Perceived value
determines willingness to purchase and in turn is determined by a combinations of the
perceived benefits and the monetary sacrifices made; higher benefits enhance value; higher
monetary sacrifice detracts from it. Grewal ( 2008) likens perceived values to relationship
between a product or service ‘s benefit and its cost. Customers usually determine the
offering ‘s value in relationship to that of close competitor. If customers feel an
inexpensive brand is a about the same quality as a premium brand, the perceived value of
cheaper choice is high. Similarly Kotler (2005), explains that a customer usually purchases
from the company that offers the highest customers perceived value–the customer’s
evaluations of the difference between all the benefits and all the costs of a marking offer.

Jurnal EKSEKUTIF Volume 10 No. 2 Desember 2013
373
Customer Satisfactions
Kotler (2005) says that customer satisfactions is a key influence on future
purchasing behavior. Customer satisfactions with a purchase depends on how well the
product‘s performance liver up to the customer‘s expectations. Satisfied customers
purchase again and tell others about their good experiences. Dissatisfied customers often
switch to competition and disparage the product to others
Based on the Kano (1996) model of customer satisfactions, several factors are
identified as capable of affecting customer’s satisfactions. According to the model, three
features may fulfill customers satisfactions: basic and expected, performance and spoken
and surprise and delight. A competitive product is able to meet basic expectations,
maximizes spoken features and includes as many surprises as financially feasible
Attitudinal Loyalty
According to Keiningham (2005), loyalty is the reliance on a particular brand or
company even though numerous alternatives my exist. This may mean foregoing the
pleasure, or agony of experimenting with other brands. Grewal (2008) explains that
customer loyalty means that customers are committed to purchasing from a particular
company; loyalty means that customers are reluctant to patronize competitive firms.
Researchers often liken customer’s loyalty to repeat purchases, but customer
loyalty also reflects the customers intentions repurchase. This loyalty has is explained by
Gramer (1998) to capture the affective and cognitive and aspects of brands loyalty, such as
brand preference and commitment. In additions, Fournier (1998) describes attitudinal
loyalty as the customers psychological dispositions toward the same brand or brand-set and
involves the measurement of customer attitudes. On the other hand, East (1997) explains
that behavioral brand loyalty is reflected in the observed repurchase of a brand from a
number of available brands
Dick (1994) describes both behavioral loyalty and attitudinal loyalty as important
concepts for understanding long term customer relationship, on understanding past
Jurnal EKSEKUTIF Volume 10 No. 2 Desember 2013
374
behaviors and on predicting future patronage. Behavior loyalty may reflect the customers,
actions and involves the measurement of past purchases of the same brand to predict future
patronage .However ,Dick argues that the behavioral definition is “insufficient to explain
how and why loyalty is developed and /or modified”.
Foxall (1987) determines that attitude precedes behavior in the context of
repurchasing and is important because attitudes towards on object determine choice. This
belief is acknowledged by Oliver( 1999) in the definition of loyalty as “a deeply held
commitment to repurchase a preferred product/service consistently in the future, thereby
causing repetitive same –brand or same brand –set purchases, despite situational influences
and marketing efforts having the potential to cause switching behavior. Similarly, Day
(1969) says that attitudinal loyalty focuses on the cognitive basis of loyalty and isolates
purchases driven by strong attitude from purchases due to situational constrains.
Attitudinally loyal customers are committed to a brand or company and they make repeat
purchases based on a strong internal disposition.
Mellens (1996) believes that attitudinal approach customer behavior is rational,
being concerned with the underlying attitudinal process and evaluations criteria of a given
purchase. According to Zeithaml (1996), attitudinal loyalty is operated in terms of
repurchase intentions and advocacy to others. Other indicators include the tendency to
resist to an alternate company and the willingness to pay a premium price
Repurchase intention
Customers attitudinal loyalty comes into play when these customers continue their
relationship with a company through their plans to increase purchases or repurchase a
product. Similarly, this statement is also applicable to company‘s other products,
contributing to the possibility of additional or cross sales. Cronin (1992) states that
increased satisfaction help to enhance the customers’ intent for repeat purchases towards a
product or service. Furthermore, Anderson (1993) also agrees that customer’s repurchase
intentions tend to increase more when they are more satisfied with products. Based on
these statements, satisfaction is a strong predictor of the customer’s repurchase intentions

Jurnal EKSEKUTIF Volume 10 No. 2 Desember 2013
375
and satisfied customers have more of inclination to purchase a product of a particular brand
or other products under the same brand repeatedly in the future.
Research Methodology
In causal research, the objective is to determine if the manipulation of the one
variable, called the independent variable, affects another variable, called the dependent
variable. In essence, an experiment is conducted. This approach is primarily used for
purposes of prediction and to test hypotheses, though it can also be used to a lesser extent
for, discovery and explanatory purposes .In marketing, causal research is used for many
types of research, such as testing marketing scenarios.
Hair (2006) says that causal research is designed to collect raw and create data
structures, enabling the decision maker to determine cause –and effect relationship
between two or more decision variables. Causal research can be used to understand the
relationship between the causal factors and the outcome predicted. In summary, the causal
research is used in the paper to measure the effects and relations the dependent variables
on one another
According to Cooper (2006) in planning, the research project is to identify the
target population, the people, events, or records that have the desired information and can
answer the measurement question and determine the sample. The target population that
studied the current and previous users of Sony Ericsson mobile phones
A sample is a part of the target populations, carefully selected so as to represent the
populations. Questionnaires are distributed to 100 people and respondents interviewed.
Samples are taken from the customers who have enough product knowledge to answer the
questionnaires .The sample taken consists of people who have been in possession of Sony
Ericsson mobile phone.
Aaker (2007) explains that, to obtain information quickly and inexpensively, a
convenience sampling may be employed. The procedure is simply to contact sampling

Jurnal EKSEKUTIF Volume 10 No. 2 Desember 2013
376
units that are convenience sampling is used on acquaintances using Sony Ericsson mobile
phone to pre –questionnaires before the actual distribution
In judgmental sampling, judgment is used t o identify representative samples if a
product is to evaluated, it might be possible to identify a group that, by its very nature,
should be disposed toward it, if found that the group does not like it. Then it can be
assumed that the rest of the population is at least negative. Snowball sampling is a form of
judgment sampling that is suitable to reach small, specialized population. Under a snowball
design, each respondent after being interviewed is asked to identify one or more others in
the field and the result can be a very useful sample.
In addition to the previously mentioned methods, public places are also frequented
and preliminary questions asked to passers–by. This is to filter through the crowd and
determine if any of these people have the characteristics that qualify as respondents for the
study.
There are is a wide variety of methods to consider, either singly or combination
the data can be collected through interviews, face to face interviews, telephone interviews,
computer assisted interviews, questionnaires, Videotaping or audio recording. In this
paper, the use of both questionnaires and face to face interviews is employed. This is to
explain to the respondents and clarify and existing doubts in other to minimize error of
respondents.
According to Aaker (2007) attitude towards complex objects has many facets,
making it unrealistic to attempt to capture the full picture with one overall attitude–scale
question. As result, there is a need for a method to measure a sample of beliefs towards the
attitude objects and combine the set of answers into an average score on the individual
items are summed to produce a total score for this is the Likert scale. A Likert scale
requires respondent to indicate a degree of agreement or disagreement with a variety of
statement related to the attitude or object .The Likert scales are also called summated
scales ,Because the scores on the individual items are summed to produce a total score for
respondent ‘

Jurnal EKSEKUTIF Volume 10 No. 2 Desember 2013
377
A Likert scale consists of two parts, the items part and evaluative part. The item
part is essentially a statement about a certain product, event or attitude. The evaluative part
is a list of response categories ranging from “strongly agree” to “strong if disagree” Each
response is given a numerical score to reflect the degree of favorableness, and the score are
totaled to measure the respondents ‘attitude towards a particular object.The formal and
respective value of a four-level Likert scale that is used.
In this paper, the standard structural equation diagram convention is followed. A
circle is used to represent a later variable, while a rectangle the associated manifest or
indicator or indicator variable. The relationship between latent variables and the indicators
is referred to as “measurement” model. Within this context, the arrow point from circles to
rectangles, or rectangles ,or in the case of structural relationships, circles to circles.
Structural equation models with latent variables (SEM) are more and often used to
analyze. Relationship among variables in marketing and customer research (Abaollen,1989
). Some reasons for the widespread use of these models are their parsimony, the ability to
model complex systems, wherein simultaneous and reciprocal relationship may be present
and the ability to model relationship among non –observable variables while taking
measurement errors into account.
The application of SEM theory, with the help of AMOS program, is useful in the
research to analyze the interdependent variable and to deliver authentication of hypothesis.
AMOS is an acronym of “Analysis of Moment Structure “or in other words, the analysis of
mean and covariance structure. This research uses AMOS 5.0 AS it is allows for the work
directly from path diagram and for estimates to be displayed graphically in the path
diagram .The result is gathered and ranked in with the highest outcome is considered as the
solution to the problem statement.
The data collected from 100 questionnaires is processed through several steps, while
utilizing two program , SPSS 13.0 program can test the data for validity. If the corrected
item –Total Corrected item-Total Correlation is greater than 1.195 then the variable is
deemed as valid. Secondly the data is further processed using the AMOS 5.0 PROGRAM
.the AMOS 5.0 program is then synchronized with the SPSS 13.0 TO REVEAL THE
RANGKING OF THE INDICATORS. For example, there is a need to find the strongest
Jurnal EKSEKUTIF Volume 10 No. 2 Desember 2013
378
indicators amongst product performance, perceived value, customers satisfaction and
attitudinal loyalty capable of influencing these latent variables significantly and the
strength of the relationship between latent variables.
Finding and Discussion
From the 100 questionnaires distributed, the compilation of data shows that 54% of
the responds are female and 46%are male. The compilation of data shows that 5% of the
respondents are below the age of seventeen 49% are between seventeen and twenty-one
25% are between twenty-two and twenty-six 12% are between twenty-seven and thirty-one
and 9% are aged thirty –two or older. Data shows that 57% of the respondents are students
20% are self –employed ,15% company employees and 8% are professional
From the 100 questionnaires distributed the compilation of data shows that 45% of
the respondents spend less that Rp 1.500.000 per moth, 19% spend between Rp 1.500.000
and Rp 2.500.000 per month, 9% Spend between Rp 3.500.001 and Rp 4.500.000 per
month and 14% spend more that R p. 4.500.000 per mount .
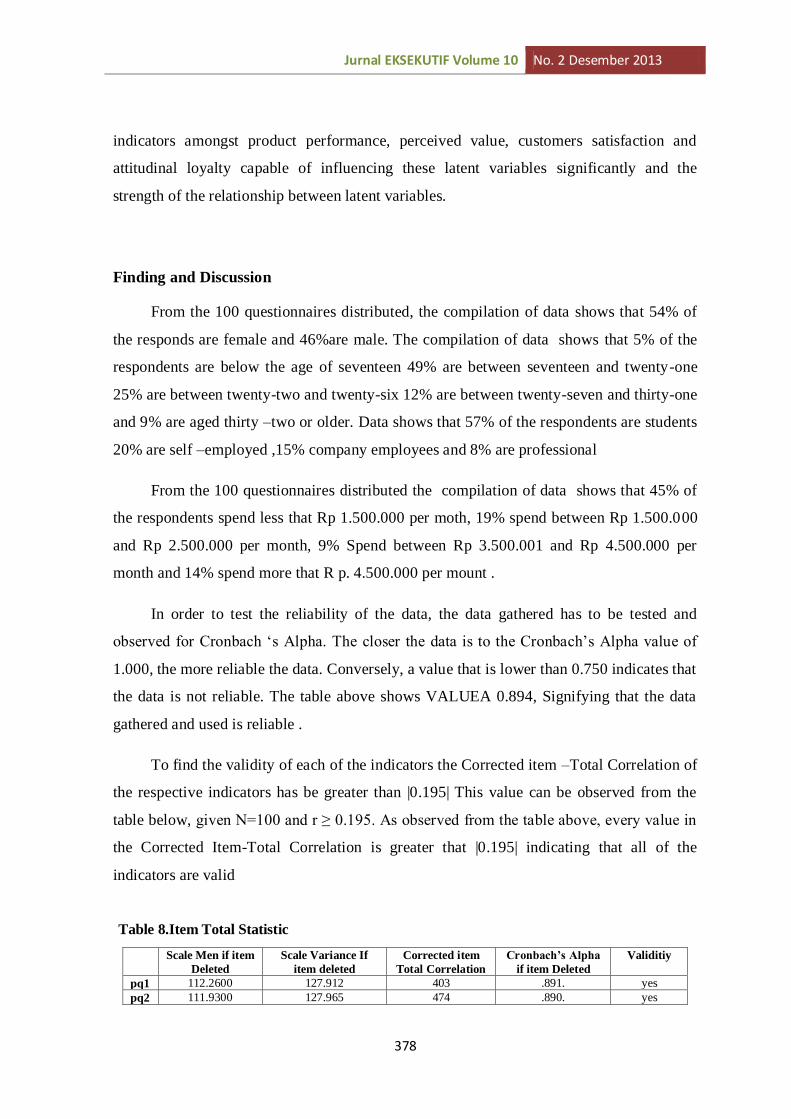
In order to test the reliability of the data, the data gathered has to be tested and
observed for Cronbach ‘s Alpha. The closer the data is to the Cronbach’s Alpha value of
1.000, the more reliable the data. Conversely, a value that is lower than 0.750 indicates that
the data is not reliable. The table above shows VALUEA 0.894, Signifying that the data
gathered and used is reliable .
To find the validity of each of the indicators the Corrected item –Total Correlation of
the respective indicators has be greater than |0.195| This value can be observed from the
table below, given N=100 and r ≥ 0.195. As observed from the table above, every value in
the Corrected Item-Total Correlation is greater that |0.195| indicating that all of the
indicators are valid
Scale Men if item
Deleted
Scale Variance If
item deleted
Corrected item
Total Correlation
Cronbach’s Alpha
if item Deleted
Validitiy
pq1 112.2600 127.912 403 .891. yes
pq2 111.9300 127.965 474 .890. yes
Table 8.Item Total Statistic

Jurnal EKSEKUTIF Volume 10 No. 2 Desember 2013
379
pq3 112.2800 130.211 75 893 yes
pq4 112.1500 127.532 482 890. yes
pq5 112.5000 124.644 522 889 yes
pd1 112.0700 1263688 487 890 yes
pd2 112.1800 123.260 646 887 yes
pd3 112.2100 129.040 292 893 yes
pd4 112.2500 127.177 483 890 yes
pd5 112.0800 126.957 478 890 yes
pd6 112.1600 130.471 210 894 yes
pd7 112.1500 127.119 465 890 yes
pd8 112.1500 126.983 450 891 yes
pd9 112.4000 130.196 255 894 yes
b1 112.3400 125.745 523 889 yes
b2 112.2600 125.030 519 889 yes
p1 113.2300 126.105 502 890 yes
p2 112.4600 129.588 281 893 yes
p3 112.390 128.069 -219 902 yes
cs1 112.3900 128.200 .364 892 yes
cs2 112.6100 129.351 .371 892 yes
cs3 112.3100 131.711 261 894 yes
cs4 112.2900 128.046 201 894 yes
cs5 111.8900 127.493 388 892 yes
cs6 112.4600 126.453 523 890 yes
Er 112.3600 127.526 448 890 yes
ir1 112.3600 127.526 483 890 yes
Er2 112.4500 127.526 483 890 yes
ef1 112.2100 126.694 468 890 yes
ef2 112.2900 127.622 506 891 yes
ef3 1123.0800 128.996 437 903 yes
ef4 112.6700 138.398 -252 892 yes
Bas 112.1100 127.989 377 891 yes
Spo 112.2800 129.250 454 889 yes
Sur 112.4800 125.921 605 889 yes
Rep 112.3100 125.383 555 888 yes
Ad
v
112.3800 125.004 596 889 yes
Pre 112.6700 126.486 509 890 yes
Res 112.6500 124.169 582 888 yes
Structural Equation Modeling Result
Product performance
Estimate S.E C.R P
Per
Pq E1
Pq
Pq
Pq
Pq
E2
E3
E5
E4
0.11
1
1.00
.79
1.35
.51
.68
0.8
0.17
0.11
0.10
1
1
1
1
Figure 2. Unstandardised Estimate Model Of Product Performance

Jurnal EKSEKUTIF Volume 10 No. 2 Desember 2013
380
Using AMOS 5.0 at the 5% significance level, the table shows that all indicators
have significant effect to product performance to product performance as the indicators
have a P value of less than .05. The hypotheses of product quality, Product design, Brand,
packaging, and customer service being service being correlated to product performance
are therefore accepted.
Perceived Value
Using AMOS 5.0 at the 5% significance level, the table shows that all indicators
have significant effect to product performance to customer satisfaction as the indicators
have a P value of less than.05 .The hypotheses of basic and expected attribute being
positively correlated to customer satisfaction are therefore accepted.
Attitudinal Loyalty
Estimate S.E C.R P
rer<---loy 1.000
adv<--- loy .1.101 ..177 6.235 ***
pre<--- loy .1.087 .162 6.705 ***
res<---loy 1.371 186 7.357 ***
Figure 4 - Unstandardised Estimate Model of Attitudinal Loyalty
Val
er
ir
ef
E1
E2
E3
.36 .17
1.20
1.00
.40
1
1
1
.14
.09
Figure 3- Unstandardised Estimate Model of Perceived Value
Loy
rep
adv
Pre
Res
E1
E2
E3
E4
.22
.22 1.00
1.10
1.09
1.37
1
1
1
1
.30
.21
.13
Table 11 -– Regression Weights of
Attitudinal Loyalty

Jurnal EKSEKUTIF Volume 10 No. 2 Desember 2013
381
Using AMOS 5.0 at the 5% significance level, the table shows that all indicators
have significant effect to attitudinal loyalty as the indicators have a P value of less than .05.
The hypotheses of repurchase intention, advocacy to others, willingness to pay premium
and resistance to switch being positively correlated to attitudinal loyal are therefore
accepted.
All Variables
The nature of the framework and influence by other variables present requires that
all the variables be compiled together And computed one more time using AMOS 5.0 at
the 5% significance level to determine if the variable are valid .From the result obtained it
is observed that all variables and indicators haves a P value below .0.5 Therefore ,all of
the variables and indicators are valid even when compiled together.
Estimate S.E C.R P
var <---per .908 .233 3.905 ***
sat<--- per .341 ..140 2.431 .015
sat<--- per .271 .116 2.340 .019
loy<---per 1.804 .405 4.456 ***
pq <---per 1.000 ***
pd<--- per .899 .138 6511 ***
b<--- per 1.398 .217 6.445 ***
p <---per .496 .132 3.760 ***
cs<--- per .731 .136 5.390 ***
bas<--- per 1.000 ***
spo<---per 1.771 .384 4.611 ***
sur <---per 1.905 .427 4.464 ***
rep <--- loy 1.000 ***
adv<--- loy 1.086 .148 7.328 ***
pre <---loy .929 .146 6.830 ***
res<--- loy 1.177 .145 8.120 ***
er <--- loy 1.000 ***
ir <---val .903 .210 4500 ***
ef <---val .423 .190 3.894 ***
Table 12 -– -Regression Weights of all Variables
Jurnal EKSEKUTIF Volume 10 No. 2 Desember 2013
382
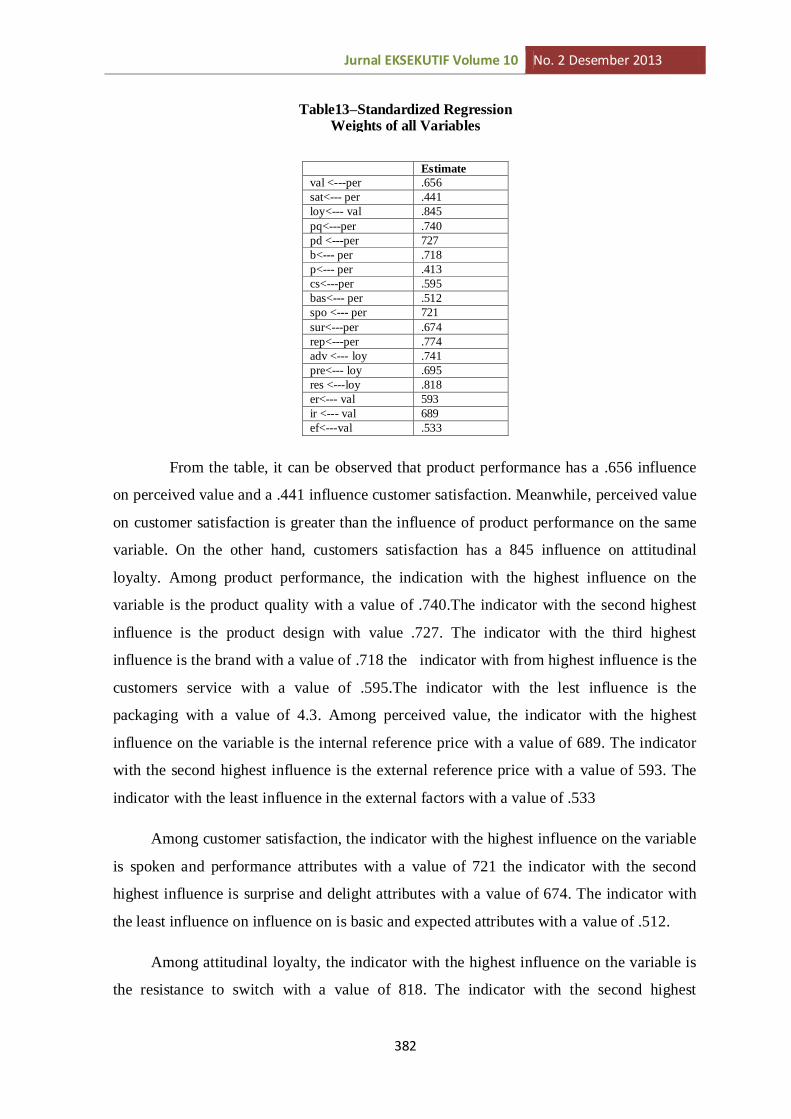
From the table, it can be observed that product performance has a .656 influence
on perceived value and a .441 influence customer satisfaction. Meanwhile, perceived value
on customer satisfaction is greater than the influence of product performance on the same
variable. On the other hand, customers satisfaction has a 845 influence on attitudinal
loyalty. Among product performance, the indication with the highest influence on the
variable is the product quality with a value of .740.The indicator with the second highest
influence is the product design with value .727. The indicator with the third highest
influence is the brand with a value of .718 the indicator with from highest influence is the
customers service with a value of .595.The indicator with the lest influence is the
packaging with a value of 4.3. Among perceived value, the indicator with the highest
influence on the variable is the internal reference price with a value of 689. The indicator
with the second highest influence is the external reference price with a value of 593. The
indicator with the least influence in the external factors with a value of .533
Among customer satisfaction, the indicator with the highest influence on the variable
is spoken and performance attributes with a value of 721 the indicator with the second
highest influence is surprise and delight attributes with a value of 674. The indicator with
the least influence on influence on is basic and expected attributes with a value of .512.
Among attitudinal loyalty, the indicator with the highest influence on the variable is
the resistance to switch with a value of 818. The indicator with the second highest
Estimate
val <---per .656
sat<--- per .441
loy<--- val .845
pq<---per .740
pd <---per 727
b<--- per .718
p<--- per .413
cs<---per .595
bas<--- per .512
spo <--- per 721
sur<---per .674
rep<---per .774
adv <--- loy .741
pre<--- loy .695
res <---loy .818
er<--- val 593
ir <--- val 689
ef<---val .533
Table13–Standardized Regression Weights of all Variables

Jurnal EKSEKUTIF Volume 10 No. 2 Desember 2013
383
influence on attitudinal loyalty is the repurchase intention with a value of 774. The
indication with a value of 741 The indication with the influence in attitudinal Loyalty is the
willingness to pay premium pay premium with a value of 695.
Conclusion and Recommendation
Conclusion
From the data gathered, this shows that loyal customers are most likely to
stay with Sony Ericsson and resist switching over to others. Additionally, when customers
are loyal, they are more likely to keep purchasing or increase purchases of Sony Ericsson
product in future transaction. Furthermore, the more loyal customers are, the greater the
willingness to recommend friends and relatives to purchase from Sony Ericsson. This data
also shows that loyal customers are generally wiling to pay more for Sony Ericsson.
If can also be observed that, In addition to the basic communicative purpose
of mobile phone, customers place the highest importance in Sony Ericsson fulfilling all
features and promises that have been promised and advertised. Thus, customers
satisfaction is most achieved when these promises are met. Moreover, customers view it as
important that Sony Ericsson provides extra benefits. The observation also shows that
customer mostly expect and make price judgments based on the amount of features and
benefits that are offered. Of the next importance is the price comparison between the Sony
Ericsson product and those of other companies’. The least influence comes external
factors, such as promotions, budget and time constrains.
In addition, It can Be gathered that Sony Ericsson mobile phones are
complemented by a wide variety of accessories and equipped with technologies such as
infrared, Bluetooth, Walkman and Cyber-Short. Sony Ericsson product are also well
designed, such as ease in operating, learning remembering, identifying of symbols, and
appearance, all helping to create a pleasant feeling during usage. Product with the brand
Sony Ericsson are also trusted in delivering assurance of Quality. Customers service, such
as product warranties, availability of service centre and terms of payment, are next in the
consideration of Sony Ericsson product. Based on the Structural Equation Modeling result

Jurnal EKSEKUTIF Volume 10 No. 2 Desember 2013
384
it is observed that all indicators have an influence on the respective. Similarly, the latent
variables also have an influence on one another, as shown on the theoretical framework.
Therefore, all nineteen hypotheses proposed in the study are accepted.
Recommendations
In other for Sony Ericsson to increase the attitudinal loyalty among customers and
increase the resistance to switch and repurchase intentions, it must increase the customer
satisfaction. In turn, for customer satisfaction to be increased, both the product
performance and the perceived value of the product among customers must be increased as
well.
For customer satisfaction, it has been discovered that most influential indicator in
other of significance are spoken and expected attributes ,surprise and delight attributes and
basic attributes. As a result, Sony Ericsson must strive to create product capable of
delivering the promised performance of the product as featured on advertisements and
include additional attribute to delight the customer, while not forgetting the most essential
purpose of a mobile phones: communication. For example Sony Ericsson may incorporate
as may features as possible and include various options. However, the addition of these
extra benefits must not compromise with the normal usage and operations.
As for perceived values, the indicators that influence variable in order of
significance are internal reference prices, eternal factors, and external reference prices. The
relation between the reference price paid and the features or benefits, Gotten pay a large
role in deciding the “fairness” of the price charged. The price of Sony Ericsson is
perceived to be “just right” as its product are seen to be capable of fulfilling needs and
budget- friendly. As mention by Sony Ericsson, the design process of product is not based
on exiting competition ‘product buy rather on internal innovation. As a result, customers
cannot readily receive information on the “fair “value of similar product, explaining the
relatively lower significance of the external reference prices.
Having tested product quality as being the most significant indicator of product
performance, respondent have described Sony Ericsson mobile phone accessories as
needing improvement in durability the charger in particular being described as being very

Jurnal EKSEKUTIF Volume 10 No. 2 Desember 2013
385
brittle. After a period of usage, complications have made the charger unable to perform
efficiently. When charging, the mobile phone and the charger do not seem to be able to
align perfectly, requiring adjustment in position. As a result, Sony Ericsson needs to focus
on improving the charger to increase the durability and length of usage.
As for the weakest indicator, the product’s packaging is theorized to serve several
purposes, such as protection and promotion of the product. In Sony Ericsson case, the
packaging aspect of the product has been underutilized; the packaging helps to protect the
product, but not promote, and little product information is found on the packaging.
Although it can be current method is thought to be incorporate these aspects into the
product, the current method is thought to be acceptable and reasonable Sony Ericsson
centre, instead of encasing products in boxes and putting them on display, replication of
particular models are displayed and information brochures placed beside them. This
method also allows customers to interact with the product before the actual purchase.
References
Aaker, D. A., Kumar ,V.,AND Day ,G.s., 2007 Marketing Research Edition ,John
Wiley and Sons
Adamrah ,M .,”Foreign Cell Phone Products to Expand Presebce in RI”.The Jakarta Post
[online],12 Augustus 2008 ,Http://www.theJakartapost.com/new/2008/08/12/foreign-cell -
phone-producers-expand-peresence-ri.html[retrieved 25 October 2008]
Anderson ,E .W ., and Sullivan ,M. w., “The Antecedents and Consequences of Customer
Satisfaction for Firm”,Journal of Marketing Science ,Vol .12,No 2,1993
Bearden ,W.O., Ingram,T., ad La Forge ,R . W., Marketing :Principle &perspectives
Edition ,Mc Graw-Hill,2001.
Chandrataruna ,M., “SE dan Serap Pasar Ponsel Lagi Turun “,Gadget [online],26 july
2008 ,http ://techno.pkezone.com /index.php/ReadStory/2008/07/26/57/131301/se-daya –
serap-pasar-ponsel-lagi-turun/se-daya-serap-pasar-ponsel-lagi turun [retrieved29
October 2008}
Jurnal EKSEKUTIF Volume 10 No. 2 Desember 2013
386
Chandrataruna ,A., And Holbrook, M ”The Chain of Effects Brand Trust and Brand Affect
to Brand Performance: The Role Of Brand Loyalty”, Journal of Marketting,Vol 65 , No
2.2001 ,in Jaiswal,A.K ., and Niraj,R.,” Examining the Nonlinear Effects in Satisfaction –
Loyalty –Behavioural Intention Model”,Working paper [online],2007 ,http ://
www.iimahd.irnet,in/publication /data 2007-11-01 Jaswal.pdf[retrieved 26 September
2008 ]
Coorper ,D .,and Schindler ,P.S ., Marketing Research , Edition ,Mc Graw –Hill ,2006
In Ismadji ,D “The Corfirmatory Anlysis of Brand Equity Model On Brand
Loyalty,Emotional,and Rational Evaluation of Honda Jazz In Surabaya “,Comprehensive
Paper ,IBMT,2008.
Czinkota ,M.R ., And Ronkainen ,I.A., international Marketing , Edition ,Thomson
Sount-Western, 2007.
Dick ,A,S., and Basu ,K., “Customer Loyalty : Toward an Integrated Conceptual
Framework”, Jurnal of Marketing Science.1994 in Evanschitzky H., Iyer ,G.r.iyer
,plassmann ,H ., Niessing ., J and Meffert. H,,” The Relative Strength OF affective
Commitment in Securing Loyalty In Service Relationship” Journal of Business Research
[Online ],Vol 59 NO .12.2006 ,http ://web .mac .com hilke _ plassman/I Web /Site/
Publications_files /JBR6219.. pdf [retrieved 26 september 2008]
Founier. S 1998.,” Consumers and Their Brands: Developing Relationship Theory in
Customers Research”, Journal of Cunsument Research ,Vol .24,1998,
Foxall,G.R. 1987,” Radical Behaviourism and Customer Research;Theoretical Promise
and Empirical Problems”, International journal of Research in Marketing,Vol No.2.1987,
Gremler,DD,and Brown ,SW,1998. ”Service Loyalty :Antecedents ,Components and
Outcomes “,American Marketing Association,Winter Education ‘Conference,1998 ,
Grewal ,D., and Levy ,M. 2008, Marketing ,1st Edition ,McGraw-Hill,2008
Hidayat,T,2008. Satu Dekade Survei Keputusan Pelanggan, Swa sembada ,Vol.24,No
.20.18 September 2008.

Jurnal EKSEKUTIF Volume 10 No. 2 Desember 2013
387
Keiningham.T.,l.,Vavra,.T.G ., L and Wallard ,H ., Loyalty Myths ,John Wiley and Sony
,2005
Kotler., P,. and Keller 2008. Marketing Management ,12th Edition,Person Education.
Kother ., P., Armstrong ,G,swee ,H,.A Siew ,M,.Chin,T.T and Tse .,D.K.2005,Principles of
Marketing: AN Asian Perspective 10th Edition ,Person Education.
Mellens ., Dekimpe ,M.G.and Steenkampe .,JB.E.M.,”A Review Of Brand Loyalty
Measure in Marketing “, Tijdschrift voor Economie En Management Vol .41,1996, In
Bennett,R,McCoLL-Kennedy.J.R and Coote .,L.V ,.”Trust Commitm,ent And Attitudinal
Brand Loyalty : Key Constructs in Business –To Business Relationship”, ANZMAC 200
visinary Marketing for the 21 st Century: Facing the Challenge [online] ,2000 ,http://
smib.vuw.ac.nz:8081/ www/ANZMAC2000 /CDside/paper/b/Bennett1.PDF{retrived 26
septembmer 2008]
Public ,D.H.Merek Kuat Kian Kokoh dan Tak tergoyahkan, SWA sembada ,Vol 24 no 18
.21 August.