The effect of condensation in clothing on heat transfer · Loughborough University Institutional...
43
•
Transcript of The effect of condensation in clothing on heat transfer · Loughborough University Institutional...
Loughborough UniversityInstitutional Repository
The effect of condensationin clothing on heat transfer
This item was submitted to Loughborough University's Institutional Repositoryby the/an author.
Citation: LOTENS, W.A., VAN DE LINDE, F.J.G. and HAVENITH, G.,1990. The effect of condensation in clothing on heat transfer. Soesterberg, NL:TNO Institute for Perception, 40 pp.
Additional Information:
• This is a report.
Metadata Record: https://dspace.lboro.ac.uk/2134/12412
Version: Published
Publisher: TNO Institute for Perception
Please cite the published version.

This item was submitted to Loughborough’s Institutional Repository (https://dspace.lboro.ac.uk/) by the author and is made available under the
following Creative Commons Licence conditions.
For the full text of this licence, please go to: http://creativecommons.org/licenses/by-nc-nd/2.5/
Netherlands T NO Institute for Preto
organization forapplied scientific 1resvf" , L
NIZF 1990 B-5 THE EFFECT OF CONDENSATION IN
W.A. otensCLOTHING ON HEAT TRANSFER
F.J.C. van de Linde 1
G. Havenith
4$0IO 08 0 07
Netherlands TNO Institute for Perceptionorganization forapplied scientific P0 Bo.. 23Lresearch 3769 ZG Socehterey
(Kampweg 5TNO-renort Soesterbegr The Nethe,lands
Phone -31 34 6362 11
IZF 1990 B-5 THE EFFECT OF CONDENSATION INCLOTHING ON HEAT TRANSFER
W.A. LotansF.J.G. van de Linde 13G. Havenith
Nothirng from ths ,ssue may be reproouced
and or publshed by print protoprlntmicrofifm or any other means wnn tL1prevous wrten consent from TNOSomitting the report for inspection top00e directly "inferestedo ys mfteii
In Case ihs eoOn was dralted unde,instruction hfr rlghlf ann flnrrC0c, contracing paries r1 subject to ethe
the Standard Coidrfrons for ResearchInstructlions dve to TNO O the re le'anagreement concluded beoween the Soiitracfing
parn'es on account o' fie ...... objectinvolved
TNO
,',
Number of pages: 40 0
M|
3
CONTENTS
Page
SUMMARY 5
SAMENVATTING 6
I INTRODUCTION 7
2 CONDENSATION THEORY 8
3 EXPERIMENTAL VERIFICATION 13
3.1 General methods 13
3.2 Experiment 1: Impermeable garments and sweat blocking 15
3.3 Experiment 2: Impermeable vs semipermeable garment 18
3.4 Experiment 3: Impermeable garments in various environments 24
3.5 Comparison with model calculations 27
4 DISCUSSION 31
5 CONCLUSIONS 36
REFERENCES 37
APPENDIX 39
.. /
- A N
5
Report No.: IZF 1990 B-5
Title: The effect of condensation in clothing on heat
transfer
Authors: Drs. W.A. Lotens, drs. F.J.G. van de Linde
drs. G. Havenith
Institute: TNO Institute for Perception
Date: April 1990
HDO Assignment No.: B87-63
No. in Program of Work: 736.1
SUMMARY
A condensation theory is presented, that enables the calculation of
the rate of vapour transfer with its associated effects on temperature
and total heat transfer, inside a clothing ensemble consisting of
underclothing, enclosed air, and outer garment. The model is experi-
mentally tested by three experiments: I impermeable garments worn by
subjects with and without plastic foil around the skin, blocking sweat
evaporation underneath the clothing; 2 comparison of heat loss in
impermeable and semipermeable garments and the associated discomfort
and strain; 3. subjects working in impermeable garments in cool and
warm environments at two work rates, with and without external radi-
ation, until tolerance.
The measured heat exchange and temperatures are calculated with
satisfying accuracy by the model (mean error - 11, sd - 10 W/m2
for
heat flows and .3 and .9 °C for temperatures, respectively). A numeri-
cal analysis shows that for total heat loss the major determinants are
vapour permeability of the outer garment, skin vapour concentration,
air temperature and clothing insulation. In the cold the condensation
mechanism may completely compensate for the lack of permeability of
the clothing as far as heat dissipation is concerned, but in the heat
impermeable clothing is more stressful.
6
Rap.nr. IZF 1990 B-5 Instituut voor Zintuigfysioiogie TNO,Soesterberg
Ret effect van condensatie in 1kleding op varmte afgifte en varintebelastheid
W.A. Lotens, F.J.G. van de Linde en G. Havenith
SAMENVATTING
Een condensatietheorie waarin kieding wordt voorgesteid door onderkle-
ding, een ingesloten luchtlaag, en buitenkleding, maakt het mogelijk
warmte afgifte en temperaturen in de kieding te berekenen. Dit kie-
dingmodel is experimenteel getoetst aan drie experimenten: 1. met
impermeabele kieding die door proefpersonen gedragen wordt, terwiji de
zweetverdamping ander de kieding al of niet geblokkeerd wordt met
plastic folie; 2. vergelijking van warmteverlies en discomfort in
semipermeabele en impermeabele kieding; 3. met proefpersonen die in
impermeabele kleding werken bij een koele en een warme omgeving, bij
twee arbeidsniveaus en al of fliet met zon, tot de tolerantiegrens is
bereikt.
De experimenteel bepaide warmtestromen en temperaturen komen goedovereen met de modelberekeningen (fout - 11, sd - 10 W/M2 voor warmte-
stromen en .3 reap. .9 *C voor temperaturen). Een numerieke analyse
last zien dat pernieabiliteit, waterdampconcentratie aan de huid,
luchttemperatuur en kledingisolatie de belangrijkste variabelen zijn
voor de totale warmteafgifte. In de kou kan het condensatiemechanisme
het gebrek San waterdampdoorlaatbaarheid volledig goed maken voor war
betreft de warmteafgifte, maar in de warnite is impermeabele kieding
betastender.
7
1 INTRODUCTION
Condensation of evaporated sweat inside clothing is a highly relevant
factor in comfort, strain and clothing design. In comfortable condi-
tions, condensation is not likely to occur, since the evaporation rate
is low. However, during work significant quantities of sweat will be
produced, that may or may not evaporate and dissipate through the
clothing, depending on the clothing properties and environmental
conditions. During moderate sweating, the vapour concentration at the
skin will increase to produce a vapour flow, carrying the heat of
evaporation away from the skin, through the clothing or clothing
ensemble. When the vapour concentration does not exceed the saturation
vapour concentration, the vapour will be passed to the environment. In
that case there is cooling and the clothing stays dry. Both the
gradient of the vapour concentration and the temperature gradient are
involved, since the temperature determines the saturation concentra-
tion.
During harder work, the vapour concentration may increase so much that
somewhere in the clothing system saturation is reached. Condensation
will take place there, liberating at that point the heat of condensa-
tion that had previously been taken up from the skin by evaporation.
This has its impact on the temperature of the clothing, because heat
production forces the local temperature to increase, thereby changing
the gradient over the garment: the temperature gradient from the skin
to the condensation spot will decrease, while the gradient between
that spot and the environment will increase. This process may change
the exact location of the condensation, but generally condensation
will take place where the permeability of the clothing drops: at the
inner face of a fabric layer.
At first sight the sweating may seem thermally ineffective, since the
sweat and the evaporative heat did not leave the clothing. But a
closer look learns that the heat has already passed a good deal of the
clothing and that is a significant contribution to heat dissipation.
However, the moisture is trapped in the clothing, accumulating there.
Thus during condensation there is cooling, but the clothing will
become wet.
Not only lack of permeability of the clothing may cause condensation,
but low air temperatures as well. In arctic clothing sweat is not
likely to escape to the environment, since it will condensate and next
freeze somewhere inside the clothing system. In this paper a simple
physical condensation theory will be described. The theory is checked
by several experiments.
Ir
8
Not only condensation, but also absorption and ventilation have an
impact on clothing heat transfer. The effect of ventilation will be
addressed here, but the effects of absorption have been treated in
another paper (Lotens and Havenith, 1989a).
2 CONDENSATION THEORY
It is well possible to define a physically exact description of
combined heat and moisture transfer, based on the heat and moisture
conservation laws. By means of a computer program, the exact solution
of these equations may be approximated by calculating the process for
small increments in place and time (Farnworth, 1986).
However, this still is a quite complicated procedure, that might
reveal fine details in the time pattern of vapour and temperature
gradients, but is probably unnecessary for the purpose of calculating
steady states. Therefore, a more simple model will be described, that
includes the important features, but is easy to handle and allows an
experimental evaluation.
The most relevant parameters in the model are the heat and vapour
conductivity of the clothing ensemble. It mostly needs two layers, of
which the outer layer has a relatively low permeability for water
vapour, to get condensation. There will generally be a trapped air
layer between the two clothing layers. Although not strictly necess-
ary, it is convenient to include the outer air layer as a separate
layer, since variations in air motion will affect this layer. The
total ensemble comprises thus of four distinct layers. The trapped air
layer may be ventilated due to motion or wind. In Fig. 1 this ensemble
is schematically shown, together with the pertaining heat and water
vapour resistance networks.
The networks include the resistances of the clothing layers, radiation
transfer and convection. At the inside of the outer layer condensation
is a drain of water vapour and at the same time a source of heat of
condensation. The networks are the basis for a number of equations. At
any branching point the total of heat and vapour flows should be zero.

9
Venhttat on
Skin under I trapOed i outer I adjacent IcLothng 'Layer ar
A BH tTsk lucL Trn, Tc, Tc to
K0
C C$. Cuct CM. Cotb Ccto C a
etI cond en sation
Fig. 1 The four layer clothing ensemble, together withthe resistance networks for the heat and vapour trans-fer. D, E, and I represent radiation transfer, F and Mrepresent ventilation, and the other resistances convec-tive transfer.
Over parallel chains the gradient should be equal. Thus a total of 14
equations with 15 unknown variables results. These variables are the
heat and vapour flows through the various layers of the ensemble, and
the rate of condensation. In case of condensation the missing equation
is provided by the fact that the (saturated) vapour concentration at
the inside of the outer clothing layer is defined by the temperature.
If there is no condensation there is one unknown variable less. In
particular at the inside of the outer clothing layer holds:
Tmi Tcli Tucl -Tcli Tcli- Tclo+ + He RCoC D G
Cmi - Ccli Ccli - Ccloand D( )-RCo+D( )
L 0
where He - heat of condensation (2430 J/g)
C,D,G - heat resistances (m2K/W)
1iG
L,O - vapour resistances (m)
RCo - rate of condensation (g/m2s)
1D - diffusion coefficient (25.10-6 m2/s)
T - temperature (K)
C - vapour concentration (g/m3 )
cl refers to outer clothing, cli for inside, clo for outside,
mi refers to micro climate, ucl to underclothing.
The vapour resistance is expressed here as equivalent air layer thick-
ness (Whelan et al., 1955). The solution of the equations is explained
in the appendix. The whole procedure has been programmed in Fortran
(ConRad Vl.l) and requires the specification of the clothing in terms
of:
underclothing heat transfer coefficient
trapped air thickness
clothing surface area factor
outer clothing heat transfer coefficient and vapour resistance
ventilation
external air motion
boundary conditions such as Tsk, Ta, Csk, and Ca where sk refers to
skin and a to air.
The other parameters are estimated by the program with sufficient
accuracy and it takes into account geometrical factors such as the
increased surface area of layers. The program calculates the wet and
dry heat flows through the ensemble, the resulting temperatures and
vapour concentrations, and the moisture accumulation.
A typical result is shown in Fig. 2 for a semipermeable garment, worn
over cotton fatigues in a 14*C, 90% relative humidity environment,
while the skin is 90% wet.
The calculation shows that under these circumstances there is con-
siderable condensation (100 g/m2h) despite the (moderate) permeability
of the outer garment (dcl - 32 mm). This condensation takes place
since the temperature and dewpoint coincide at the inner face of the
outer garment. At that spot the evaporative heat flow drops and the
dry heat flow increases, resulting in a constant total heat flow
throughout the ensemble.
3432 - 200
30 - TotaL
28 Temp 160
'26 - ES24 _" 2
Dewpo,n , 3 1202 2 - E y e
22 Evap_
a20 80o-£'%\\ Dry I
18c
16 401L..........
12 0
sk uctL mi cLi Cdo a sk uci mi cLi CIo a
Fig. 2 Calculated temperature and dewpoint gradients,showing condensation at the inside of the outer garment(left panel). This causes a turnover from evaporative indry heat loss, without affecting the total heat flow(right panel).
For better permeable garments there will still be condensation, until
dcl is less than 2 mm, which is the vapour resistance that may actual-
ly be expected for a non-finished fabric or for the very best semiper-
meable fabrics. The model calculates the increase in surface tempera-
ture due to heat of condensation, the associated change in heat flow,
and the condensation rate. Fig. 3 shows for a range of vapour resis-
tances of the outer garment the gradients in the ensemble and the heat
flows.The model predicts a steep increase of Tcli with increasing condensa-
tion, pushing the other temperatures in the ensemble up. The gradient
over the adjacent air layer may increase as much as 70%, increasingthe dry heat flow from the garment to the air from 95 to 150 W/m
2,
whereas the dry heat flow from the skin to the garment decreases.
For the evaporative term the opposite occurs. Both changes compensateeach other partly, but the net effect is still that the total heat
loss decreases from 210 to 155 W/m2 , comparing a permeable with animpermeable garment. For other ensembles or other boundary conditions
the magnitude may be different.
12
220
200
180
32 Tsk160
30-r 140 -air)
28 Tucl
2! 120G326 "o 00
0~24 ~ '. E vap (skin)~80-a.22 80 L -- Tc Dry (skin)
20 T 5060
18 40.
16 20620! Evap (air)To
14[i" -
12 4 8 16 32 64128256 1 2 4 8 16 32 64128256dfabric (mm) dfabric (mm)
Fig. 3a (Left) Calculated temperatures of the variouslayers, as a function of the vapour resistance of theouter fabric.Fig. 3b (Right) Evaporative and dry heat loss at theskin and to the air, respectively, as a function of thevapour resistance of the outer fabric. For resistanceshigher than about 1.7 mm condensation occurs, increasingthe dry heat flow to the air at the expense of evapo-rative heat flow. The total heat flow decreases withincreasing vapour resistance.
These predictions can be verified experimentally. In the following
section three experiments are described to evaluate the model. After
the experimental methods the data will be presented for the separate
experiments, winding up with a comparison of calculated and experimen-
tal data.
13
3 EXPERIMENTAL VERIFICATION
In the first experiment (which has briefly been published in 1983: Van
de Linde and Lotens, 1983) subjects walked at various temperatures
with and without impermeable garments, and with and without a sweat
blocking layer close to the skin. In the second experiment (Havenith
and Lotens, 1984) subjects cycled at different work rates in semiperm-
eable and impermeable garments. In the third experiment (Van de Linde,
1987) the heat strain was established during moderate and very heavy
work in impermeable garments at two temperatures and with and without
heat radiation.
3.1 General methods
Indirect calorimetry was used in all experiments, by determination of
the heat balance equation.
M - Wext + Resp + Evap + Store + Dry (W)
where M - metabolism
Wext - external work
Resp - respiratory dry and evaporative heat flow
Evap - evaporative heat flow
Store - rate of heat storage
Dry - dry heat flow
The heat balance was taken over the last 5 to 10 minutes of 1 hr
sessions and the work load and environmental conditions were chosen
such that the subject would be near to thermal equilibrium and thus
the Sto-term small. In the third experiment sessions were sometimes
shorter and did not end in thermal equilibrium.
H was determined from 02 consumption and CO2 production, using Weir's
(1949) formula for conversion to heat.
Next was set to zero for treadmill walking and set to the external
load during ergometer cycling.
B was calculated according to Fanger (1970).
was either determined from continuous weight change measurements
or from before and after session weighing, corrected for respiratory
and metabolic weight losses. The accuracy of weighing is about 10 g.
Store was calculated from the rate of change of rectal and mean skintemperature, using weight factors of .67 and .33 respectively, in the
cold and .8 and .2, respectively, in the heat.
.. ... .
14
Temperature measurements
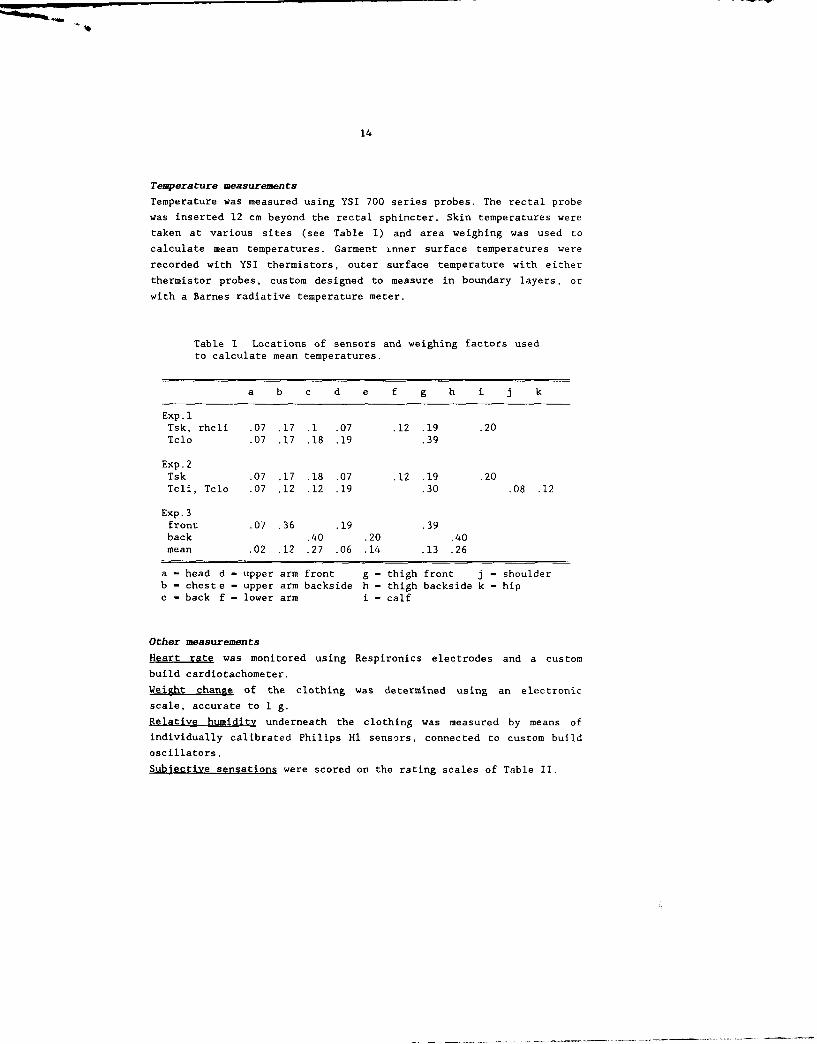
Temperature was measured using YSI 700 series probes. The rectal probe
was inserted 12 cm beyond the rectal sphincter. Skin temperatures were
taken at various sites (see Table I) and area weighing was used to
calculate mean temperatures. Garment inner surface temperatures were
recorded with YSI thermistors, outer surface temperature with either
thermistor probes, custom designed to measure in boundary layers, or
with a Barnes radiative temperature meter.
Table I Locations of sensors and weighing factors used
to calculate mean temperatures.
a b c d e f g h i j k
Exp.1Tsk, rhcli .07 .17 .1 .07 .12 .19 .20Tclo .07 .17 .18 .19 .39
Exp.2Tsk .07 .17 .18 .07 .12 .19 .20Tcli, Tclo .07 .12 .12 .19 .30 .08 .12
Exp.3front .07 .36 .19 .39back .40 .20 .40mean .02 .12 .27 .06 .14 .13 .26
a - head d - upper arm front g - thigh front j - shoulderb - cheste - upper arm backside h - thigh backside k - hipc - back f - lower arm i - calf
Other measurements
Heart rate was monitored using Respironics electrodes and a custom
build cardiotachometer.
Weight change of the clothing was determined using an electronic
scale, accurate to I g.
Relative humidity underneath the clothing was measured by means of
individually calibrated Philips HI sensors, connected to custom build
oscillators.
Subjective sensations were scored on the rating scales of Table II.
15
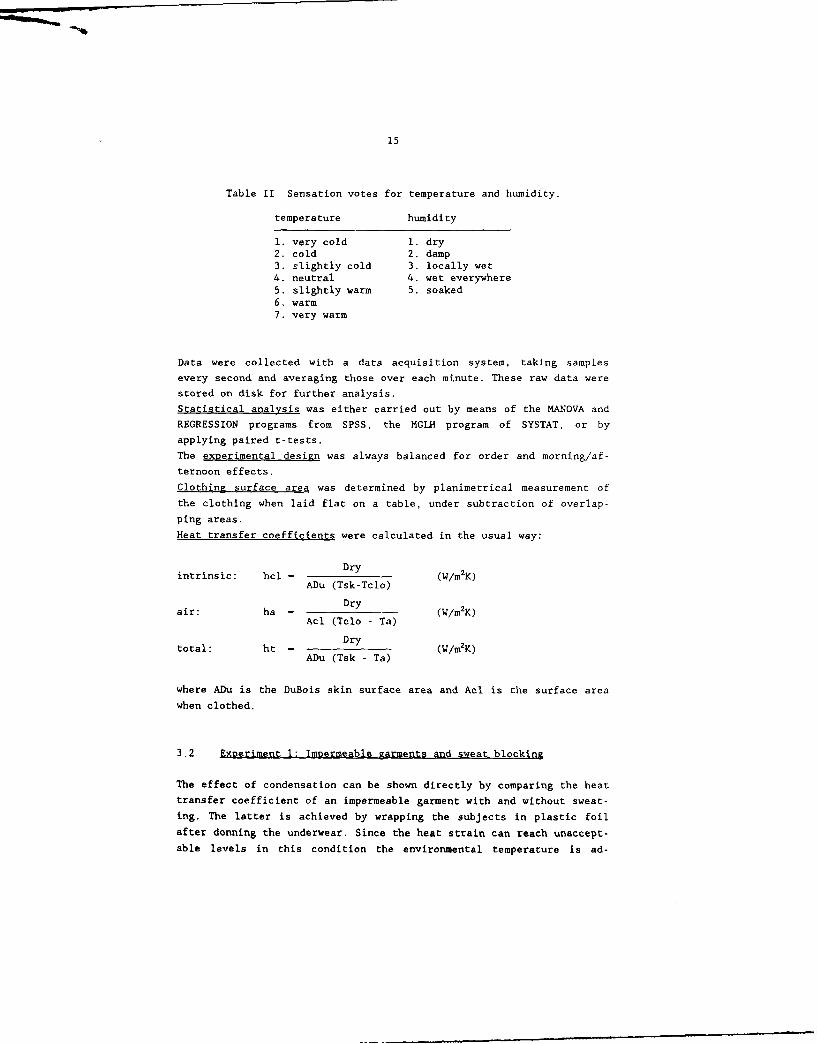
Table II Sensation votes for temperature and humidity.
temperature humidity
1. very cold 1. dry2. cold 2. damp3. slightly cold 3. locally wet4. neutral 4. wet everywhere5. slightly warm 5. soaked6. warm7. very warm
Data were collected with a data acquisition system, taking samples
every second and averaging those over each minute. These raw data were
stored on disk for further analysis.
Statistical analysis was either carried out by means of the MANOVA and
REGRESSION programs from SPSS, the MGLH program of SYSTAT, or by
applying paired t-tests.
The experimental design was always balanced for order and morning/af-
ternoon effects.
Clothing surface area was determined by planimetrical measurement of
the clothing when laid flat on a table, under subtraction of overlap-
ping areas.
Heat transfer coefficients were calculated in the usual way:
intrinsic: hcl - Dry(Wm2K)ADu (Tsk-Tclo)
air: ha - Dry (W/m2K)Acl (Tclo - Ta)
total: ht - Dry (W/m2K)ADu (Tsk - Ta)
where ADu is the DuBois skin surface area and Acl is the surface area
when clothed.
3.2 Experiment 1: Impermeable garments and sweat blockinz
The effect of condensation can be shown directly by comparing the heat
transfer coefficient of an impermeable garment with and without sweat-
ing. The latter is achieved by wrapping the subjects in plastic foil
after donning the underwear. Since the heat strain can reach unaccept-
able levels in this condition the environmental temperature is ad-
16
justed to cause approximately the same strain in all experimental
conditions.
Six young healthy male subjects (height 1.77-1.83 m, weight 67-82 kg,
DuBois surface area 1.93-2.05 m2 , average 1.97 m2) walked during I hr
sessions on a treadmill with a speed of 1.25 m/s (4.5 km/h). They were
wearing either long underwear or long underwear with fatigues and an
impermeable two-piece garment with hood. Both ensembles were worn with
and without plastic foil. A fifth condition, with increased work rate
was included. The conditions are specified in Table III. The ensembleswere completed with impermeable boots and gloves, and a full face
respirator.
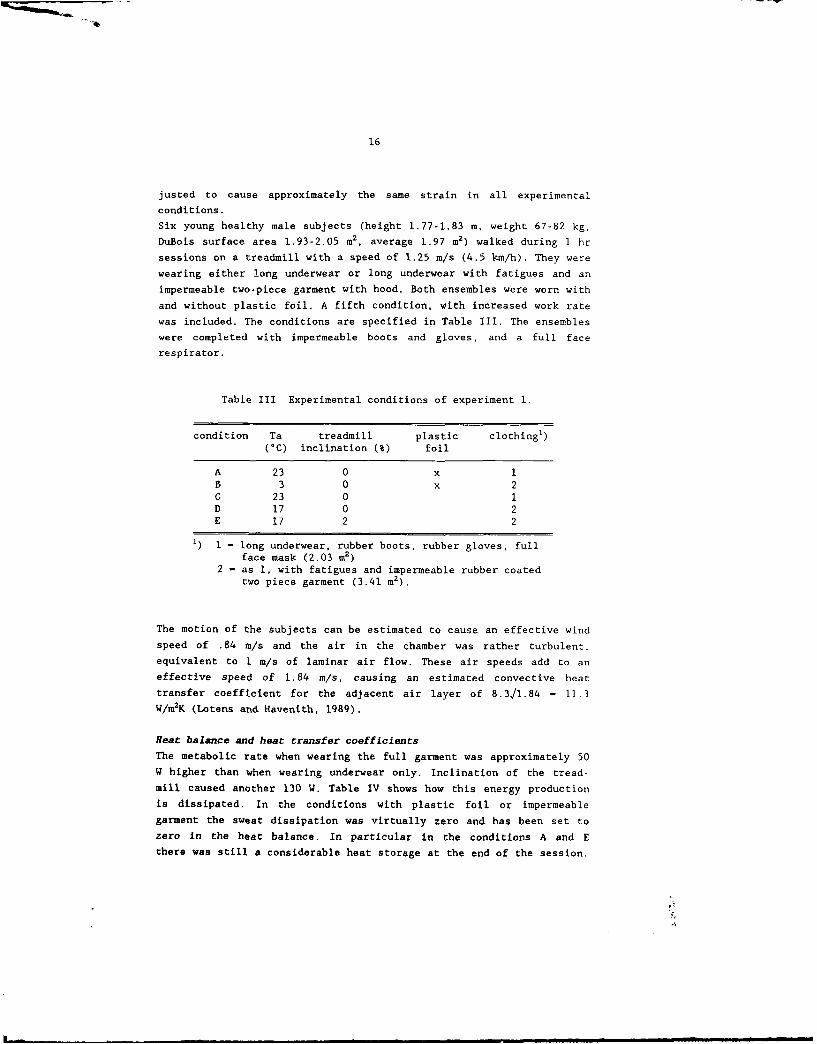
Table III Experimental conditions of experiment 1.
condition Ta treadmill plastic clothing)(*C) inclination (%) foil
A 23 0 x1B 3 0 x 2C 23 0 1D 17 0 2E 17 2 2
I) 1 - long underwear, rubber boots, rubber gloves, fullface mask (2.03 m2)
2 - as 1, with fatigues and impermeable rubber coatedtwo piece garment (3.41 M2).
The motion of the subjects can be estimated to cause an effective wind
speed of .84 m/s and the air in the chamber was rather turbulent,
equivalent to I m/s of laminar air flow. These air speeds add to an
effective speed of 1.84 m/s, causing an estimated convective heat
transfer coefficient for the adjacent air layer of 8.3J1.84 - 11.3
W/m2K (Lotens and Havenith, 1989).
Heat balance and heat transfer coefficients
The metabolic rate when wearing the full garment was approximately 50
W higher than when wearing underwear only. Inclination of the tread-
mill caused another 130 W. Table IV shows how this energy production
is dissipated. In the conditions with plastic foil or impermeable
garment the sweat dissipation was virtually zero and has been set to
zero in the heat balance. In particular in the conditions A and E
there was still a considerable heat storage at the end of the session.
A%
17
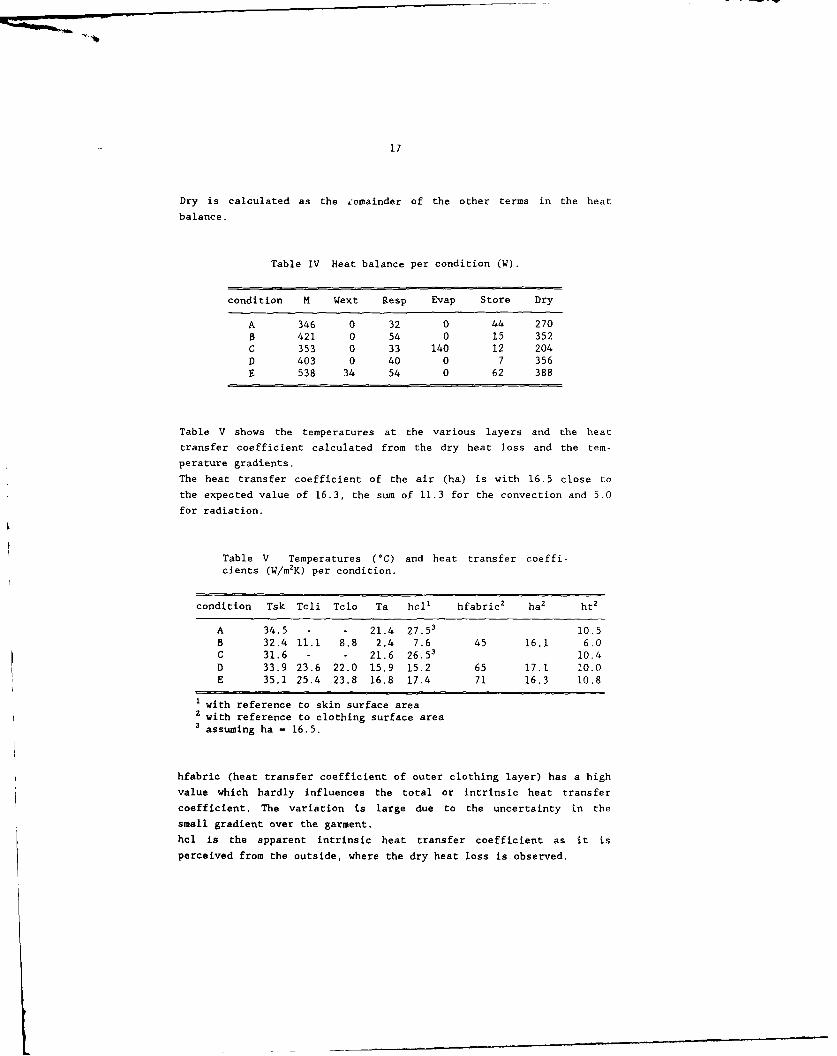
Dry is calculated as the cemainder of the other terms in the heat
balance.
Table IV Heat balance per condition (W).
condition M Wext Resp Evap Store Dry
A 346 0 32 0 44 270
B 421 0 54 0 15 352
C 353 0 33 140 12 204
D 403 0 40 0 7 356
E 538 34 54 0 62 388
Table V shows the temperatures at the various layers and the heat
transfer coefficient calculated from the dry heat loss and the tem-
perature gradients.
The heat transfer coefficient of the air (ha) is with 16.5 close to
the expected value of 16.3, the sum of 11.3 for the convection and 5.0
for radiation.
Table V Temperatures (0C) and heat transfer coeffi-
cients (W/m2K) per condition.
condition Tsk Tcli Tclo Ta hcl' hfabricz ha2
ht2
A 34.5 - - 21.4 27.5' 10.5B 32.4 11.1 8.8 2.4 7.6 45 16.1 6.0
C 31.6 - - 21.6 26.5' 10.4D 33.9 23.6 22.0 15.9 15.2 65 17.1 10.0
E 35.1 25.4 23.8 16.8 17.4 71 16.3 10.8
1 with reference to skin surface area2 with reference to clothing surface area
3 assuming ha - 16.5.
hfabric (heat transfer coefficient of outer clothing layer) has a high
value which hardly influences the total or intrinsic heat transfer
coefficient. The variation is large due to the uncertainty in the
small gradient over the garment.
hcl is the apparent intrinsic heat transfer coefficient as it is
perceived from the outside, where the dry heat loss is observed.
18
Underneath the impermeable layer, however, both a dry and an evapo-
rative heat flow exist, according to the theory. Thus the differences
in hcl between the various conditions with similar clothing (B, D, and
E) could be attributed to the vapour flow. In condition B, with only
dry heat underneath the garment, hcl is only half that of condition D.
This suggests a wet heat flow in condition D of the same magnitude as
the dry heat flow. In condition E, with a higher work rate, hcl is
even slightly higher, as could be expected since the excess heat will
mainly be transported by excess sweat.
For the rather thin underwear of conditions A and C the plastic foil
doesn't make a real difference in hcl.
The net result for the apparent total heat transfer coefficient ht is
that the value for condition B is significantly lower (p<.002) than
for the other conditions, and that there is no significant difference
in heat transfer coefficient between condition A (underwear + plasticfoil) and conditions D and E (underwear with fatigues and impermeable
garment). This may seem incredible at first sight, but can reasonably
be explained by the evaporative heat transport underneath the garment
at one hand, and the unusually large clothing surface area on the
other hand, which diminishes the influence of the adjacent air layer.
The heat strain in condition A is even slightly higher than in D since
the rate of heat storage is higher, despite the lower metabolism. This
is caused by the higher air temperature.
3.3 Exneriment 2: Imoermeable vs semipermeable garment
If indeed condensation can compensate for lack of permeability, as faras the heat dissipation is concerned, it might be questioned that
semipermeable clothing evokes less heat strain than impermeable cloth-
ing. Such results were found by Holmer and ElnAs (1984) in a 20'C
environment. According to the theory the difference should become
smaller, when the relative contribution of vapour transfer to heat
transport increases.
We compared such garments with respect to way of heat dissipation,
resulting heat strain, and discomfort in a 14°C, 90% rh environment.
This environment is regarded as typical for summer rain in a temperate
climate. Four young male subjects (height 1.79 - 1.90 m, weight 73-89
kg, DuBois surface area 1.82-2.17 m2, average 2.01 m2) cycled at 60 rpmon a bicycle ergometer, with external loads of about 60 and 105 W.
They were either wearing a loose fitting polyurethane coated polyamide
2 piece rain garment (fabric vapour resistance - 150 mm air equival-
ent) or a Gymstar semipermeable polyester microfiber garment (vapour
19
resistance 4.5 mm) of the same design. Underneath they were wearing
short underwear and fatigues. The ensemble was completed with rubber
gloves, rubber boots and a full face respirator, connected to the
respiratory equipment. The clothed surface area was 2.73 mz ,
The estimated convective heat transfer coefficient of the environment
is 9.6 (8,31,34, motion induced wind .34 m/s, turbulent air flow
equivalent to I m/s) due to activity and turbulent air, providing an
estimated ha of 9.6 + 5.0 - 14.6.
A full design of subjects, garments, and workloads was followed,
comprising a total of 16 experimental sessions.
Although the design aimed for two distinct work loads in reality a
distribution of metabolic rates was obtained, due to individual vari-
ance and irregularity in the setting of the external load. For that
reason the metabolism was treated as a covariant, rather than as a
categorical variable in the analysis.
Heat balance and heat transfer coefficients
Fig. 4 shows the heat balances of the individual sessions as a func-
tion of metabolic rate, both for the semipermeable and the impermeable
ensemble.
80C 8. 00
700- 700-
600-, 600 ,- n
500- 31500-
S400- Ow 00.
0 00 00
03000= 200 - 30000
200 200
100- 100-
0 - 0 _ . . . .
3Z 300 400 500 600 700metobolic rote (WI metabolic rote (W)
Fig. 4 The heat balance in semipermeable (left panel)and impermeable (right panel) ensembles as a function ofwork rate. From Havenith and Lotens (1984).
20
In both ensembles the storage of heat is small compared to the metab-
olism, showing that the produced heat is dissipated almost completely,
regardless of the permeability of the garment. The way the heat is
dissipated is rather different, however. With the semipermeable gar-
ment there is a considerable evaporation, whereas in the impermeable
garment the evaporation is almost negligible. The difference is made
up for by dry heat loss, which is much larger in the impermeable
garment.
Fig. 4 shows a good linear relationship between the various terms of
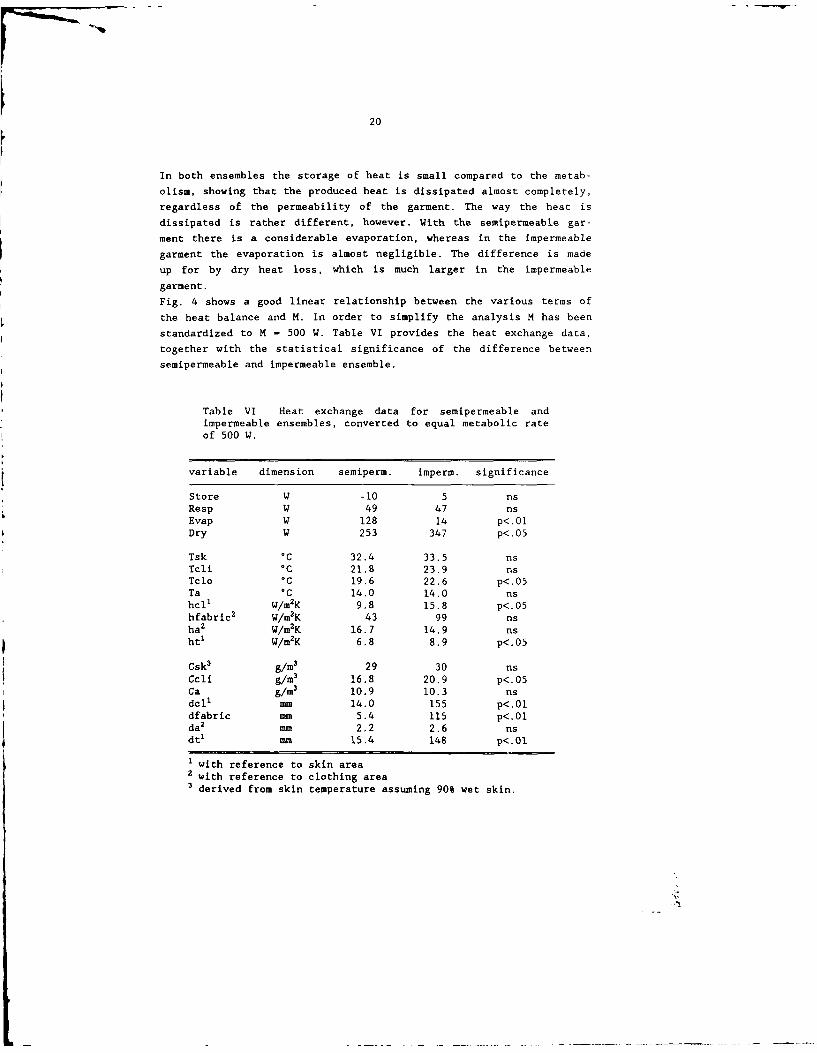
the heat balance and M. In order to simplify the analysis M has been
standardized to M - 500 W. Table VI provides the heat exchange data,
together with the statistical significance of the difference between
semipermeable and impermeable ensemble.
Table VI Heat exchange data for semipermeable andimpermeable ensembles, converted to equal metabolic rateof 500 W.
variable dimension semiperm. imperm. significance
Store W -10 5 nsResp W 49 47 nsEvap W 128 14 p<.OlDry W 253 347 p<.05
Tsk aC 32.4 33.5 nsTcli C 21.8 23.9 nsTclo C 19.6 22.6 p<.05Ta C 14.0 14.0 nshcl' W/m2K 9.8 15.8 p<.05hfabric2 W/m2K 43 99 nsha2 W/m2K 16.7 14.9 nsht' W/m2K 6.8 8.9 p<.05
Csk 3 g/m3 29 30 nsCcli g/m3 16.8 20.9 p<.05Ca g/m3 10.9 10.3 nsdcl' mm 14.0 155 p<.Oldfabric mm 5.4 115 p<.Olda2 mm 2.2 2.6 nsdt' mm 15.4 148 p<.Ol
1 with reference to skin area2 with reference to clothing area
3 derived from skin temperature assuming 90% wet skin.
21
The outside of the impermeable garment proves to be warmer than that
of the semipermeable garment. At the inside this is also the case for
the average value, but due to larger variance this is not statistical-
ly significant. Intrinsic heat transfer coefficient (hcl) is differ-
ent, despite the nearly equal heat resistance of the ensemble compo-
nents (the impermeable garment might have a higher hfabric than the
semipermeable garment, but this is not significant and both are so
high that their contribution to hcl is minimal). Since ha is equal for
both conditions, the difference in hcl also shows in ht.
The inside of the impermeable garment has a higher water vapour con-
centration than the semipermeable garment. There is only a small
evaporative heat flow out, however, because the vapour resistance of
the fabric is much higher. The intrinsic vapour resistances (dcl) are
very different as well, since the contribution of the underclothing is
relatively small. Also the total vapour resistance (dt) is much higherwith the impermeable garment.
All the above observations fit well into the mechanism of condensa-
tion. The higher clothing surface temperature of the impermeable
garment points at a higher rate of liberation of heat of condensation,
and hcl is higher because it includes the evaporative heat transport
under the clothing. In itself it is no proof of condensation, however,
since it could be argued that the accumulated sweat in the clothing
causes direct conduction of heat. In that case the clothing tempera-
ture would steadily increase during a session, running parallel to the
amount of sweat accumulated until complete soaking. Fig. 5 shows that
in reality the clothing temperature rather goes along with the rela-
tive humidity of the garment's inner surface.
Although the average relative humidity is not reaching saturation, in
the impermeable garment most locations are saturated, and in the
semipermeable garment many. Over all tests the average relative humid-
ity in the impermeable garment increases to 96%, and in the semiperme-
able garment to 87%.
Fig. 6 shows that the surface temperature of the suit increases with
the metabolic rate, and the associated higher absolute skin humidity,
particularly in the impermeable garment.
22
Fig. 5 Average tempera-ture (top panel) and rela-tive humidity (bottompanel) at the inside of _
the outer garment for the -
two ensembles. Data from 5 -24one subject. From Havenithand Lotens (1984). a
0c
0 22-
i i i per i100 ...
90,er.per
80E
> 70
0
50L
0 20 40 60time (min)
26[oS - x25F Im
25
24-
23- I
- 22o
Fig. 6 Ensemble outer surface temperature
20- o as a function of workrate. Due to conden-
0 0 sation the surface temperature increasesS with increasing thermal strain, and more
19 so in the impermeable (Ia) then in the
semipermeable (S) garment. The drawn lines18 06 are calculated (see section 3.5).300 400 500 600 700
M(W
23
Discomfort and strain
An interesting question is whether the equilibrium condition is
reached at a higher heat load in the impermeable garment, and whether
this evokes greater discomfort. Table VII shows that the heat load did
not differ between the two ensembles. Tsk, sweat production, and heart
rate were not significantly different and the only significant differ-
ence was found for Trect, but this difference was very small, and in
favour of the impermeable garment.
Table VII Heat strain and sensations for semipermeable
and impermeable garments, standardized to M - 500 W.
variable dimension semiperm. imperm. significance
Trect C 37.7 37.6 p<.05Tsk C 32.4 33.5 nsSweat prod.(in 1 hr) g 346 360 ns
Sweat accum.(in 1 hr) g 169 342 p<.OlHR min
-' 108 112 ns
temp. sensation slightly warm p<.Olwarm/warm
humidity sensation wet wet nsevery- every-where where
There was a difference in sweat accumulation, and also in temperature
sensation, but not in humidity sensation. In both garments the sub-
jects felt wet everywhere and apparently increases over 170 g of accu-
mulated sweat cannot be sensed by the subjects. Temperature sensation
was slightly warmer in the impermeable garment, despite the lack of
significance of the 1.1C difference in skin temperature. Havenith and
Van Middendorp (1986) showed that humidity may add to temperature
sensation in warm conditions, and it is hypothesized here that- the
combined effect of higher skin temperature :nd sweat accumulation
evoked the warmer sensation. This hypothesis is supported by the fact
that for lower work rates the skin temperature is similar for the two
ensembles, whereas both the heat sensation and the moisture accumula-
tion became much lower in the semipermeable than in the impermeable
ensemble.
24
3.4 Experiment 3: Impermeable garments in various environments
In this third experiment the effect of environmental temperature and
workrate on heat transfer of impermeable clothing was investigated. An
additional variable was heat radiation. When the surface of a garment
is heated, the rate of condensation will decrease and consequently the
effective heat transfer as well. Thus the effect of the radiation may
be moderated by the concomitant change in heat transfer coefficient.
The experiment was dedicated to the determination of both the heat
transfer and the tolerance time. In this paper only the heat transfer
aspects will be addressed, however.
Six young male subjects (height 1.58-1.92 m, weight 66-74 kg, DuBois
surface area 1.67-2.01 M2, average 1.90 M
2), three of which with a good
and the other three with a poor physical fitness, performed treadmill
work at a speed of 1.25 m/s (4.5 km/h). The treadmill was placed in a
wind tunnel, set to a frontal wind speed of 1.25 m/s. The effective
wind speed is estimated to comprise of .84 m/s due to motion and 1.25
m/s due to wind, resulting in a convective heat transfer coefficient
of 8.3J2.1 - 12 W/m2K and a total heat transfer coefficient for the air
(ha) of 17 W/m2K.
The subjects were wearing the same ensemble as in conditions D and E
of experiment 1: underwear, fatigues, dark green butyl rubber coated
garment, rubber boots and gloves, and a full face respirator, with a
total surface area of 3.41 m2.
Table VIII shows the various experimental conditions. The environ-
mental temperatures of 16 and 26 °C were combined with moderately hard
and very hard work, achieved by 0 and 5% inclination of the treadmill,
respectively.
Table VIII Experimental conditions of experiment 3.
condition Ta treadmill radiation°C inclination (%) (W/m
2)
I 16 0 0II 26 0 0III 16 5 0IV 26 5 0V 16 0 500
VI 26 0 500
• m m 4
25
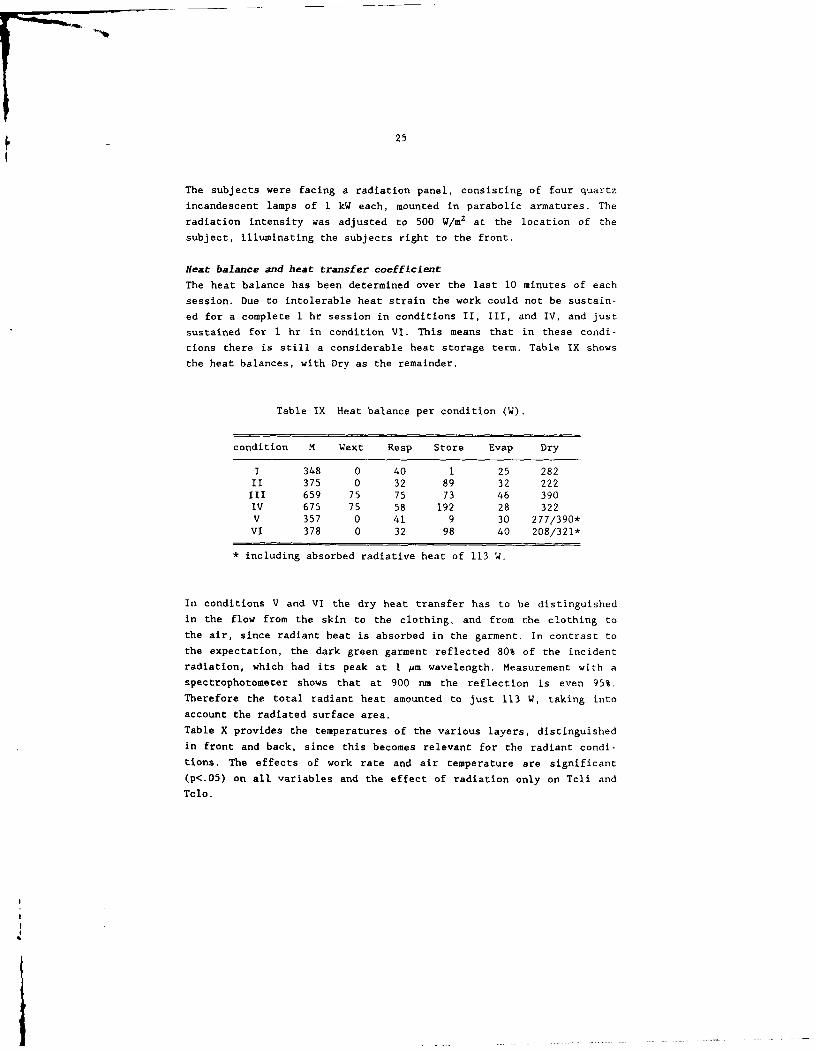
The subjects were facing a radiation panel, consisting of four quartz
incandescent lamps of I kW each, mounted in parabolic armatures. The
radiation intensity was adjusted to 500 W/m2 at the location of the
subject, illuminating the subjects right to the front.
Heat balance and heat transfer coefficient
The heat balance has been determined over the last 10 minutes of each
session. Due to intolerable heat strain the work could not be sustain-
ed for a complete 1 hr session in conditions II, III, and IV, and just
sustained for I hr in condition VI. This means that in these condi-
tions there is still a considerable heat storage term. Table IX shows
the heat balances, with Dry as the remainder.
Table IX Heat balance per condition (W).
condition M Wext Resp Store Evap Dry
1 348 0 40 1 25 282II 375 0 32 89 32 222III 659 75 75 73 46 390IV 675 75 58 192 28 322V 357 0 41 9 30 277/390*VI 378 0 32 98 40 208/321*
* including absorbed radiative heat of 113 W.
In conditions V and VI the dry heat transfer has to be distinguished
in the flow from the skin to the clothing, and from the clothing to
the air, since radiant heat is absorbed in the garment. In contrast to
the expectation, the dark green garment reflected 80% of the incident
radiation, which had its peak at I mm wavelength. Measurement with a
spectrophotometer shows that at 900 nm the reflection is even 95%.
Therefore the total radiant heat amounted to just 113 W, taking into
account the radiated surface area.
Table X provides the temperatures of the various layers, distinguished
in front and back, since this becomes relevant for the radiant condi-
tions. The effects of work rate and air temperature are significant
(p<.05) on all variables and the effect of radiation only on Tcli and
Tclo.
26
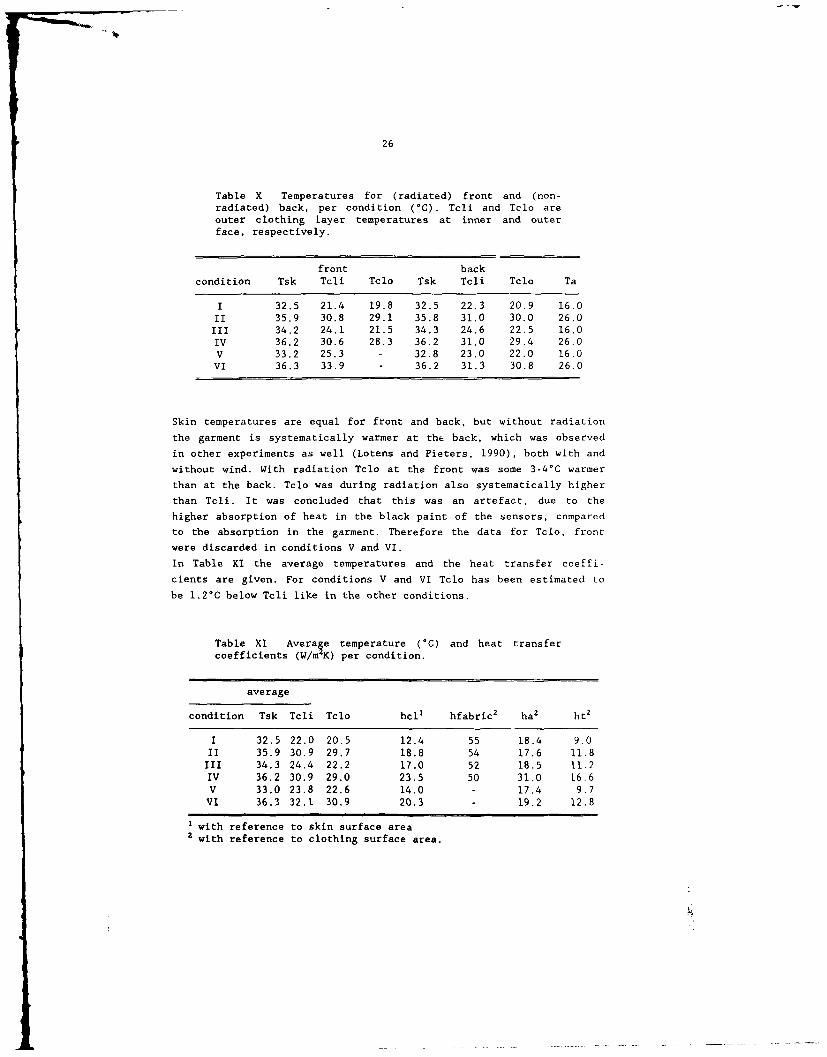
Table X Temperatures for (radiated) front and (non-radiated) back, per condition (°C). Tcli and Tclo areouter clothing layer temperatures at inner and outerface, respectively.
front backcondition Tsk Tcli Tclo Tsk Tcli Tclo Ta
I 32.5 21.4 19.8 32.5 22.3 20.9 16.0II 35.9 30.8 29.1 35.8 31.0 30.0 26.0III 34.2 24.1 21.5 34.3 24.6 22.5 16.0IV 36.2 30.6 28.3 36.2 31.0 29.4 26.0V 33.2 25.3 - 32.8 23.0 22.0 16.0VI 36.3 33.9 - 36.2 31.3 30.8 26.0
Skin temperatures are equal for front and back, but without radiation
the garment is systematically warmer at the back, which was observed
in other experiments as well (Lotens and Pieters, 1990), both with and
without wind. With radiation Tclo at the front was some 3-40C warmer
than at the back. Tclo was during radiation also systematically higher
than Tcli. It was concluded that this was an artefact, due to the
higher absorption of heat in the black paint of the sensors, compared
to the absorption in the garment. Therefore the data for Tclo, front
were discarded in conditions V and VI.
In Table XI the average temperatures and the heat transfer coeffi-
cients are given. For conditions V and VI Tclo has been estimated to
be 1.2°C below Tcli like in the other conditions.
Table XI Avera e temperature (°C) and heat transfercoefficients (W/m§K) per condition.
average
condition Tsk Tcli Tclo hcl' hfabric2 ha2 hr2
I 32.5 22.0 20.5 12.4 55 18.4 9.0II 35.9 30.9 29.7 18.8 54 17.6 11.8III 34.3 24.4 22.2 17.0 52 18.5 11.2IV 36.2 30.9 29.0 23.5 50 31.0 16.6V 33.0 23.8 22.6 14.0 - 17.4 9.7VI 36.3 32.1 30.9 20.3 19.2 12.8
with reference to skin surface area2 with reference to clothing surface area.
p27
In the four conditions in which the temperature gradient over the
impermeable garment could be determined with acceptable accuracy
hfabric was quite similar, with an average value of 53 W/m2K, as in
experiment I for the identical garment.
hcl varies between the conditions. Linear regression shows that hcl is
significantly correlated with skin temperature, but not with sweat
rate or accumulated sweat in the clothing. It is thus not likely that
sweat soaking of the clothing is responsible for the variance in hcl.
Comparing conditions V and VI with I and II, respectively, the effect
of radiation on hcl appears to be small.
The values of ha seem credible in view of the expected value of 17
W/m2K, with the exception of the high value for condition IV. This is
probably caused by the small temperature gradient between Tclo and Ta,
with associated inaccuracy.
3.5 Comparison with model calculations
By means of the computer model ConRad VI.1 the total of 11 experimen-
tal conditions of the three experiments have been simulated. The model
requires a number of inputs, which include environmental, skin and
clothing parameters.
She actual skin temperatures and environmental conditions have been
used, The humidity of the skin was supposed to be between 90 and 100%,
depending on the sweat production. For the clothing the experimentally
found values for hfabric, dfabric, reflection coefficient P, and
surface area factor have been used. An estimation had to be made of
the heat transfer coefficient of the underclothing hucl (underwear +fatigues), the width of the air gap, and the ventilation.
The latter is very low, due to the closed apertures and the air imper-
meable garments, and was set to the value of 5 i/m2mln found by
Havenith et al (1990) for an impermeable coverall.
For hucl for all ensembles and conditions the value of 22 W/m2K was
used and for the trapped air 5 mm.
Table XII summarizes the main parameters, while Table XIII lists the
main output, together with experimental data, as far as available.
28
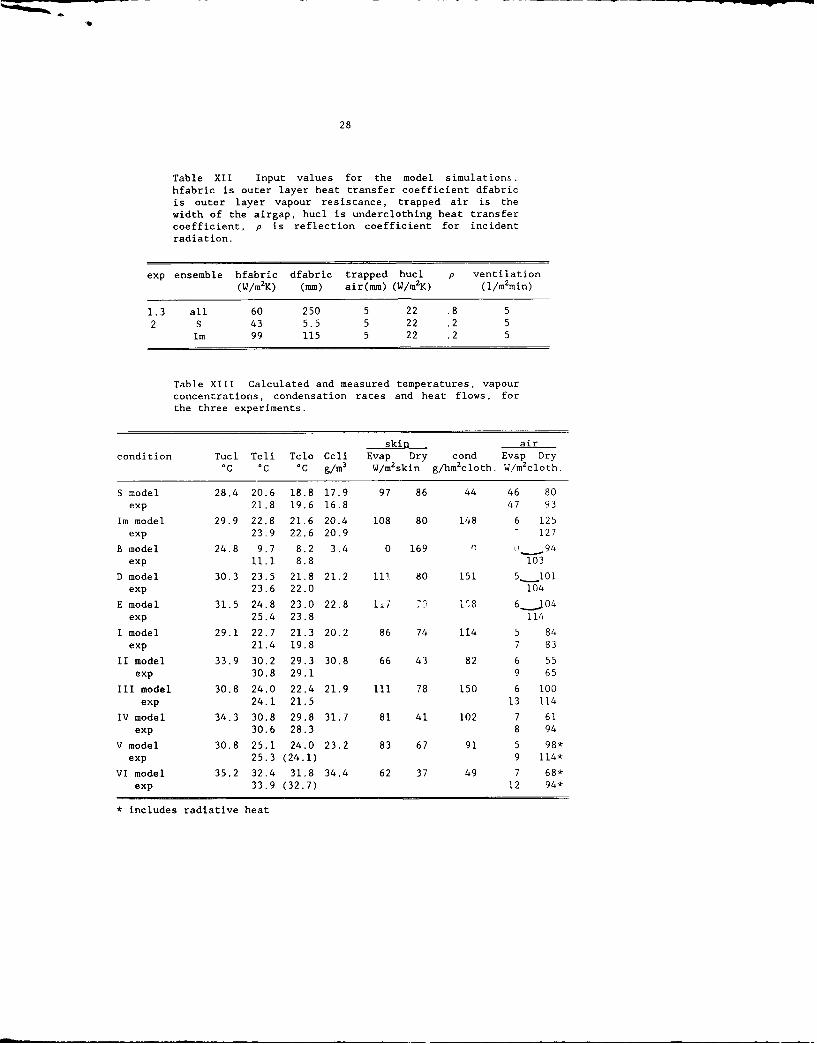
Table XII Input values for the model simulations.hfabric is outer layer heat transfer coefficient dfabricis outer layer vapour resistance, trapped air is thewidth of the airgap, hucl is underclothing heat transfercoefficient, p is reflection coefficient for incidentradiation.
exp ensemble hfabric dfabric trapped hucl p ventilation(W/m
2K) (mm) air(mm) (W/m
2K) (i/m
2min)
1.3 all 60 250 5 22 .8 52 S 43 5.5 5 22 .2 5
Im 99 115 5 22 .2 5
Table XIII Calculated and measured temperatures, vapourconcentrations, condensation rates and heat flows, forthe three experiments.
skin aircondition Tucl Tcli Tclo Ccli Evap Dry cond Evap Dry
°C °C °C g/m3
W/m2skin g/hm
2cloth. W/m
2cloth.
S model 28.4 20.6 18.8 17.9 97 86 44 46 80exp 21.8 19.6 16.8 47 93
Im model 29.9 22.8 21.6 20.4 108 80 148 6 125exp 23.9 22.6 20.9 - 127
B model 24.8 9.7 8.2 3.4 0 169 0 0 94exp 11.1 8.8 103
D model 30.3 23.5 21.8 21.2 i1 80 151 5_101exp 23.6 22.0 104
E model 31.5 24.8 23.0 22.8 i17 72 153 6 _l04exp 25.4 23.8 114
I model 29.1 22.7 21.3 20.2 86 74 114 5 84exp 21.4 19.8 7 83
II model 33.9 30.2 29.3 30.8 66 43 82 6 55exp 30.8 29.1 9 65
III model 30.8 24.0 22.4 21.9 11 78 150 6 100exp 24.1 21.5 13 114
IV model 34.3 30.8 29.8 31.7 81 41 102 7 61exp 30.6 28.3 8 94
V model 30.8 25.1 24.0 23.2 83 67 91 5 98*exp 25.3 (24.1) 9 114*
VI model 35.2 32.4 31.8 34.4 62 37 49 7 68*exp 33.9 (32.7) 12 94*
* includes radiative heat
29
The first four data columns deal with temperature and humidity, the
last five with heat flows and rate of condensation. It can be observed
that underneath the outer garment Evap is usually larger than Dry
(with exception of condition B of course), whereas at the outside of
the garment Dry exceeds Evap by far. This is associated with a rate of
condensation that runs up to 540 g/h for condition E. It should be
noted that the heat flows from clothing to air do not add up to the
same value as at the skin since the clothing surface area is larger
than that of the skin. Multiplying by the actual surface area gives
the total heat flow in W and this matches between skin and clothing.
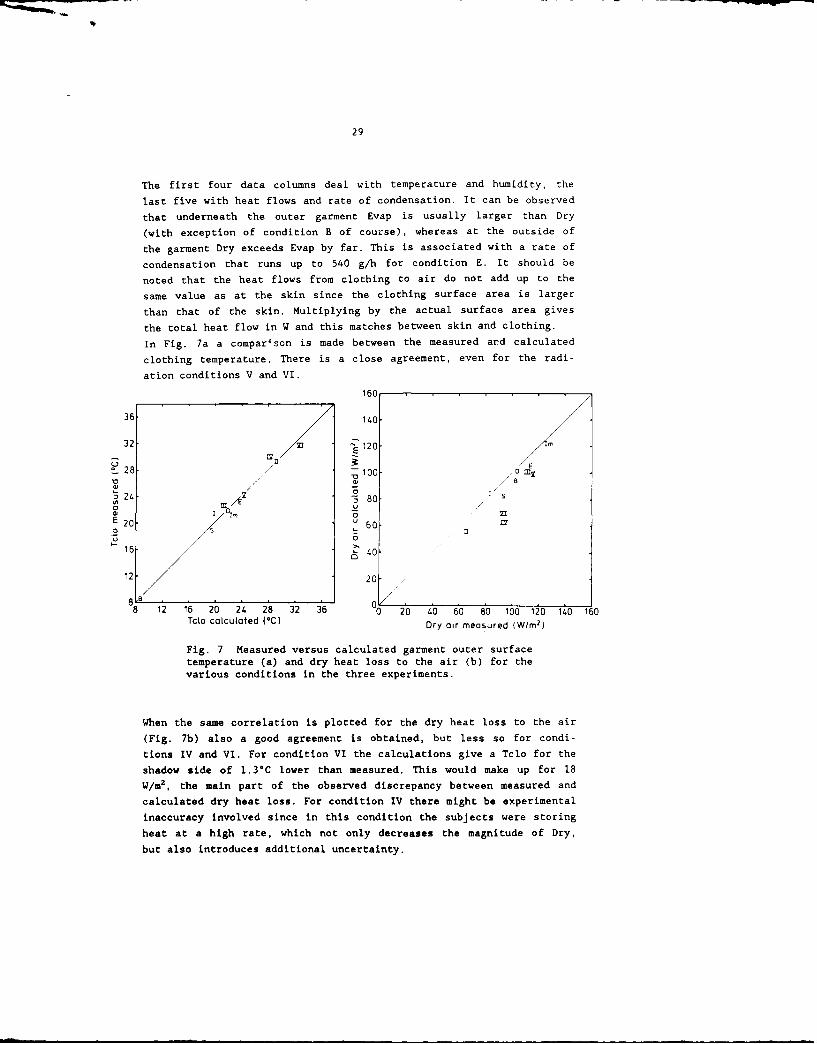
In Fig. 7a a comparison is made between the measured ard calculated
clothing temperature. There is a close agreement, even for the radi-
ation conditions V and VI.
160
36, 140
32 120-
t_28. 10 m
24 '3 380 S
S20 60E S0
U16 40.
12 20
8 0/
8 12 16 20 24 28 32 36 0 20 40 60 80 100 120 140 160
Tclo calculated (OC) Dry air measured (Wlm 2)
Fig. 7 Measured versus calculated garment outer surface
temperature (a) and dry heat loss to the air (b) for the
various conditions in the three experiments.
When the same correlation is plotted for the dry heat loss to the air
(Fig. 7b) also a good agreement is obtained, but less so for condi-
tions IV and VI. For condition VI the calculations give a Tclo for the
shadow side of 1.3"C lower than measured. This would make up for 18
W/m2, the main part of the observed discrepancy between measured and
calculated dry heat loss. For condition IV there might be experimental
inaccuracy involved since in this condition the subjects were storing
heat at a high rate, which not only decreases the magnitude of Dry,
but also introduces additional uncertainty.
30
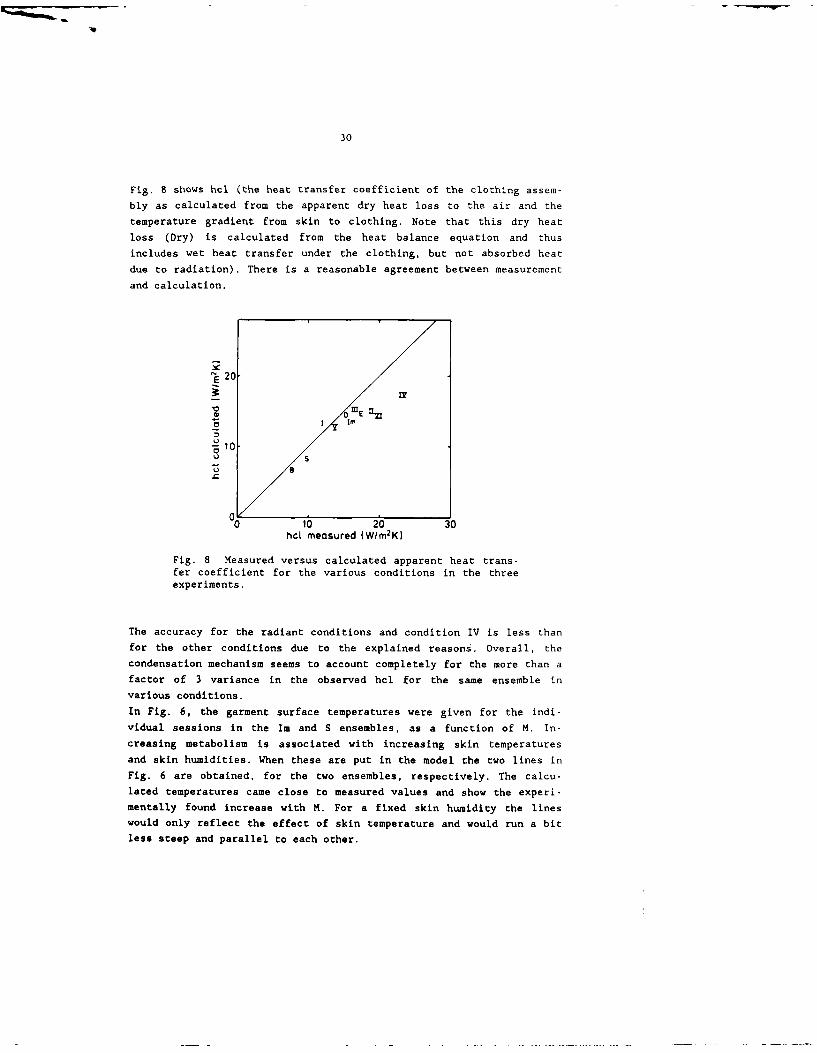
Fig. 8 shows hcl (the heat transfer coefficient of the clothing assem-
bly as calculated from the apparent dry heat loss to the air and the
temperature gradient from skin to clothing. Note that this dry heat
loss (Dry) is calculated from the heat balance equation and thus
includes wet heat transfer under the clothing, but not absorbed heat
due to radiation). There is a reasonable agreement between measurement
and calculation.
% 20
m~E
Q
S10
U S
10 20 30
hct measured (W/m2K)
Fig. 8 Measured versus calculated apparent heat trans-fer coefficient for the various conditions in the threeexperiments.
The accuracy for the radiant conditions and condition IV is less thanfor the other conditions due to the explained reasons. Overall, the
condensation mechanism seems to account completely for the more than a
factor of 3 variance in the observed hcl for the same ensemble in
various conditions,
In Fig. 6, the garment surface temperatures were given for the indi-
vidual sessions in the Im and S ensembles, as a function of M. In-creasing metabolism is associated with increasing skin temperatures
and skin humidities. When these are put in the model the two lines in
Fig. 6 are obtained, for the two ensembles, respectively. The calcu-
lated temperatures came close to measured values and show the experi-
mentally found increase with M. For a fixed skin humidity the lineswould only reflect the effect of skin temperature and would run a bit
less steep and parallel to each other.
-4
31
4 DISCUSSION
Condensation mechanism
The condensation mechanism accounts for a number of phenomena, not
only in a qualitative, but also in a quantitative way. The coincidence
of rise in relative humidity and temperature at the inside of the
outer garment (Fig. 5) is very suggestive and in particular the ob-
served higher surface temperature of impermeable clothing compared to
semipermeable wear, and the dramatic changes in apparent intrinsic
clothing heat transfer coefficient are satisfactorily explained. As
such no other explanations are required. It could be argued, however,
that the wetness of the underclothing causes some additional conduc-
tion and therefore may contribute to the same phenomena. It is unlike-
ly that the actual cotton underclothing and fatigues, with an absorp-
tion capacity of 30 g water vapour per 100 g of dry fabric before any
free water is created, will show such conduction when the total ab-
sorbed mass is less than 200 g. But already early in the experimental
sessions when little moisture is accumulated, the typical effects show
that should be absent with conduction only. Moreover, it was concluded
in section 3.4 that there was no correlation between hcl and sweat
accumulation. Since the condensation mechanism has to be accepted as
the better explanation in conditions with moderate sweat accumulation,
and since this same mechanism is a sufficient explanation for condi-
tions with profuse sweat, it is concluded that conductance had no
relevant effect in the experiments described here.
Parameter values
The quantitative fit between experiment and theory depends on a number
of parameters in the model. Most parameters are known clothing prop-
erties (surface area, fabric vapour resistance, reflection coefficient
for radiation), environmental conditions (effective wind, air tempera-
ture and humidity, radiation intensity), or skin conditions (skin
temperature).
Other parameters can safely be estimated (ventilation). Uncertainty
concerns the heat transfer coefficient of the underclothing, the width
of the trapped air layer, and the relative humidity at the skin. It
has been assumed that hucl is 22 W/mzK, gap width is 5 mm, and that the
relative humidity at the skin varies from 85 to 100%, depending on the
sweat rate. Sweat rates start at 350 g/h and run up to over 1 1/h.
Worn without an overgarment the underclothing (underwear + fatigues)
would have typically an insulation of .8 clo, equivalent to hcl - 8
W/m2K. Due to motion in free air this would increase to 15 W/m
2K
(Lotens and Havenith, 1989b). It is not unlikely that due to compres-
32
sion by the outer garment and due to enhanced internal convection
under the outer garment this value increases with some 50% to 22
W/m2K. The gap width is a rough estimate. This parameter is not very
critical, however, still the internal convection due to pumping andventilation always evokes a high heat transfer coefficient.
The skin humidity has not been measured, but observations on the
subjects showed that their skin was wet over the entire surface in
most conditions, which is to be expected from the observed moisture
accumulated in the clothing and the sweat rate. Moreover, the calcula-
tions show that in the simulation of experiment 2, with impermeable
and semipermeable clothing the measured values of Tcli, Tclo, and Cclo
are correctly predicted, given the assumption of skin wetness.
It can be concluded that there were few degrees of freedom to make the
model fit to the data. Estimated parameters have been kept at the
chosen value for all garments and conditions.
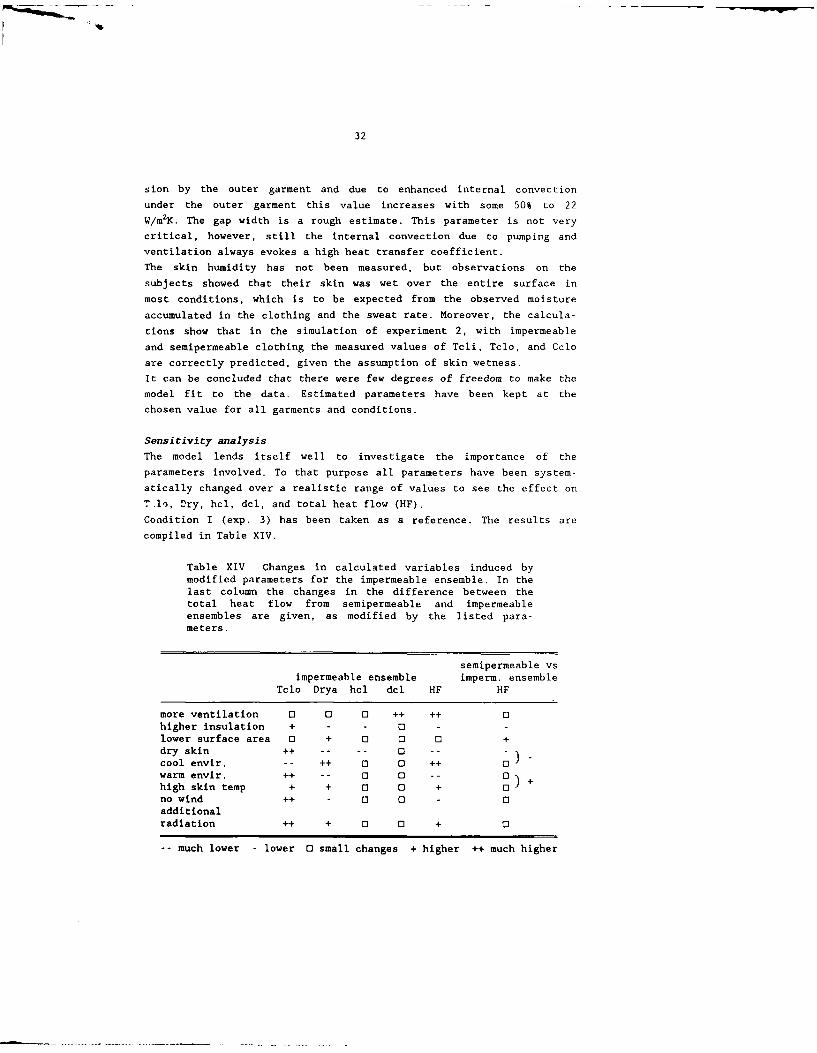
Sensitivity analysis
The model lends itself well to investigate the importance of the
parameters involved. To that purpose all parameters have been system-
atically changed over a realistic range of values to see the effect on
T.l, Dry, hcl, dcl, and total heat flow (HF).
Condition I (exp. 3) has been taken as a reference. The results are
compiled in Table XIV.
Table XIV Changes in calculated variables induced bymodified parameters for the impermeable ensemble. In thelast column the changes in the difference between thetotal heat flow from semipermeable and impermeableensembles are given, as modified by the listed para-meters.
semipermeable vsimpermeable ensemble imperm. ensemble
Tclo Drya hcl dcl HF HF
more ventilation 01 0 0 ++ ++ 0
higher insulation + - - 0 - -
lower surface area 0 + 0 0 0 +dry skin ++ .. .. [] --cool envir. -- ++ 0 0 ++ 0warm envir. ++ -- 0 0 -- 0 - +high skin temp + + 0 0 + 0
no wind ++ - 0 0 - Eadditionalradiation ++ + 0 0 + 0
-- much lower - lower 0 small changes + higher ++ much higher
33
Obviously Ta, radiation, and to a lesser degree Tsk, have a strong
effect on Tclo. Of the other parameters, skin humidity and wind have a
strong effect and insulation (gap width, thickness of the undercloth-
ing, and thickness of the outer fabric) a moderate effect. Ventilation
and clothing surface area are not so relevant.
For Dr skin humidity is as strong a parameter as Ta: dry skin com-
pensates a 10C drop in environmental temperature. Wind and radiation
are less important for Drya than suspected from their effect on Tclo,
and comparable to the effect of insulation. Ventilation has virtually
no effect on Drya.
As a result of Tclo and Drya, hcl is most influenced by skin humidity.
Insulation has a smaller effect, and ventilation, clothing surface
area, cold, heat, wind, and Tsk few or none. This analysis confirms
the wide variation in hcl found between conditions B and IV and shows
that the uncertainty in other parameters than skin humidity and radi-
ation plays a minor role. Dcl is strongly affected by ventilation and
hardly by all other parameters. This is clear from the fact that
neither addition of resistance, nor changes in driving force willaffect the high value of dcl. Ventilation, however, is a parallel way
to dissipate vapour and is a strong competition to the vapour transfer
through the clothing material.
Total heat flow (HF) depends on Ta, but certainly as strong on venti-
lation, exclusively via Evapa, and on skin humidity. Insulation,
radiation, surface area, and wind speed have a smaller effect.
The effect of increased permeability of the outer garment has been
investigated in more detail. Permeability has of course a very strong
effect on dcl, but also a strong effect on Drya and hcl, and a con-
siderable effect on Cclo and Tclo.
Total heat loss in the reference condition is considerably improved by
permeability. It increases from 97 to 137 W/m2 when dfabric drops to 2
mm. This effect is modulated by interaction with other parameters.
(Table XIV, last column). The difference of 40 W/m2 becomes large r in
the heat and with higher skin temperature, and progressively larger
with high skin temperature in the heat. In the cold it decreases, and
also with dry skin or higher insulation of the underclothing.
There is hardly an interaction between permeability and ventilation,
wind speed or radiation. The effect of permeability is enhanced by
tight fit, but this is mainly due to the fact that heat loss is ex-
pressed with reference to clothing surface area. The actual difference
in heat loss over the body (in W) is just slightly increased by
tight fit.
34
Radiation
In experiment 3 the physiological strain in condition V was completely
similar to that in I, and VI to in V. The difference in conditions is
the external radiation and it is an at first sight unbelievable fact
that 500 W/m2
of external radiation has no effect at all on the heat
strain.
Much is explained by the reflection coefficient of the rubber coated
garment, that was close to unity in the 900 nm region, despite the
dark green colour in the visual range. The garment thus absorbs only
20% of the energy in the spectrum of the source.
The heat that is nevertheless absorbed increases the surface tempera-
ture with some 2.5 °C, decreasing the heat loss at the radiated side.
However, it is hypothesized that the consequently higher concentrated
vapour is transferred by internal convection to the non-radiated side,
causing there increased condensation and an increased surface tempera-
ture. Indeed this temperature is I°C higher in radiation conditions,
and thus enables the dissipation of some extra heat. The model shows
that even without this mechanism the heat flows leaving the skin are
only marginally lower in radiation conditions (10 W/m2) and thus
justify the lack of difference in heat strain.
Discomfort
Table VII showed that there was no marked difference in heat strain
caused by semipermeable vs impermeable ensembles. The only difference
was that the impermeable ensemble collected more sweat. This was not
apparent in the humidity sensation ("wet is wet"), but the wetter
garment gave a slightly warmer sensation. The model predicts virtually
equal total heat flow leaving the skin for the two ensembles. Appar-
ently the condensation mechanism was able to compensate fully for the
lack of latent heat transfer and the wearer became wet in both en-
sembles. Studies by Gilling et al. (1977) and Light et al. (1987) con-
firm that there is no difference in heat strain between permeable and
impermeable garments for subjects who work in the cold, but a signifi-
cant difference in the heat. In Gilling et al's study subjects worked
at 490 W for 60 min and rested for 30 min in OC. They heated up very
similarly but cooled down slightly slower in the impermeable garment.
Moisture accumulation was significantly higher in the impermeable
garments, but subjectively rated as only slightly wetter. Light et
al.'s subjects sat for 90 min in 21 and 30*C air temperature. Skin
temperature was higher in the impermeable garment at 30°C only and
moisture accumulation at both temperatures, but more at 30*C. Comfort
votes were not different at both temperatures.
35
The real advantage of semipermeable wear in the cold is that the
clothing will dry during periods of inactivity. This provides more
comfort in the long run, as has been confirmed by various practical
tests (van de Linde e.a. 1989, Gilling e.a. 1977).
Conparison vith other studies
There are not so many sufficiently documented studies on impermeable
clothing in the literature. Most studies deal with resulting heat
strain in specific conditions, but don't allow a numerical check on
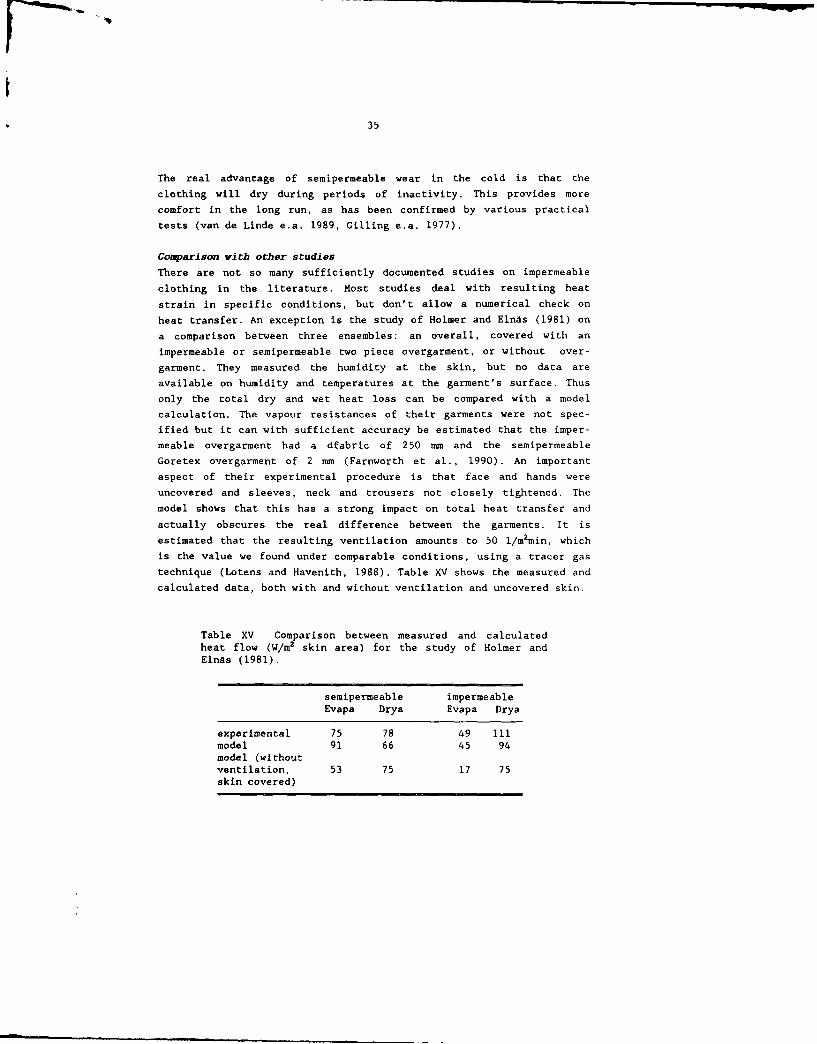
heat transfer. An exception is the study of Holmer and Elnds (1981) on
a comparison between three ensembles: an overall, covered with an
impermeable or semipermeable two piece overgarment, or without over-
garment. They measured the humidity at the skin, but no data are
available on humidity and temperatures at the garment's surface. Thus
only the total dry and wet heat loss can be compared with a model
calculation. The vapour resistances of their garments were not spec-
ified but it can with sufficient accuracy be estimated that the imper-
meable overgarment had a dfabric of 250 mm and the semipermeable
Goretex overgarment of 2 mm (Farnworth et al., 1990). An important
aspect of their experimental procedure is that face and hands were
uncovered and sleeves, neck and trousers not closely tightened. The
model shows that this has a strong impact on total heat transfer and
actually obscures the real difference between the garments. It is
estimated that the resulting ventilation amounts to 50 i/m2min, which
is the value we found under comparable conditions, using a tracer gas
technique (Lotens and Havenith, 1988). Table XV shows the measured and
calculated data, both with and without ventilation and uncovered skin.
Table XV Comparison between measured and calculatedheat flow (W/m
2 skin area) for the study of Holmer and
ElnAs (1981).
semipermeable impermeableEvapa Drys Evapa Drya
experimental 75 78 49 il
model 91 66 45 94model (withoutventilation, 53 75 17 75
skin covered)
36
In contrast to the convention followed in this paper the heat flows to
the air have been recalculated per unit of skin area, to make them
comparable to the measured data. The table shows that ventilation and
bare skin have a dramatic influence on Evapa. The table also shows
that with ventilation there is reasonable concert between measurement
and calculation, but this is obviously troubled with uncertainties. An
indirect proof of ventilation is the only 54% skin humidity that was
measured in the impermeable garment, despite the 175 g of moisture
accumulation in the clothing. Without ventilation this skin humidity
would be unlikely. The model indicates that in no condition there
would be condensation and that thus the heat strain in the impermeable
garment should be the largest, since compensation by the condensation
mechanism for the lack of permeability does not take place. Indeed
Tsk, Tr, and skin humidity are higher in this garment, although only
the latter is clearly significant.
5 CONCLUSIONS
Sweating in clothing with low vapour permeability may play a major
role in heat dissipation. Sweat is evaporated at the skin and conden-
sates at the low permeable layer, thereby carrying heat. This mechan-
ism is able to compensate fully for the lack of vapour (and latent
heat) dissipation to the environment. Thus in cool conditions with wet
skin there is hardly any difference in heat strain between permeable
and impermeable garments. With dryer skin, or in the heat, when con-
densation is prevented, impermeable garments allow less heat trans-
port. A numerical model, calculating heat exchange and temperatures in
the various layers in the clothing ensemble gives an adequate quanti-
tative description.
In actual wear in cool environments the difference in comfort between
permeable and impermeable garments is only manifest during prolonged
wear. During heavy work subjects are rating equal wetness but during
periods of inactivity semipermeable garments allow drying of the
underclothing.
37
REFERENCES
Fanger, P.O. (1970). Thermal Comfort. McGraw-Hill Book Cie, New York.
Farnworth, B. (1986). A numerical model of the combined diffusion of
heat and water-vapour through clothing. Text Res. J. 56 (11),
653-665.
Farnworth, B., Lotens, W.A., and Wittgen, P.P.M.M. (1990). The vari-
ation of the water vapour resistance of microporous and hydrophil-
lic films with relative humidity. Text Res. J. 60 (1), 50-53.
Gilling, D.R., Dickins, T.L., and Samuel, G.D. (1977). Physiological
evaluation of an experimental pormomeric waterproof fabric in
cold/wet conditions. Army Personnel Res. Est. Report 1/77.
Havenith, G. and Lotens, W.A. (1984). What, actually, is the advantage
of semipermeable over impermeable rainwear? Report TNO Institute
for Perception IZF 1984-6.
Havenith, G. and Middendorp, H. van (1986). Prediction of the psychro-
matic range of a clothing system using the relation between
subjective comfort votes and physiological variables. The Annals
of Physiol. Anthropol. 5, 173-174.
Havenith, G., Heus, R. and Lotens, W.A. (1990). Clothing vapour
resistance and the permeability index: changes due to posture,
movements, and wind. Accepted by Ergonomics.
Holmer, I., and Eln~s, S. (1984). Physiological evaluation of the
resistance to evaporative heat transfer by clothing. Ergonomics
24, 63-74.
Kerslake, D.McK. (1972). The stress of hot environments. Cambridge
University Press, Cambridge.
Light, I.M., Gibson, M.G. and Avery, A.1, (1987). Sweat evaporation
and thermal comfort wearing helicopter passenger immersion suits.
Ergonomics 30, 793-803.
Linde, F.J.G. van de, and Lotens, W.A. (1983). Sweat cooling in
impermeable clothing. Proc. Int. Conf. Med. Biephys. Aspects of
Protective Clothing, Lyon, p. 260-267.
Linde, F.J.G. van de (1987). Work in impermeable clothing: criteria
for maximal strain. Report TNO Institute for Perception IZF
1987-24.
Linde, F.J.G. van de, Wammes, L.J. and Heus, R. (1989). Thermal com-
fort, watertightness, and ergonomics of rainwear. Report TNO
Institute for Perception IZF 1989-C7.
Lotens, W.A. and Havenith, G. (1988). Ventilation of rain wear deter-
mined with a trace gas method. In: Mekjavics, Bannister, Morrison
(Eds), Environmental Ergonomics, Taylor and Francis, Philadelphia,
162-175.
38
Lotens, W.A. and Havenith, G. (1989a). Moisture absorption in clothing
and the human heat balance. Report TNO Institute for Perception
IZF 1989-32.
Lotens, W.A., and Havenith, G. (1989b). Calculation of clothing
insulation and vapour resistance. Report TNO Institute for Percep-
tion IZF 1989-49.
Lotens, W.A. and Pieters, A.M.J. (1990). Radiation heat load on
clothed humans. Submitted to Ergonomics.
Weir, J.B.deV. (1949). New methods for calculating metabolic rate with
special reference to protein metabolism. J. Physiol. 109, 1-9.
Whelan, M.E., MacHattie, L.E., Goodings, A.C., and Turl, L.H. (1955).
The diffusion of water vapour through luminae with particular
reference to textile fabrics. Text Res. J. 25 (3) 197-223.
Soesterberg, April 2, 1990
/ /
Drs. W.A. Lotens
39
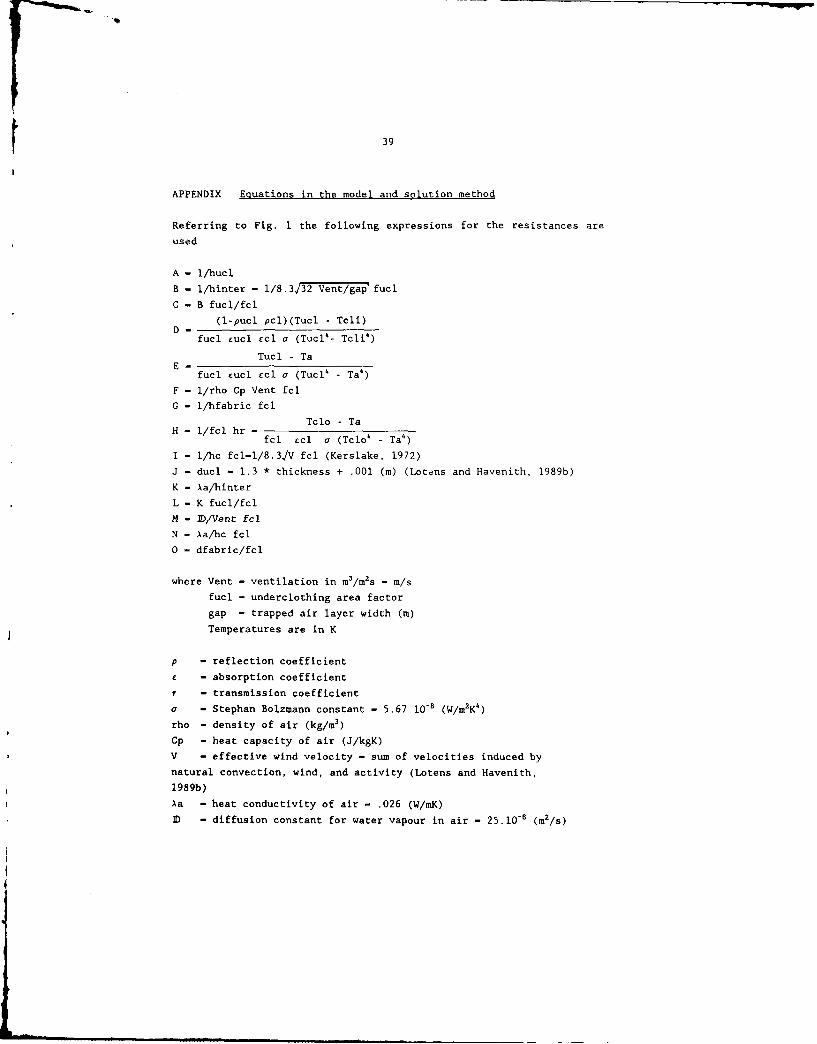
APPENDIX Equations in the model and solution method
Referring to Fig. I the following expressions for the resistances are
used
A - l/hucl
B - 1/hinter - 1/8.3432 Vent/gap fucl
C - B fucl/fcl
(l-pucl pcl)(Tucl - Tcli)D0- fucl Eucl ecl a (Tucl'- Tcli4)
Tucl - Tafucl tucl ecl a (Tucl4 - Ta4)
F - 1/rho Cp Vent fcl
G - l/hfabric fclTclo - TaH - l/fcl hr - ____________fcl ccl a (Tclo - Ta4)
I - 1/hc fcl-i/8.3V fcl (Kerslake, 1972)J - ducl - 1.3 * thickness + .001 (m) (Lotdns and Havenith, 1989b)
K - Aa/hinter
L - K fucl/fcl
M - ID/Vent fclN - Aa/hc fcl
0 - dfabric/fcl
where Vent - ventilation in m3/m2s - m/s
fucl - underclothing area factor
gap - trapped air layer width (m)
Temperatures are in K
p - reflection coefficient
- absorption coefficient
r - transmission coefficient
a - Stephan Bolzmann constant - 5.67 10-8 (W/m2K4)
rho - density of air (kg/m3)
Cp - heat capacity of air (J/kgK)
V - effective wind velocity - sum of velocities induced by
natural convection, wind, and activity (Lotens and Havenith,
1989b)
Aa - heat conductivity of air - .026 (W/mK)
D - diffusion constant for water vapour in air - 25.10 "6 (m2/s)

40
Again referring to Fig. 1, the equations to be solved follow from the
law of conservation of energy at star prints, and the fact that the
gradient over a closed loop must equal zero thus follows that for the
heat network:
hfA - hfB - hfD - hfE - 0 (1)
hfB - hfF - hfC - 0 (2)
hfC + hfD + hfcondensation - hfG - 0(3)
hfG + hfradiation - hfH - hfl - 0 (4)
B hfB + C hfC - D hfD - 0 (5)
C hfC + G hfG + H hfH- F hfF - 0 (6)
B hfB + F hfF - E hfE - 0 (7)
A hfA + E hfE - Tsk + Ta - 0 (8)
and for the vapour network:
vfK -vfM - vfL - 0 (9)
vfL - vfcondensation - vfO - 0 (10)
vfS - vfK - 0 (11)
vfO - vfN - 0 (12)
L vfL + 0 vfO + N vfN - M vfM - 0 (13)
J vfJ + K vfK + M vfM - Csk + Ca - 0(14)
where hf - heat flow and vf - vapour flow.
Both sets of equations can separately be solved, but one unknown
variable remains: the rate of condensation. Both solutions should
accommodate either the conditions that the rate of condensation is
zero, so that the solutions are independent or that the rate of con-
densation is such that Ccli - Cmax(Tcli), where Cmax is the vapour
saturation function.
This procedure is carried out by the program ConRad Vl.l, providing
accurate solutions in an iterative way. The sets of equations are
solved by matrix manipulation. First the heat and vapour flows are
solved and then the temperatures and vapour concentrations are calcu-
lated using
T - T' + R'.hf (°C)
d' .vf
C - C' + -- (g/m 3 )ID
where R' and d' are the heat and vapour resistances between T and T',
and between C and C', respectively.
REPORT DOCUMENTATION PAGE
1. DEFENCE REPORT NUMBER (MOD-NL) 2. RECIPIENT'S ACCESSION NUMBER 3. PERFORMING ORGANIZATION REPORTNUMBER
TO 90-0033 IZF 1990 B-5
4. PROJECT/TASK/WORK UNIT NO. 5. CONTRACT NUMBER 6. REPORT DATE
736.1 B87-63 April 2, 1990
7. NUMBER OF PAGES 8. NUMBER OF REFERENCES 9. TYPE OF REPORT AND DATESCOVERED
40 19 Final
10. TITLE AND SUBTITLE
The effect of condensation in clothing on heat transfer
11. AUTHOR(S)
W.A. Lotens, F.J.G. van de Linde and G. Havenith
12. PERFORMING ORGANIZATION NAME(S) AND ADDRESS(ES)
TNO Institute for PerceptionKampweg 53769 DE SOESTERBERG
13. SPONSORING/MONITORING AGENCY NAME(S) AND ADDRESS(ES)
TNO Division of National Defence ResearchKoningin MariaLaan 212595 GA DEN HAAG
14. SUPPLEMENTARY NOTES
15. ABSTRACT (MAXIMUM 200 WORDS, 1044 BYTE)
A condensation theory is presented, that enables the calculation of the rate of vapour transfer with itsassociated effects on temperature and total heat transfer, inside a clothing ensemble consisting nfunderclothing, enclosed air, and outer garment. The model is experimentally tested by three experiments: 1impermeable garments worn by subjects with and without plastic foil around the skin, blocking sweat evapor-ation underneath the clothing; 2 comparison of heat loss in impermeable and sefnipermeable garments and theassociated discomfort and strain; 3. subjects working in inpermeable garments in coot and warm environmentsat two work rates, with and without external radiation, until tolerance.The measured heat 1xchange and temperatures are calculated with satisfying accuracy by the model ,T0ean errorz 11, sd - 10 Wm for heat flows and .3 and .9 "C for temperatures, respectively). A numerical analysisshows that for total heat toss the major determinants are vapour permeability of the outer garment, skinvapour concentration, air temperature and clothing insulation. In the cold the condensation mechanism maycompletely compensate for the tack of permeability of the clothing as far as heat dissipation is concerned,but in the heat impermeable clothing is more stressful.
16. DESCRIPTOAS IDENTIFIERS
Clothing Physiology CondensationEffects of Heat Impermeable ClothingEffects of HumidityMathematical Models
17a. SECURITY CLASSIFICATION 17b. SECURITY CLASSIFICATION 17c. SECURITY CLASSIFICATION(OF REPORT) (OF PAGE) (Of ABSTRACT)
18. DISTRIOUTION/AVAILABILITY STATEMENT 17d. SECURITY CLASSIFICATION(OF TITLES)
Unlimited availablity

VERZENDLI.JST
1. Hoofddirecteur van de Hoofdgroep Defensieonderzoek TNO
2. Directie Wetenschappelijk Onderzoek en Ontwikkeling Defensie
Hoofd Wetenschappelijk Onderzoek KL3.
Ply. Hoofd Wetenschappelijk Onderzoek KL
4,5. 1{oofd Wetenschappelijk Onderzoek KLu
ticofd Wetenschappelijk Onderzoek KM6.
Plv. Hoofd Wteenschappelijk Qnderzoek KM
7. Wnd. Hoofd Afd. Militair Geneeskundig Beleid
8. Inspecteur Geneeskundige Dienst KLBrig.Cen. -arts B.C. Mels
9. Insv'ecteur Geneeskundige Dienst KLuCdre J.Th. Versteeg
10. Inspecteur Geneeskundige Dienst ZeemachtCdr-arts A.J. Noordhoek
11, 12, 13. Hoofd van het Wetensch. en Techn. Doc. - en Inform.Centrui voor de Krijgsmacht
LEDEN WAARNEMINGS CONTACT COMMISSIE
14. Maj.1r. W.C.M. Bouwnians15. LTZAR1 F.D.J.R. Feunekes16. Dr. N. Guns17. Drs. C.W. Lamberts18. Ir. F.H. van Overbeek19. Drs. W. Pelt20. Maj. dierenarts H.W. Poen21. Drs. F.H.J.I. Rameckers22. LTZSD20C KV Drs. M.B.A.M. Scheffers23. Prof.Ir. C. van Schooneveld24. Llol.Drs. H.W. de Swart25. Ir. M. Vertregt26. Kol. vliegerarts B. Voorsluijs
Extra exemplaren van dit rapport kunnen worden aan-gevraagd door tussenkonist van de HWOs of de DOO.