1 Currency Crises: Theory and Evidence Lecture 3 IME LIUC 2010.
African Social Science Review
Volume 10 | Number 1 Article 5
May 2019
The Effect of Common Currency on EconomicGrowth: Evidence from CEMAC Custom UnionDivine N. KangamiUniversity of the Witwatersrand, Johannesburg, [email protected]
Oluyele A. AkinkugbeUniversity of the Witwatersrand, Johannesburg, [email protected]
Follow this and additional works at: https://digitalscholarship.tsu.edu/assr
This Article is brought to you for free and open access by the Journals at Digital Scholarship @ Texas Southern University. It has been accepted forinclusion in African Social Science Review by an authorized editor of Digital Scholarship @ Texas Southern University. For more information, pleasecontact [email protected].
Recommended CitationKangami, Divine N. and Akinkugbe, Oluyele A. (2019) "The Effect of Common Currency on Economic Growth: Evidence fromCEMAC Custom Union," African Social Science Review: Vol. 10 : No. 1 , Article 5.Available at: https://digitalscholarship.tsu.edu/assr/vol10/iss1/5

The Effect of Common Currency on Economic Growth: Evidence fromCEMAC Custom Union
Cover Page FootnoteConsiderable thanks goes to the National Research Foundation (NRF), South Africa for granting us thefinancial support to pursue and complete this article. Also, we will like to extend our sincere appreciation toProf George Klay Kieh, Jr, President of the African Studies and Research Forum, Prof Abdul Karim Bangura ofthe American University Center for Global Peace and Prof Ishmael I. Munene of Northern Arizona Universityfor their encouragement and guidance.
This article is available in African Social Science Review: https://digitalscholarship.tsu.edu/assr/vol10/iss1/5

African Social Science Review Volume 10, Number 1, Spring 2019
85
The Effect of Common Currency on Economic Growth: Evidence from CEMAC Custom Union
Divine N. Kangami Oluyele A. Aninkugbe
University of Witwatersrand
Abstract: Several attempts to establish common currency by
regional trade blocs have been carried out in Africa and the
continent is home to two existing common currency unions using the
CFA francs, respectively. This paper focuses on the effects of
common currency on economic growth in the CEMAC custom
union. The study applies the sharp regression discontinuity design
model to analyse the causal effects of the common currency on
economic growth. The causal effects are identified by exploiting the
discontinuity of the individual currency in favour of a regional one.
This is a done by evaluating the value of GDP per capita as a proxy
for economic growth before and after the implementation of the
common currency in 1994. Our findings show that the monetary
policy change instituted in the CEMAC region in 1994 has not
played any significant role in promoting economic growth in the
CEMAC region. Instead, the CEMAC customs union has performed
on average poorly compare to its predecessor UDEAC and its
regional counterpart such as UEMOA that uses a similar currency
with similar exchange rate.
Keywords: CEMAC, common currency, economic growth, franc
CFA, regression discontinuity design
Regional trade agreements (RTAs) have been used to enhance geo-
socioeconomic integration between countries whilst still maintaining
national borders. This is based on the idea that such agreements
address the constraints of low and limited production created by
small and fragmented markets (Andriamananjara, 2003). Therefore,
it is widely argued that RTAs are valuable tools for countries in the
concerned regional bloc to carry out joint projects.
There are two main RTAs in Africa that have adopted a
common currency. These are the Central African Monetary
1
Kangami and Akinkugbe: Effect of Common Currency on CEMAC Custom Union’s Economic Growth
Published by Digital Scholarship @ Texas Southern University, 2019
African Social Science Review Volume 10, Number 1, Spring 2019
86
Community, also known as “Communauté Économique des États
d’Afrique Centrale” (CEMAC) and the West African Economic and
Monetary Union commonly also known as “Union Économique et
Monétaire Ouest Africaine” (UEMOA). Studies that analysed the
effects of common currency on these RTAs showed that UEMOA
achieved a higher growth rate than the CEMAC region. Given the
advantages of the adoption of a common currency, it is, however,
still unclear if the common currency has given the CEMAC region
any competitive edge over other RTAs in Africa. Analysis by
Bénassy-Quér and Coupet (2005) found that neither CEMAC nor
UEMOA fulfils the criteria of an optimum currency area; rather the
union of both into CFA franc common currency unions is
considered more of a colonial influence or characteristic, rather than
an economic one.
The CEMAC custom union is no stranger to RTA, and
countries in that region have reaped some discreet benefits through
collaborative trade agreements. Economic integration was initiated
in the CEMAC region before independence under the former
administrative grouping or federation entitled French Equatorial
Africa (FEA).
This paper assesses links between common currency adoption
and economic growth in the CEMAC region. The question remains
to what extent the growth experiences in CEMAC, pre-and-post
adoption of the common currency, could be attributed to the franc
CFA. This is more of a counterfactual analysis that examines pattern
of economic growth before and after the formation of the common
currency union.
It is important to highlight gaps in earlier empirical literature
on common currency and economic growth that the current study
tries to fill. Most of the earlier studies on the CEMAC trade bloc
are devoted to examining individual country’s trade performances
and national output (Carrere, 2013; Zhao & Kim, 2009). Given
different growth rates, it is also important to address the impact of
the common currency (franc CFA) on growth rates in the CEMAC
trade bloc. Evaluating the efficiency and effectiveness of initiating a
common currency and the causal inferences between a common
currency and economic growth is yet to be carried out. This study
aims to fill these gaps. The method used in this study considers both
the pre-treatment and post-treatment effects at the same time. Also,
it is a quasi-experiment that normally produces an unbiased estimate
in the treatment, when executed correctly (Rubin, 1977).
The remainder of this paper is organised as follows. We next
present the literature review, followed by the theoretical and
2
African Social Science Review, Vol. 10, No. 1 [2019], Art. 5
https://digitalscholarship.tsu.edu/assr/vol10/iss1/5

African Social Science Review Volume 10, Number 1, Spring 2019
87
methodological framework. We then present our data sources and
the main empirical results. Finally, we conclude with policy
recommendations.
Literature Review
Literature on international trade supports the view that trade
liberalization leads to economic growth. However, the impact on
growth is still debatable, as economists have identified different
outcomes. Previous studies in the CEMAC region have paid more
attention to trade openness, and very little work has been done on
the relationship between a common currency and economic growth.
Past studies focused mainly on the EU. For example Sokolowska
(2008), Guellec & von Hagen (2000), and Conti (2014) investigate
the effects of the Euro on economic growth for countries in the
European Union. These authors observe that the Euro has had a
positive influence on EU economic growth.
Fetahi-Vehapi, Sadiku, and Petkovski (2015) estimate the
effects of trade openness on economic growth in southeast European
countries using the system of Generalised Methods of Moment
(GMM). They note that countries that reduce barriers to trade enjoy
higher economic growth. When convergence is measured in line
with correlation of innovation in the gross domestic product,
Fielding and Shields (2005) find no evidence in business cycle
convergence. The authors conclude that a common currency can
lead to higher economic integration among member states than
countries that do not share a common currency or even peg their
currency to another major one, such as the US dollar.
Nawaz, Aziz, and Zaman (2014) estimate the impact of trade
factors on economic growth using the seemingly unrelated
regression (SUR) for the South Asian Association for Regional
Cooperation countries. They observe a strong correlation between
economic growth and net exports, terms of trade, and foreign direct
investment. While Felbermayr (2005) applies Blundell and Bond’s
system GMM estimator to estimate the relationship between the
levels of a country’s openness and per capita income, he affirms the
existence of a strong relationship between trade and per capita
income. Applying the SUR model and using data from 1960 to
1997, Kónya (2006) shows that causality between GDP and exports
and between exports and economic growth differs from one
Organisation for Economic Co-operation and Development (OECD)
country to another. There is a consensus that higher economic
integration will likely increase regional growth, though the benefit
to individual member states is still uncertain.
3
Kangami and Akinkugbe: Effect of Common Currency on CEMAC Custom Union’s Economic Growth
Published by Digital Scholarship @ Texas Southern University, 2019

African Social Science Review Volume 10, Number 1, Spring 2019
88
The growth rate is also affected by the rate of inflation
(Boschi & Girardi, 2007, Boujelbene & Boujelbene, 2010, Jalil et
al., 2014). Previous studies have analysed different aspects of
economic growth, including monetary policy, inflation, financial
institutions, and the state of financial development. For instance, He
(2011) studied the relationship between international trade,
economic growth, and inflation. His result shows a positive
relationship between international trade, GDP growth, and inflation.
For countries to benefit from steady economic growth, low
inflation, and increased intraregional trade flow, there has to be
some level of macroeconomic convergence among member states. If
the macroeconomic convergence is weak, then the benefits of
regional integration will not be felt completely.
Theoretical and Methodological Framework
Previous models of economic growth did not clearly suggest a
systematic relationship between economic integration and economic
growth. Consequently, it is possible to find a situation where
increasing economic integration can have both positive and negative
effects on growth rates.
The economic rationale of a common currency in relation to
its impact on economic growth and trade has been the subject of
numerous theories and studies, with no real consensus reached. The
debate started in the early 1960s when Mundell (1961) proposed the
optimum currency areas theory. This theory laid the foundation to
explain the effects of a common currency within a geographical
area.
Assuming that by means of an appropriate regional
macroeconomic policy, a regional central bank is established and
member states’ local currencies are replaced with the regional one,
what would the effect of this replacement have on the overall growth
pattern of the region? To answer this question, certain conditions are
put in place. These conditions are necessary to facilitate the
recruitment of members into the monetary union and for the benefits
to be felt. According to De Grauwe (2006), these conditions include
firstly, macroeconomic shock symmetry across the region.
Secondly, the labour markets must be flexible enough to withstand
the shocks, and, thirdly, the level of trade flow between member
states should be high. These conditions are in line with the criteria
put forward by the classical theory of optimum currency areas when
countries in a particular region want to form a monetary union.
These criteria include, but are not limited to, a high level of
openness, mobility of the labor force, symmetry of the level of
4
African Social Science Review, Vol. 10, No. 1 [2019], Art. 5
https://digitalscholarship.tsu.edu/assr/vol10/iss1/5
African Social Science Review Volume 10, Number 1, Spring 2019
89
macroeconomic shocks among member states, and the possibility of
fiscal transfers convergence (Criste, 2013).
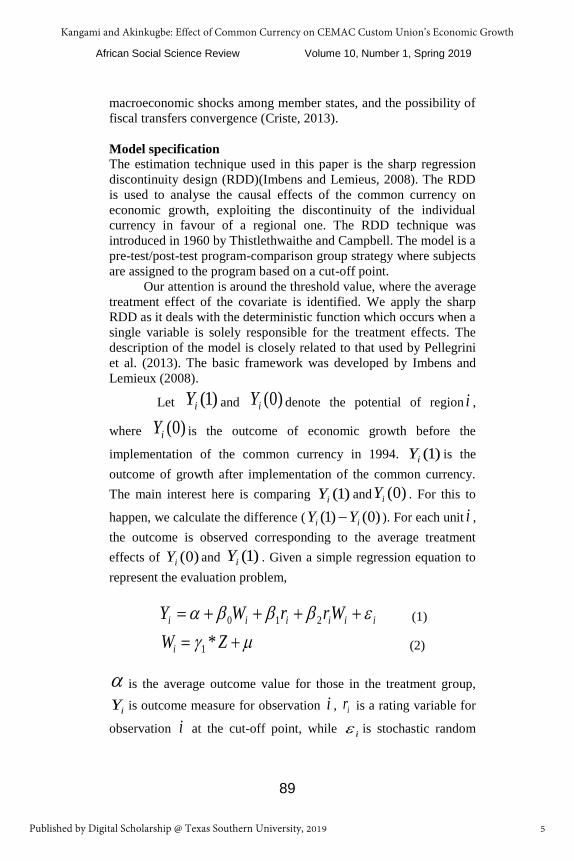
Model specification
The estimation technique used in this paper is the sharp regression
discontinuity design (RDD)(Imbens and Lemieus, 2008). The RDD
is used to analyse the causal effects of the common currency on
economic growth, exploiting the discontinuity of the individual
currency in favour of a regional one. The RDD technique was
introduced in 1960 by Thistlethwaithe and Campbell. The model is a
pre-test/post-test program-comparison group strategy where subjects
are assigned to the program based on a cut-off point.
Our attention is around the threshold value, where the average
treatment effect of the covariate is identified. We apply the sharp
RDD as it deals with the deterministic function which occurs when a
single variable is solely responsible for the treatment effects. The
description of the model is closely related to that used by Pellegrini
et al. (2013). The basic framework was developed by Imbens and
Lemieux (2008).
Let )1(iY and )0(iY denote the potential of region i ,
where )0(iY is the outcome of economic growth before the
implementation of the common currency in 1994. )1(iY is the
outcome of growth after implementation of the common currency.
The main interest here is comparing )1(iY and )0(iY . For this to
happen, we calculate the difference ( )0()1( ii YY ). For each unit i ,
the outcome is observed corresponding to the average treatment
effects of )0(iY and )1(iY . Given a simple regression equation to
represent the evaluation problem,
iiiiii WrrWY 210 (1)
ZWi *1 (2)
is the average outcome value for those in the treatment group,
iY is outcome measure for observation i , ir is a rating variable for
observation i at the cut-off point, while i is stochastic random
5
Kangami and Akinkugbe: Effect of Common Currency on CEMAC Custom Union’s Economic Growth
Published by Digital Scholarship @ Texas Southern University, 2019

African Social Science Review Volume 10, Number 1, Spring 2019
90
term, which is independent and identically distributed. 0 is the
marginal impact coefficient at the cut-off point.
Let iW denote the treatment variable, with 1iW if
member state adopted the common currency in 1994, otherwise
0iW . The outcome, which is the per capita GDP growth for the
CEMAC region, can be written as:
)1(
)0()1()0()1(1
i
i
iiiY
YWYWY if
1
0
i
i
W
W (3)
As mentioned earlier, the sharp discontinuity design with
assignment iW is a deterministic function of one of the covariates
iX , which is greater than the cut-off point. That is:
1)( iWTreatmentP if cX i =Z
where c =1994 (the eligibility threshold)
=0 if cX i
Following Lee and Lemieux's (2010) approach, the regression
equation on the left hand can be rewritten given the cut-off point as
follows:
)( cXfY ll , (4)
And that on the right hand side as:
)(( cXfY rr (5)
Using a pool regression technique as a direct way of expressing the
treatment effects of both sides of the threshold from equations (4)
and (5):
,)( cXfDY l (6)
6
African Social Science Review, Vol. 10, No. 1 [2019], Art. 5
https://digitalscholarship.tsu.edu/assr/vol10/iss1/5
African Social Science Review Volume 10, Number 1, Spring 2019
91
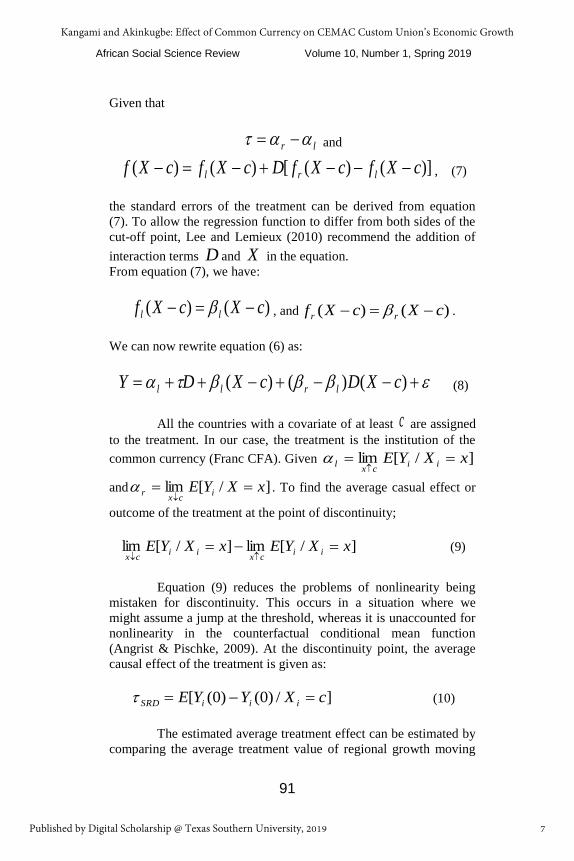
Given that
lr and
)]()([)()( cXfcXfDcXfcXf lrl , (7)
the standard errors of the treatment can be derived from equation
(7). To allow the regression function to differ from both sides of the
cut-off point, Lee and Lemieux (2010) recommend the addition of
interaction terms D and X in the equation.
From equation (7), we have:
)()( cXcXf ll , and )()( cXcXf rr .
We can now rewrite equation (6) as:
)()()( cXDcXDY lrll (8)
All the countries with a covariate of at least c are assigned
to the treatment. In our case, the treatment is the institution of the
common currency (Franc CFA). Given ]/[lim xXYE iicx
l
and ]/[lim xXYE icx
r
. To find the average casual effect or
outcome of the treatment at the point of discontinuity;
]/[lim]/[lim xXYExXYE iicx
iicx
(9)
Equation (9) reduces the problems of nonlinearity being
mistaken for discontinuity. This occurs in a situation where we
might assume a jump at the threshold, whereas it is unaccounted for
nonlinearity in the counterfactual conditional mean function
(Angrist & Pischke, 2009). At the discontinuity point, the average
causal effect of the treatment is given as:
]/)0()0([ cXYYE iiiSRD (10)
The estimated average treatment effect can be estimated by
comparing the average treatment value of regional growth moving
7
Kangami and Akinkugbe: Effect of Common Currency on CEMAC Custom Union’s Economic Growth
Published by Digital Scholarship @ Texas Southern University, 2019

African Social Science Review Volume 10, Number 1, Spring 2019
92
very close in either direction before and after the implementation of
the common currency at cX .
The average effect is therefore given as:
]/[lim]/[lim xXYExXYEcxcx
SRD
(11)
In RDD, graphical analysis is of utmost importance, as it
acts as a way to visualize the identification problem (Imbens &
Lemieux, 2008). When the raw data are presented in the form of a
diagram, the research design becomes more transparent. Figure 1
below shows an example of a linear graph with treatment effect. We
can see clearly the jump at the discontinuity point around the
threshold of 140. On the other hand, Figure 2 shows the case where
there is no discontinuity at the cut-off point.
Figure 1: Linear Graph with Treatment Effects
0
200
400
600
800
Outco
me:
GDP
per
capit
a gr
owth
rate
(Y)
0 50 100 150 200 250Forcing variable (X)
Source: Author’s computation using a scatter plot
Figure 2: Linear Graph with No Treatment Effect
100
200
300
400
500
600
Outco
me
(Y)
0 50 100 150 200 250Forcing variable (X)
Source: Author’s computation using a scatter plot
8
African Social Science Review, Vol. 10, No. 1 [2019], Art. 5
https://digitalscholarship.tsu.edu/assr/vol10/iss1/5

African Social Science Review Volume 10, Number 1, Spring 2019
93
Given the above, the bandwidth can now be constructed to
estimate the regression function around the boundary. This will
enable us to analyse the impact of the treatment effects from the cut-
off point. Once the bandwidth is identified, SDR can then be
estimated using local linear regression approaching c from right and
approaching c from left. SDR is an example of a nonparametric
regression, since we are interested in the regression function at the
single point, called the boundary point. Local linear regression
reduces bias in the estimation and allows the intercept and slope
coefficient to differ from either side of the threshold. It also helps
resolve some of the problems encountered using the polynomial
functions and kernel regression in the RDD. This problem stemmed
from estimating the regression at a particular point and the bias
found in kernel regression of the treatment effect (Lee & Lemieux,
2010). Local linear regression also enables the functional form to be
correctly specified (Jacob et al., 2012).
Data Analysis and Results
Description and Data Sources
The data used for the analyses are a balanced panel of the six
countries (Cameroon, Chad, Central African Republic, Republic of
Congo, Equatorial Guinea and Gabon) that span the 44-year period
from 1970 to 2013. The dataset is derived from a UNCTAD
statistics database. Fewer variables than would ordinarily have been
expected were used in the empirical model because of its
counterfactual nature. The controlled variables used in our growth
and trade analysis are gross domestic product (GDP) and a dummy
variable. The level of GDP per capital is used as a proxy to
determine the level of economic growth. A dummy variable
( ijCEM ) for the common currency is included. It takes the value
of 1 from 1994, when member states adopted the franc CFA, and
zero, otherwise.
In order to isolate the possibility of other variables causing
the change in economic growth, other control variables are added in
the regression. These variables include foreign direct investment
( FDI ). FDI is the net inflow of the transfer of skilled personnel,
marketing skills, financial and intangible assets, such as
technologies, and the net inflow of fixed assets. The data are derived
from the World Bank development indicators. Another variable of
interest is inflation rate ( RELP ). This is the inflation rate of
9
Kangami and Akinkugbe: Effect of Common Currency on CEMAC Custom Union’s Economic Growth
Published by Digital Scholarship @ Texas Southern University, 2019

African Social Science Review Volume 10, Number 1, Spring 2019
94
member states considered in the study. The inflation rate is the
annual change of the cost of a basket of goods and services acquired
by the average consumers measured by the consumer price index
(CPI). The data are derived from the World Bank Development
Indicators Statistics database.
Graphical analysis
To further explore the data, we use the rdplot and cmogram to
construct the sharp RD design. The result of a scatter plot of our
data is presented in Figure 3, where the treated and the non-treated
groups are clearly visible. As mentioned earlier, the treated group is
the average level of per capita growth (cempc) from 1994, and the
non-treated group is the average per capita before 1994. The
evaluation of the treatment effect aims at providing evidence of the
presence of a jump in terms of average CEMAC GDP per capita.
This happens beginning in 1994, with the cut-off line sharply
separating treated and non-treated regions. Relaxing the linearity
assumption and applying the polynomial function of the forcing
variable in the regression gives more weight to points far from the
cut-off points.
Figure 3: CEMAC GDP Growth (1970-2013)
0
500
1000
1500
2000
per c
apita
GDP
70 80 90 100 110Period
Source: From author’s computation using scatter plot
We use local regression as a smoothing method in a kernel
weighed local polynomial to minimize bias in the model. Adding
smooth regression lines, which are based on polynomial fit, makes
the jump more visible (Imbens & Lemieux, 2008). This is shown in
Figure 4.
10
African Social Science Review, Vol. 10, No. 1 [2019], Art. 5
https://digitalscholarship.tsu.edu/assr/vol10/iss1/5

African Social Science Review Volume 10, Number 1, Spring 2019
95
Figure 4: Kernel-weighted Local Polynomial
0
500
1000
1500
2000
per c
apita
GDP
70 80 90 100 110Periods
Source: Author’s computation
Figure 4 clearly shows a situation where, on average, the
imposition of the franc CFA did not positively affect CEMAC
economic growth. There is a fall in the average gross domestic
product per capita around the threshold point.
4.3 Parametric approach
In estimating a parametric approach, the right functional form is of
great importance for the outcome and forcing variable relationships.
To do this, different polynomial fits are introduced in the forcing
variable. Since low-order polynomial and a data point that is close to
the cut-off point produces bias, it is advisable to present both
parametric and non-parametric results. One acts as a complement to
the other (Lee & Lemieux, 2010). In the first instance, all the
observations are used to model the outcome in order to increase
precision of the model. In doing so, the results of the outcome
around the boundary point derive their strengths from observations
far from the cut-off points. The result is presented in Table 1.
Table 1 present the results of all observations from the dataset
for the CEMAC region as a whole and the individual countries that
make up the region. The OLS estimates show the result with
different forms of polynomial. The variable of interest is
CEMdummy, which represents the effect of the common currency
on CEMAC economic growth. The effects of the imposition of a
common currency in the CEMAC region in 1994 are negative, and
statistically significant for the CEMAC region (cempc) as a whole.
For the individual countries, the effect is negative. The effect is
significant at 0.01 for Cameroon (cmrpc) and at 0.10 percent for the
Republic of Congo (cogpc). It is statistically insignificant for
Central African Republic (cafpc), Chad (tcdpc), Equatorial Guinea
(gnqpc), and Gabon (gabpc).
11
Kangami and Akinkugbe: Effect of Common Currency on CEMAC Custom Union’s Economic Growth
Published by Digital Scholarship @ Texas Southern University, 2019

African Social Science Review Volume 10, Number 1, Spring 2019
96
From Table 1, the negative impact is greater for the Republic
of Congo (cogpc) than for Cameroon (cmrpc), while that of
CEMAC (cempc) is less. All observations were used in the
regressions. The findings suggest that all of the policies that were
carried out in the mid-1990s, that is, from the change of name from
UDEAC to CEMAC, devaluation of the CFA franc, and the
institution of the common currency, on average did not provide
favourable conditions for economic growth. The CFA franc has not
created a situation where member states in the CEMAC region can
benefit from accelerated economic growth. These conditions can be
translated to the transmission mechanism to which common
currency contribute to economic growth.
Table 1 Parametric Estimates of CEMAC Economic Growth Using
Different Polynomial Fit
Dropping-off some of the polynomials to adjust first and
second-degree polynomials and also to restrict the windows around
the cut-off point to estimate the treatment effects, the sample
observations dropped from 1970-2013 to 1985-1999. The result is
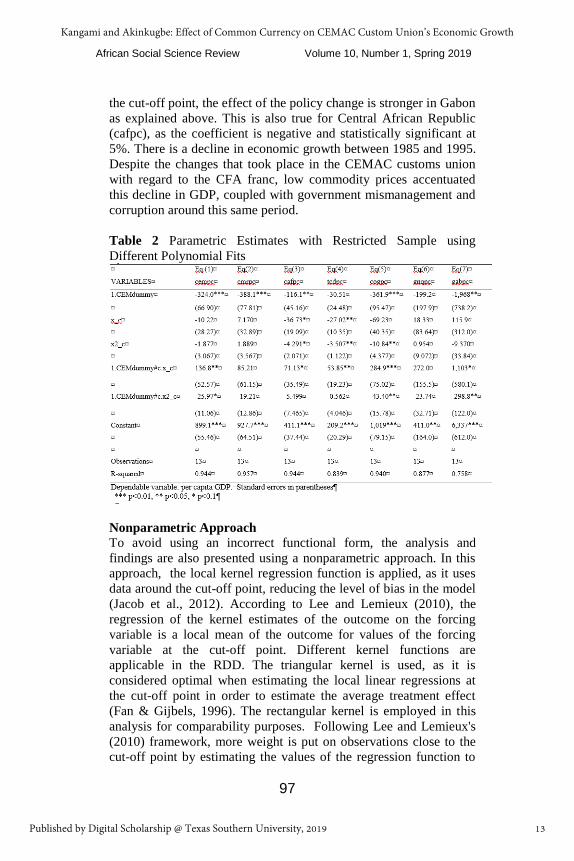
shown in Table 2. The treatment effect is still negative and highly
significant for the CEMAC region, as a whole, and for most of the
individual countries, except for Chad and Equatorial Guinea.
From Table 2, the effect of the CFA franc for Gabon is
negative and highly statistically significant at 5%. This implies that
when the sample observation is dropped and attention is paid around
12
African Social Science Review, Vol. 10, No. 1 [2019], Art. 5
https://digitalscholarship.tsu.edu/assr/vol10/iss1/5
African Social Science Review Volume 10, Number 1, Spring 2019
97
the cut-off point, the effect of the policy change is stronger in Gabon
as explained above. This is also true for Central African Republic
(cafpc), as the coefficient is negative and statistically significant at
5%. There is a decline in economic growth between 1985 and 1995.
Despite the changes that took place in the CEMAC customs union
with regard to the CFA franc, low commodity prices accentuated
this decline in GDP, coupled with government mismanagement and
corruption around this same period.
Table 2 Parametric Estimates with Restricted Sample using
Different Polynomial Fits
Nonparametric Approach
To avoid using an incorrect functional form, the analysis and
findings are also presented using a nonparametric approach. In this
approach, the local kernel regression function is applied, as it uses
data around the cut-off point, reducing the level of bias in the model
(Jacob et al., 2012). According to Lee and Lemieux (2010), the
regression of the kernel estimates of the outcome on the forcing
variable is a local mean of the outcome for values of the forcing
variable at the cut-off point. Different kernel functions are
applicable in the RDD. The triangular kernel is used, as it is
considered optimal when estimating the local linear regressions at
the cut-off point in order to estimate the average treatment effect
(Fan & Gijbels, 1996). The rectangular kernel is employed in this
analysis for comparability purposes. Following Lee and Lemieux's
(2010) framework, more weight is put on observations close to the
cut-off point by estimating the values of the regression function to
13
Kangami and Akinkugbe: Effect of Common Currency on CEMAC Custom Union’s Economic Growth
Published by Digital Scholarship @ Texas Southern University, 2019
African Social Science Review Volume 10, Number 1, Spring 2019
98
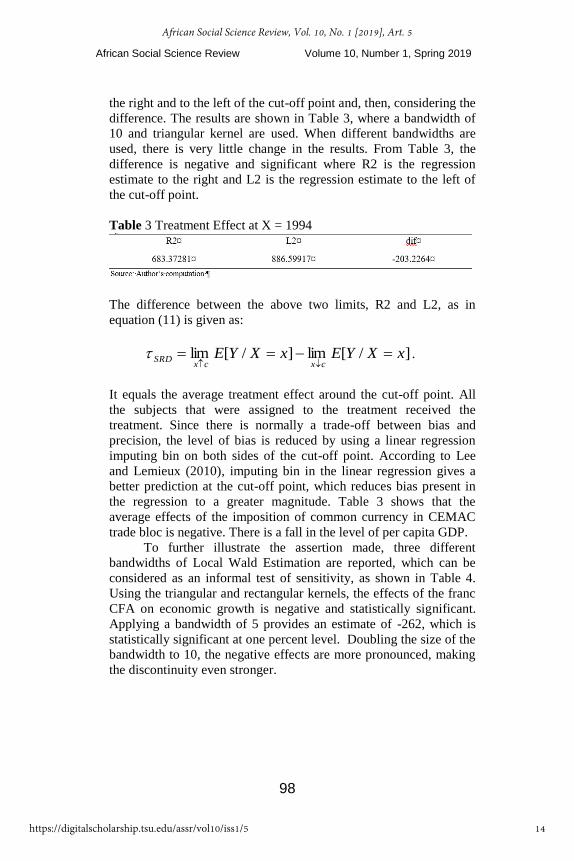
the right and to the left of the cut-off point and, then, considering the
difference. The results are shown in Table 3, where a bandwidth of
10 and triangular kernel are used. When different bandwidths are
used, there is very little change in the results. From Table 3, the
difference is negative and significant where R2 is the regression
estimate to the right and L2 is the regression estimate to the left of
the cut-off point.
Table 3 Treatment Effect at X = 1994
The difference between the above two limits, R2 and L2, as in
equation (11) is given as:
]/[lim]/[lim xXYExXYEcxcx
SRD
.
It equals the average treatment effect around the cut-off point. All
the subjects that were assigned to the treatment received the
treatment. Since there is normally a trade-off between bias and
precision, the level of bias is reduced by using a linear regression
imputing bin on both sides of the cut-off point. According to Lee
and Lemieux (2010), imputing bin in the linear regression gives a
better prediction at the cut-off point, which reduces bias present in
the regression to a greater magnitude. Table 3 shows that the
average effects of the imposition of common currency in CEMAC
trade bloc is negative. There is a fall in the level of per capita GDP.
To further illustrate the assertion made, three different
bandwidths of Local Wald Estimation are reported, which can be
considered as an informal test of sensitivity, as shown in Table 4.
Using the triangular and rectangular kernels, the effects of the franc
CFA on economic growth is negative and statistically significant.
Applying a bandwidth of 5 provides an estimate of -262, which is
statistically significant at one percent level. Doubling the size of the
bandwidth to 10, the negative effects are more pronounced, making
the discontinuity even stronger.
14
African Social Science Review, Vol. 10, No. 1 [2019], Art. 5
https://digitalscholarship.tsu.edu/assr/vol10/iss1/5

African Social Science Review Volume 10, Number 1, Spring 2019
99
Table 4 Nonparametric Estimation using Different Bandwidths and
Kernel Types
According to Pellegrini et al. (2013), wider bandwidths lead
to a higher smoothness around the cut-off point and are useful in
reducing the unevenness of observations that can be found around
the jump. When we apply the rectangular kernel, allowing the
bandwidth to stay the same, the results are slightly higher and
statistically significant at one percent.
Robustness Check
To check the robustness of the regression results, Akaike
Information Criterion (AIC), Bayesian Information Criterion (BIC),
and the F-test are carried out. The AIC indicates whether the data
used in the analysis fit the model better than another. The problem
with AIC is, if all the subjects do not fit the model neatly, the AIC
cannot indicate the problem. Jacob et al. (2012) suggest the use of
the F-test to determine the appropriate model to use. Once this is
done, it is necessary to increase the precision by adding a
predetermined baseline characteristic and dropping outer data points
in sequence from the lowest and highest rating distribution values
(Jacob et al., 2012). Other covariates are controlled to ensure they
are not responsible for the jump and thus affect the treatment around
the point of discontinuity. The results are shown in Table 5.
In Table 5, Eq. 3 in column 4 shows that the control variables,
such as CEMAC foreign direct investment (cemfdi) and CEMAC
total population (cempop), are not statistically significant. CEMAC
inflation (ceminf) and CEMAC labour force (cemLF) are
statistically significant at 5 and 10 percent. This shows a positive
relationship between CEMAC economic growth and its labour force
and inflation, as stipulated in the literature. The jump as a result of
the common currency is still negative and statistically significant at
one percent. The P-value of the F-test indicates that we can
15
Kangami and Akinkugbe: Effect of Common Currency on CEMAC Custom Union’s Economic Growth
Published by Digital Scholarship @ Texas Southern University, 2019

African Social Science Review Volume 10, Number 1, Spring 2019
100
comfortably reject the null hypothesis and conclude that the
institution of the common currency in CEMAC in 1994 had a
negative effect on the region’s economic growth, and that the model
used does provide a better fit.
Table 5 Proof of Robustness using the AIC and BIC Tests with
Controlled Covariates
Conclusions
In this paper, we used the RDD model to analyze the effects of a
common currency on CEMAC economic growth. The GDP per
capita was used as a proxy for economic growth, and the data
sample covers the period from 1970 to 2013. The focus of attention
is on the treatment effects around the threshold. The difference
between above and below the cut-off point produces the outcome. In
the case of CEMAC, all member states adopted the common
currency, and all qualified since they are all active members of the
CEMAC trade bloc. Both graphical and non-graphical analysis
(equations) are deployed in the estimation technique. The graphs
show clearly a negative jump around the cut-off point. Applying the
Kernel-weighted local polynomial makes the jump clearer, showing
a drop in GDP per capita. In the non-graphical analysis, both
parametric and nonparametric approaches are used to make sure the
results are robust. The results reveal that the imposition of the
common currency has had an inverse relationship with the region’s
economic growth.
In the parametric approach, when the degree of polynomial is
increased, the variable for CEMAC common currency is still
significant and negative, but the results are less significant for the
majority of the individual countries in the region, except for
Cameroon where it is significant and negative at one percent. For
16
African Social Science Review, Vol. 10, No. 1 [2019], Art. 5
https://digitalscholarship.tsu.edu/assr/vol10/iss1/5

African Social Science Review Volume 10, Number 1, Spring 2019
101
the Republic of Congo, the effect is also negative and significant at
10 percent. Reducing the degree of polynomial makes the results
even more significant for most of the member states, except for
Chad and Equatorial Guinea. The nonparametric method also
confirms the results from the parametric approach, as the difference
between the pre-post-period is also negative and significant. When
different bandwidths are used in the analysis, applying both the
triangular and rectangular kernel, the results are still significant at
one percent. Lastly, when other variables are controlled before and
after the implementation of the common currency, the common
currency coefficient is still negative, and only the variable for labour
force is positive and significant at 10 percent.
Policy Implications
One of the criteria for an OCA is the homogeneity condition to
ensure that any external shocks should have equal proportional
effects on member states of a trade bloc. This is not the case with
member states of the CEMAC customs union, where the effect of
external shocks is felt differently by member states. Even though the
CFA franc has fulfilled some requirements of the OCA, it is still far
from being an OCA. For example, some CEMAC states have
benefited from lower inflation that has contributed to
macroeconomic stability. Also, the convertibility of the CFA franc
is guaranteed by the French Treasury. The fact that it is pegged at a
fixed exchange rate to the euro has created some certainty in terms
of financial discipline. However, the downside of the fixed exchange
rate is that it has contributed to increased economic costs of
adjustment, as it has increased unemployment as a result of lack of
competitiveness of CEMAC economies due to the inability of
member state to alter the value of the currency to compete
competitively in the international market.
Tariff and non-tariff barriers have contributed to the low level
of intra-regional trade. Political instability in the CEMAC region has
weakened a regional central bank’s ability to provide checks-and-
balances in political systems in the CEMAC region. Close attention
should be paid to the fixed exchange rate of the CFA franc against
the euro. Decades ago, it made some economic sense to peg the
CFA franc to the euro, as the EU was the CEMAC’s main trading
partner. Since the pattern of trade has changed, China and India are
now the main trading partners. A common currency pegged to the
euro at the fixed exchange rate will disadvantage the CEMAC
customs union. Currently, these countries trade much less with
Europe, so that a fixed exchange rate to the euro would have
17
Kangami and Akinkugbe: Effect of Common Currency on CEMAC Custom Union’s Economic Growth
Published by Digital Scholarship @ Texas Southern University, 2019

African Social Science Review Volume 10, Number 1, Spring 2019
102
affected member states trade balance negatively. Conversely,
CEMAC countries trade a lot with Asia, so a switch to an alternative
exchange rate would subsequently raise income levels of member
states and improve member states’ trade balance.
Recently, debates of the valuation of the CFA franc have
intensified, and there has been speculation of possible devaluation of
the CFA franc during the CEMAC Heads of State Summit held in
Ndjamena, October, 25, 2018, due to poor macroeconomic
fundamentals in the region’s balance of payments. Slow progress of
reforms, the deterioration of budget balances, and the increase in
public debt drew wide speculations of the CFA franc devaluation.
However, devaluation did not take place, as the BEAC central bank
governor brought to the attention of the public that there was no
reason for CEMAC to risk devaluation, as the current economic
situation in the CEMAC zone is not anywhere near that of 1994, the
year of the last currency devaluation6.
It is no longer news that political constraints have contributed
to the CEMAC region’s poor economic performance. Most of the
countries in the region have witnessed or are going through some
tough political crises. The security threat posed by Boko Haram in
the northwestern CEMAC region, piracy along the Gulf of Guinea,
and instability in the Central African Republic between the anti-
Balaka and Séléka militias continue to threaten the region’s security.
There were failed coup attempts in Equatorial Guinea in 2004 and
2017, and an internal political crisis in Cameroon. Industries will not
be able to work to full capacity and economic growth is hindered.
Political instability has a strong negative effect on a country’s
economic performance. Having politically unstable neighbor’s
influences a country’s pattern of trade and investment and the
mobility of factors of production, including labor, thus leading to
lower economic development. Policies geared at enhancing trade
and economic growth at the individual and regional level will be
hampered if the security issues are not addressed. One step is for
member states to initiate inclusive dialogs with the different stake
holders that are contributing to the crises in the countries concerned.
It is clear from the analysis that the common currency
adopted in 1994 by the CEMAC member states has, on average, not
contributed to the region’s growth rate. Other factors must have
contributed to the region’s economic growth. Policy makers should
be careful when adopting policy changes like common currency.
The creation of a common currency, such as the Euro, was
6 Business Cameroon (2018)
18
African Social Science Review, Vol. 10, No. 1 [2019], Art. 5
https://digitalscholarship.tsu.edu/assr/vol10/iss1/5
African Social Science Review Volume 10, Number 1, Spring 2019
103
successful and benefited the Euro zone in general, though some
member states still face numerous challenges. In the case of the
recently witnessed 2016 Brexit referendum, various analyses and
conclusions are on the table about the future of the Euro. But, it is
clear that not all regional trade blocs are planning to establish
monetary unions anytime soon.
The main conclusions drawn from this study have a number of
important implications for policy. The results presented suggest that
networks formed by kinship constitute an important strategy
References
Andriamananjara, S (2003). Competitive liberalization: Preferential
trade agreements and the multilateral trading system. U.S.
International Trade Commission. Washington, D.C
Angrist, J. D., & Pischke, J.-S. (2009). Mostly harmless
econometrics: An empiricist’s companion. Princeton and
Oxford:
Bénassy-Quér, A., & Coupet, M. (2005). On the adequacy of
monetary arrangements in Sub-Saharan Africa. World
Economy, 28(3), 349–373.
Boschi, M., & Girardi, A. (2007). Euro area inflation: Long-run
determinants and short-run dynamics. Applied Financial
Economics, 17(1–3), 9–24.
Boujelbene, T., & Boujelbene, Y. (2010). Long run determinants
and short run dynamics of inflation in Tunisia. Applied
Economics Letters, 17(13–15), 1255–1263.
Carrere, C. (2013). UEMOA, CEMAC: Quelle performance en
matiere de commerce? UEMOA, CEMAC: What
Performance Regarding Trade? (with English summary.).
Revue d’Economie Du Developpement, (1), 33–60.
Conti, M. (2014). The introduction of the euro and economic
growth: Some panel data evidence. Journal of Applied
Economics, 17(2), 199–211
Criste, A. (2013). A general assessment of the monetary integration
process in Europe after euro adoption. Financial Studies,
17(4), 35–47.
De Grauwe, P. (2006). What have we learnt about monetary
integration since the Maastricht Treaty? Journal of Common
Market Studies, 44(4), 711–730.
Fan, J., & Gijbels, I. (1996). Local polynomial modelling and its
applications. New York: Chapman & Hall.
19
Kangami and Akinkugbe: Effect of Common Currency on CEMAC Custom Union’s Economic Growth
Published by Digital Scholarship @ Texas Southern University, 2019

African Social Science Review Volume 10, Number 1, Spring 2019
104
Felbermayr, G. J. (2005). Dynamic panel data evidence on the trade-
income relation. Review of World
Economics/Weltwirtschaftliches Archiv, 141(4), 583–611.
Fetahi-Vehapi, M., Sadiku, L., & Petkovski, M. (2015). Empirical
analysis of the effects of trade openness on economic growth:
An evidence for south east European countries. The
Economies of Balkan and Eastern Europe Countries in the
Changed World (EBEEC 2014), 19, 17–26.
Fielding, D., & Shields, K. (2005). Do currency unions deliver more
economic integration than fixed exchange rates? Evidence
from the Franc Zone and the ECCU. Journal of Development
Studies, 41(6), 1051–1070.
Guellec, D., & von Hagen (2000). Economic growth in Europe:
Entering a new era. In Mimeograph presentation at the
Deutsch-Französisches Wirtschaftspolitisches Forum, Bonn
(Vol. 17).
He, L. T. (2011). A note on impacts of international trade on
economic growth and inflation. International Trade Journal,
25(4), 418–432
Imbens, G. W., & Lemieux, T. (2008). Regression discontinuity
designs: A guide to practice. The Regression Discontinuity
Design: Theory and Applications, 142(2), 615–635.
Jacob, R. T., Zhu, P., Somers, M.-A., & Bloom, H. S. (2012). A
practical guide to regression discontinuity. MDRC.
Jalil, A., Tariq, R., & Bibi, N. (2014). Fiscal deficit and inflation:
New evidences from Pakistan using a bounds testing
approach. Economic Modelling, 37, 120–126
Kónya, L. (2006). Exports and growth: Granger causality analysis on
OECD countries with a panel data approach. Economic
Modelling, 23(6), 978–992.
Lee, D. S., & Lemieux, T. (2010). Regression discontinuity designs
in economics. Journal of Economic Literature, 48(2), 281–
355.
Mundell, R.A. 1961. A theory of optimum currency areas. The
American Economic Review, 51(4):657–665. DOI:
10.2307/1812792.
Nawaz, S., Aziz, A., & Zaman, K. (2014). Impact of trade factors on
economic growth: seemingly unrelated regression model.
European Economics Letters, 3(2), 46–50
Pellegrini, G., Terribile, F., Tarola, O., Muccigrosso, T., & Busillo,
F. (2013). Measuring the effects of European regional policy
on economic growth: A regression discontinuity approach.
Papers in Regional Science, 92(1), 217-233.
20
African Social Science Review, Vol. 10, No. 1 [2019], Art. 5
https://digitalscholarship.tsu.edu/assr/vol10/iss1/5

African Social Science Review Volume 10, Number 1, Spring 2019
105
Rubin, D. B. (1977). Assignment to treatment group on the basis of a
covariate. Journal of Educational Statistics, 2(1), 1–26.
https://doi.org/10.2307/1164933.
Sokolowska, E. (2008). Does joining the European Monetary Union
increase economic growth? A case for Italy. Proceedings of
the Northeast Business & Economics Association, 165–169.
Zhao, X., & Kim, Y. (2009). Is the CFA Franc Zone an Optimum
Currency Area? World Development, 37(12), 1877–1886.
https://doi.org/10.1016/j.worlddev.2009.03.011.
Authors’ Biographies
Divine Ngenyeh Kangami is seasoned academic, educator and
economist whose speciality is International Economics. He has
extensive experience working in the education field. He is currently
a senior faculty at the African Leadership University in Mauritius.
He taught Economics and Business Management at the African
Leadership Academy in Johannesburg, South Africa for ten years
and was also a part-time lecturer at the University of the
Witwatersrand from 2016-2018. In October, 2017, Divine won the
prize of best research paper and presentation (1st prize) during the
Wits University Annual Cross Faculty post graduate Symposium
from the Faculty of law, Commerce and Management. Divine has
also cheered sessions on trade openness and regional integration
including the African Economic Policy Symposium. Email:
Oluyele A Akinkugbe hold a Doctorate degree in Economics with
specialization in Open-economy macroeconomics and Applied
Econometrics. In the last 34 years, he has taught at undergraduate
and graduate levels in different Universities in Africa and North
America. Oluyele have also supervised a large number of
dissertations in: (i) mainstream economics, (ii) policy analysis, (iii)
Business Administration and (iv) Banking & Finance; at the
different Universities. Furthermore, he taught International Finance
at the Joint Facility for Electives (JFE) of the African Economic
Research Consortium (AERC) Collaborative Masters Program in
Economics (CMAP) for sub-Saharan Africa in Nairobi between the
period 2002-2004 and in 2014. Oluyele is currently a visiting
Professor of Economics at the University of the Witwatersrand,
South Africa and also serve as external examiner (Health
Economics) for the CPP and CMAP programs of the African
Economic Research Consortium (AERC), Nairobi.
21
Kangami and Akinkugbe: Effect of Common Currency on CEMAC Custom Union’s Economic Growth
Published by Digital Scholarship @ Texas Southern University, 2019