The effect of climate change on the Nitrogen cycle · The effect of climate change on the Nitrogen...
39
The effect of climate change on the Nitrogen cycle DAVID FOWLER CENTRE FOR ECOLOGY AND HYDROLOGY EDINBURGH
Transcript of The effect of climate change on the Nitrogen cycle · The effect of climate change on the Nitrogen...

The effect of climate change on the Nitrogen cycle
DAVID FOWLER
CENTRE FOR ECOLOGY AND HYDROLOGY EDINBURGH

OUTLINE AND MOTIVATION
• Nitrogen fixation, natural and anthropogenic…quantifying each
• A global budget for ~2010
• Uncertainties in the budget terms
• Where is all the N we have fixed?
• How will the global N budget change through the 21st Century?
• Effects of Nr on human health, climate and ecosystems

Natural cycling of Nitrogen
degradation
(animals &
microorganisms)
synthesis
(microorganisms,
plants & animals)
amino acids &
other organic
compounds
(Rhizobium &
some other
bacteria)
(anaerobic
bacteria)
nitrification
(Nitrobacter & other
soil bacteria)
nitrification
(Nitrosomonas &
other soil bacteria)
NO2-
nitrite
nitrogen
fixation denitrification
nitrate NH4+ ammonium N2
reduction
(plants & some
anaerobic
bacteria)
NO3-
more oxidized more reduced

4 25-11-2015
Ammonia synthesis
Fritz Haber Carl Bosch

5 25-11-2015
Industrial production of NH3

NITROGEN FIXATION THOUGH COMBUSTION

Nr for food and from energy between 1900 - 2000
half of the global population depends on fertilizers for their food

8
NITROGEN SOURCES AND FORMS
FORMSEXCESS
N2
Manure
Fertilizer
industry
Combustion
Sources
Nitrate
Nitrate
Ammonium-
NH4
Chemical/physical interactions

REPRESENTATIONS OF THE NITROGEN CYCLE
There are two main reasons for the quantitative detail and inclusion of the main fluxes and cycling :
1. Understand the underlying processes
2. Quantify the links between effects and sources, which provides the evidence for remedial action

NITROGEN FIXATION N2 TO NR (Tg-N) 2010
OCEAN
BNF – Biological Nitrogen Fixation
Lightning Combustion BNF Fertilizer Production BNF
40 10%
33 30%
140 50%
5 50%
120 50%
Annual fixation Nr 458 TgN y-1 Anthropogenic 193 TgN y-1 ~50%
Agricultural BNF
120 10%

NITROGEN: PROCESSING
O
O 3
O 3
NO 2
NO OH
RH R
-H
NO 2
NO
HO 2
RO 2 RO
O 2
O 2 O 2
O 2
sunlight
sunlight
NO NO2
NH4NO3 aerosol HNO3
O3 …….
Atmospheric Chemistry
atmospheric transport
Burial
140
60
Dry & Wet Deposition
20
NH4+ microbes NO3 Dead Soil
Organic Matter
Plant N
Soil/Plants Crops Livestock Forest GPP
240
Leaching and transport to ocean
80
NH3
40
Burial
t0.5 lifetime NOy NHx
< 1 month
t0.5 lifetime < 10 years
NO
40
Denitrification
N2
N2O
Denitrification
N2
N2O

TO WHAT EXTENT ARE THE GLOBAL MODELS OF N VALIDATED

SCIAMACHY TROPOSPHERIC NO2
• Burrows et al 2012 biomass burning pollution

IASI satellite remote sensing (Van Damme et al. 2015)

Faculty of Earth and Life Sciences
Average ammonia concentrations 2008-2013 (Van Damme et al. 2015)
15
2009 2010 2011 2008
NH3
mg/m²

NITROGEN: FATE
140
NH4+ microbes NO3 Dead Soil
Organic Matter
Plant N
280 Tg-N
Leaching and transport to ocean
80
Terrestrial
• Most Nr returns rapidly to the
atmosphere as N2
• Nr is accumulated in specific
terrestrial and oceanic reservoirs
Denitrification
N2
N2O
Denitrification
N2
N2O
120 Tg-N ~200 Tg-N ?
Burial • Forests • Soils • Peatlands • Aquifers
Burial

Effects of reactive nitrogen

% of ecosystems area with grid
average N deposition > eutrophication
(for 2000)
Critical load exceedance
for N effects on ecosystems
Predicted effects across Europe

% of ecosystems area with grid
average N deposition > eutrophication
(for 2000)
Critical load exceedance
for N effects on ecosystems Loss in life expectancy
attributable to PM2.5
Loss in average life expectancy
in months due to identified
anthropogenic PM2.5 (for 2000)
Predicted effects across Europe

The spatial scale of assessment strongly influences outcomes
SCALE ISSUES

ATMOSPHERIC NITROGEN DEPOSITION: GLOBAL, REGIONAL, LOCAL (Nr mg-N m-2) Dentener et al 2006
2000
2007
2009

FLUXES AND EFFECTS IN THE FIELD OCCUR AT FINE SCALE
Arable N source ~5 kg-N ha-1
Livestock source ~100 kg-N ha-1
Woodland N sink ~30 kg-N ha-1
Grassland N source ~10 kg-N ha-1
5 km

0
0.05
0.1
0.15
0.2
0.25
0 -
50
50 -
100
100 -
150
150 -
200
200 -
250
250-
300
300 -
350
350 -
400
400 -
450
450 -
500
Fra
cti
on
of to
tal su
rface a
rea (
km
2)
Deposition Gg-N
5 x 5 km
50 x 50 km
QUANTIFYING SPATIAL DISTRIBUTIONS
250 Gg-N
30% at 50 x 50 km 40% at 5 x 5 km
• As the resolution increases, the magnitude of peak values increases and the exceedance of thresholds increases
• With developments in understanding and increases in computing power, exceedances of thresholds increase

2000 TO 2100 TRENDS
Two important issues: 1. Estimates of projected
emissions of NOx ,NH3, and N2O
2. Influence of climate and land-use change on the N cycle (emissions).

NOX EMISSIONS (VAN VUUREN et al 2011)

N2O EMISSIONS 1950-2100 (VAN VUUREN et al 2011)

VAN VUUREN et al 2011

• Effects of global change during the 21st century on the
nitrogen cycle
•
• David Fowler1 , Claudia E Steadman1,2 , David Stevenson2
, Mhairi Coyle1 , Robert M Rees3 , Ute M. Skiba1 , Mark A.
Sutton1 J. Neil Cape1 , Tony Dore1 , Massimo Vieno1,2 ,
David Simpson4 , Sönke Zaehle5 , Benjamin Stocker6 ,
Matteo Rinaldi7 , Christina Facchini7 , CR Flechard8 , Eiko
Nemitz1 , Marsailidh Twigg1 , Jan Willem Erisman9 and Jim
Galloway
• Atmospheric Chemistry and Physics Discussion 2014

GLOBAL CHANGE DRIVERS OF NH3 EXCHANGE
Stomatal Resistance (RS=1/GS)
Stomatal Compensation Point (χS)
Non-Stomatal Resistance
(RW)
Temperature
Precipitation
Soil moisture
Rel. Humidity (or VPD)
CO2, O3 mixing ratios ? ?
Atmospheric acids (SO2, HNO3)
Nitrogen supply

Stomatal conductance (Gs):
ψVPDTmaxs,s fffGG (EMEP model, 2003)
0.0
0.1
0.2
0.3
0.4
0.5
0.6
0.7
0.8
0.9
1.0
0 5 10 15 20 25 30 35 40
Temperature (°C)
fT (
dim
ensi
on
less
)
Temperate/boreal coniferous forests
Temperate/boreal deciduous forests
Mediterranean needleleaf forests
Mediterranean broadleaf forests
Seminatural/Moorland
Temperate crops/Grassland
fT
0.0
0.1
0.2
0.3
0.4
0.5
0.6
0.7
0.8
0.9
1.0
-3 -2.5 -2 -1.5 -1 -0.5 0
SWP (MPa)
fS
WP (
dim
ensi
on
less
)
Temperate/boreal coniferous forests
Temperate/boreal deciduous forests
Mediterranean needleleaf forests
Mediterranean broadleaf forests
Temperate crops/Grassland
Seminatural/Moorland
fSWP
0.0
0.1
0.2
0.3
0.4
0.5
0.6
0.7
0.8
0.9
1.0
0 0.5 1 1.5 2 2.5 3 3.5
VPD (kPa)
fV
PD (
dim
ensi
on
less
)
Temperate/boreal coniferous forests
Temperate/boreal deciduous forests
Mediterranean needleleaf forests
Mediterranean broadleaf forests
Seminatural/Moorland
Temperate crops/Grassland
fVPD
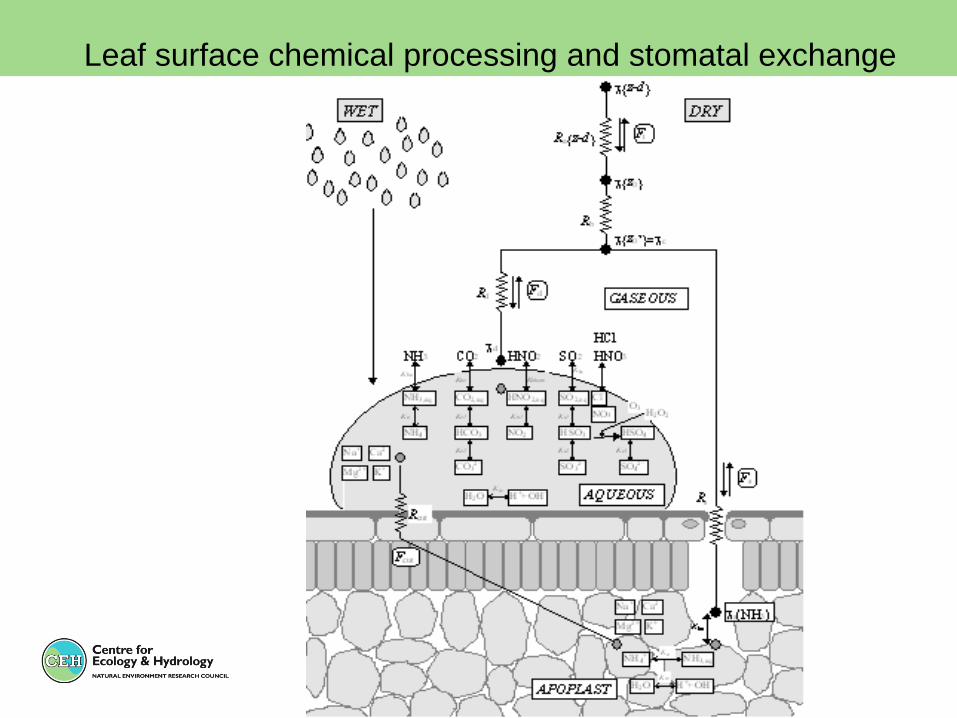
Leaf surface chemical processing and stomatal exchange
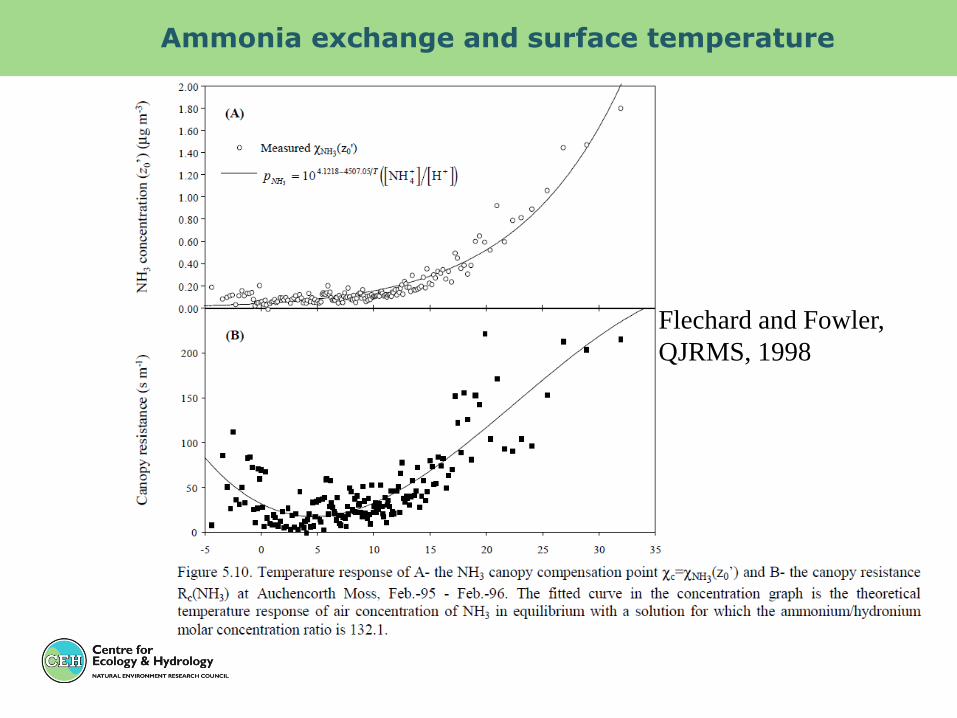
Ammonia exchange and surface temperature
Flechard and Fowler,
QJRMS, 1998

MECHANISM LEADING TO FAST NITRATE & AMMONIUM
DEPOSITION
NH4NO3(S, AQ) NH3(G) + HNO3(G); KE = FN(T, RH)
Temperature gradient
Gradient in equilibrium dissociation constant Ke [NH3]x[HNO3]
[HNO3] [NH3]
Driver for evaporation
Gradient in actual [NH3]x[HNO3]
NH4NO3
HNO3 NH3
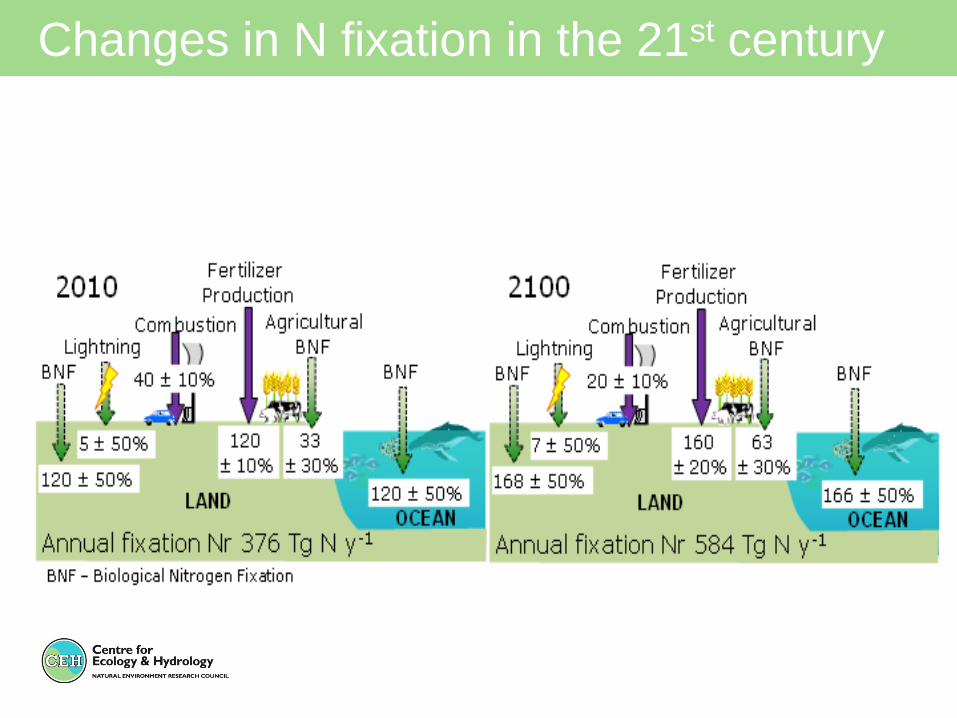
Changes in N fixation in the 21st century


36 25-11-2015
NITROGEN EFFECTS
N2
Manure
Fertilizer
industry
Combustion
Sources
Nitrate
Nitrate
Ammonium-
NH4
Chemical/physical interactions
Materials
and
cultural
heritage
Human and
animal
health
Climate change
GHG interactions
Ecosystems
and
biodiversity
Effects

% of ecosystems area with grid
average N deposition > eutrophication
(for 2000)
Critical load exceedance
for N effects on ecosystems Loss in life expectancy
attributable to PM2.5
Loss in average life expectancy
in months due to identified
anthropogenic PM2.5 (for 2000)
Predicted effects across Europe

conclusions
• The main effects of changes in climate during
the 21st century on the nitrogen cycle are to
increase emission fluxes, especially of
ammonia
• These changes will erode benefits of measures
to reduce emissions, which to date are modest
for ammonia.

Thank you