
The Effect of China’s Real Exchange Rate Appreciation in ... US current account deficit and high...
13
The Effect of China’s Real Exchange Rate Appreciation in the Next Decade — An Investigation of a Recursive Dynamic CGE Analysis Xin Li a and Dianqing Xu b a National School of Development, Peking University, PRC b Huron University College, The University of Western Ontario, Canada Abstract: Although recent empirical studies indicate that the renminbi is undervalued, few people discuss how to adjust it effectively. The essential objective behind this paper is to explore the effect of the alternative adjustment of China’s real exchange rate. Different with the simulation designs of IIE’s Asian currency devaluation study, which discussed renminbi’s real exchange rate change and its competitiveness if China’s overall trade surplus reduces to zero. This paper considers the formation mechanism of the real exchange rate. By assuming the same change of factor’s price during different time periods and using the recursive dynamic computable general equilibrium model, the two different scenarios are simulated against the baseline, one is to adjust the macro-structural imbalance by decreasing the gross national saving rate in China and the other is to adjust the micro-structural imbalance by increasing the real wage rate of Chinese labor. It can be seen that, first, the external imbalance will be improved by the internal structural adjustment in the long-term; second, the effect of macro-adjustment is more significant than the micro-adjustment; third, a real appreciation would be sufficient for China to improve its terms of trade and change the export-oriented model of development into demand- oriented model of development in the next decade. Key words: Exchange rate, recursive dynamic CGE model, wage rate, gross national saving rate JEL Classification: F16, F17, J21 I. Introduction China and the United States each contributed massively to the large global economic imbalance that emerged in the middle of the last decade. In 2011, the Sino-US trade deficit is accounted to over one third of total US trade deficit, which is more than the sum of US trade deficit with Europe, Canada and Mexico. Many analysts are concerned that the imbalances in both China and US contributed to the global financial crisis, and a great deal of recent debate has focused attention on China’s exchange rate for it maintains a de facto fixed exchange rate regime, with the renminbi linked to the US dollar within a narrow trading band. They concerned that the Chinese government might, in an effort to help its sagging export industries, set new trade barriers, impose industrial subsidies or depreciate its currency, which could harm US firms and workers. Bergsten (2010) points out that the renminbi is undervalued by approximately 25 percent on a trade- weighted average basis and by approximately 40 percent against the US dollar, and this competitive undervaluation of the renminbi is a blatant form of protectionism. Krugman (2010) suggests that over the next couple of years, Chinese mercantilism might end up reducing US employment by approximately 1.4 million jobs. Gagnon’s (2010) research suggests that a 10 percent renminbi appreciation would boost US employment by at least 670 000 jobs. Scott (2010) indicates that the US trade deficit is the major reason for US high unemployment. He estimates that the US manufacturing sector lost 5.3 million jobs from January 2001 to September 2009. The US has accumulated large structural trade deficits over the past three decades, and in 2007, the non-oil share in the deficits was responsible for the loss or displacement of more than 5 million jobs. Many US policy-makers have urged China to reduce its reliance on exports for its economic growth and to adopt incentive policies to promote domestic consumption. Central to this position
Transcript of The Effect of China’s Real Exchange Rate Appreciation in ... US current account deficit and high...

The Effect of China’s Real Exchange Rate Appreciation in the Next Decade
— An Investigation of a Recursive Dynamic CGE Analysis
Xin Lia and Dianqing Xub
a National School of Development, Peking University, PRC b Huron University College, The University of Western Ontario, Canada
Abstract: Although recent empirical studies indicate that the renminbi is undervalued, few people discuss how to adjust it effectively. The essential objective behind this paper is to explore the effect of the alternative adjustment of China’s real exchange rate. Different with the simulation designs of IIE’s Asian currency devaluation study, which discussed renminbi’s real exchange rate change and its competitiveness if China’s overall trade surplus reduces to zero. This paper considers the formation mechanism of the real exchange rate. By assuming the same change of factor’s price during different time periods and using the recursive dynamic computable general equilibrium model, the two different scenarios are simulated against the baseline, one is to adjust the macro-structural imbalance by decreasing the gross national saving rate in China and the other is to adjust the micro-structural imbalance by increasing the real wage rate of Chinese labor. It can be seen that, first, the external imbalance will be improved by the internal structural adjustment in the long-term; second, the effect of macro-adjustment is more significant than the micro-adjustment; third, a real appreciation would be sufficient for China to improve its terms of trade and change the export-oriented model of development into demand-oriented model of development in the next decade. Key words: Exchange rate, recursive dynamic CGE model, wage rate, gross national saving rate JEL Classification: F16, F17, J21
I. Introduction
China and the United States each contributed massively to the large global economic imbalance that emerged in the middle of the last decade. In 2011, the Sino-US trade deficit is accounted to over one third of total US trade deficit, which is more than the sum of US trade deficit with Europe, Canada and Mexico. Many analysts are concerned that the imbalances in both China and US contributed to the global financial crisis, and a great deal of recent debate has focused attention on China’s exchange rate for it maintains a de facto fixed exchange rate regime, with the renminbi linked to the US dollar within a narrow trading band. They concerned that the Chinese government might, in an effort to help its sagging export industries, set new trade barriers, impose industrial subsidies or depreciate its currency, which could harm US firms and workers. Bergsten (2010) points out that the renminbi is undervalued by approximately 25 percent on a trade-weighted average basis and by approximately 40 percent against the US dollar, and this competitive undervaluation of the renminbi is a blatant form of protectionism. Krugman (2010) suggests that over the next couple of years, Chinese mercantilism might end up reducing US employment by approximately 1.4 million jobs. Gagnon’s (2010) research suggests that a 10 percent renminbi appreciation would boost US employment by at least 670 000 jobs. Scott (2010) indicates that the US trade deficit is the major reason for US high unemployment. He estimates that the US manufacturing sector lost 5.3 million jobs from January 2001 to September 2009. The US has accumulated large structural trade deficits over the past three decades, and in 2007, the non-oil share in the deficits was responsible for the loss or displacement of more than 5 million jobs. Many US policy-makers have urged China to reduce its reliance on exports for its economic growth and to adopt incentive policies to promote domestic consumption. Central to this position

is the belief that China should appreciate its currency and adopt a floating exchange rate system, which could boost its imports and have positive effects on the US economic recovery, especially US labor market. Another opposing view believes that renminbi appreciation will have no significant help to solve the enlarging US current account deficit and high unemployment rate. Zhang et al. (2006) use a comparative general equilibrium (CGE) model to analyze the impacts of an appreciation of China’s real exchange rate on the trade balance between China and the US and various industries in both countries. Their results indicate that China’s output in both agriculture and manufacturing sectors will increase and China’s exchange rate appreciation might not solve the enlarging US current account deficit. Fair (2010) uses a multi-country model to estimate the macroeconomic effects of the renminbi appreciation. The estimated effects on US output and employment are modest. The positive effects on US output from decreased imports from China are offset by the negative effects on US output from increased domestic inflation and from a decrease in US exports to China because of China’s likely economic contraction. Evenett and Francois (2010) compare three general approaches for estimating the impact of renminbi appreciation relative to the US dollar on the US labor market. They indicate that a dearer renminbi would boost the competitiveness of US exports to China but it would reduce overall US competitiveness. After taking imported intermediate inputs into account, renminbi appreciation relative to the US dollar is found to result in US job losses. Barry Eichengreen and Hui Tong (2011) examine the impact of renminbi revaluation on firm-level data which can distinguish different channels through Chinese currency policy. They find that, to the export-oriented firm, the net effect for firms exporting to China in sectors with few processing inputs is large, while the net effect can be small and even negative for firms exporting to China in sectors with significant processing inputs. To the home market firms, their experiential analysis shows that expectations of renminbi appreciation boost stock prices for firms that compete with China in their home markets, and the firm processed high Chinese imported-input content are likely to feel negative effects insofar as they are parent companies of Chinese subsidiaries or reside upstream of China in the relevant production chain. Much current debate focuses on the questions about whether the renminbi’s links to the US dollar may have resulted in an undervaluation of the currency and how much is the degree of the undervaluation? However, estimating a currency’s equilibrium exchange rate is a very complicated matter, with the difficulties greatly compounded in the case of a developing country like China that is undergoing substantial structural change. The renminbi’s value will be inexorably linked to the ongoing structural reforms of the economy, and will reflect further opening of domestic market to foreign goods and services. So that the discussions about attaining a particular level of the exchange rate may be less productive than focusing on the structural adjustment, such as the internal adjustment of the macro national saving rate and the micro labor market distortions. First, the basic national income accounting identity tells us that a country’s current account surplus is the difference between national saving and national investment. Countries with current account surpluses can reduce those surpluses effectively by reducing gross national saving rate. Second, Huang and Tao (2010) found that asymmetric market liberalization and factor-cost distortion is an additional hypothesis for China’s external imbalances. The household registration system still discourages labor mobility within China to some extent, and labor cost distortions have increased significantly in recent years more because of the slower growth of migrant workers’ pay than urban wages. Such distortions to factor costs are equivalent to producer subsidies. They artificially raise the profitability of production, increase returns to investment, and improve the competitiveness of Chinese exports in international markets. Huang et al. believed factor cost distortions can not only led to serious external imbalances, since investment and exports levels were even higher than otherwise, but also lowered the share of household income in GDP which in turn, had negative effects on the share of GDP devoted to consumption expenditures. The present paper contributes to the published literature on renminbi revaluation in three aspects. First, much current debate focuses on the role of the exchange rate in rebalancing the Chinese economy. However, the majority of CGE models used are static in nature. The inability of this kind of model to account for growth effects makes than inadequate for medium run analysis of the exchange rate impacts of economic policies. They exclude accumulation effects and do not allow the study of the transition path of
the economy where short run policy impacts are likely to be different from those of the medium run. To overcome this limitation we propose a recursive dynamic CGE model for exchange rate analysis. Second, the real exchange rate is defined as the relative price of tradable with respect to non-tradable goods, and it represents the degree of international competitiveness. In theory, for the factor cost is the better index of a country’s international degree of competitiveness (Sebastian Edwards, 1989), we consider market price of primary factor as the proxy variable for the real exchange rate in this paper, and see if it’s incentive for exports and imports change by reducing the internal imbalance. Third, unlike the previous research concentrated on the impact of renminbi appreciation in different degrees, this paper compares the effective means to achieve the real appreciation. The rest of the paper is organized as follows. Section II describes the recursive dynamic CGE model and the database used in this paper. The main results and analysis are discussed in Section III and Section IV concludes.
II. Recursive Dynamic General Equilibrium Model and Data Description
Dynamic general equilibrium models can be classified as truly dynamic (“intertemporal”) or sequential dynamic (“recursive”) models. Truly dynamic models are based on optimal growth theory where they behavior of economic agents is characterized by perfect foresight. They know all about the future and react to future changes in prices. Households maximized their intertemporal utility function under a wealth constraint to determine their consumption schedule over time. Investment decisions by firms are the result of cash flow maximization over the whole time horizon. This paper developments a recursive dynamic CGE model for exchange rate analysis. This kind of dynamic is not the result of intertemporal optimization by economic agents. Instead, these agents have myopic behavior. A recursive dynamic model is basically a series of static CGE models that are linked between periods by an exogenous and endogenous variable updating procedure. First, the static CGE model used to develop a recursive dynamic one in this paper is based on several standard assumptions: constant returns to scale, perfect competition and price-taking behavior, market-clearing conditions hold for commodities and primary factors, and zero profit conditions hold, implying that price equals marginal cost. More specifically, a representative household in each region maximizes utility subject to a budget constraint and representative producers in each region minimize costs subject to a production function. International capital flows are driven by relative rates of return on capital (Tsigas and Wang, 2010). Second, since the real Social Accounting Matrix (SAM) is not fully up-to-date for making future projections, the calibration of model parameters relies on an updating procedure which allows the model to target key macroeconomic aggregates. The real growth rate of GDP, total economically active population, unskilled labor supply, skilled labor supply are targeted and capital shock is updated endogenously between periods in this paper. In general, the model is part of a large family of models widely used to analyze the impact of global trade liberalization and structural adjustment programs. It focuses on the real side of the world economy and incorporates considerable detail on sectoral output and real trade flows, both bilateral and global. However, this structural detail is obtained at the cost of not explicitly modeling financial markets, interest rates, and inflation. While not designed to generate short-term macroeconomic forecasts, the model is linked to a macroeconomic model including asset flows and generating macro scenarios. Given a macro scenario, however, this model is then used to determine the implied real trade flows and sectoral structural adjustments for each region in a recursive dynamic framework consistent with the macro scenarios. Under assumptions for a likely path of future world economic growth, it generates the pattern of production and trade resulting from world economic adjustment to the macro shocks specified in the alternative scenario. This CGE based analysis will provide a tool to identify China’s general equilibrium real exchange rate and to quantitatively evaluate the probable impacts of an appreciation of China’s real exchange rate on major US industries and US trade deficit. The model also generates the trends of distribution in commodity composition and geographic location of US trade deficit during the simulation period in response to real exchange rate realignment or macroeconomic policy changes in US and China.

The model has a focus on US and China as well as their top trade partners. 26 fully endogenized regions and 41 production sectors in each region will be specified to represent the world economy, and it is calibrated around a world ICIO table estimated for 2007 based on version 8 Global Trade Analysis Project (GTAP) database. The projection data used in the model for dynamic scenario are come from the World Economic Outlook database of IMF. This benchmark equilibrium serves as a “baseline” for counterfactual simulation analysis. It tries to offer policy makers a quantitative picture of what will happen to China’s trade in the next 10 years if China re-evaluates its currency by (1) changing its national gross saving rate or (2) reducing the factor distortion.
III. Scenario Results and Empirical Analysis
The major insight from the modeling framework used in the present article is that exchange rates matter. The ultimate impact of changes in exchange rate, however, depends critically on the underlying cause of the exchange rate change (e.g. caused by tariff changes or domestic inflation) and the extent to which a change in the nominal exchange rate can persistently alter the underlying real exchange rate (McKibbin and Sachs, 1991).
As discussion above, for the price of primary factor can be considered as the proxy variable of the country’s competitiveness, two different shocks are given in our recursive dynamic CGE model to increase the factor price of China. One is to decrease the gross national saving rate and the other is to increase the real wage rate of both unskilled and skilled labor. The following figure 1 indicates that the price of primary factor has the similar change trend under the two different shocks.
Figure 1 the baseline and the two policy lines: the change of primary factor’s price
0.90
1.00
1.10
1.20
1.30
2007
2008
2009
2010
2011
2012
2013
2014
2015
2016
2017
2018
2019
2020
baseline
policyline_wage
policyline_saving
Note: the baseline forecast then could be produced to inform the likely future economic path in the absence of additional policy action. The policy line represents the shock of policy action on the base of the baseline forecast. Source: Authors’ calculations.
Although the two scenarios can produce the similar degree of appreciation, that is, the real of factor cost increase approximately 2.5 percent on average relative to the baseline during the China’s 12th Five Years Plan1 . However, the specific impact of macro- and micro- effect created by reducing the gross national saving and increasing the wages rate respectively on managing China’s external imbalance are not the same.
1. Impact of real renminbi appreciation on the Sino-US trade imbalance
1 According to the data published from Bank for International Settlements (BIS), the real effective exchange rate of renminbi (REER) appreciated approximately 2.53 from 2010 to 2011. In this paper, we assume REER maintained a stable appreciation rate during the China’s 12th Five Years Plan, which is from 2011 to 2016.

In 2007, China has overtaken Japan to become the third largest US export market and the first largest source of US imports. According to the foreign trade data published by US Department of Commerce, in 2011, US exports to China accounted for 6.9 percent of its total commodity exports and US imports from China accounted for 18.0 percent of its total commodity imports. The importance of China as a source of US imports has risen dramatically. China moved from being the eighth largest importer in 1990, to the fourth in 2000, the second in 2004–2006, and finally, to the first largest importer began in 2007. The Sino–US economic ties have expanded substantially over the past two decades, and trade deficit between these two countries has surged since 2000, and is significantly larger than that with any other US trading partner and several trading groups. For example, in 2011, Sino-US trade deficit is accounted for more than 40 percent of total US trade deficit which is larger than the combined US deficit with the Europe, Canada, Mexico, Japan and South Korea. McKinnon and Schnabl (2009) believe that the Sino–US trade imbalance can only be corrected in the long term if China’s net savings fall and the inverse occurs in the US, and the scenario results of the recursive dynamic CGE model support this view. The following figure 2 indicates that, first, the real exchange rate appreciation cannot reduce the Sino-US trade imbalance significantly in the short-term. Second, comparing to the shock by the gross national saving rate, correcting the distortion of factor market plays the limited role in reducing the Sino-US imbalance. If the saving glut is indeed the cause, and the saving-investment gap is structural, China’s external imbalance will not disappear any time soon. Figure 2 the percentage deviation of the two policy lines from the baseline: Sino-US trade imbalance
0.00
0.20
0.40
0.60
0.80
1.00
1.20
2007
2008
2009
2010
2011
2012
2013
2014
2015
2016
2017
2018
2019
2020
%
policy_wages
policy_saving
Source: Authors’ calculations. In the short run, the imbalance is mainly embodied in the trade structure. The fundamental factors of the two economies that determined the commodities of trade pattern during the 1980s can be explained by the concept of comparative advantage. China, with an abundant low-cost labor force, exports labor-intensive manufactured goods and low value-added goods, such as textiles, clothing and footwear to the US, whereas the US exports high-technology and value-added products, such as aircraft and electrical machinery, to China. However, in the later 1980s, a new pattern of the regional division of labor began to take shape. The lowering of communication and transportation costs, and the liberalization of trade and investment regimes, enabled corporations to fragment and internalize the production process and made distance a less important factor in their ‘location decision’. (Ando and Kimura, 2003) China’s surplus coincided with the formation of international production networks, and its trade pattern was shaped to a large extent by FDI. Until 2011, US firms have nearly US$50 Billion invested in China and most of them flowed into high-technology and IT industries. The performance of these investments is crucial to the US economy: they are not only enable US companies to access China’s huge domestic market, but also catalyze Sino-US trade imbalance. Figure 3 compares the Sino-US trade for different commodity groups during the last two decades. After 2000, an increasing proportion of US imports from China were comprised of more technologically advanced products, such as office, accounting and computing machinery, electrical machinery and apparatus, n.e.c. At the beginning of 1990, US imports of IT products

from China totaled US$2.0 billion, compared with US$40.3 in 2009, the annual increased proportion was more than 97 percent, and the average annual growth rate of the similar products’ import was only 47 percent, from $US0.8 billion in 1990 to $US7.9 billion in 2009.
Figure 3 Structural imbalances in the bilateral Sino–US Trade
0.0
5.0
10.0
15.0
20.0
25.0
30.0
35.0
40.0
45.0
HT
M_i
mp
MH
M_i
mp
ML
M_i
mp
LT
M_i
mp
ITM
_im
p
HT
M_e
xp
MH
M_e
xp
ML
M_e
xp
LT
M_e
xp
ITM
_exp
Bill.USD
1990 2000 2009
Note: HTM_imp represents US imports High-technology manufactures from China, HTM_exp represents US exports High-technology manufactures to China. MHM represents the Medium-high-technology industries, MLM represents the Medium-low-technology industries and LTM represents the Low-technology industries. The classification of manufacturing industries into categories is based on R&D intensities. The details of technology intensity definition are come from OECD (2011). Source: OECD, STAN Bilateral Trade Database. While China’s trade has expanded with accelerating speed, it is increasingly being dominated by processing trade (figure 4). As a matter of fact, according to the data from General Administration of Customs of R.P.C., in 2005, China’s total trade surpassed US$1 trillion, and accounted for more than 70 percent of GDP. At the same time, processing trade accounted for 54.6 percent of China’s total exports of US$761 billion and foreign-funded enterprises’ share in processing trade accounted for more than 80 percent of the exports. In 2011, China had US$155 billion surpluses of which US$366 billion was created by processing trade, and the gap between total trade surplus and processing trade surplus is becoming larger.
Figure 4 the total surplus and processing surplus in China, 1995-2011
0
50
100
150
200
250
300
350
400
1995
1996
1997
1998
1999
2000
2001
2002
2003
2004
2005
2006
2007
2008
2009
2010
2011
Bill
. USD
Trade Surplus_total
Trade Surplus_processing
Source: General Administration of Customs of R.P.C. According to the Chinese Department of Commerce, a large part of the trade imbalance between China and US is also associated with the exports of “processing industries”, in which multinational firms import intermediate goods from other countries and assemble them as finished products in China before re-

exporting them. For example, the export of laptops alone contributes to about half of China’s surplus in the processing trade, with 95 percent of laptops worldwide assembled in China. (Barry Eichengreen and Hui tong, 2011) Different from the general trade, appreciation would reduce the international competitiveness of a country directly. In the processing trade, the effects of a currency appreciation mainly depend on the extent of domestic and foreign content in a country’s trade. If the domestic content is low, then the exchange rate appreciation would have relatively small effect on exports. This is because the higher foreign currency price of the export is partly offset by the lower domestic-currency price of the imported inputs. To the extent that the domestic content varies by industry, a given exchange rate appreciation should be expected to have different effects on different industries. With renminbi appreciation, the domestic value-added embodied in China’s exports would be more expensive in foreign currencies, and the foreign value-added or imported inputs to produce these exports would become cheaper in Chinese currency. As a result, the lower content of domestic value-added embodied in exports, the less effect of renminbi appreciation on export growth will be. Given the low level domestic value-added share in a large proportion of China’s exports compared to the world average, an appreciation of the renminbi might not have a significant impact on China’s manufactured exports and employment in the short-term, as many analysts anticipate.
2. Impact of real renminbi appreciation on the terms of trade
In international economics, terms of trade represents the ratio of price exports to price imports. In layman’s terms, it means what quantity of imports can be purchased through the sale of a fixed quantity of exports. In general, the terms of trade is primarily determined by the real exchange rate and productivity, for the change of technology has been targeted, the terms of trade is only refluenced by the real exchange rate in our model. Figure 5 indicates the relative change of China’s terms of trade after the renminbi appreciation caused by two different shocks to the baseline.
Figure 5 the percentage deviation of the two policy lines from the baseline: the terms of trade
1.00
1.01
1.01
1.02
1.02
1.03
1.03
1.04
1.04
2007
2008
2009
2010
2011
2012
2013
2014
2015
2016
2017
2018
2019
2020
policy_wages
policy_saving
Source: Authors’ calculations. Renminbi appreciation is benefit to improve China’s terms of trade. A rise in the value of Yuan lowers the domestic prices for China’s imports but does not affect China’s exports directly. It’s no doubt that, some exports produced in China will suffer from a loss of export earning, but this trend is not universal, especially for resource products and the processing industry with heavy multinationals involved. Moreover, appreciation in renminbi will also help to rebalance China’s economic growth structure in two aspects: first, appreciation is help for China to rebalance from reliance on exports to domestic demand in the long-term. As renminbi appreciates steadily, foreign demand for China goods will reduce as they get more ‘expensive’, which will make producer in China focus less on exports markets and concentrate more on the domestic market. Domestic consumption will also be lifted as rise on domestic currency increase purchasing power in local currency terms. Second, the increase in the terms of trade opens the door for

GDP to rise. The drop in import prices allows Chinese to buy imports at lower price, freeing up money to purchase other products, or allowing firms to invest more abroad.
3. Impact of real renminbi appreciation on the Sino-US labor market
In recent years, globalization and the shape of the world’s economy have pushed American companies to look overseas for cheap labor. But now, a combination of economic forces is fast eroding China’s cost advantage as an export platform for the American market, meanwhile, the US with an increasingly flexible workforce and a resilient corporate sector, is becoming more attractive and the job opportunities are swinging back to US by the insourcing2 trend. Many people believed that “insourcing” can help to make “Made in America-again” achieved. According to the study by Mary Amiti and Shang-Jin Wei (2005), in the United Kingdom and many other industrialized countries more jobs are insourced than outsourced. Following figure 6 indicates the change of Sino-US labor market under the two different shocks. According to the scenario results, in the case of China, the rising of factor cost caused by increasing the wage will decline the international competiveness of Chinese labor-intensive exports, the foreign contract loss will reduce the domestic production and shrink the labor demand directly. The unskilled labor demand will decline approximately 15 percent to the based on average, and the effect of wage shock to the skilled labor is more significant, the scenario result shows the total employment will decline more than one third in the next decade. In fact, in order to maintain stable and relatively rapid economic growth, the China’s 12th Five Years Plan has emphasized that domestic demand should be allowed to play a greater role in fuelling economic growth. Expanding domestic demand is the basic requirement and primary task of China for shifting the economic growth mode in the next five years. This strategy is conscious to utilize domestic demand instead of the external market to simulate job creation. So the impact of wage changed on China’s labor market in the future may not so significant in the short- or medium- terms. Comparing to the shock by wage, the saving rate adjustment has a positive effect on Chinese labor market for increasing the investment and household consumption contributed to promote the domestic product and labor demand in the long-term. In the case of US, many policy-makers in the United States have urged China to reduce its reliance on exports for its economic growth and they believe that renminbi appreciation will have positive effects on the US economy, in particular on the US labor market. An analysis by The Boston Consulting Group3 concludes that, by sometime around 2015, manufacturing in some parts of the US will be just as economical as manufacturing in China. The key reasons for this shift include: first, wage and benefit increases of 15 to 20 percent per year at the average Chinese factory will slash China’s labor-cost advantage over low-cost states in the US, approximately from 55 percent to 39 percent in 2015; second, manufacturing of some goods will shift from China to nations with lower labor costs, such as Viet Nam, Indonesia and Mexico. But these nations’ ability to absorb the higher-end manufacturing that would otherwise go to China will be limited by inadequate infrastructure, skilled workers, scale and domestic supply networks, as well as by political and intellectual-property risks. The scenario results from dynamic recursive CGE model are inconsistent with the views: the impact of renminbi appreciation plays a very limited role on US labor market recovery, which is less than 4 percent effect on average to the baseline from 2011 to 2020. With the rapid global development of intra-industry trade and foreign direct investment, to suggest that the substitution between domestic production and international trade is a one-way relationship is simplistic. Increasing the value of the renminbi vis-à-vis the dollar will not reduce the trade deficit and create enough job opportunities to the US market. First, US labor costs are so high that it would be difficult for US to regain competitiveness solely through forcing the renminbi to appreciate in the short-term.
2 Insourcing is the opposite of outsourcing and it’s often defined as the delegation of operations or jobs from production within a business to an internal entity that specializes in that operation. 3 Harold L. Sirkin, Michael Zinser and Doug Hohner, “Made in America, Again—Why Manufacturing Will Return to the US”, available on: https://www.bcgperspectives.com/content/articles/manufacturing_supply_chain_management_made_in_america_again/.

Second, the US has already shifted its economy from being manufacturing-oriented to being service-oriented, and the country is becoming increasing reliant on foreign markets for its manufactured products. This shift suggests that the US will import goods from ASEAN4 if they do not import goods from China, and that the US aggregate trade deficit will remain substantial despite a renminbi appreciation. Even though the transfer of labor-intensive manufacturing from China to other ASEAN will be limited by the expansion of the production capacity, the industrial transfer from coastal areas to inland province will be occurred meanwhile in China for the size of labor pool in the central and western provinces are still considerable. Third, the reallocation of global manufacturing is in its very early phases. It will vary dramatically from industry to industry, depending on labor content, transportation costs, China’s competitive strengths, and the strategic needs of individual companies. While China will remains an important manufacturing platform for Asia and Europe in the next decade.
Figure 6 the percentage deviation of the two policy lines from the baseline: labor market (a) Shock by the national saving rate (b) shock by the wage rate
0.40
0.60
0.80
1.00
1.20
1.40
1.60
1.80
2007
2008
2009
2010
2011
2012
2013
2014
2015
2016
2017
2018
2019
2020
Unskilled_U.S.
Skilled_U.S.
Unskilled_China
Skilled_China
0.40
0.60
0.80
1.00
1.20
1.40
1.60
1.80
2007
2008
2009
2010
2011
2012
2013
2014
2015
2016
2017
2018
2019
2020
Unskilled_U.S.
Skilled_U.S.
Unskilled_China
Skilled_China
Source: Author’s calculations.
4. Impact of real renminbi appreciation on the international market
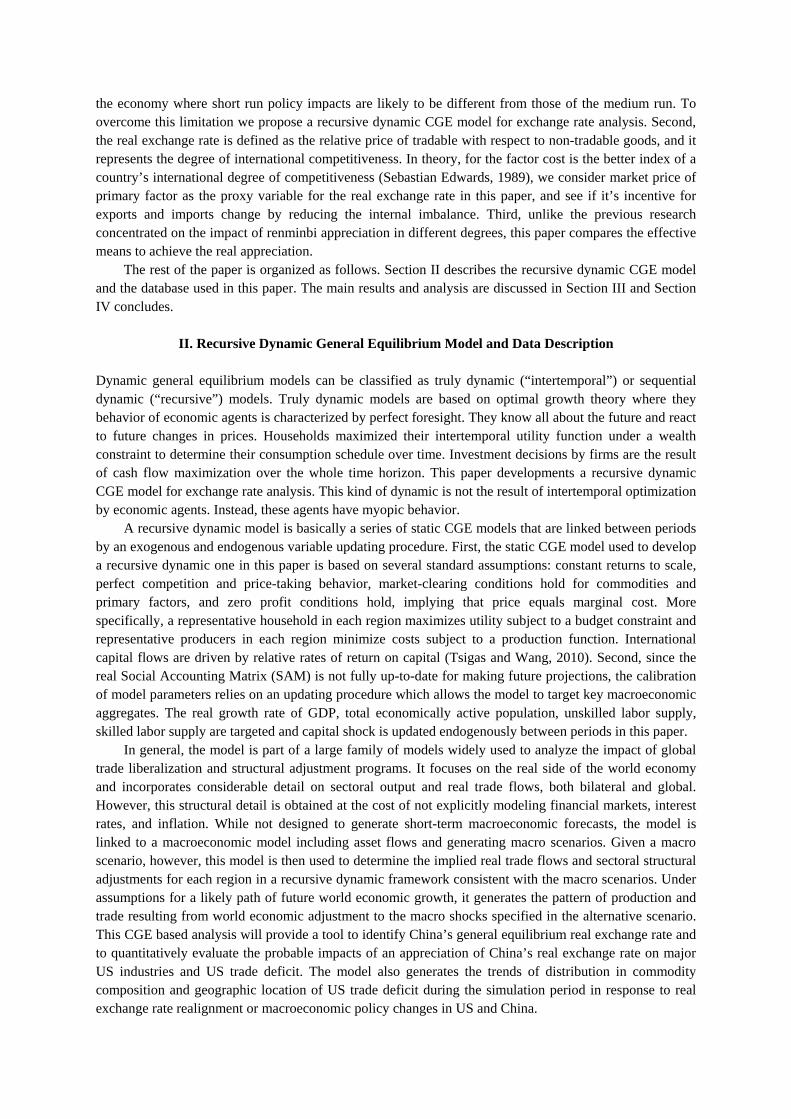
Globalization has not only boosted China’s economic growth, but has also deepened the linkage between China and the world. Renminbi adjustment will also affect the economy of other countries. The following figure 7 indicates the changes of terms of trade of different countries and regions relative to the baseline. With the real exchange rate appreciated approximately 2.5 percent annual by the shock of national saving rate in the next 5 years (figure 7 (a)), China’s terms of trade will be improved by higher export price and lower import price. Meanwhile, the scenario results imply that the price of imported goods compared with exports will be larger for the US, South Asian countries, the rest of East Asian countries, Brazil, India, Korea, Chinese Taipei, EU15, Japan, etc. In addition to Hong Kong, the terms of trade of the countries present the deterioration trend in the next decade which can be explained by the fact that, first, to the industrialized countries such as US, EU15, Korea Japan etc., the imports of consumption goods with lower substitution from China will become more expensive, and the intermediated inputs exported to China by the multinational corporations of the developed countries will become cheaper, the terms of trade will decline in these countries. Second, to the developing countries, as FDI outflow from China to other countries increases, structure of global supply chain is changing accordingly, we are very likely start to see the Sino-US bilateral trade imbalance decline in next decades, while China's surplus with other developing country such as Viet Nam, Malaysia, Philippines and other Asian less developing countries will start to increase and US bilateral deficient with these countries may increase at the same time as the manufacturing assembling activities move from China to these countries. After renminbi appreciation, the terms of trade
4 The Association of Southeast Asian Nations, or ASEAN, was established on 8 August 1967 in Bangkok, Thailand, the member of ASEAN including Indonesia, Malaysia, Philippines, Singapore, Thailand, Viet Nam, Lao PDR, Myanmar and Brunei Darussalam.
of these developing countries will be effected by the increase of labor-intensive industries’ transfer cost. Third, to Hong Kong, in 2004, Hong Kong has become the first offshore market to launch renminbi deposit-taking business, in this connection, the terms of trade changes in Hong Kong with a high degree of correlation to China. The impact of real appreciation created by increasing the wage rate of China has limited effect on other countries’ terms of trade (figure 7 (b)).
Figure 7 the percentage deviation of the two policy lines from baseline: the terms of trade with different countries
(a) shock by national saving rate (b) shock by the wage rate
0.90
0.95
1.00
1.05
1.10
AU
SNZ
BR
AC
AN
CH
NEU
12EU
15H
KG
IDN
IND
JPN
KO
RM
EXM
YS
PHL
RO
AR
OH
RO
WR
US
SGP
RSA
THA
TWN
USA
VN
MR
EA ZAF
2012 2013 2014
2015 2016 2017
2018 2019 2020
0.90
0.95
1.00
1.05
1.10
AU
SNZ
BR
AC
AN
CH
NEU
12EU
15H
KG
IDN
IND
JPN
KO
RM
EXM
YS
PHL
RO
AR
OH
RO
WR
US
SGP
RSA
THA
TWN
USA
VN
MR
EA ZAF
2012 2013 2014
2015 2016 2017
2018 2019 2020
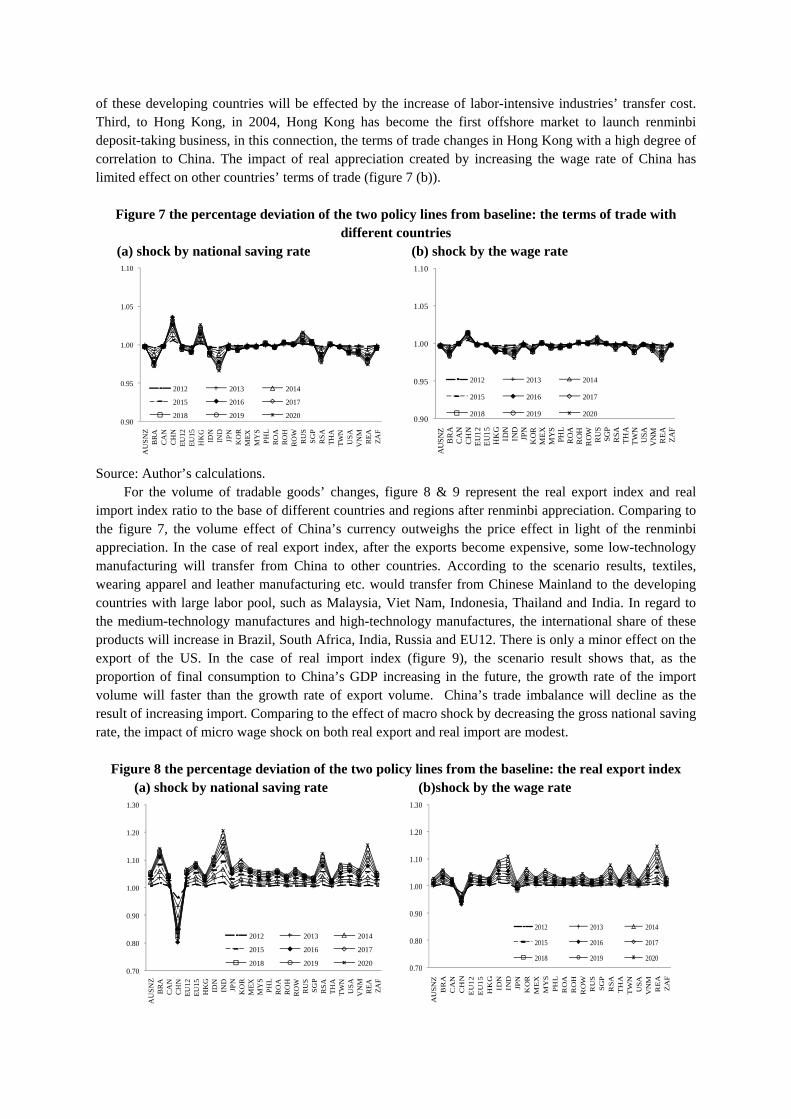
Source: Author’s calculations. For the volume of tradable goods’ changes, figure 8 & 9 represent the real export index and real import index ratio to the base of different countries and regions after renminbi appreciation. Comparing to the figure 7, the volume effect of China’s currency outweighs the price effect in light of the renminbi appreciation. In the case of real export index, after the exports become expensive, some low-technology manufacturing will transfer from China to other countries. According to the scenario results, textiles, wearing apparel and leather manufacturing etc. would transfer from Chinese Mainland to the developing countries with large labor pool, such as Malaysia, Viet Nam, Indonesia, Thailand and India. In regard to the medium-technology manufactures and high-technology manufactures, the international share of these products will increase in Brazil, South Africa, India, Russia and EU12. There is only a minor effect on the export of the US. In the case of real import index (figure 9), the scenario result shows that, as the proportion of final consumption to China’s GDP increasing in the future, the growth rate of the import volume will faster than the growth rate of export volume. China’s trade imbalance will decline as the result of increasing import. Comparing to the effect of macro shock by decreasing the gross national saving rate, the impact of micro wage shock on both real export and real import are modest.
Figure 8 the percentage deviation of the two policy lines from the baseline: the real export index (a) shock by national saving rate (b)shock by the wage rate
0.70
0.80
0.90
1.00
1.10
1.20
1.30
AU
SNZ
BR
AC
AN
CH
NEU
12EU
15H
KG
IDN
IND
JPN
KO
RM
EXM
YS
PHL
RO
AR
OH
RO
WR
US
SGP
RSA
THA
TWN
USA
VN
MR
EA ZAF
2012 2013 2014
2015 2016 2017
2018 2019 2020
0.70
0.80
0.90
1.00
1.10
1.20
1.30
AU
SNZ
BR
AC
AN
CH
NE
U12
EU
15H
KG
IDN
IND
JPN
KO
RM
EX
MY
SPH
LR
OA
RO
HR
OW
RU
SSG
PR
SAT
HA
TW
NU
SAV
NM
RE
AZ
AF
2012 2013 2014
2015 2016 2017
2018 2019 2020

Source: Author’s calculations.
Figure 9 the percentage deviation of the two policy lines from the baseline: the real import index (a) shock by national saving rate (b)shock by the wage rate
0.70
0.80
0.90
1.00
1.10
1.20
1.30
AU
SNZ
BR
AC
AN
CH
NE
U12
EU
15H
KG
IDN
IND
JPN
KO
RM
EX
MY
SPH
LR
OA
RO
HR
OW
RU
SSG
PR
SAT
HA
TW
NU
SAV
NM
RE
AZ
AF
2012 2013 2014
2015 2016 2017
2018 2019 2020
0.70
0.80
0.90
1.00
1.10
1.20
1.30
AU
SNZ
BR
AC
AN
CH
NE
U12
EU
15H
KG
IDN
IND
JPN
KO
RM
EX
MY
SPH
LR
OA
RO
HR
OW
RU
SSG
PR
SAT
HA
TW
NU
SAV
NM
RE
AZ
AF
2012 2013 2014
2015 2016 2017
2018 2019 2020
Source: Author’s calculations.
IV. Conclusion Since the global economic crisis which began in 2007, the possible undervaluation of China’s exchange rate has been a focus in the debate on the global policy mix. The issue of renminbi exchange rate policy will not disappear as long as the Obama government still faces an unemployment problem, the global economy remains imbalanced and the renminbi exchange rate stays short of free float. The argument between the two largest economies of the world-US and China will likely continue.
The fundamental factors of the US and China that determined the commodities of trade pattern during the 1980s to the 1990s can be explained by the concept of comparative advantage. China, with an abundant low-cost labor force, exports labor-intensive goods with low value-added, such as textiles, clothing and footwear to the US, whereas the US exports high-technology and high value-added products, such as aircraft, to China. However, after 2000, the current bilateral trade imbalance between China and US became dominated by a structural force, i.e. the effect of global supply chain. Many other countries, especially those countries in East Asia, began to export their value-added products through China since earlier 1990s. Using a recursive dynamic CGE model to conduct a comprehensive assessment of the microeconomic aspect of Sino-US trade imbalance, we get that, first, Sino-US trade balance will continue to deteriorate to some extent for imported Chinese goods as US is likely to be inelastic, and the US trade deficit will be not improved if the fundamental problem is not solved. Second, some contracts for labor-intensive manufactures would transfer from China to other Asian developing countries to take advance of lower labor costs. Third, the effects of currency appreciation depend on the extent of domestic and foreign content in a country’s trade: the lower content of domestic value-added embodied in exports, the less effect of renminbi appreciation on export growth will be. Given the low level domestic value-added share in China’s exports, an appreciation of the renminbi may not have as significant an impact as many analysts anticipate.
The Sino-US imbalance can also be explained by China’s large ongoing net saving surplus, which somehow has to be financed by lending to the US. Some scholars believe that the Sino–US trade imbalance can only be corrected in the long term if China’s net savings fall, such as happened with Japan in 1970s and the Asian Tigers in 1980s. Specifically, the saving rate of Japan reached its peak of 40.4 percent in 1970 and dropped to the lowest 20.7 percent in 2009. Similar to the situation of Japan, Taiwan’s saving rate dropped from 38.5 percent in 1987 to approximately 25 percent in 2010. The historical experience shows that it’s easy for developing countries to have a higher savings rate during the process of catch-up, and the high saving rate will continue to maintain for some time and then decline gradually.

Comparing to the real appreciation created by the increasing of wage rate, the decreasing of gross national saving rate will help to rebalance China’s trade account and improve the Chinese terms of trade in the next decade, however, in the short run, the imbalance is mainly embodied in the trade structure, especially in bilateral trade of high-technology products between China and US.
According to the scenario result by the recursive dynamic GGE model, the real exchange rate appreciation cannot reduce the Sino-US trade imbalance significantly in the short-term. Comparing to the shock by the macro-factor of gross national saving rate, correcting the distortion of factor market plays the limited role in reducing the Sino-US imbalance. If the saving glut is indeed the cause, and the saving-investment gap is structural, China’s external imbalance will not disappear any time soon. Renminbi appreciation will not solve the fundamental problem of the Sino–US trade imbalance and create more job opportunities in the US labor market. China’s large current account surplus is not only related to the value of Chinese currency but also to industrial structure. To prevent a capital bubble and to ensure stable economic development, China should speed up the reform of the renminbi exchange rate formation mechanism and promote industrial upgrading.
Reference Ando, M. and Kimura, F., 2003, The formation of international production and distribution networks in
East Asia, National Bureau of Economic Research Working Paper, No. 1016, Cambridge, Massachusetts.
Amiti, Mary and Wei, Shang-Jin, 2005, Fear of Service Outsourcing: Is it Justified? Economic Policy, Vol.20, No.42, 308-347.
Barry Eichengreen and Hui Tong, 2011, “The impact of Chinese Exchange Rate Policy on the Rest of the World: Evidence from Firm-Level Data”, NBER working paper, [online; cited 17 Feb., 2011]. Available from: www.nber.org/public_html/confer/2011/IFMs11/Eichengreen_Tong.pdf.
Bergsten, C. Fred, 2010, “Correcting the Chinese exchange rate: An action plan,” Speeches, Testimony Papers, Peterson Institute for International Economics [online; cited 15 Sept. 2010]. Available from: http://www.piie.com/publications/pubs_year.cfm?ResearchTypeID=7&ResearchYear=2010.
Evenett, Simon J. and Joseph Francois, 2010, “Will Chinese revaluation creates American jobs?” [online; cited 23 April 2010]. Available from: http://www.voxeu.org/index.php?q=node/4931.
Fair, Ray C., 2010, “Estimated macroeconomic effects of a Chinese yuan appreciation,” Cowls Foundation Discussion Paper No.1755, Yale University [online; cited 11 March 2010]. Available from: http://cowles.econ.yale.edu/.
Gagnon, Joseph E., 2010, “Comment on ‘Will Chinese Revaluation Create American Jobs?’ By Evenett and Grancois,” [online; cited 30 April 2010] Available from: http://www.voxeu.org/index.php?q=node/4964.
Huang, Yiping and Kunyu Tao, 2010, Causes and Remedies of China’s Current Account Surpluses, CCER working paper No.2010002, 25 Feb., China Center for Economic Research, Peking University, Beijing.
Krugman, Paul, 2010, “Chinese New Year,” New York Times, 1 January [online; cited 1 January 2010]. Available from:http://www.nytimes.com/2010/01/01/opinion/01krugman.html.
Li Xin, Xu Dianqing, 2011, “Quantifying the Impact of RMB Appreciation by CGE Model”, China & World Economy,Vol.19, No.2, pp.19-39.
McKibbin, Warwick J. and Jeffrey Sachs, 1991, Global Linkages: Macroeconomic Interdependence and Cooperation in the World Economy, Washington, DC: The Brookings Institution Press, pp. 121–43.
McKinnon, Ronald and Gunther Schnabl, 2009, “The case for stabilizing China’s exchange rate: Setting the stage for fiscal expansion,” China & World Economy, Vol. 17, No.1, pp. 1–32.
Sebastian Edwards, 1989, Exchange Rate Misalignment in Developing Countries. The World Bank Research Observer, Vol.4, No.1, pp: 3-21.

Scott, Robert E., 2010, “Unfair China trade costs local jobs,” Economic Policy Institute Briefing Paper No.
260, [online;cited 23 March 2010]. Available from: http://www.epi.org/publications/entry/bp260/.
Zhang Jian, Hung-Gay Fung and Donald Kummer, 2006, “Can RMB appreciation reduce the US trade deficit?” China & World Economy, Vol. 14, No. 1, pp. 44–56.
Tsigas, Marinos E. and Zhi Wang, 2010, “A general equilibrium analysis of the China–ASEAN free trade agreement,” Global Trade Analysis Project Resource No.3357 [online; cited 1 October 2010]. Available from: https://www.gtap.agecon.purdue.edu/resources/res_display.asp?RecordID=3357.
Wang, Zhi, Marinos E.Tsigas, Jesse More, Xin Li and Daniel Xu, 2010, “A time series database for global trade, production and consumption linkage,” Global Trade Analysis Project Resource No. 3391 [online; cited 15 April 2010]. Available from: https://www.gtap.agecon.purdue.edu/resources/res_display.asp?RecordID=3391.
OECD, 2011, “ISIC Rev.3 Technology Intensity Definition”, OECD Directorate for Science, Technology and Industry, Economic Analysis and Statistics Division [online; cited 7 July 2011]. Available from: www.oecd.org/dataoecd/43/41/48350231.pdf.


