The Effect of Changes in Medicare's Payment Rates on the Volume of
22
MMRR 2011: Volume 1 (3) White, C., Nguyen, N. E1 Medicare & Medicaid Research Review 2011: Volume 1, Number 3 A publication of the Centers for Medicare & Medicaid Services, Center for Strategic Planning How Does the Volume of Post-acute Care Respond to Changes in the Payment Rate? Chapin White¹ and Nguyen Nguyen ¹ Center for Studying Health System Change ² ²Department of Health and Human Services Objective: Measure the effect of changes from 1997 to 2001 in Medicare's payment rates for skilled nursing facilities (SNFs) on the volume of SNF services and services in other settings. Methods: This study uses as its source of variation in payment rates the substantial changes that occurred as a result of the Balanced Budget Act of 1997. SNF volume equals the number of Medicare-covered SNF days per fee-for-service beneficiary per year, measured at the level of the hospital service area. Results: The estimated elasticity of SNF volume with respect to SNF payment rates is 0.13, meaning that an increase in SNF payment rates is associated with an increase in SNF volume and a decrease in payment rates is associated with a decrease in volume—this implies that SNFs exhibit a normal supply curve, consistent with standard economic theory. In an extension of our main analysis, we find that volume changes appear to be driven largely by facility openings and closures. Among facilities that remained open throughout the study period, volume responses were influenced by changes in the number of admissions (rather than length of stay) and changes in payer mix (rather than changes in capacity). We also find that changes in SNF volume primarily reflect net changes in total days of Medicare-covered institutional care, rather than substitution of one setting for another. Keywords: Medicare, volume response, supply, skilled nursing facility doi: http://dx.doi.org/10.5600/mmrr.001.03.a01
Transcript of The Effect of Changes in Medicare's Payment Rates on the Volume of

MMRR 2011: Volume 1 (3)
White, C., Nguyen, N. E1
Medicare & Medicaid Research Review 2011: Volume 1, Number 3
A publication of the Centers for Medicare & Medicaid Services,
Center for Strategic Planning
How Does the Volume of Post-acute Care Respond to Changes in the Payment Rate?
Chapin White¹ and Nguyen Nguyen¹ Center for Studying Health System Change
²
²Department of Health and Human Services Objective: Measure the effect of changes from 1997 to 2001 in Medicare's payment rates for skilled nursing facilities (SNFs) on the volume of SNF services and services in other settings. Methods: This study uses as its source of variation in payment rates the substantial changes that occurred as a result of the Balanced Budget Act of 1997. SNF volume equals the number of Medicare-covered SNF days per fee-for-service beneficiary per year, measured at the level of the hospital service area. Results: The estimated elasticity of SNF volume with respect to SNF payment rates is 0.13, meaning that an increase in SNF payment rates is associated with an increase in SNF volume and a decrease in payment rates is associated with a decrease in volume—this implies that SNFs exhibit a normal supply curve, consistent with standard economic theory. In an extension of our main analysis, we find that volume changes appear to be driven largely by facility openings and closures. Among facilities that remained open throughout the study period, volume responses were influenced by changes in the number of admissions (rather than length of stay) and changes in payer mix (rather than changes in capacity). We also find that changes in SNF volume primarily reflect net changes in total days of Medicare-covered institutional care, rather than substitution of one setting for another.
Keywords: Medicare, volume response, supply, skilled nursing facility
doi: http://dx.doi.org/10.5600/mmrr.001.03.a01
MMRR 2011: Volume 1 (3)
White, C., Nguyen, N. E2
1. Introduction and Background
In its role as a purchaser of health care services, the Medicare program sets the payment rates for a significant share of the overall output of the U.S. health care system. One of the more straightforward questions relating to Medicare's payment rates is how changes in the level of payment rates affect the volume of services provided (the "volume response"). Several researchers have addressed that question in the physician setting—see, for example, Gruber, Kim, and Mayzlin (1999), Mitchell, Hadley, and Gaskin (2000), Nguyen and Derrick (1997), and Yip (1998)
Reductions in Medicare payment rates are perhaps the most common approach used by Congress to generate budgetary savings in the Medicare program. Understanding the volume response to such reductions is critical for estimating their effects on the federal budget. If reductions in payment rates lead to reductions in volume, then the volume response would tend to magnify the budgetary savings; conversely, if reductions in payment rates lead to increases in volume, then budgetary savings could be offset. On a broader level, understanding volume responses is fundamental to understanding whether reductions in payment rates "work;" i.e., whether they actually reduce spending in the Medicare program and system-wide. Reductions in Medicare payment rates might not reduce overall spending if they either (a) increase the volume of the Medicare-covered service, (b) increase the volume of substitute types of Medicare-covered care, or (c) increase care covered by other payors. This study directly addresses all three of these possibilities.
—but the question has not been adequately addressed in other health care settings.
This paper examines the changes in the volume of services provided in response to a change in the payment rates medical providers receive per unit of service, holding all else constant. The analysis focuses on skilled nursing facilities (SNFs) for several reasons. First, the SNF setting differs dramatically from the physician setting in terms of organizational objectives and likely behavioral responses. The analysis of SNF behavior, therefore, provides an informative counterpoint to the previous analyses of physician behavior. Second, over the past decade, Medicare's payment rates for SNFs have been heavily impacted by legislative changes, which provides a good opportunity for identifying SNF responses. Third, SNFs and other acute and post-acute providers have been hypothesized to be relatively close substitutes for each other, which allows examination of spillover effects of changes in SNF payment rates on utilization in other settings.
2. Previous Empirical Literature on Volume Responses
Previous work on volume responses in institutional settings consistently finds positive volume responses, meaning that volume and payment rates move in the same direction, but that research has not identified the mechanisms by which volume adjusts. A recent background
MMRR 2011: Volume 1 (3)
White, C., Nguyen, N. E3
paper by the Congressional Budget Office (CBO) estimated the SNF volume response using two complementary approaches—one analysis measured changes in volume and payment rates at the geographic level, and the other measured changes at the provider level (Congressional Budget Office, 2007). Both of those approaches indicate that the volume of Medicare-covered SNF services varies positively with the payment rate. The data used in this paper, and the general approach, are based on the geographic-level analysis in CBO’s background paper. Another study in the post-acute setting linked changes in the use of home health care to changes in the level of payment (McKnight, 2004). The supply of various types of post-acute care services has also been shown to be an important factor in determining post-acute utilization patterns (Buntin, Garten, Paddock, Saliba, & Totten, 2004), and changes in Medicare payment rates have been shown to affect the supply of hospital-based SNF services (White & Seagrave, 2005).
In the hospital setting, a large volume of research has examined the effects of changes in Medicare's payments on the costs and quality of care, but almost none of it has directly examined the volume response. One exception is Dafny (2005), who examined hospitals' volume response to changes in Medicare payment rates and found that increases in payment rates were associated with large and statistically significant increases in the volume of admissions.
3. Skilled Nursing Facilities and Changes in Medicare Payments
Medicare beneficiaries are eligible for SNF care if they need daily nursing or rehabilitation services and if they have recently had a stay of at least three days in a short-stay hospital. According to the Medicare Payment Advisory Commission (2006)
SNFs are of two types: hospital-based, which are located within acute-care hospitals, and freestanding, which operate within freestanding nursing facilities. Because of the important differences between hospital-based and freestanding SNFs, much of the analysis that follows will treat those two types of facilities separately. Hospital-based SNFs tend to provide relatively short stays for residents who have a high likelihood of returning to the community, and they tend to have a Medicare-heavy patient population. Freestanding SNFs, on the other hand, tend primarily to care for Medicaid and private-pay patients, and patients who are likely to remain in a long-term care facility after their SNF stay. Hospital-based SNFs, like their parent organizations, are predominantly nonprofit, whereas most freestanding SNFs are for-profit.
, in 2003 around 15,000 SNFs were certified to provide Medicare-reimbursable care, and they provided in total around 60 million resident-days of care.
3.1. SNFs and Other Post-Acute Settings
SNFs are one of the major sources of post-acute care, but post-acute services are provided in several other settings: inpatient rehabilitation facilities, home health, and long-term care hospitals. Buntin et al. (2004) showed that there are many clinical situations in which a patient could potentially be discharged to one or another post-acute care setting. In addition, some
MMRR 2011: Volume 1 (3)
White, C., Nguyen, N. E4
patients could, instead of being discharged to a post-acute care setting, receive some rehabilitation services in the acute care hospital, and then be discharged directly home. The fact that the various acute and post-acute care settings may serve as substitutes for each other implies that changing SNF payment rates might not just affect the volume of SNF services, but might also have spillover effects on the number of days of short-stay hospital care and also the number of days spent in post-acute care settings other than SNFs.
3.2. Medicare Payments to SNFs
Medicare's payment rates for SNFs changed dramatically as a result of the Balanced Budget Act of 1997 (BBA). It is those changes in payment rates that are used to identify the SNF volume response. Historically, Medicare reimbursed SNFs for the costs they incurred, with fairly generous limits on routine nursing costs. In response to rapid increases in Medicare SNF spending during the early and mid 1990s, the Congress mandated in the BBA that a new prospective payment system (PPS) be put in place. Under the PPS, payments for each resident-day are not determined by SNFs' costs, but are instead determined by a payment formula based on a national payment rate combined with an estimate of the individual resident's resource needs and a measure of local input prices.
Due to the BBA, average nominal Medicare payments per SNF day fell between 1998 and 1999 by about 10 percent (Medicare Payment Advisory Commission, 2004). In Congress, the perception was that the BBA had cut Medicare payments too deeply for SNFs and other providers. As a result, Congress passed the Balanced Budget Refinement Act of 1999 (BBRA) and the Medicare, Medicaid, and SCHIP Benefits Improvement and Protection Act of 2000 (BIPA). Both the BBRA and BIPA called for broad-based increases in Medicare payments to SNFs. As a result, by 2001, average real Medicare payments per SNF day had returned roughly to their pre-BBA levels.
For a typical SNF, the effects of the BBRA and BIPA were more than overshadowed by the shift in the BBA from cost reimbursement to prospective payment based on national rates. Many SNFs experienced sharp declines in average Medicare payments per resident-day (even after the BBRA and BIPA), while many other SNFs experienced sharp increases. The changes in payment rates that individual SNFs received reflects a compression effect. The cost reimbursement system for SNFs allowed wide variation in costs per resident-day, whereas the new PPS used a national base payment rate. The new PPS, although it allows variation in payment rates based on residents' clinical characteristics and on local input prices, resulted in much less variation in payment rates across SNFs than was observed under cost reimbursement. As a result, shifts in average payment rates vary more widely across SNFs than they do over time.
The shift from cost reimbursement to the new PPS altered both average payment rates and marginal payments. As Hodgkin and McGuire (1994) make clear, both of those aspects of payment policy will, in theory, affect volume and intensity. For several reasons, we focus just on the effects on volume of average payment rates. First, SNFs varied widely in the changes they

MMRR 2011: Volume 1 (3)
White, C., Nguyen, N. E5
experienced in average payment under the PPS, whereas marginal payments to SNFs were impacted uniformly by the PPS (incurring higher costs for Medicare patients no longer generated higher payments). While it is possible to identify some variation across SNFs in the change in marginal payments (either from the timing of the switch to PPS, or Medicare patients as a share of the patient population), it is analytically very challenging to isolate the effects of marginal payment changes on volume. Second, the direction of the relationship between average payments and volume is, in theory, unambiguous (higher average payments should increase volume, regardless of organizational objectives), whereas the direction of the relationship between marginal payments and volume is indeterminate and depends on a mix of supply and demand factors. Third, the average payment rate is highly relevant to policymakers going forward. The default annual update formula for SNFs was permanently adjusted downward by the Patient Protection and Affordable Care Act. If history is any guide, those updates will continue to be revised frequently.
Previous literature on SNFs' responses to the PPS contain results of studies that have examined the effects of both the marginal changes and average changes, and have mostly focused on staffing and quality of care. White (2003) and Wodchis (2004) show that the levels of rehabilitation therapy provided were altered under PPS to maximize SNF profitability. Two studies—Konetzka, Yi, Norton, and Kilpatrick (2004) and White (2005-2006)—show that prospective payment, and the associated elimination of marginal reimbursement for most clinical services, was associated with reductions in nurse staffing. Those studies also both find an increase post-PPS in "deficiencies" (i.e., reported incidents of substandard care). Evidence for changes in health outcomes is much weaker—both Wodchis, Fries, and Hirth (2004-2005) and White (2005-2006) test for, but do not find, evidence of deterioration in outcomes under PPS. The Congressional Budget Office (2007), the only study that directly assesses the SNF volume response, finds that increases in SNF payment rates are associated with increases in volume. That study leaves unanswered, however, the question of how SNFs accomplished those volume changes, and whether changes in SNF volume were associated with offsetting changes in use of substitute forms of post-acute care.
4. Methods
We use two approaches for measuring changes in SNF payment rates and the utilization of health care: a geographic-level analysis and a provider-level analysis. In the geographic-level analysis, Medicare beneficiaries are assigned to hospital services areas (HSAs) and volume is measured at the HSA-level as SNF days per beneficiary. HSAs, which are defined by the Dartmouth Institute for Health Policy & Clinical Practice, are small geographic regions defined based on short-stay hospital utilization patterns. In all of the geographic-level analyses, the measure of volume is days of Medicare-covered care per beneficiary per year. In the provider-level analysis, on the other hand, volume is measured as SNF days per SNF. The geographic-level

MMRR 2011: Volume 1 (3)
White, C., Nguyen, N. E6
analysis is used to measure the SNF volume response and spillover effects, whereas the provider-level analysis is used to analyze the mechanisms by which SNFs adjust the volume of services they provide (e.g., changes in number of beds, or patient mix).
A key advantage of the geographic-level analysis is that it measures volume responses net of spillovers among SNFs. To illustrate the potential role of spillovers in the analysis, an example is useful. Suppose beneficiaries in an HSA receive their care from two SNFs, and that the payment rate decreases for one SNF and remains constant for the other. Suppose, further, that the SNF facing decreased payments closes its doors. The geographic-level change in payment rates would be negative, because it would blend together the changes for the two SNFs. If, in the case of a full spillover, all of the patients who would have gone to the closing SNF are merely shifted to the other SNF, the geographic-level analysis would show no change in volume and no relationship between volume and changes in payment rates. The geographic-level analysis would only pick up volume changes that are not offset by spillovers; therefore, it is the appropriate approach for assessing the impacts of payment changes on beneficiaries' receipt of care and on Medicare spending on SNFs.
In both sets of analyses, the volume measures are based solely on the number of SNF days. That approach does not capture any changes in casemix or the intensity of services. Several studies have already examined the effects of Medicare’s SNF payment policy on the intensity of rehabilitation therapy (Hutt et al. 2001; U.S. General Accounting Office 2002; White 2003; Yip, Wilber, & Myrtle 2002
All analyses use a long-differences approach where the arc percent change in SNF volume (or another measure of interest) is regressed on the arc percent change in SNF payment rates. All changes are measured over the period from 1997 to 2001. The year 1997 was chosen as the baseline, because it was the last full year under cost reimbursement. The year 2001 was chosen for two reasons. The first reason is that the BBA called for a three-year phase-in during which SNFs received a blend of the national payment rates and a SNF-specific rate based on historical costs. As a result, 2001 is the first year in which the new national rates were the primary determinants of SNFs’ payments. The second reason is that we wanted to allow time for SNFs to be able to respond to the new payment environment. Delayed responses are possible due, for example, to organizational inertia, uncertainty, and multi-year contractual relationships.
).
The basic regression specification used to identify the SNF volume response is:
hhHSA
hHSAh XPQ εγβ ++∆=∆
where h indexes HSAs, HSAhQ∆ represents the arc percent change in SNF volume, HSA
hP∆ represents the arc percent change in Medicare’s SNF payment rate, β identifies the elasticity of SNF volume with respect to SNF payment rates, and Xh
HSAhQ∆ and HSA
hP∆ represents a vector of HSA-level control
variables. (The method used to calculate is described in detail in the

MMRR 2011: Volume 1 (3)
White, C., Nguyen, N. E7
Appendix.) The control variables, Xh
In a separate set of analyses, we decompose changes in utilization into changes attributable to facility openings and closures versus changes attributable to adjustments in volume among facilities that remained open (see Appendix for details). We also measure changes in payment rates and utilization separately for hospital-based and freestanding SNFs (see Appendix for details). Those analyses include two separate measures of the arc percent changes in SNF payment rates, one for hospital-based SNFs and one for freestanding. By including the two separate measures of changes in SNF payment rates we can test for the presence of cross-price substitution effects.
, include a full set of state-fixed effects, and measures of urbanization (percent of the population living in an urban area) and per capita income. Both urbanization and per capita income are based on county-level measures from the 2000 Census. These county-level measures are converted to HSA-level measures using a Medicare-specific crosswalk. The inclusion of the state-fixed effects allows for differential time trends at the state level, which is important given the large influence that state-level Medicaid policy changes have on the availability of nursing facility care. The inclusion of the urbanization and income controls allows for differential time trends in SNF utilization in rural versus urban areas, and in high- versus low-income areas.
We also test for spillover effects of SNF payment rates on the volume of inpatient services provided in non-SNF settings, including short-stay hospitals, inpatient rehabilitation facilities, and long-term care hospitals. Ideally, we would also test for spillover effects on home health utilization, but regrettably we did not have access to the necessary micro level linkable data on Medicare home health utilization. (The existing evidence suggests that SNF-home health spillovers are very minor, but that evidence, from White and Seagrave (2005), is based only on the effects of closures of hospital-based SNFs.) In the spillover analyses, the specification was the same as in the basic geographic-level SNF analysis, but using the alternative measures of utilization (all measured in units of days per beneficiary per year).
4.3. Provider-level analyses
An additional set of SNF-level analyses are used to examine the mechanisms by which SNFs adjust the volume of services provided. It is important to note that these provider-level analyses only include SNFs that were open throughout 1997 and 2001. The results of the provider-level analyses, therefore, only address the question of the mechanism by which volume adjusted among SNFs that remained open.
The basic regression specification for those SNF-level analyses is:
jjSNFj
SNFj XPZ ηλφ ++∆=∆
MMRR 2011: Volume 1 (3)
White, C., Nguyen, N. E8
where j indexes SNFs, SNFjZ∆ represents the arc percent change in the SNF-level outcome of
interest, SNFjP∆ represents the SNF-level arc percent change in payment rates, and Xj
SNFjZ∆
represents
a set of SNF-level control variables. The SNF-level outcomes of interest, , are changes in the number of beds, occupancy, the Medicare share (i.e., Medicare-covered SNF days as a share of all resident days), Medicare admissions, and Medicare length of stay.
These SNF-level regressions only include SNFs that were open in both 1997 and 2001. The SNF-level results, therefore, provide more details on how those SNFs that remained open adjusted the volume of services. The geographic-level analysis provides information on how much of the change in volume is attributable to entry and exit, while the SNF-level analysis provides further details on the change in volume that is not attributable to entry and exit.
4.4. Data Sources
We use Medicare administrative files for information on beneficiaries' utilization of health care services, and for information on each SNFs' characteristics. Three types of data are used: stay-level, beneficiary-level, and provider-level. The Medicare Provider Analysis and Review (MEDPAR) provides the stay-level data. For each Medicare-covered stay in a hospital, SNF, or rehabilitation facility, the MEDPAR files include a beneficiary identifier and a provider identifier, the dates of the stay, Medicare's payments to the provider, and the beneficiary’s diagnosis. For beneficiary-level data, we use the Denominator files, which include beneficiary identifiers and information on where the beneficiary lives and basic demographics (age, sex, race). To calculate utilization of SNF and other services by HSA, we merge the 100% MEDPAR files with the 100% Denominator files for the years 1997 and 2001.
For provider-level data, we use the Online Survey, Certification, and Reporting (OSCAR) data, which include data on each SNF's number of beds, occupancy, and patient mix. The OSCAR data are gathered in conjunction with an annual inspection regimen, and represent point-in-time information. To increase somewhat the precision of the OSCAR-based measures, we generate 1997 measures using the average among all surveys occurring from July 1996 through June 1998 (typically one to three surveys). Similarly, to generate 2001 measures, we use the average among all surveys occurring from July 2000 through June 2002.
5. Results
5.1. Descriptive Statistics
Table 1 illustrates the changes between 1997 and 2001 in the utilization of SNF services (top panel) and Medicare payment rates (middle panel). At the national level, overall SNF payments and utilization were fairly stable from 1997 to 2001, but that stability at the aggregate level masks significant variation across different types of SNFs and across different geographic areas. The implementation of the new Medicare PPS led to a drop in the average inflation-adjusted

MMRR 2011: Volume 1 (3)
White, C., Nguyen, N. E9
Table 1. Skilled Nursing Facility (SNF) Descriptive Statistics, Medicare-Covered Days and Payments (means, standard deviations in parentheses)
Geographic-level Statistics 1997 2001 Number of hospital service areas (HSAs) 3,436 3,436 Utilization (volume)
Medicare-covered SNF days per beneficiary 1.36 (0.43) 1.35 (0.41)
Hospital-based 0.25 (0.21) 0.17 (0.17) Freestanding 1.11 (0.43) 1.18 (0.42)
Short-stay hospital days per beneficiary 1.86 (0.48) 1.80 (0.43) Inpatient rehabilitation facility days per beneficiary 0.10 (0.08) 0.10 (0.09) Long-term care hospital days per beneficiary 0.16 (0.15) 0.19 (0.19)
Payment rates
Medicare payments per SNF day $357 (79) $343 (39)
Hospital-based $463 (131) $350 (44) Freestanding $331 (69) $341 (39)
Simulated percent change from 1997 to 2001 in Medicare payment rates -4.7% (21.8) Hospital-based -29.8% (30.0) Freestanding 2.7% (19.6)
SNF-level Statistics Number of SNFs 14,720 14,742
Hospital-based 2,136 1,714 Freestanding 12,584 13,028 Medicare as share of patient-days 17.6%
(25.0) 15.2% (20.8)
Hospital-based 60.5% (36.4)
52.3% (36.1)
Freestanding 9.8% (10.1) 9.8% (8.9)
The geographic-level statistics are measured at the level of the hospital service area and are weighted by the number of fee-for-service beneficiaries living in the HSA. The standard deviations reflect variations across HSAs in the HSA-level measures of mean payments and utilization. Payments are inflated to the 4th quarter of 2003 using the SNF market basket. Source: Medicare Administrative and Claims Data, 1997-2001.
Medicare payment per SNF day from $357 in 1997 to $343 in 2001. The impact of the SNF PPS differed dramatically for hospital-based versus freestanding SNFs, however. Average payment

MMRR 2011: Volume 1 (3)
White, C., Nguyen, N. E10
rates for hospital-based SNFs declined from $463 to $350, whereas average payment rates for freestanding SNFs increased from $331 to $341. The simulated percent changes in payment rates follow the same patterns. Overall, the average change in simulated payment rates was modest (minus 4.7 percent), but this reflects the combination of a large decrease for hospital-based SNFs (minus 29.8 percent), and a slight increase for freestanding SNFs (plus 2.7 percent). The standard deviations in the changes in payment rates are relatively large (between 20 and 30 percentage points), which indicates a good deal of variation across geographic areas in the payment impacts.
5.2. Geographic Analysis of Changes in Volume
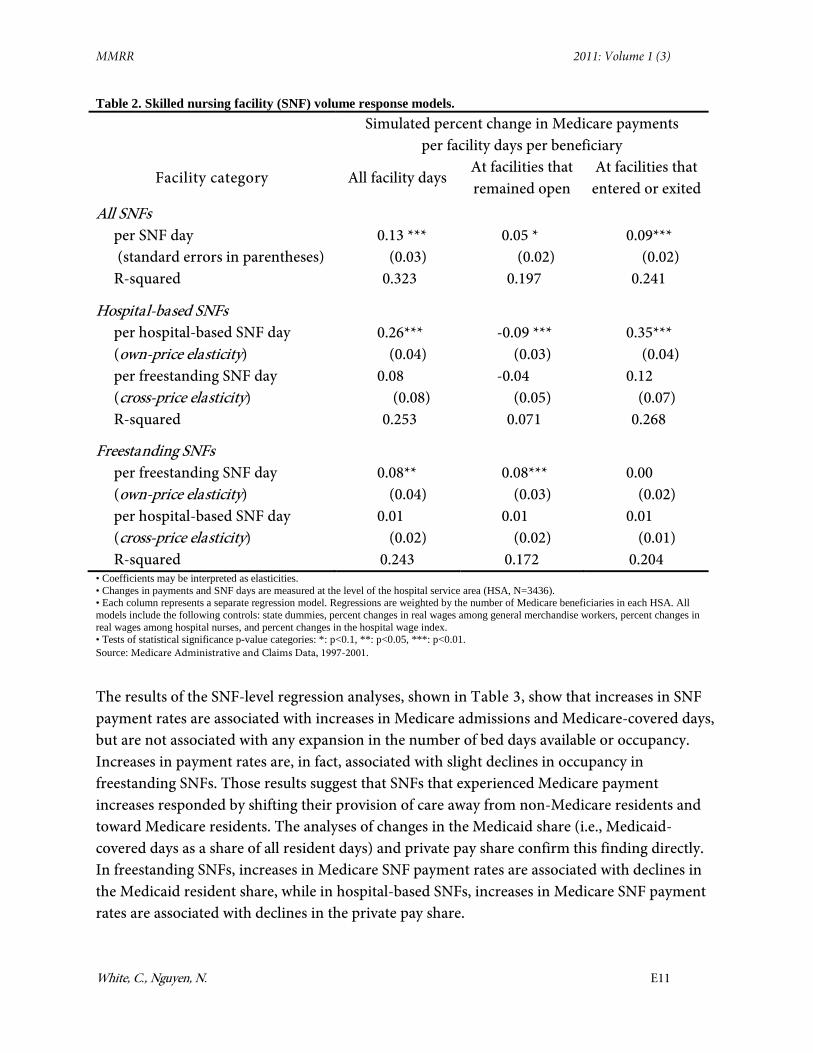
Table 2
The volume response among hospital-based SNFs provides some evidence that the closure of some hospital-based SNFs may have had spillover effects on hospital-based SNFs that remained open. The regression indicates that payment declines for hospital-based SNFs were associated with declines in the volume of hospital-based SNF care due to exit, but that those payment declines were also associated with increases in the volume of services provided by those hospital-based SNFs that remained open. One interpretation of that finding is that when hospital-based SNFs exited the market, any hospital-based SNFs remaining in the area faced an increased demand for SNF services, and increased their output accordingly.
presents the results from the HSA-level regression analyses of changes in utilization on changes in payment rates. Those analyses suggest that the overall SNF volume response, expressed as the elasticity of supply with respect to the payment rate, is 0.13 (p-value<0.0001), and that the volume response is significantly stronger for hospital-based SNFs (elasticity 0.26) than for freestanding SNFs (elasticity 0.08). The SNF volume response was associated with both entry and exit, and with changes in volume among SNFs that remained open. The mechanism differed sharply, however, for freestanding versus hospital-based SNFs. Among hospital-based SNFs, the volume response was related to entry and exit, whereas among freestanding SNFs the volume response was related to changes in volume among SNFs that remained open. The cross-price elasticity results provide no evidence of cross-price effects between freestanding and hospital-based SNFs.
5.3. SNF-level Analysis of Changes in Volume and Capacity
The main HSA-level results presented in Table 2 imply that the SNF volume response is partly attributable to entry and exit and partly attributable to changes in volume among SNFs that remained open throughout the period. That finding raises the question of how those SNFs that remained open throughout the period adjusted the volume of services they provided. To address that question, a set of SNF-level regression analyses were run including only those SNFs that remained open throughout the period.
MMRR 2011: Volume 1 (3)
White, C., Nguyen, N. E11
Table 2. Skilled nursing facility (SNF) volume response models. Simulated percent change in Medicare payments
per facility days per beneficiary
Facility category All facility days At facilities that remained open
At facilities that entered or exited
All SNFs per SNF day (standard errors in parentheses)
0.13 *** (0.03)
0.05 * (0.02)
0.09*** (0.02)
R-squared 0.323 0.197 0.241
Hospital-based SNFs per hospital-based SNF day (own-price elasticity)
0.26*** (0.04)
-0.09 *** (0.03)
0.35*** (0.04)
per freestanding SNF day (cross-price elasticity)
0.08 (0.08)
-0.04 (0.05)
0.12 (0.07)
R-squared 0.253 0.071 0.268
Freestanding SNFs per freestanding SNF day (own-price elasticity)
0.08** (0.04)
0.08*** (0.03)
0.00 (0.02)
per hospital-based SNF day (cross-price elasticity)
0.01 (0.02)
0.01 (0.02)
0.01 (0.01)
R-squared 0.243 0.172 0.204 • Coefficients may be interpreted as elasticities. • Changes in payments and SNF days are measured at the level of the hospital service area (HSA, N=3436). • Each column represents a separate regression model. Regressions are weighted by the number of Medicare beneficiaries in each HSA. All models include the following controls: state dummies, percent changes in real wages among general merchandise workers, percent changes in real wages among hospital nurses, and percent changes in the hospital wage index. • Tests of statistical significance p-value categories: *: p<0.1, **: p<0.05, ***: p<0.01. Source: Medicare Administrative and Claims Data, 1997-2001.
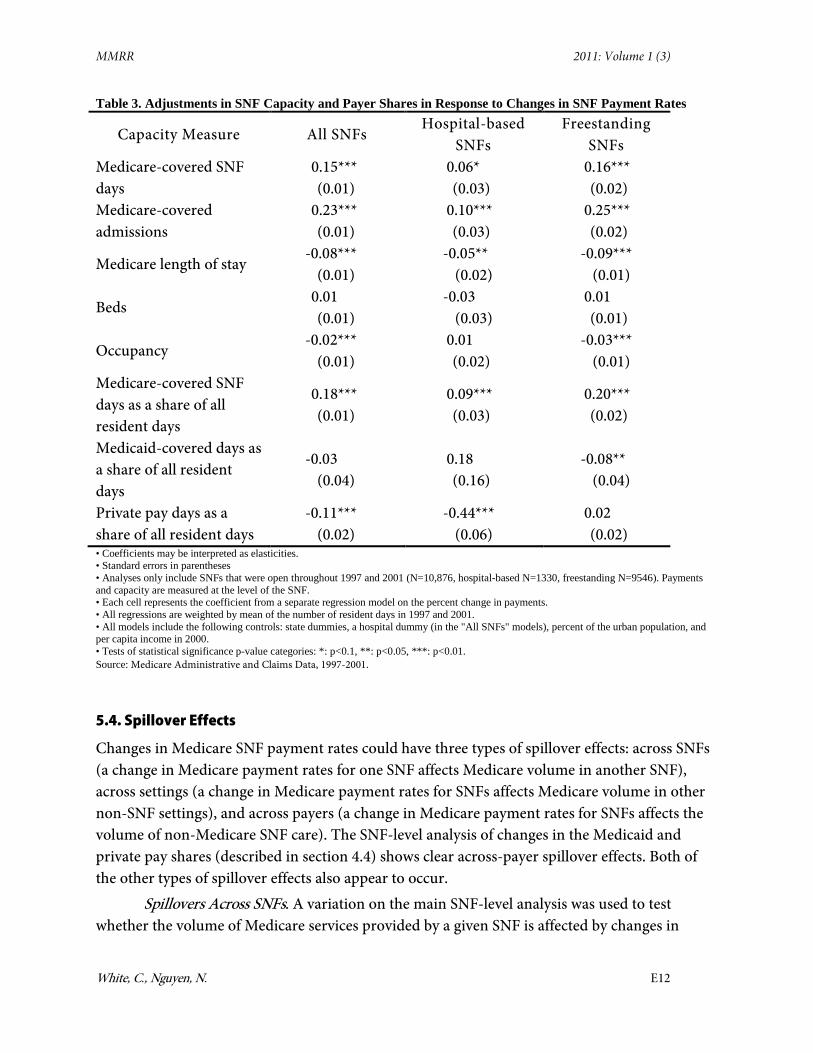
The results of the SNF-level regression analyses, shown in Table 3, show that increases in SNF payment rates are associated with increases in Medicare admissions and Medicare-covered days, but are not associated with any expansion in the number of bed days available or occupancy. Increases in payment rates are, in fact, associated with slight declines in occupancy in freestanding SNFs. Those results suggest that SNFs that experienced Medicare payment increases responded by shifting their provision of care away from non-Medicare residents and toward Medicare residents. The analyses of changes in the Medicaid share (i.e., Medicaid-covered days as a share of all resident days) and private pay share confirm this finding directly. In freestanding SNFs, increases in Medicare SNF payment rates are associated with declines in the Medicaid resident share, while in hospital-based SNFs, increases in Medicare SNF payment rates are associated with declines in the private pay share.
MMRR 2011: Volume 1 (3)
White, C., Nguyen, N. E12
Table 3. Adjustments in SNF Capacity and Payer Shares in Response to Changes in SNF Payment Rates
Capacity Measure All SNFs Hospital-based
SNFs
Freestanding SNFs
Medicare-covered SNF days
0.15*** (0.01)
0.06* (0.03)
0.16*** (0.02)
Medicare-covered admissions
0.23*** (0.01)
0.10*** (0.03)
0.25*** (0.02)
Medicare length of stay -0.08***
(0.01)
-0.05** (0.02)
-0.09*** (0.01)
Beds 0.01 (0.01)
-0.03 (0.03)
0.01 (0.01)
Occupancy -0.02***
(0.01)
0.01 (0.02)
-0.03*** (0.01)
Medicare-covered SNF days as a share of all resident days
0.18*** (0.01)
0.09*** (0.03)
0.20*** (0.02)
Medicaid-covered days as a share of all resident days
-0.03 (0.04)
0.18 (0.16)
-0.08** (0.04)
Private pay days as a share of all resident days
-0.11*** (0.02)
-0.44*** (0.06)
0.02 (0.02)
• Coefficients may be interpreted as elasticities. • Standard errors in parentheses • Analyses only include SNFs that were open throughout 1997 and 2001 (N=10,876, hospital-based N=1330, freestanding N=9546). Payments and capacity are measured at the level of the SNF. • Each cell represents the coefficient from a separate regression model on the percent change in payments. • All regressions are weighted by mean of the number of resident days in 1997 and 2001. • All models include the following controls: state dummies, a hospital dummy (in the "All SNFs" models), percent of the urban population, and per capita income in 2000. • Tests of statistical significance p-value categories: *: p<0.1, **: p<0.05, ***: p<0.01. Source: Medicare Administrative and Claims Data, 1997-2001.
5.4. Spillover Effects
Changes in Medicare SNF payment rates could have three types of spillover effects: across SNFs (a change in Medicare payment rates for one SNF affects Medicare volume in another SNF), across settings (a change in Medicare payment rates for SNFs affects Medicare volume in other non-SNF settings), and across payers (a change in Medicare payment rates for SNFs affects the volume of non-Medicare SNF care). The SNF-level analysis of changes in the Medicaid and private pay shares (described in section 4.4) shows clear across-payer spillover effects. Both of the other types of spillover effects also appear to occur.
Spillovers Across SNFs. A variation on the main SNF-level analysis was used to test whether the volume of Medicare services provided by a given SNF is affected by changes in

MMRR 2011: Volume 1 (3)
White, C., Nguyen, N. E13
payment rates for other SNFs in the same market. That analysis included an "own-SNF" change in the Medicare payment rate and an "other-SNF" change in the Medicare payment rate for competing SNFs in the same area. The results of that analysis indicate that the elasticity of SNF volume with respect to the "own-SNF" payment rate is 0.20 (p-value < 0.001) and that the elasticity of SNF volume with respect to the payment rate among competing SNFs in the same market is -0.07 (p-value < 0.05). This result indicates that a SNF that experiences no change in its Medicare payment rate will increase its volume somewhat if competing SNFs face a decline in payment rates.
Table 4. Spillover Effects of Changes in SNF Payments on Utilization of Other Settings Percent change in Medicare-covered days per beneficiary
(standard errors in parentheses)
Short-stay hospital
days
Inpatient rehabilitatio
n facility days
Long-term care
hospital days
All institutional
days
Simulated percent change in Medicare payments per SNF day
-0.01 (0.01)
-0.27*** (0.07)
-0.05 (0.07)
0.04*** (0.01)
R-squared 0.248 0.090 0.259 0.230 • Coefficients may be interpreted as elasticities. • Changes in payments and utilization are measured at the level of the hospital service area (HSA, N=3436). • Each column represents a separate regression model. Regressions are weighted by the number of Medicare beneficiaries in each HSA. All models include the following controls: state dummies, percent changes in real wages among general merchandise workers, percent changes in real wages among hospital nurses, and percent changes in the hospital wage index. • Tests of statistical significance p-value categories: *: p<0.1, **: p<0.05, ***: p<0.01. Source: Medicare Administrative and Claims Data, 1997-2001.
Spillovers Across Settings. A series of HSA-level analyses were performed in which the arc percent change in the utilization of Medicare inpatient services other than SNFs was regressed on the arc percent change in SNF payment rates. The results of those analyses, shown in Table 4, indicate that an increase in SNF payment rates is associated with a statistically significant decrease in the utilization of inpatient rehabilitation facility care—that finding is consistent with Buntin et al. (2004) finding that SNFs and inpatient rehabilitation facilities are substitutes. The utilization of short-stay hospitals and long-term care hospitals does not appear to be affected by changes in SNF payment rates. In the last column of Table 4, the arc percent change in all Medicare-covered institutional days (including short-stay hospitals, SNFs, inpatient rehabilitation facilities, and long-term care hospitals) is regressed on the arc percent change in the SNF payment rate. Although there appears to be some spillover effect of SNF payment rates on the utilization of inpatient rehabilitation facilities, the overall effect of increasing SNF payment rates is clearly to increase total days of Medicare-covered institutional care.
MMRR 2011: Volume 1 (3)
White, C., Nguyen, N. E14
5.5. Falsification Exercise
One concern with the main results on the SNF volume response is that changes in Medicare payments to SNFs might be associated with changes in the underlying health status of the Medicare population. That type of association could either be due to unobserved systematic factors or simply due to chance. In either case, an association between changes in payment rates and underlying health status could bias our results.
To test this possibility, we measured the HSA-level arc percent changes in the age-sex adjusted incidence of hip fracture and the age-sex adjusted incidence of heart attack among Medicare fee-for-service beneficiaries. (Those events are, we assume, good measures of changes in the underlying health status of the population and are not likely to be affected over a relatively short time frame by changes in health financing.) The HSA-level changes in the incidence of hip fracture and heart attack were then regressed on the arc percent changes in SNF payment rates. Those regressions’ results showed that the changes in the incidence of hip fracture and heart attack were essentially unrelated to the changes in SNF payment rates. The estimated elasticities with respect to SNF payment rates were 0.00 for hip fracture (standard error 0.02) and 0.03 for heart attack (standard error 0.04). These results do not suggest that there was any systematic association between changes in SNF payment rates and changes in underlying health status.
7. Conclusion
To date, nearly all empirical analyses of volume responses have been focused on the physician setting. This study fills in a clear gap in the empirical literature by measuring how the volume of medical services responds to changes in payment rates in an institutional, non-physician setting. Based on theoretical analyses, the predicted responses to changes in payment rates differ dramatically between physicians and non-physician providers. This analysis provides persuasive empirical support for the appealingly straightforward notion that increasing payments to institutional providers will lead to an increase in the volume of services provided. The analysis also sheds considerable light on the mechanisms by which adjustments in SNF volume are accomplished.
In the past, Congress has frequently adjusted providers' payment rates in response to fiscal pressures, and changes to Medicare payment rates play a major role in health reform packages currently being considered in the Congress. For the purposes of projecting the effect of such changes on the federal budget, it is crucial to have a firm understanding of volume responses. This analysis takes a preliminary step in that direction, by establishing that changes in Medicare's SNF payment rates have led to real changes in the volume of Medicare-covered SNF services. These changes were "real" in the sense that, because of changes in payment rates, beneficiaries received different amounts of SNF care, and were not merely shifted from one SNF to another.

MMRR 2011: Volume 1 (3)
White, C., Nguyen, N. E15
This analysis establishes that Medicare's payment policies should not be considered in isolation from other payors. The changes in Medicare SNF volume came about through a combination of facility closures and shifts in payor mix among facilities that remained open. Both of those responses have implications for other payors and the volume of SNF services they pay for. This analysis also confirms that SNFs should not be considered in isolation from other institutional settings. In particular, SNFs and inpatient rehabilitation facilities appear to be partial substitutes for each other, meaning that payment rate reductions (increases) in the SNF setting lead to increases (reductions) in the volume of services provided in the inpatient rehabilitation setting.
The most obvious question for future research is whether the volume responses in other settings are similar to those observed in the SNF setting. Short-stay hospitals, both their inpatient and outpatient departments, are of particular interest. Hospitals account for by far the single largest category of Medicare spending, and they also serve as the gateway to care provided in SNFs and a number of other settings.
Disclaimer The views expressed in this paper are those of the authors and should not be interpreted as those of the Congressional Budget Office, the Department of Health and Human Services, or the Center for Studying Health System Change. Correspondence Chapin White, Center for Studying Health System Change, 515 Philadelphia Ave., Takoma Park, MD 20912 [email protected], Tel: (202) 203-0260.
Financial Disclosure The authors do not have any competing financial or other interests in relation to the work.
References
Buntin, M. B., Garten, A. D., Paddock, S., Saliba, D., & Totten, M. (2004). How Much is Post-Acute Care Use Affected by Its Availability? (NBER Working Paper No. 10424). Retrieved from http://papers.nber.org/papers/w10424.pdf
Congressional Budget Office (2007). The Impact of Medicare’s Payment Rates on the Volume of Services Provided by Skilled Nursing Facilities (Pub. No. 2761. Background Paper). Retrieved from http://www.cbo.gov/ftpdocs/83xx/doc8314/07-18-SNF.pdf
Dafny, L. S. (2005). How Do Hospitals Respond to Price Changes? The American Economic Review, 95(5), 1525–1547. doi: http://dx.doi.org/10.1257/000282805775014236
Gruber, J., Kim, J., & Mayzlin, D. (1999, August). Physician Fees and Procedure Intensity: The Case of Cesarean Delivery. Journal of Health Economics, 18(4), 473–490. PubMed

MMRR 2011: Volume 1 (3)
White, C., Nguyen, N. E16
Hodgkin, D., & McGuire, T. G. (1994, March). Payment Levels and Hospital Response to Prospective Payment. Journal of Health Economics, 13(1), 1–29. PubMed
Hutt, E., Ecord, M., Eilertsen, T., Frederickson, E., Kowalsky, J., & Kramer, A. (2001, August 1). Prospective payment for nursing homes increased therapy provision without improving community discharge rates. Journal of the American Geriatrics Society, 49(8), 1071–1079. PubMed
Konetzka, R. T., Yi, D., Norton, E. C., & Kilpatrick, K. E. (2004, June). Effects of Medicare Payment Changes on Nursing Home Staffing and Deficiencies. Health Services Research, 39(3), 463–488. PubMed
McKnight, R. (2004). Home Care Reimbursement, Long-term Care Utilization, and Health Outcomes (NBER Working Paper No. 10414). Retrieved from http://papers.nber.org/papers/w10414.pdf
Medicare Payment Advisory Commission (2004). Report to the Congress: Medicare Payment Policy. Washington, DC: Medicare Payment Advisory Commission.
Medicare Payment Advisory Commission (2006). Report to the Congress: Medicare Payment Policy. Retrieved from http://www.medpac.gov/publications/congressional_reports/Mar06_EntireReport.pdf
Mitchell, J. M., Hadley, J., & Gaskin, D. J. (2000). Physicians' Responses to Medicare Fee Schedule Reductions. Medical Care, 38(10), 1029–1039. PubMed
Nguyen, N. X., & Derrick, F. W. (1997, August). Physician Behavioral Response to a Medicare Price Reduction. Health Services Research, 32(3), 283–298. PubMed
U.S. General Accounting Office (2002). Skilled Nursing Facilities: Providers Have Responded to Medicare Payment System by Changing Practices GAO-02-841. Washington, DC: U.S. General Accounting Office.
White, C. (2003, May/June). Rehabilitation Therapy in Skilled Nursing Facilities: Effects of Medicare's New Prospective Payment System. Health Affairs, 22(3), 214–223. PubMed
White, C. (2005-2006). Medicare's Prospective Payment System for Skilled Nursing Facilities: Effects on Staffing and Quality of Care. Inquiry, 42(4), 351–366. PubMed
White, C., & Seagrave, S. (2005). What Happens When Hospital-Based Skilled Nursing Facilities Close? A Propensity Score Analysis. Health Services Research, 40(6 Pt 1), 1883–1897. PubMed
Wodchis, W. P. (2004, October). Physical Rehabilitation Following Medicare Prospective Payment for Skilled Nursing Facilities. Health Services Research, 39(5), 1299–1318. PubMed
Wodchis, W. P., Fries, B. E., & Hirth, R. A. (2004-2005). The Effect of Medicare’s Prospective Payment System on Discharge Outcomes of Skilled Nursing Facility Residents. Inquiry, 41, 418–434. PubMed

MMRR 2011: Volume 1 (3)
White, C., Nguyen, N. E17
Yip, J. Y., Wilber, K. H., & Myrtle, R. C. (2002, October). The Impact of the 1997 Balanced Budget Amendments Prospective Payment System on Patient Case Mix and Rehabilitation Utilization in Skilled Nursing. The Gerontologist, 42(5), 653–660. PubMed
Yip, W. C. (1998, December). Physician Response to Medicare Fee Reductions: Changes in the Volume of Coronary Artery Bypass Graft (CABG) Surgeries in the Medicare and Private Sectors. Journal of Health Economics, 17(6), 675–699. PubMed

MMRR 2011: Volume 1 (3)
White, C., Nguyen, N. E18
Appendix
Calculation of Arc Percent Changes in Payment Rates and Volume
The first step in the analysis is to measure the arc percent change from 1997 to 2001 in the payment rate for each SNF. One approach to calculating the percent change in payment rates would be simply to measure the mean Medicare payments per resident-day in 1997 and 2001 for each SNF. That approach has two drawbacks: first, some SNFs exited the market between 1997 and 2001, which means that there is no payment rate to observe in 2001 (also, those exiting SNFs are of particular interest); second, the observed SNF payment rates in 2001 reflect the payment formula under the PPS, but also reflect SNFs' casemix scores which were under SNFs' control to some extent.1 To address both of these issues, we measure the arc percent change in SNF payment rates as:
( ) 2~~
19972001
19972001
jj
jjSNFj PP
PPP
+
−=∆
where j indexes SNFs, where 1997jP is the observed mean Medicare payment per resident-day in
1997, and where 2001~jP is a simulated payment rate in 2001 calculated holding constant SNFs'
casemix in 1997. Both the 1997 and 2001 payment rates are inflated to 2003 dollars, so that the change in payment rates represents a real change.2 The simulated payment rate in 2001 is calculated for all SNFs that were open in 1997 (including those that exited by 2001), and is generated by assigning casemix to each SNF in 2001 based on that SNF's observed casemix in 1997.3 SNF
jP∆ The goal in generating the payment change variable, , was to isolate the percent change in payment rates attributable to the PPS policy intervention.
For the geographic-level analysis, we first calculate the volume of SNF care received by beneficiaries living in different geographic areas in 1997 and 2001. This equals the number of days of Medicare-covered SNF care per Medicare beneficiary per year. Because SNF utilization increases sharply with age, we wanted to account for any differential changes across areas in the age composition. Therefore, the volume measures are indirectly standardized for age group (under 65, 65 to 74, 75 to 84 and 85 and up) and sex, using SNF utilization in 1998 to generate the benchmark rates.4 We then calculate the arc percent change in SNF volume for each geographic area,
( ) 2ˆˆˆˆ
1997,2001,
1997,2001,
HSAh
HSAh
HSAh
HSAhHSA
h QQQQ
Q+
−=∆
where h indexes HSAs, and where 1997,ˆ HSAhQ and 2001,ˆ HSA
hQ represent adjusted SNF days per beneficiary per year.

MMRR 2011: Volume 1 (3)
White, C., Nguyen, N. E19
We then generate a geographic-level (rather than SNF-level) measure of SNF payment rates in 1997 and 2001, where each SNF's payment rate is weighted based on SNF utilization patterns in 1997:
∑=j
jjhHSA
h PfP 19971997,
1997,
∑=j
jjhHSA
h PfP 20011997,
2001, ~~
where 1997, jhf represents SNF days provided by SNF j to beneficiaries living in HSA h divided by
total SNF days used by beneficiaries living in HSA h. Those geographic-level payment rates are then used to calculate a geographic-level change in SNF payment rates:
( ) 2~~
~1997,2001,
1997,2001,
HSAh
HSAh
HSAh
HSAhHSA
h PPPP
P+−
=∆
Decomposition of the Volume Change into Net Entry and Exit Versus Change Among SNFs Remaining Open Throughout the Period
One of the goals of the analysis is to identify the mechanisms by which SNF volume adjusts in response to changes in payment rates. As one component in that analysis, the change in SNF volume at the HSA level is decomposed into change attributable to SNF net entry and exit and to changes in volume among SNFs that remained open throughout the period examined. The arc percent change in volume attributable to net entry and exit:
EnterExitHSAhQ ,∆
equals the volume of SNF services provided in 2001 by SNFs that newly opened after 1997 minus the volume of SNF services provided in 1997 by SNFs that closed by 2001, divided by the average SNF volume in 1997 and 2001 (including all SNFs). The arc percent change in volume attributable to changes in volume among SNFs that remained open throughout the period:
OpenHSAhQ ,∆
equals the volume of SNF services provided in 2001 by SNFs that were open throughout the period minus the volume of SNF services provided in 1997 by SNFs that were open throughout the period, divided by the average SNF volume in 1997 and 2001 (including all SNFs). Both of these volume changes are adjusted for age and sex in the same way as the main volume change variable. Note that, by definition:
OpenHSAh
EnterExitHSAh
HSAh QQQ ,, ∆+∆=∆

MMRR 2011: Volume 1 (3)
White, C., Nguyen, N. E20
to decompose the arc percent change in SNF volume, SNF j is assigned Xj=1 if they were active in both 1997 and 2001 (active is defined as submitting at least one claim to Medicare in each of the four quarters of the year), and is otherwise assigned Xj=0. For both 1997 and 2001, two separate measures of SNF volume are then calculated, one among SNFs that entered or exited and one among SNFs that remained open throughout:
∑=j
jjhOpenHSA
h XQQ 1997,
1997,,
∑=j
jjhOpenHSA
h XQQ 2001,
2001,,
( )∑ −=j
jjhEnterExitHSA
h XQQ 11997,
1997,,
( )∑ −=j
jjhEnterExitHSA
h XQQ 12001,
2001,,
where 1997, jhQ equals the days of care provided by SNF j to Medicare beneficiaries living in HSA h
in 1997, and so on. Each of those four volume measures is then adjusted for demographics using the same indirect standardization method used earlier (indicated by hats). The percent change in SNF volume attributable to entry and exit is then calculated as:
( ) 2ˆˆ
ˆˆ1997,2001,
1997,,2001,,,
HSAh
HSAh
EnterExitHSAj
EnterExitHSAjEnterExitHSA
h QQ
QQQ
+
−=∆
and the percent change attributable to changes in volume among SNFs that remain open is calculated as:
( ) 2ˆˆ
ˆˆ1997,2001,
1997,,2001,,,
HSAh
HSAh
OpenHSAj
OpenHSAjOpenHSA
h QQ
QQQ
+
−=∆
Note that the numerators of these two volume changes, by definition, sum to the numerator in the formula for the overall arc percent change in volume, and the denominators are the same in all three cases. Therefore, by definition, for each HSA the overall arc percent change in SNF volume equals the sum of the arc percent change in volume attributable to net entry and exit plus the arc percent change in volume attributable to changes in volume among SNFs that remained open.

MMRR 2011: Volume 1 (3)
White, C., Nguyen, N. E21
Volume Responses Among Hospital-Based versus Freestanding SNFs
The regression specifications for these analyses are:
Hosphh
HospFreeHSAh
CrossHospHospHSAh
OwnHospHospHSAh XPPQ εγββ ++∆+∆=∆ ,,,,,
and
Freehh
FreeHospHSAh
CrossFreeFreeHSAh
OwnFreeFreeHSAh XPPQ εγββ ++∆+∆=∆ ,,,,,
where OwnHosp,β represents the own-price elasticity of supply of hospital-based SNF services, and CrossHosp,β represents the cross-price elasticity with respect to the freestanding SNF payment rate,
etc.
ENDNOTES
1 Casemix in the SNF setting is determined partly by patient diagnoses and functional status, but is largely determined by the amount of rehabilitation therapy provided by the SNF. 2 SNF payment rates are inflated to the 4th quarter of 2003 using the SNF market basket published by CMS. 3 The method for simulating SNF casemix in 2001 is taken from White (2005-2006), and is described as follows: “Because the data collection system for SNF case-mix classification was not in place in 1997, I do not have a direct measure of 1997 case mix. Therefore, I use data from 1998 through 2001 to map acute care hospital primary diagnoses onto SNF case-mix categories (i.e., among all individuals nationwide who had acute care hospital stays with a particular primary diagnosis and who had a subsequent SNF stay, I find the fraction assigned to each SNF case-mix category). For each SNF, I then simulate case mix (i.e., the fraction of residents in each case-mix category) in 1997 using this diagnosis-case mix map. I follow by calculating the simulated payment rate in 2001 using the 1997 simulated case mix, a weighted average of the payment rates in effect for each case-mix category in 2001, and the 2001 MSA-level wage adjuster.” 4 As a sensitivity check, we performed the same analyses using the arc percent changes in unadjusted volume—those results are very similar to the results presented below.
MMRR 2011 Volume 1, Number 3
ISSN: 2159-0354 doi: http://dx.doi.org/10.5600/mmrr.001.03.a01 E22
Medicare & Medicaid Research Review
2011 Volume 1, Number 3
Mission Statement
Medicare & Medicaid Research Review is a peer-reviewed, online journal reporting data and research that informs current and future directions of the Medicare, Medicaid, and Children’s Health Insurance programs. The journal seeks to examine and evaluate health care coverage, quality and access to care for beneficiaries, and payment for
health services.
http://www.cms.gov/MMRR/
U.S. Department of Health & Human Services
Kathleen Sebelius, Secretary
Centers for Medicare & Medicaid Services
Donald M. Berwick, M.D. Administrator
Center for Strategic Planning
Anthony D. Rodgers, Deputy Administrator and Director
Editor-in-Chief David M. Bott, Ph.D. Senior Editor Cynthia Riegler, M.A.
Editorial Board
Gerald S. Adler, M.Phil. CMS/Center for Strategic Planning
Andrew Bindman, M.D. University of California, San Francisco
William J. Buczko, Ph.D. CMS/Innovation Center
Todd Caldis, Ph.D., J.D. CMS/Office of the Actuary
Craig F. Caplan, M.A. CMS/ Innovation Center
Melissa A. Evans, Ph.D. CMS/Center for Medicare
John Hsu, M.D., M.B.A, M.S.C.E. Harvard Medical School
Jesse M. Levy, Ph.D. CMS/ Innovation Center
Jennifer Polinski, Sc.D, M.P.H. Brigham & Women's Hospital Isidor R. Strauss, F.S.A.
CMS/Office of the Actuary Fred G. Thomas, Ph.D., C.P.A.
CMS/ Innovation Center Robert Weech-Maldonado, Ph.D.
University of Alabama at Birmingham
Submission Guidelines: www.cms.gov/MMRR/InformationforAuthors Contact: [email protected]
© 2011 Centers for Medicare & Medicaid Services All material in the Medicare & Medicaid Research Review is in the public domain and may be duplicated without permission.
Citation to source is requested.