The Effect of Calorie Posting Regulation on Consumer .../media/7f5b9bd000fb4a8bb95fae... · 1 The...
43
1 The Effect of Calorie Posting Regulation on Consumer Opinion: A Flexible Latent Dirichlet Allocation Model with Informative Priors Dinesh Puranam, Vishal Narayan and Vrinda Kadiyali * May, 2014 Abstract In 2008, New York City mandated that all multi-unit restaurants post calorie information in their menu. For managers of multi-unit and stand-alone restaurants, and for policy makers, a pertinent goal might be to monitor the impact of this regulation on consumer conversations. We propose a scalable Bayesian topic model to measure and understand changes in consumer opinion about health (and other topics). We calibrate the model on 761,962 online reviews of restaurants posted over 8 years. Our methodological contribution is to generalize topic extraction approaches in marketing and computer science. Specifically, our model does the following: a) each word can probabilistically belong to multiple topics (e.g. “fries” could belong to the topics “taste” as well as “health”); b) managers can specify prior topics of interest such as “health” for a calorie posting regulation; and c) review lengths can affect distributions of topic proportions so that longer reviews might include more topics. Through careful controls, we isolate the potentially causal effect of regulation on consumer opinion. Following the regulation, there was a small but significant increase in the discussion of health topics. Health discussion remains restricted to a small segment of consumers. * Dinesh Puranam is a Marketing Ph.D. student at Johnson, Cornell University. This paper is part of his doctoral thesis. Vishal Narayan is an assistant professor of Marketing at NUS, Singapore. Vrinda Kadiyali is the Nicholas H. Noyes Professor of Marketing and Economics at Johnson, Cornell University. They can be reached at [email protected], [email protected] and [email protected] respectively.
Transcript of The Effect of Calorie Posting Regulation on Consumer .../media/7f5b9bd000fb4a8bb95fae... · 1 The...

1
The Effect of Calorie Posting Regulation on Consumer Opinion:
A Flexible Latent Dirichlet Allocation Model with Informative Priors
Dinesh Puranam, Vishal Narayan and Vrinda Kadiyali*
May, 2014
Abstract
In 2008, New York City mandated that all multi-unit restaurants post calorie information in their menu. For managers of multi-unit and stand-alone restaurants, and for policy makers, a pertinent goal might be to monitor the impact of this regulation on consumer conversations. We propose a scalable Bayesian topic model to measure and understand changes in consumer opinion about health (and other topics). We calibrate the model on 761,962 online reviews of restaurants posted over 8 years. Our methodological contribution is to generalize topic extraction approaches in marketing and computer science. Specifically, our model does the following: a) each word can probabilistically belong to multiple topics (e.g. “fries” could belong to the topics “taste” as well as “health”); b) managers can specify prior topics of interest such as “health” for a calorie posting regulation; and c) review lengths can affect distributions of topic proportions so that longer reviews might include more topics. Through careful controls, we isolate the potentially causal effect of regulation on consumer opinion. Following the regulation, there was a small but significant increase in the discussion of health topics. Health discussion remains restricted to a small segment of consumers.
* Dinesh Puranam is a Marketing Ph.D. student at Johnson, Cornell University. This paper is part of his doctoral thesis. Vishal Narayan is an assistant professor of Marketing at NUS, Singapore. Vrinda Kadiyali is the Nicholas H. Noyes Professor of Marketing and Economics at Johnson, Cornell University. They can be reached at [email protected], [email protected] and [email protected] respectively.

2
Section 1. Introduction
In the face of rising obesity, Mayor Bloomberg of New York City pushed a regulation in
2008 that required chain restaurants (those with 15 or more units nationwide) to display calories
for every item on all menu boards and menus in a font that was at least as prominent as price.
Two years later, the Affordable Health Care Act of 2010 mandated that restaurants with multiple
locations prominently display calories for every item on all menus. The desired impact of both
these laws was that posting calorific information would make health more salient in the minds of
consumers eating out, and make it easier for them to choose healthier foods. However,
implementing this national regulation “has gotten extremely thorny” in the words of the
Commissioner of the Food and Drug Administration. “There are very, very strong opinions and
powerful voices both on the consumer and public health side and on the industry side, and we
have worked very hard to figure out what really makes sense,” she said (Jalonick 2013).
Past research has shown us that regulations pertaining to health claims on food labels
affect consumer search and consumer behavior in various ways (Roe, Levy and Derby 1999,
Bollinger, Leslie and Sorenson 2011, and Downs et al. 2013). Unlike these papers, we focus our
research on consumers’ post-consumption opinions of the product. Our data are 761,962 reviews
of 9,805 restaurants in New York City, posted on a leading restaurant review site in an 8-year
period from the website’s inception in October 2004 to December 2012. We are unaware of
studies which estimate the impact of regulation changes on consumer opinion or word of mouth.
We propose an automated and scalable probabilistic model that summarizes this large volume of
free, unsolicited, rich user-generated text into a few interpretable topics. These topics can offer
managerial and policy insights into how consumer opinion or the “voice of the consumer”
(Griffin and Hauser 1993, Lee and Bradlow 2011) changed due to the implementation of a
calorie posting regulation in New York City.
Traditional approaches to measure the effects of regulations, such as surveys and focus
groups, might be expensive, time consuming, and potentially subject to recall biases and demand
effects (Netzer et al. 2012). Unlike such approaches which rely on primary data collected over a
short period of time, our data are available over several years. Therefore, our approach is

3
especially useful for studying the impact of temporally distant events (such as past regulations)
by comparing periods before and after such events.1
Based on our data and methods, we pose and answer the following empirical questions
that are managerially and policy relevant.
a) What were the major topics or attributes about chain restaurants that consumers discussed in
online reviews before and after the mandatory calorie posting regulation was enforced?
b) Was health a topic of discussion before and after the regulation? What proportion of
discussion was on health? Which topics were discussed to a larger extent relative to health?
c) How widespread was the discussion of health in online reviews before and after the
regulation? Very widespread discussion would be represented in the data by health being
discussed to the same extent in most reviews. Less widespread discussion of health would be
implied if it is discussed to a large extent but only in a small number of reviews.
The following managerial and regulatory insights can be obtained from our analysis.
First, should there be an increase post-regulation in health as a topic of discussion by a large set
of consumers, this can be seen as a measure of the regulation’s success in making health more
salient in the minds and voices of consumers. Second, textual content posted in online consumer
reviews affects subsequent demand (Archak, Ghose and Ipeirotis 2011, Ghose, Ipeirotis and Li
2012). That is, we might expect greater discussion of health across a very large number of online
reviews to be accompanied with greater consumption of healthier foods. Third, changes in
patterns of consumer opinion can provide continuous, timely and free inputs into more traditional
forms of marketing research. Increased discussion of health in online reviews can serve as a basis
for commissioning more costly investigations into changes in consumer buying behavior e.g. the
patterns of substitutions from less healthy options. Fourth, how widespread health mentions are
(i.e. variance in how deeply reviews discuss health as a topic, conditional on mean level of health
topics across reviews) can provide insights in to consumer segments. Such information can also
serve as the basis of studies aimed at identifying individuals who might influence restaurant
choices of the population, and at ascertaining the demographic correlates of those individuals
who are most vocal about health. Note that there is also widespread media discussion of health
1 It is plausible that despite large sample sizes, user-generated textual content might also suffer from biases; indeed, no market research technique is perfect. As such we do not propose to replace traditional approaches, but instead to augment them with data that are available for free, in larger quantities, and over longer period of times.

4
and in particular this regulation; we confine ourselves to the analysis of consumers’ post-
consumption data for these reasons outlined above.
We now briefly discuss our model and research design. We use a rigorous Bayesian
framework to summarize a large collection of reviews into a few representative latent “topics”
(e.g. price, service, menu item, cuisine). We characterize topics by a probability distribution
over all words in reviews. For each word in a review, a topic is chosen, and conditional on the
choice of topic, a word is chosen. This process continues till the review adequately represents the
topics of interest of the writer. So each review is a random mixture of several topics (e.g. a
restaurant review could be simplistically represented as 20% price, 20% service, and 60%
Mexican). This process represents a probabilistic interpretation of the data generation process for
the observed reviews. We use state-of-the-art tools to select topics that are coherent for ease of
managerial and policy interpretability. Estimation challenges arise because a) we do not observe
the topics, but infer them from the data, b) the same word could belong to different topics
necessitating a flexible modeling approach, and c) the large scale of the data (761,962 reviews)
necessitates scalable estimation techniques.
Since the scope of the regulation was limited to chain restaurants, we analyze data from
chain and standalone restaurants separately, such that standalone restaurants serve as a useful
contrast and as a natural control group. 2 To isolate the causal effects of regulations on consumer
opinions in chain (and standalone) restaurants, we control for short term differences in
characteristics between chain and standalone restaurants (via interactions of chain- and time-
specific dummies) and for geographical differences in topic proportions (via zip code dummies).
To further test for robustness of causal inference, we conduct a variant of a regression
discontinuity analysis (Thistlethwaite and Campbell 1960, Hartmann, Nair and Narayanan 2011):
we constrain the time period of analysis to a few months before and after the implementation of
the regulation to minimize the effect of potential time-varying confounds. In sum, we combine
state-of-the-art methods from computer science with experimental design methods to draw
causal inferences from textual data.
Situating our work in existing research literature, our paper is somewhat related to the
literature on the economic impact of numeric characteristics of online reviews (Godes and Silva
2 We refer to restaurants with less than 15 units nationwide as “standalone” (as opposed to chain) for ease of understanding. As mentioned, such restaurants were outside the scope of the regulation.

5
2013; Godes and Mayzlin 2004). However, there has been relatively less research on extracting
useful information from large masses of text of reviews. Decker and Trusov (2010) use text
mining to estimate the relative effect of product attributes and brand names on product
evaluation. Ghose et al. (2012) combine text mining with crowdsourcing methods to estimate
hotel demand. Methodologically, our work is closer to three papers. Archak et al. (2011) use a
part-of-speech tagger to identify frequently mentioned nouns and noun phrases in reviews. They
then cluster nouns that appear in similar “contexts” (windows of four words around the noun).
The resulting set of clusters corresponds to product “attributes” or “topics”. Lee and Bradlow
(2011) automatically extract details from each review in terms of phrases. Each phrase is then
rendered into a word vector which records the frequency with which a word appears in the
corresponding phrase. Phrases are clustered together according to their similarity, measured as
the distance between the word vectors. Clustering is achieved using a K-means algorithm. Netzer
et al. (2012) use a similar approach, with the difference that they define similarity between
products based on their co-mention in the data.
Our model generalizes previous approaches in marketing for extracting topics in three
important ways. First, these approaches deterministically allocate each word (or phrase of words)
into one cluster, so that each topic (or cluster) is represented by a set of unique phrases.
However, it is plausible that words could denote multiple topics or product attributes. For
example, the word “fries” could be associated with the attribute “taste” (e.g. “fries are tasty”) and
also with the attribute “health” (e.g. “fries are unhealthy”). In our approach, each word of the
vocabulary is probabilistically assigned to each topic. So a word can represent several topics,
each with a specific probability. Each topic is represented by a probability distribution over all
words in the vocabulary. This is appealing both statistically and conceptually. Statistically, we
demonstrate that a less deterministic approach of clustering words leads to better out-of-sample
model fit. Conceptually, it seems unlikely that consumers think of a word or a phrase as being
associated with a single topic.
Second, our substantive research objective dictates a different modeling approach.
Managers or policy makers might have informed priors about how consumer opinions might
change due to specific events. For example, the enforcement of a new sales tax law might alter
the level of discussion of “price” as a topic, when consumers review the focal product online. On
the other hand, a new regulation pertaining to minimum wages in the retailing industry might

6
alter consumer opinion about service (if wage increases lead to service improvements), or price
(if wage increases translate to price increases). In the papers discussed above, words or phrases
are allocated to topics, and then topics are interpreted by the researcher. In contrast our approach
allows the analyst to pre-specify constructs or topics of interest, and to then track changes in
consumer opinion as it pertains to those topics. This is achieved by specifying an informative
prior distribution of topics over the words in the vocabulary. This enables us to parsimoniously
integrate managerial intuition and interest with information contained in thousands of reviews.
Combining managerial intuition with statistical modeling has a long tradition in marketing and
psychology, and has even been shown to improve model fit compared with purely statistical
modeling (Blattberg and Hoch 1990, Yaniv and Hogarth 1993, Wierenga 2006). Although
improving model fit is not the most important objective of this research, we find that “seeding”
specific topics does not lead to lower fit than an “unseeded” version of the model, where the
prior distribution of topics over words is diffuse.
Third, a standard assumption in the marketing and computer science literatures (Blei, Ng
and Jordan 2003, Lee and Bradlow 2011) is that the distribution of topics within a document is
independent of the writer’s decision of how many words to write. However, it seems intuitive
that the length of a document affects the distribution of topics. Writers who want to communicate
about several topics are likely to use more words. Shorter documents might be focused on a few
topics leading to sparser topic distributions. We extend the computer science literature on topic
models by allowing the within-document topic distributions to vary with the length of the
document; we find empirical support for this. Other than improved model performance, allowing
topic distributions to vary by the length of the review has substantive implications. Authors of
reviews which are focused solely on health are more likely to lead the consumer opinion on
health, and be more important than the general reviewing population for targeting. To the extent
that shorter reviews are more likely to discuss one or very few topics, the length of a review
might be an important summary statistic of user-generated content to consider in identifying such
reviews and reviewers.
From a substantive standpoint, this is the first attempt in the marketing literature to
investigate the level of discussion of a combination of pre-defined topics of greater managerial
interest, and topics which are entirely data driven. Further, we complement recent research on
temporal dynamics in ratings of online reviews (Godes and Silva 2013, Li and Hitt 2008), by

7
inferring how levels of discussion of various topics vary over time due to an exogenous event.
We draw inferences not just from the mean level of discussion of each topic across reviews, but
also from the variance of this distribution. We are not aware of prior work that does this. Our
work also complements the academic research on the effect of the calorie posting regulation on
consumer behavior (Bollinger et al. 2010, Downs et al. 2013). Such research provides insights
from survey and transactional data from a single chain of restaurants (e.g. Starbucks for
Bollinger et al. 2010). Our data are from 9,805 restaurants including 78 unique chains, and we
focus on post-consumption opinions.
As a preview in to our main findings, we find that topics associated with American staple
fast-foods such as burgers, fries, sandwiches and steaks get discussed to a far greater extent than
health. The mean level of the discussion of the health topic increased due to the regulation.
Health is discussed only in a small proportion of reviews (less than 7%). This proportion
increased for chain restaurants, suggesting that the regulation served to maintain the salience of
health among a small segment of health-conscious consumers. Given the overall trends of
increasing obesity, even small post-regulation increases in health mentions in restaurant reviews
might be worth celebrating and has potential for significant long-term implications (see section 4
for details).
Next we discuss the model specification. Section 3 presents the data, and discusses
specific estimation challenges. Section 4 presents the results from the model, and their
implications. Section 5 compares out-of-sample model performance with models which do not
incorporate the unique features discussed above. It also demonstrates scalability in terms of
estimation time. Section 6 concludes.
Section 2. The Model
2.1 Model Specification
Our model belongs a class of probabilistic topic models termed Latent Dirichlet
Allocation (LDA) models, which have been developed by computer science (specifically
machine learning) researchers to analyze words in large sets of original texts in order to discover
the themes or topics in them. These models do not require any prior annotation or labeling of
documents (documents are online reviews in our application). Such modeling enables us to
summarize textual documents at a scale that would be impossible by human annotation (Blei

8
2012). We first describe the key conceptual ideas behind the LDA model and then discuss the
statistical specification.
We start with the basic intuition that documents include multiple topics. Consider the
consumer review of a restaurant in Figure 1. We can see that the writer discusses the menu items
of Mexican cuisine that she orders (burritos, enchiladas), discusses service in some detail
(waiting, timeliness), and also issues pertaining to the healthiness of her order (calories,
healthiness and the effect on her weight). The LDA model tries to statistically capture this
intuition. We describe it first in the form of a generative process. This is an imaginary random
process by which the model assumes the textual data in each document was generated. In terms
of basic notation, a corpus is a concatenation of all documents in the dataset e.g. a set of product
reviews. A vocabulary is the set of all unique words across all documents (e.g. all unique words
in all reviews posted on a website). A topic is a probability distribution over all words in the
vocabulary.
The word “calories” would be associated with the “health” topic with a high probability,
but also with all other topics with a non-zero probability. The word “dessert” might be associated
with high probability with both the “health” topic and the “taste” topic.3 Each of the three topics
in Figure 1, list some of the words corresponding to the topic with relatively high probability.
We assume that topics are specified before any data have been generated. The first step in the
creation of a document is for the writer to randomly choose a distribution over topics (25%, 50%
and 25% of topics 1, 2 and 3 in Figure 1). We allow this distribution to vary across documents
i.e. each document can exhibit topics in a different proportion. In the next step, the writer
chooses a word. For each word in the document, the writer first randomly chooses a topic based
on the distribution above. She then randomly chooses a word from the corresponding distribution
of the chosen topic over all words in the vocabulary. For example, a draw from the distribution
of the three topics might result in the choice of topic 1. Next, a draw from the distribution of
topic 1 over all words in the vocabulary might lead to the choice of “burrito”. This process of
choosing words in repeated until the writer finishes writing the document. The next document is
3 The topic “Health” could include words drawn from both positive (“healthy”) and negative valence (“not at all healthy”) contexts. Current approaches in computer science for jointly modeling valence and topic are associated with errors in topic measurement, which could potentially lead to incorrect inferences of the effects of interest. So we do not model valence. We do however discuss the robustness of our results to accounting for overall valence of the review in the analysis in section 4.

9
written similarly, but with a potentially different distribution over topics (say 0%, 89% and 11%
of topics 1, 2 and 3).
====Insert Figure 1 Here====
As mentioned, the researcher does not observe the topics, the distribution of words for
each topic, the distribution of topics for each document, or the choice of topic that led to a
specific choice of a word. The central computational problem is to use the observed documents
to infer these distributions i.e. to uncover the hidden topic structure that generated the observed
set of documents. The process described above defines a joint probability distribution over both
the observed and hidden random variables. We use this joint distribution to compute the
conditional (or posterior) distribution of the hidden variables given the observed documents and
words.
We now describe the model more formally. Each document d (d=1,…,D) is composed of
nd words. The number of total word instances in a corpus is N (e.g. for a corpus of 100,000
documents with 100 words each, N is 1 million). The corpus is defined by an N-dimensional
vector w = DDndi wwww ,...,, 1211 , where diw is the ith word of document d. The vocabulary is
defined by V unique words; each unique word is denoted by v. The distribution of topic k
(k=1,..,K) over the vocabulary is denoted by a V-dimensional vector k . Element kv denotes the
probability of word v belonging to topic k. In Figure 1, kv for the word “burrito” belonging to
topic 1 is 0.13. Document d is a mixture of the K topics. d is a K-dimensional vector that
represents the proportions of each topic in document d. So for a 3-topic model, the review in
Figure 1 might be summarized as ]25.050.025.0[d . Extant approaches in marketing such
as cluster analysis deterministically allocate words to topics, so that kv can take the values of 0
or 1 only.
The first step in the process for generating diw is to draw d from a Dirichlet
distribution, i.e. ~ ( )d dDirichlet . The second step is to draw diz , the topic assignment for the
ith word in document d. This is drawn from a categorical distribution with parameter d , i.e.
| ~ ( )di d dz Categorical . This is a particularly convenient choice of distributions as the
Dirichlet distribution is conjugate to the categorical distribution, i.e. the posterior distribution of
d is also Dirichlet. For example in Figure 1, a draw from a categorical distribution

10
]25.050.025.0[d might lead to the choice of the second topic i.e. diz = 2. diz is an
element of the N-dimensional vector z, which represents the latent variable indicating topic
assignment to each word in the corpus w. Given the choice of topic diz , the word diw is drawn
from the categorical distribution with parameter dizk , i.e. | , ~ ( )
didi di k k zw z Categorical . To
exploit conjugacy, the distribution of k is also specified Dirichlet i.e. ~ ( )k Dirichlet .
Continuing with the earlier example, given the choice of topic k=2, a draw from the categorical
distribution over all V words with parameter 2 might lead to the choice of the word “obese”.
This process is repeated for each word in document d. In summary, LDA allocates words from
documents into latent topics. The distributions of topics across a document, and of words over
topics are both Dirichlet, hence the term “Latent Dirichlet Allocation”. This set-up leads to the
formation of topics based on co-occurrence of words across documents. Words which co-occur
more frequently are more likely to be assigned to the same topic.
The model described so far assumes that the distribution of topics within a document is
independent of its length. A parsimonious way to relax this assumption is to focus on d which is
the vector that represents the proportions of each topic in document d. The standard assumption
in the literature is to assume that d is drawn from a Dirichlet distribution with parameter d ,
which is invariant across reviews i.e. d . We relax this assumption by allowing the Dirichlet
parameter to vary with the number of words in the focal document i.e. dd n . In this manner,
we parsimoniously allow the within-document topic distribution to vary with the length of the
document. To demonstrate how this specification affects the within-topic distribution, we
estimated the model assuming that is known to the researcher, and studied topic proportions
for different values of . We present topic proportions for a 20-topic model for three values of
in Figure 2. Larger values of are associated with more even distribution of topic
proportions across topics. So our specification enables us to allow for larger documents to have
more evenly distributed topics. Later in the paper, we demonstrate that this specification
improves model fit.
====Insert Figure 2 Here====
2.2 Model Estimation

11
We estimate the posterior distributions of the hyper-parameters and , the document
level parameter d , the vector of word level assignments of topics z , and the topic level
parameter k . Assuming documents are conditionally independent and identically distributed, we
show in Online Appendix 1 that the likelihood of the data conditional on the hyper-parameters is
calculated as follows:
( ),
1 1 1 1
( | , ) ( | ) ( | ) [ ]d
id
nD K VI w vk
d d k v dd i k v
L p n p d d
θ (1)
where I is the indicator function.
We face two estimation challenges: this function does not have a closed-formed
analytical solution (Dickey 1983), and the dimensionality of our parameter space is very high (a
common feature of problems associated with “big data”). The dimensionality problem is owing
to the large number of unique words in the corpus (V), the potentially large number of topics
which summarize them, and the large number of documents (note that d is document specific).
Following the computer science literature, we propose the following estimation strategy. First,
rather than estimate k or d as parameters (Griffiths and Steyvers 2004), we estimate the
posterior distribution of the assignment of words to topics, )|( wzP . We then obtain unbiased
and consistent estimates of k and d by examining this posterior distribution. Second, much of
the computer science literature assumes that the hyper-parameters parameters and are
known, presumably for computational ease. However, it seems implausible that we would know
the distribution of words over topics a priori. We therefore employ an expectation maximization
algorithm to estimate these parameters (Online Appendix 2 provides details).4
We now focus on the problem of evaluating )|( wzP , which is given as follows.
z
wzP
wzPwzP
),(
),()|( (2)
4 LDA is a “bag-of-words” model (Eliashberg, Hui and Zhang 2007, Netzer et al. 2012), i.e. the order of words in a document does not affect the joint distribution of the observed and hidden random variables. Modeling word order is computationally intensive and therefore rare, even in computer science. Such models have usually been limited to incorporating bi-grams (word pairs) or tri-grams (a triplet of words). Given the computational burden posed by estimating the hyper-parameters, we chose to retain the standard “bag-of-words” assumption.
12
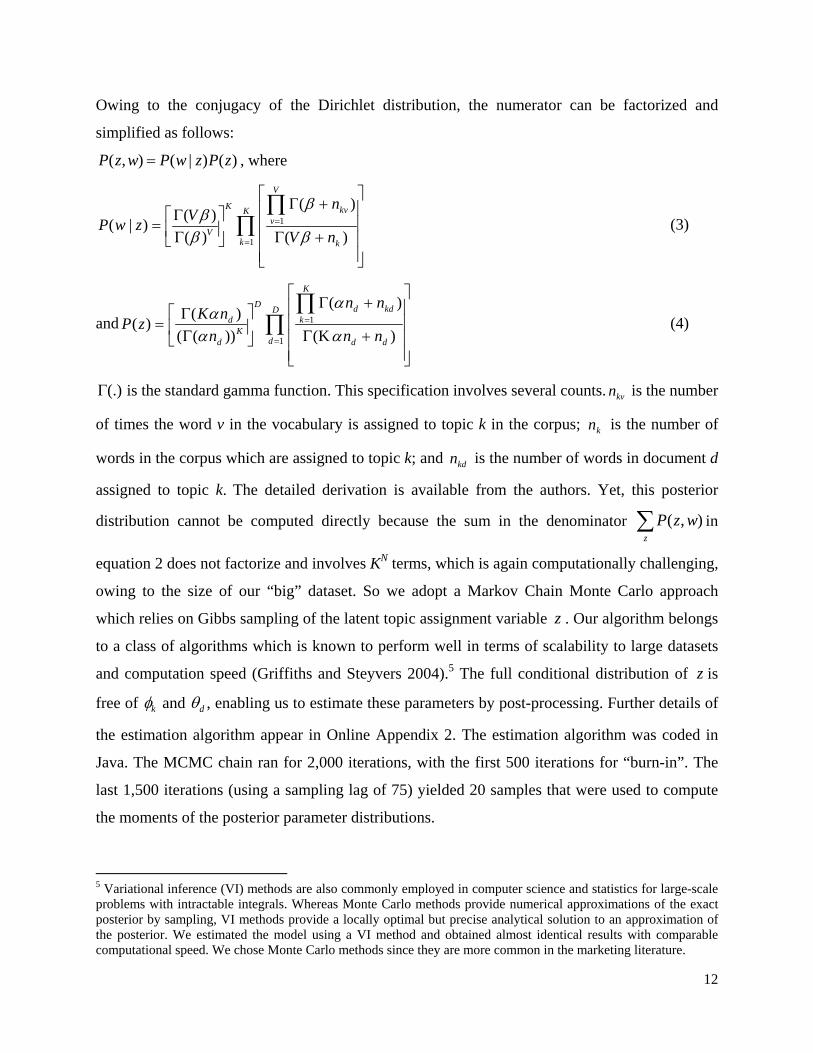
Owing to the conjugacy of the Dirichlet distribution, the numerator can be factorized and
simplified as follows:
)()|(),( zPzwPwzP , where
1
1
( )( )
( | )( ) ( )
V
K Kv
Vk k
kvnV
P w zV n
(3)
and 1
1
( )( )
( )( ( )) (K )
k
K
D dDd k
Kd d d
d
d
n nK n
P zn n n
(4)
(.) is the standard gamma function. This specification involves several counts. kvn is the number
of times the word v in the vocabulary is assigned to topic k in the corpus; kn is the number of
words in the corpus which are assigned to topic k; and kdn is the number of words in document d
assigned to topic k. The detailed derivation is available from the authors. Yet, this posterior
distribution cannot be computed directly because the sum in the denominator z
wzP ),( in
equation 2 does not factorize and involves KN terms, which is again computationally challenging,
owing to the size of our “big” dataset. So we adopt a Markov Chain Monte Carlo approach
which relies on Gibbs sampling of the latent topic assignment variable z . Our algorithm belongs
to a class of algorithms which is known to perform well in terms of scalability to large datasets
and computation speed (Griffiths and Steyvers 2004).5 The full conditional distribution of z is
free of k and d , enabling us to estimate these parameters by post-processing. Further details of
the estimation algorithm appear in Online Appendix 2. The estimation algorithm was coded in
Java. The MCMC chain ran for 2,000 iterations, with the first 500 iterations for “burn-in”. The
last 1,500 iterations (using a sampling lag of 75) yielded 20 samples that were used to compute
the moments of the posterior parameter distributions.
5 Variational inference (VI) methods are also commonly employed in computer science and statistics for large-scale problems with intractable integrals. Whereas Monte Carlo methods provide numerical approximations of the exact posterior by sampling, VI methods provide a locally optimal but precise analytical solution to an approximation of the posterior. We estimated the model using a VI method and obtained almost identical results with comparable computational speed. We chose Monte Carlo methods since they are more common in the marketing literature.
13
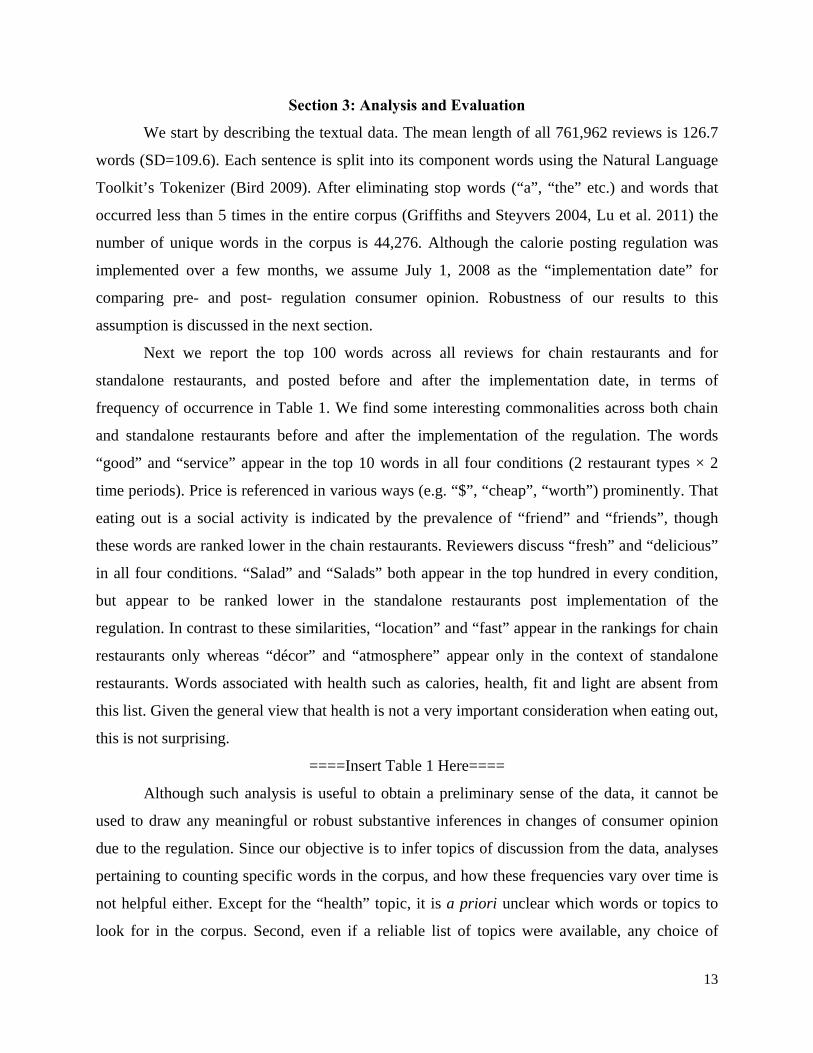
Section 3: Analysis and Evaluation
We start by describing the textual data. The mean length of all 761,962 reviews is 126.7
words (SD=109.6). Each sentence is split into its component words using the Natural Language
Toolkit’s Tokenizer (Bird 2009). After eliminating stop words (“a”, “the” etc.) and words that
occurred less than 5 times in the entire corpus (Griffiths and Steyvers 2004, Lu et al. 2011) the
number of unique words in the corpus is 44,276. Although the calorie posting regulation was
implemented over a few months, we assume July 1, 2008 as the “implementation date” for
comparing pre- and post- regulation consumer opinion. Robustness of our results to this
assumption is discussed in the next section.
Next we report the top 100 words across all reviews for chain restaurants and for
standalone restaurants, and posted before and after the implementation date, in terms of
frequency of occurrence in Table 1. We find some interesting commonalities across both chain
and standalone restaurants before and after the implementation of the regulation. The words
“good” and “service” appear in the top 10 words in all four conditions (2 restaurant types × 2
time periods). Price is referenced in various ways (e.g. “$”, “cheap”, “worth”) prominently. That
eating out is a social activity is indicated by the prevalence of “friend” and “friends”, though
these words are ranked lower in the chain restaurants. Reviewers discuss “fresh” and “delicious”
in all four conditions. “Salad” and “Salads” both appear in the top hundred in every condition,
but appear to be ranked lower in the standalone restaurants post implementation of the
regulation. In contrast to these similarities, “location” and “fast” appear in the rankings for chain
restaurants only whereas “décor” and “atmosphere” appear only in the context of standalone
restaurants. Words associated with health such as calories, health, fit and light are absent from
this list. Given the general view that health is not a very important consideration when eating out,
this is not surprising.
====Insert Table 1 Here====
Although such analysis is useful to obtain a preliminary sense of the data, it cannot be
used to draw any meaningful or robust substantive inferences in changes of consumer opinion
due to the regulation. Since our objective is to infer topics of discussion from the data, analyses
pertaining to counting specific words in the corpus, and how these frequencies vary over time is
not helpful either. Except for the “health” topic, it is a priori unclear which words or topics to
look for in the corpus. Second, even if a reliable list of topics were available, any choice of

14
words for measuring the level of discussion of specific topics would be subjective; results
pertaining to levels of topic discussions and their changes are sensitive to such choices. LDA
offers a data-based, replicable, objective and principled methodology of inferring topics from
text corpuses.
Yet a major challenge in all topic models is the interpretability of estimated topics.
Models with large numbers of topics typically fit the data better and are able to support finer-
grained distinctions in the text. However, some topics are more interpretable than others in the
judgment of domain experts; and the number of less interpretable topics often increases with the
number of topics (Mimno et al. 2011). Measures of model performance such as out-of-sample fit,
although commonly employed in marketing, correlate poorly with human judgments of topic
interpretability (Chang et al. 2009). This has led to increased interest among computer scientists
to develop automated metrics which are better able to predict topic interpretability. A useful
insight from this research is that if a topic is highly interpretable (to humans), pairs of words
which are associated with this topic with a high probability, should frequently co-occur in
several documents of the corpus. For example, a topic in which the words “healthy” and
“vegetables” are highly probable is likely to be more interpretable or “coherent” if both of these
words occur in several restaurant reviews. Mimno et al. (2011) provide evidence for this result,
and use it to develop a “topic coherence” metric Ck for each topic. Topics scoring higher on this
metric are more interpretable by human judges. It is defined as follows.
1
2 1
( , ) 1log
( )
k kM mm l
k km l l
DC
D
(5)
where ),...,( 1kM
kkV is the list of M most probable words in topic k, )(D is the number of
documents in which the word appears and )',( D is the number of documents which contain
at least one occurrence each of both and ' .
We now discuss how we choose the number of topics (K) and label each of them. Several
statistical approaches exist for this purpose. Similar to cluster analysis, we maximize the
dissimilarity between topics (Deveaud et al. 2012, Cao et al. 2009) by computing a distance
between every pair of topics where each topic is a probability distribution over the vocabulary.
We employ the Jensen-Shannon statistic (Lin 1991, Steyvers and Griffiths 2007) which is similar
to the Kullback-Leibler divergence statistic (Kullback and Leibler 1951), except that it is
symmetric (i.e. the order of distributions does not matter) and always takes finite values; these
15
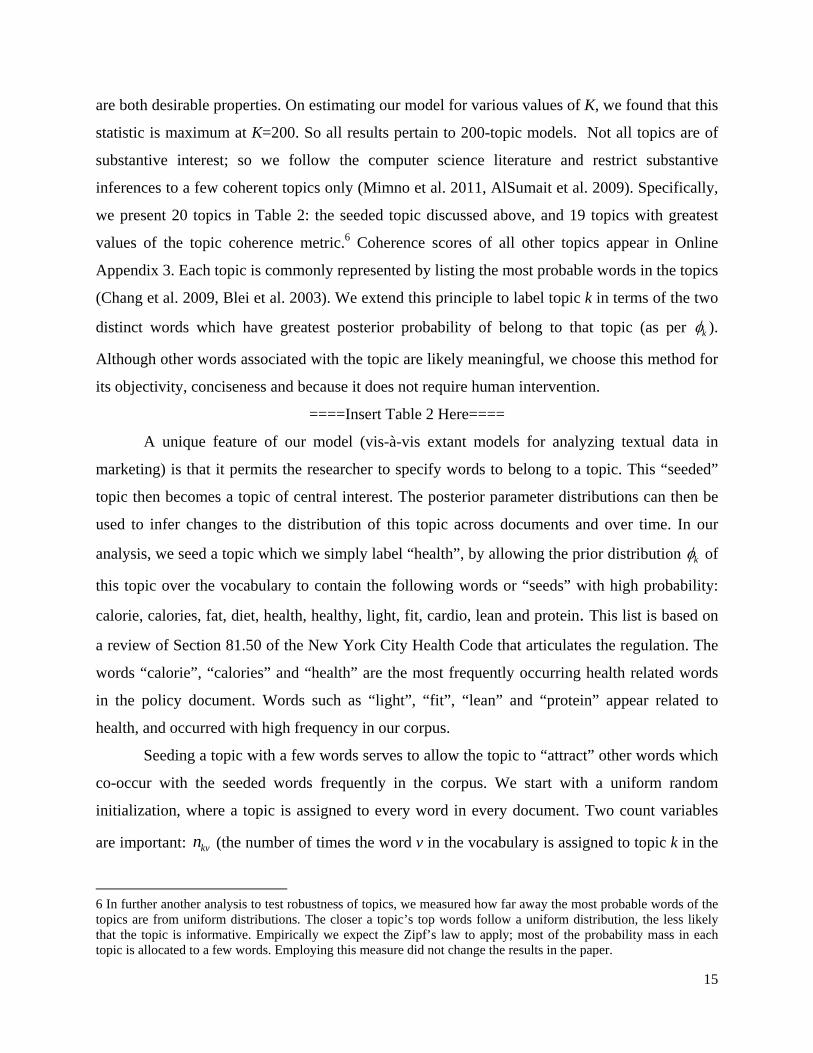
are both desirable properties. On estimating our model for various values of K, we found that this
statistic is maximum at K=200. So all results pertain to 200-topic models. Not all topics are of
substantive interest; so we follow the computer science literature and restrict substantive
inferences to a few coherent topics only (Mimno et al. 2011, AlSumait et al. 2009). Specifically,
we present 20 topics in Table 2: the seeded topic discussed above, and 19 topics with greatest
values of the topic coherence metric.6 Coherence scores of all other topics appear in Online
Appendix 3. Each topic is commonly represented by listing the most probable words in the topics
(Chang et al. 2009, Blei et al. 2003). We extend this principle to label topic k in terms of the two
distinct words which have greatest posterior probability of belong to that topic (as per k ).
Although other words associated with the topic are likely meaningful, we choose this method for
its objectivity, conciseness and because it does not require human intervention.
====Insert Table 2 Here====
A unique feature of our model (vis-à-vis extant models for analyzing textual data in
marketing) is that it permits the researcher to specify words to belong to a topic. This “seeded”
topic then becomes a topic of central interest. The posterior parameter distributions can then be
used to infer changes to the distribution of this topic across documents and over time. In our
analysis, we seed a topic which we simply label “health”, by allowing the prior distribution k of
this topic over the vocabulary to contain the following words or “seeds” with high probability:
calorie, calories, fat, diet, health, healthy, light, fit, cardio, lean and protein. This list is based on
a review of Section 81.50 of the New York City Health Code that articulates the regulation. The
words “calorie”, “calories” and “health” are the most frequently occurring health related words
in the policy document. Words such as “light”, “fit”, “lean” and “protein” appear related to
health, and occurred with high frequency in our corpus.
Seeding a topic with a few words serves to allow the topic to “attract” other words which
co-occur with the seeded words frequently in the corpus. We start with a uniform random
initialization, where a topic is assigned to every word in every document. Two count variables
are important: kvn (the number of times the word v in the vocabulary is assigned to topic k in the
6 In further another analysis to test robustness of topics, we measured how far away the most probable words of the topics are from uniform distributions. The closer a topic’s top words follow a uniform distribution, the less likely that the topic is informative. Empirically we expect the Zipf’s law to apply; most of the probability mass in each topic is allocated to a few words. Employing this measure did not change the results in the paper.

16
corpus) and kn (the number of words in the corpus which are assigned to topic k). In the
“unseeded” model these counts are updated over a number of MCMC iterations to yield a
posterior estimate of k . In the seeded version of the model, we randomly choose a topic and
increment the counts of kvn and kn artificially (or add “pseudo-counts”) for the seed words, thus
increasing the prior probability that the seed words will be located in the same topic. After some
experimentation, we choose 5 as the value of this “pseudo-count”. This choice is sufficiently
flexible to allow for the possibility that the posterior estimate of k will contain a) seeds with low
probability, and b) other words with high probability. Given the large volume of data, this choice
of pseudo-counts does not affect the results. To verify this, we included a low frequency health
related word “cardio” as a seed. “Cardio” receives a low posterior probability assignment in the
health topic and is not in the top 20 words used to describe the topic.
Although we use the Jensen-Shannon statistic to decide number of topics, this in itself
does not guarantee that all inferred topics are managerially relevant. Our topic of interest is quite
focused i.e. contains very few substantively relevant words. Seeding enables us to study the issue
of interest in a focused, practical, yet statistically robust manner. Therefore, seeding is a very
useful tool to investigate potentially small but emerging trends in the data, and allows managers
and regulators to measure topics of special interest to them.
Section 4. Results and Implications
4.1 Results
We first discuss the major topics of discussion in our data. We then discuss the relative
importance of the health topic. Next, we discuss how the discussion of the health topic is
distributed across reviews; with an eye to inferring segments of the reviewing population which
are more vocal about health. Finally, we draw inferences about how the relative importance of
health and other topics changed over time due to the calorie posting regulation.
In Table 2, we present the top 10 words in decreasing order of posterior probability of
being in each topic (for the top 20 topics), as inferred from the analysis of all reviews of chain
restaurants. These topics perform very well on well-established coherence metrics.7 First, we
7 To improve interpretability, it might be tempting to combine topics which appear similar. This can better be achieved by estimating models with fewer topics than by manually combining topics post estimation, since manual
17
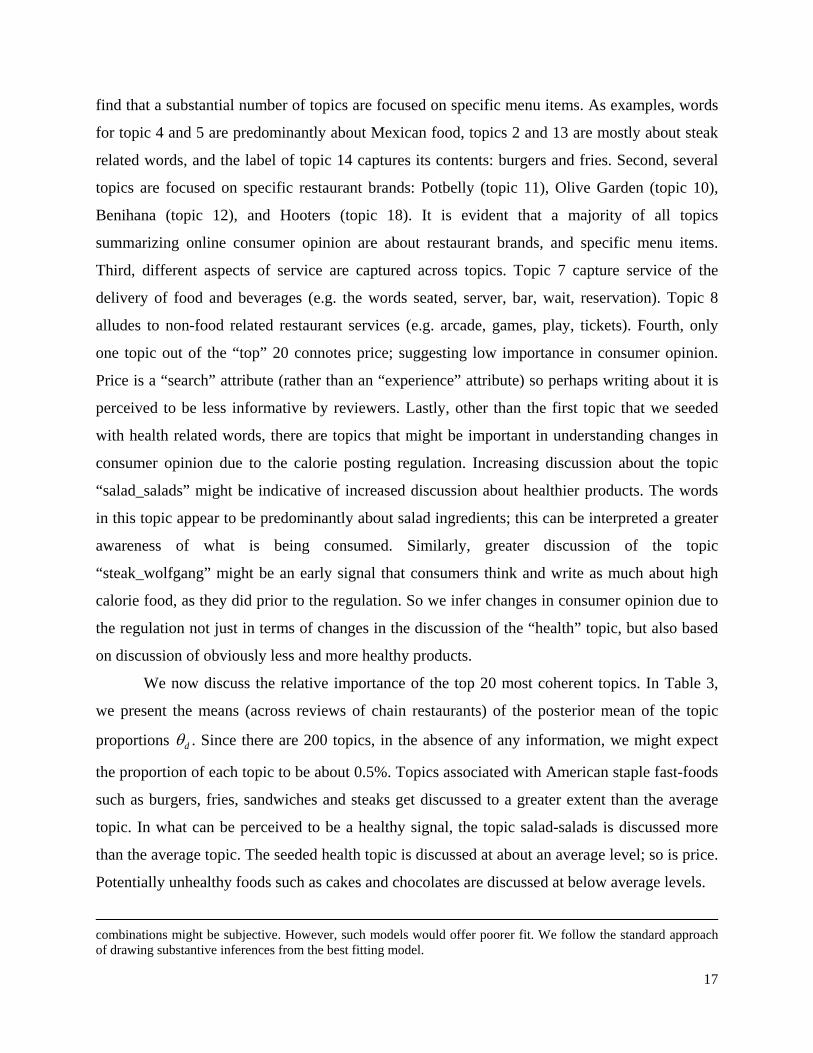
find that a substantial number of topics are focused on specific menu items. As examples, words
for topic 4 and 5 are predominantly about Mexican food, topics 2 and 13 are mostly about steak
related words, and the label of topic 14 captures its contents: burgers and fries. Second, several
topics are focused on specific restaurant brands: Potbelly (topic 11), Olive Garden (topic 10),
Benihana (topic 12), and Hooters (topic 18). It is evident that a majority of all topics
summarizing online consumer opinion are about restaurant brands, and specific menu items.
Third, different aspects of service are captured across topics. Topic 7 capture service of the
delivery of food and beverages (e.g. the words seated, server, bar, wait, reservation). Topic 8
alludes to non-food related restaurant services (e.g. arcade, games, play, tickets). Fourth, only
one topic out of the “top” 20 connotes price; suggesting low importance in consumer opinion.
Price is a “search” attribute (rather than an “experience” attribute) so perhaps writing about it is
perceived to be less informative by reviewers. Lastly, other than the first topic that we seeded
with health related words, there are topics that might be important in understanding changes in
consumer opinion due to the calorie posting regulation. Increasing discussion about the topic
“salad_salads” might be indicative of increased discussion about healthier products. The words
in this topic appear to be predominantly about salad ingredients; this can be interpreted a greater
awareness of what is being consumed. Similarly, greater discussion of the topic
“steak_wolfgang” might be an early signal that consumers think and write as much about high
calorie food, as they did prior to the regulation. So we infer changes in consumer opinion due to
the regulation not just in terms of changes in the discussion of the “health” topic, but also based
on discussion of obviously less and more healthy products.
We now discuss the relative importance of the top 20 most coherent topics. In Table 3,
we present the means (across reviews of chain restaurants) of the posterior mean of the topic
proportions d . Since there are 200 topics, in the absence of any information, we might expect
the proportion of each topic to be about 0.5%. Topics associated with American staple fast-foods
such as burgers, fries, sandwiches and steaks get discussed to a greater extent than the average
topic. In what can be perceived to be a healthy signal, the topic salad-salads is discussed more
than the average topic. The seeded health topic is discussed at about an average level; so is price.
Potentially unhealthy foods such as cakes and chocolates are discussed at below average levels.
combinations might be subjective. However, such models would offer poorer fit. We follow the standard approach of drawing substantive inferences from the best fitting model.

18
We also present means of topic proportions prior and post the implementation of the
regulation. We note increasing trends in the discussion of popular products such as sandwiches
and steaks. In what can be seen as a measure of success of the calorie-posting regulation, the
“health” topic and the topic associated with salads get discussed more post-regulation. On the
other hand, the proportion of discussion of high calorie foods (e.g. cakes) shows a decline in
reviews of chain restaurants.8 This is the first paper to infer temporal changes in topics of
discussion about products in online forums. However, like much of the computer science
literature on topic models, the drivers of temporal changes in topic proportions are still unclear;
we return to this issue in detail later.
====Insert Tables 3 and 4 Here====
In Table 4, we present the distribution of topic proportions based on reviews posted for
standalone restaurants. We use the topics estimated on data from chain restaurants, and estimate
their proportions for data on standalone restaurants (i.e. we hold k fixed across the treatment
and control groups, and estimate d for each review of standalone restaurants).9 We find major
differences in the extent to which the top 20 topics are discussed in these restaurants. Most
topics form greater proportion of reviews of chain restaurants than of standalone restaurants,
perhaps because these topics were inferred based on reviews of chain restaurants. We find that
health (the seeded topic) forms a greater proportion of reviews of chain restaurants. This could
be driven by differences in preferences of reviewers who review both kinds of restaurants, and
might perhaps be an early signal of the need for calorie posting regulation for standalone
restaurants also. The topic connoting price (tip_%) is discussed more in standalone restaurants;
this is not very surprising as chain restaurants are often quick serve restaurants (with some
exceptions) where meals are paid for upfront and with a minimal service component. It is also
plausible that public knowledge of prices of standalone restaurants is lower than that of chain
8 We focus on inferring the proportions of topics across reviews, and how they change due to the regulation. The absolute levels of discussion of most topics increase over time, since more reviews are posted over time. This holds for both chain and standalone restaurants. Further details are available from the authors. 9 Another option is to estimate topics separately for standalone and chain restaurants. We could then compare a topic k for chain restaurants with that topic for standalone restaurants, which is at minimum distance as measured by the Jensen-Shannon statistic. However, our method enables more precise comparison of topics across the two groups. In
further analysis we estimated the model on the entire corpus so that k is inferred from reviews of both chain and
standalone restaurants. All substantive results pertaining to the health topic remain unchanged.
19
restaurants (e.g. the prices of McDonald’s burgers might be better known than those of the
neighborhood deli). So discussion of price of standalone restaurants might be more informative.
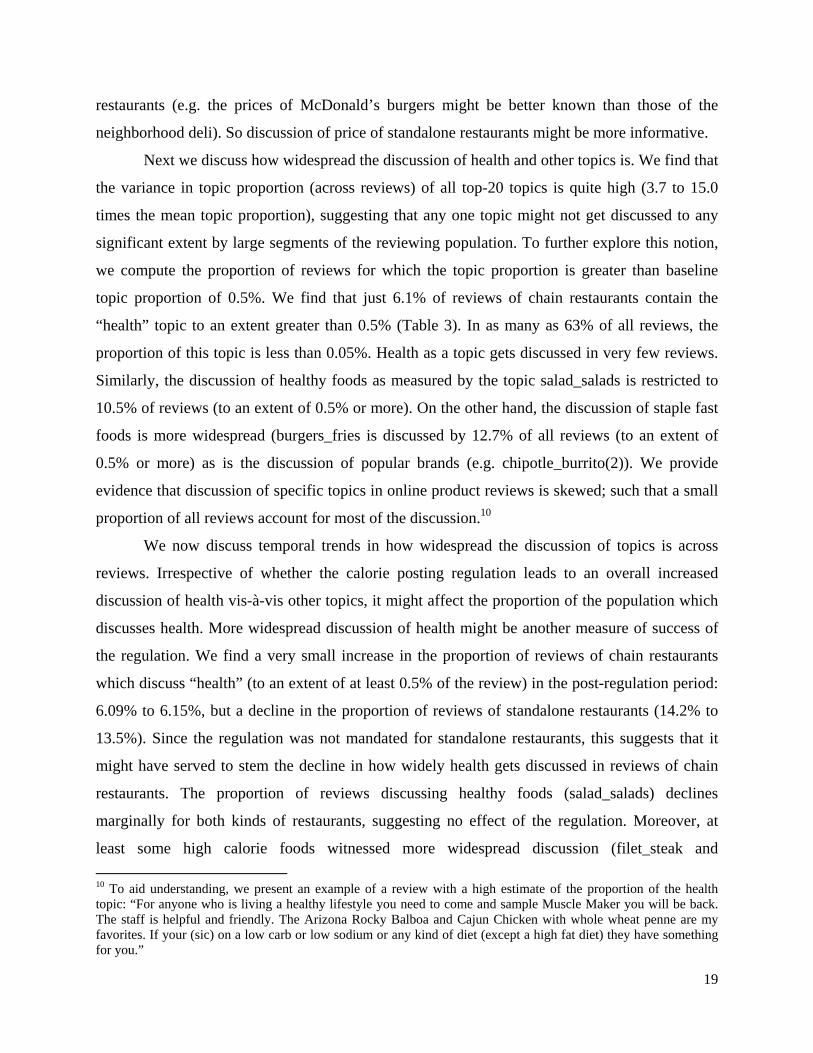
Next we discuss how widespread the discussion of health and other topics is. We find that
the variance in topic proportion (across reviews) of all top-20 topics is quite high (3.7 to 15.0
times the mean topic proportion), suggesting that any one topic might not get discussed to any
significant extent by large segments of the reviewing population. To further explore this notion,
we compute the proportion of reviews for which the topic proportion is greater than baseline
topic proportion of 0.5%. We find that just 6.1% of reviews of chain restaurants contain the
“health” topic to an extent greater than 0.5% (Table 3). In as many as 63% of all reviews, the
proportion of this topic is less than 0.05%. Health as a topic gets discussed in very few reviews.
Similarly, the discussion of healthy foods as measured by the topic salad_salads is restricted to
10.5% of reviews (to an extent of 0.5% or more). On the other hand, the discussion of staple fast
foods is more widespread (burgers_fries is discussed by 12.7% of all reviews (to an extent of
0.5% or more) as is the discussion of popular brands (e.g. chipotle_burrito(2)). We provide
evidence that discussion of specific topics in online product reviews is skewed; such that a small
proportion of all reviews account for most of the discussion.10
We now discuss temporal trends in how widespread the discussion of topics is across
reviews. Irrespective of whether the calorie posting regulation leads to an overall increased
discussion of health vis-à-vis other topics, it might affect the proportion of the population which
discusses health. More widespread discussion of health might be another measure of success of
the regulation. We find a very small increase in the proportion of reviews of chain restaurants
which discuss “health” (to an extent of at least 0.5% of the review) in the post-regulation period:
6.09% to 6.15%, but a decline in the proportion of reviews of standalone restaurants (14.2% to
13.5%). Since the regulation was not mandated for standalone restaurants, this suggests that it
might have served to stem the decline in how widely health gets discussed in reviews of chain
restaurants. The proportion of reviews discussing healthy foods (salad_salads) declines
marginally for both kinds of restaurants, suggesting no effect of the regulation. Moreover, at
least some high calorie foods witnessed more widespread discussion (filet_steak and
10 To aid understanding, we present an example of a review with a high estimate of the proportion of the health topic: “For anyone who is living a healthy lifestyle you need to come and sample Muscle Maker you will be back. The staff is helpful and friendly. The Arizona Rocky Balboa and Cajun Chicken with whole wheat penne are my favorites. If your (sic) on a low carb or low sodium or any kind of diet (except a high fat diet) they have something for you.”

20
medium_steak) in chain restaurant reviews; this increase was much more than the corresponding
increase for standalone restaurants. Therefore, a small proportion of the population reviewing
chain restaurants discussed explicit health related words and healthy foods; on the other hand the
discussion of less healthy foods such as steaks seems to have become more widespread.
To estimate the causal effect of the regulation on the mean levels of topic proportions in
reviews of chain restaurants, we specify the following model for the proportion of topic k in
document d:
kddkddkdkddkkkd ZipCodeXPostChainPostXquarterIdChain 43210 (6)
Chaind equals 1 if review d is for a chain restaurant (0 otherwise). Postd is a dummy
variable for the implementation time of the regulation (1 if review d was dated July 2008 or later;
0 otherwise). quarterIdd is vector of dummy variables. The element corresponding to the unique
year and quarter combination (e.g. quarter 1, 2008) in which review d was written takes the value
1; all other elements are 0. ZipCoded is a dummy variable for the zth zipcode in our data;
referring to the location of the restaurant reviewed in review d. We also include the interaction of
the variables Chain and Post. The key effect of interest is that of interaction of the variables
Chaind and Postd. It measures how topic proportions changed after the regulation for chain
restaurants in comparison with standalone restaurants. Positive (negative) estimates of the
interaction effect indicate that the proportion of topic k in reviews of chain restaurants increased
(decreased) due to the implementation of the regulation. In terms of controls, the coefficient of
Postd captures changes to topic proportions (before and after implementation) that affect all
restaurants similarly e.g. population level changes in health salience. The interactions between
Chaind and quarterIdd control for short term changes in factors which might affect chain and
standalone restaurants differently (e.g. more tourist traffic to chain restaurants in a particularly
warm winter, greater advertising by chain restaurants in a summer of high tourist traffic).
Dummies for the last quarter in the data, and for one zipcode, are excluded to avoid collinearity.
Error terms are assumed IID and normally distributed. All parameters are topic-specific. Key
parameters are presented in Table 5.
====Insert Table 5 Here====
Several insights emerge. First, after controlling for chain characteristics (in comparison to
standalone restaurants), temporal trends, restaurant locations, and any time-specific shocks that
might affect the two formats differently, we find that the proportion of the health topic in chain
21
restaurants increases due to the regulation. So did the proportion of discussion of topics of
seemingly healthier foods such as salads. This clearly signals success of the regulation in terms
of increasing the salience of health at least for those consumers of restaurants who post online
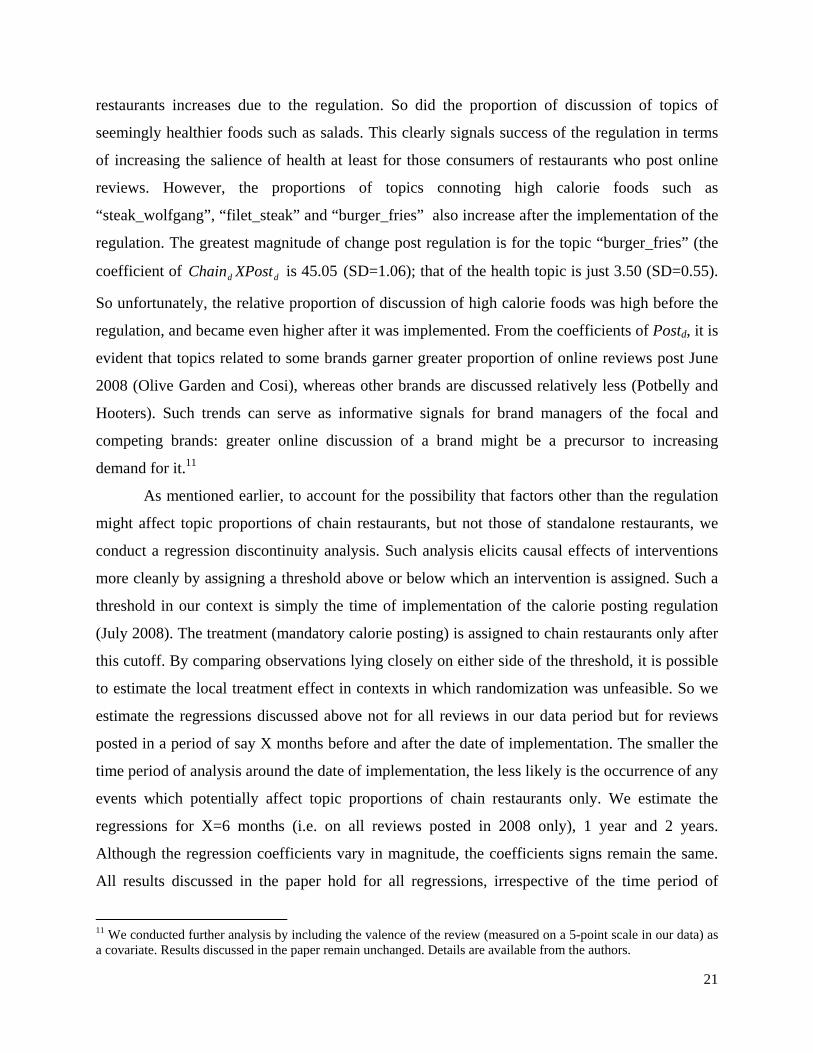
reviews. However, the proportions of topics connoting high calorie foods such as
“steak_wolfgang”, “filet_steak” and “burger_fries” also increase after the implementation of the
regulation. The greatest magnitude of change post regulation is for the topic “burger_fries” (the
coefficient of dd XPostChain is 45.05 (SD=1.06); that of the health topic is just 3.50 (SD=0.55).
So unfortunately, the relative proportion of discussion of high calorie foods was high before the
regulation, and became even higher after it was implemented. From the coefficients of Postd, it is
evident that topics related to some brands garner greater proportion of online reviews post June
2008 (Olive Garden and Cosi), whereas other brands are discussed relatively less (Potbelly and
Hooters). Such trends can serve as informative signals for brand managers of the focal and
competing brands: greater online discussion of a brand might be a precursor to increasing
demand for it.11
As mentioned earlier, to account for the possibility that factors other than the regulation
might affect topic proportions of chain restaurants, but not those of standalone restaurants, we
conduct a regression discontinuity analysis. Such analysis elicits causal effects of interventions
more cleanly by assigning a threshold above or below which an intervention is assigned. Such a
threshold in our context is simply the time of implementation of the calorie posting regulation
(July 2008). The treatment (mandatory calorie posting) is assigned to chain restaurants only after
this cutoff. By comparing observations lying closely on either side of the threshold, it is possible
to estimate the local treatment effect in contexts in which randomization was unfeasible. So we
estimate the regressions discussed above not for all reviews in our data period but for reviews
posted in a period of say X months before and after the date of implementation. The smaller the
time period of analysis around the date of implementation, the less likely is the occurrence of any
events which potentially affect topic proportions of chain restaurants only. We estimate the
regressions for X=6 months (i.e. on all reviews posted in 2008 only), 1 year and 2 years.
Although the regression coefficients vary in magnitude, the coefficients signs remain the same.
All results discussed in the paper hold for all regressions, irrespective of the time period of
11 We conducted further analysis by including the valence of the review (measured on a 5-point scale in our data) as a covariate. Results discussed in the paper remain unchanged. Details are available from the authors.
22
analysis, and are available from the authors. We do not analyze smaller time periods of data,
since the implementation of the regulation was spread over a few months.
Another potential concern could pertain to our choice of temporal break (July 2008). It is
plausible that restaurants made changes prior to the regulation (e.g. healthier menus or lower
calorie ingredients) in anticipation of calorie posting. Such changes could have affected health
topic proportions even before the regulation was implemented. So we repeated this analysis for
various temporal breaks (both before and after July 2008), and find that our results hold.
4.2 Implications for Managers and Policy Makers
We first discuss implications for policy makers interested in promoting healthy eating out
habits. We find that health is not a prominent topic of discussion among hundreds of thousands
of reviewers of restaurants in New York City. With over 57% of all adults in the city being
overweight or obese12, this is worrisome. Most reviewers of restaurants discuss health to a very
low extent or not at all. Interestingly, much of the discussion of health is skewed towards a small
segment of reviewers, who can be readily identified online. They could serve as useful starting
points for initiatives to identify influencers or evangelists who might be successful in changing
online public opinion about health.
We find that the calorie posting was successful in two ways. First, it led to an increase in
the discussion of health related words among online reviews of chain restaurants. Managers of
restaurants with healthier offerings might be encouraged by this trend and managers of
restaurants with less healthy offerings might consider conducting more market research to
determine whether and how to alter their strategy. Second, the proportion of reviews of chain
restaurants which discuss health increased slightly after the regulation; whereas this proportion
declined for standalone restaurants. In other words, the discussion of health became less
widespread for standalone restaurants, but not for chain restaurants. Although these are
encouraging signs of success of the regulation, they provide a basis for conducting more costly
studies into consumption of healthier products as a logical next step.
While these results are econometrically significant, are they economically significant?
Our estimate of an 11.6% increase in health topic proportion (from 0.43% to 0.48%) is consistent
with research based on transaction data. Bollinger et al. (2011) estimate a 6% decrease in
calories per transaction at Starbucks after the regulation, but no change in overall revenues.
12 Source: http://www.health.ny.gov/statistics/prevention/obesity/county/newyorkcity.htm

23
Irrespective of the data source and research methodology, such small effect sizes might suggest
that the regulation was not a success. However, small changes in consumer behavior due to the
regulation can bring about major changes in obesity levels. Kuo et al. (2009) estimate that even if
10% of restaurant patrons in Los Angeles county were to reduce calorie consumption by 100
calories per meal, as much as 40.6% of average annual weight gain in the entire county
population would be averted. Reduction in obesity levels has monumental social and economic
significance in the US. Over 250,000 deaths in the US every year are attributable to obesity
(Allison et al. 1999). Obesity related costs in the US in 2008 were estimated to be a staggering
$147 billion (Finkelstein et al. 2009); greater than the GDP of all but about 60 countries, and are
still rising. Therefore, a seemingly small change in the level of health discussion due to the
regulation is to be celebrated by regulators
Another key finding is that topics pertaining to health, price and service garner a smaller
proportion of online reviews than those pertaining to brands and menu items. To the extent that
these topics are correlated with product attributes which consumers use for choice decisions, this
serves as a free and externally valid input into product management decisions. For making trade-
offs between investing in service or menu redesign, it is useful for managers to know that menu
items get discussed far more than service. Among menu items, the fact that steaks, burgers and
sandwiches are discussed more than salads and appetizers is an indication of the relative
popularity of various food items for eating out in New York City.
Although not central to our key research question of determining the effect of the
regulation on consumer opinion, our analysis reveals useful insights for brand managers of
restaurants. Topics in Table 2 reveal words which are commonly used along with certain brand
names in consumer reviews. We note that Qdoba is the only brand among the top 10 words for
the topic “chipotle_burrito(1)” suggesting that Chipotle and Qdoba are perceived to be similar by
consumers. This could potentially serve as a useful input for future store choice decisions where
one brand might not want to locate very close to the other. Food items frequently mentioned with
a brand indicate which items a brand is associated with. Based on this, Chipotle is more strongly
associated with burritos and chicken, and not as much with tacos or beef or avocado. This could
serve as input into a formal menu planning exercise – more items related to burritos and chicken
might make these brand-product associations stronger. Lastly, as mentioned earlier, the overall

24
trend of increasing (decreasing) discussion of certain brands after the implementation of the
regulation could be a leading signal of increasing (decreasing) demand.
Section 5. Model Comparison and Scalability
5.1 Model Comparison
We assess improvement in model performance due to the incorporation of three features
which are unique to the marketing literature: a) allowing words to belong to multiple topics
probabilistically (instead of deterministically), b) allowing the researcher to seed certain topics
with specific words which are considered substantively important, and c) allowing the
distribution of topics within a document to be affected by the length of the document.
Model A deterministically allocates each word in the vocabulary to only one topic. We
achieve this by assuming that each word deterministically belongs to the topic for which the
posterior probability is the greatest, i.e. we assume kv is 1 (and 0 otherwise) if the posterior
probability of word belonging to topic k is greater than the posterior probability of this word
belonging to any other topic. Model B is an unseeded model i.e. we do not impose any prior
distribution k of any topic to contain any word with high probability. Model C is identical to the
proposed model with the exception that we assume that d is drawn from a Dirichlet distribution
with parameter which is invariant across reviews, and does not depend on review length. For
model comparison, we compute the perplexity score - the likelihood of observing a collection of
words given a model of how the words were generated. It is monotonically decreasing in the
likelihood of the data, such that models with lower perplexity fit the data better. It is commonly
used for model comparison in the Natural Language Processing literature (Blei et al. 2003,
Arora, Ge and Moitra 2012), and is defined as follows:
1
1
lo |(
g ( )) )
D
traind
test D
dd
dtestp w D
perplexity D expN
(7)
Where, ( ),
1 1 1( | [ ])
d
id
n K VI w vd train test
test train k vi k v
kdp w D
(8)
25
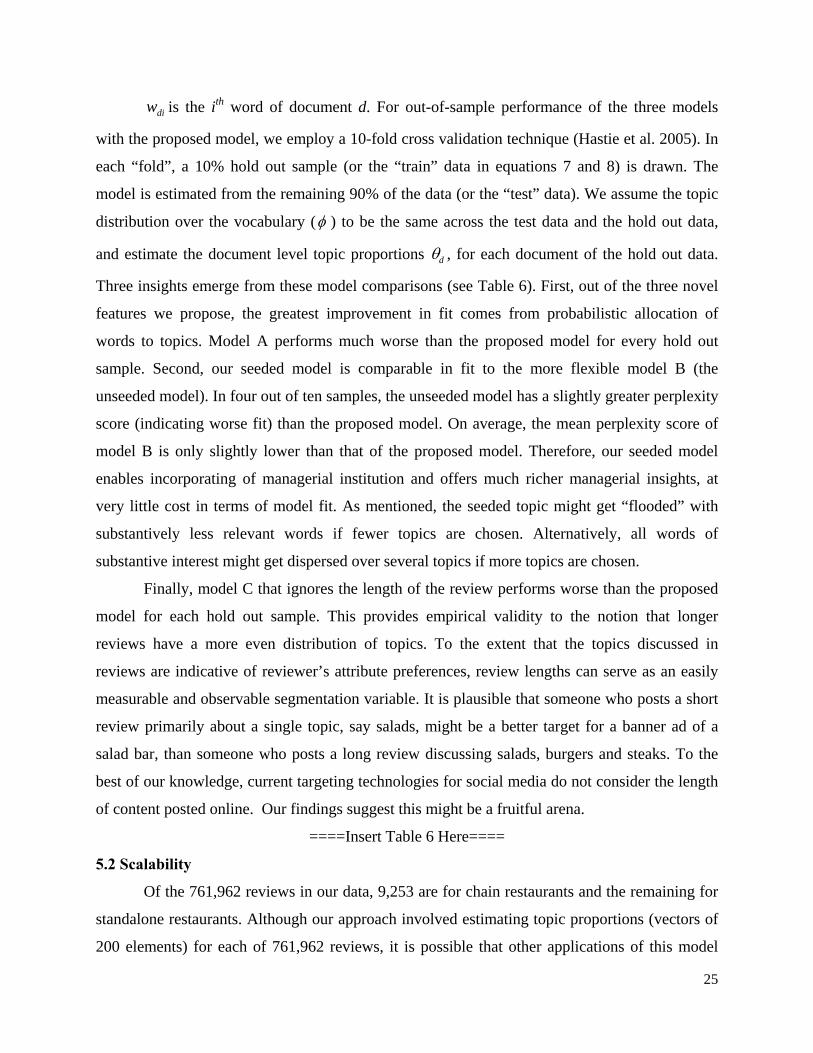
diw is the ith word of document d. For out-of-sample performance of the three models
with the proposed model, we employ a 10-fold cross validation technique (Hastie et al. 2005). In
each “fold”, a 10% hold out sample (or the “train” data in equations 7 and 8) is drawn. The
model is estimated from the remaining 90% of the data (or the “test” data). We assume the topic
distribution over the vocabulary ( ) to be the same across the test data and the hold out data,
and estimate the document level topic proportions d , for each document of the hold out data.
Three insights emerge from these model comparisons (see Table 6). First, out of the three novel
features we propose, the greatest improvement in fit comes from probabilistic allocation of
words to topics. Model A performs much worse than the proposed model for every hold out
sample. Second, our seeded model is comparable in fit to the more flexible model B (the
unseeded model). In four out of ten samples, the unseeded model has a slightly greater perplexity
score (indicating worse fit) than the proposed model. On average, the mean perplexity score of
model B is only slightly lower than that of the proposed model. Therefore, our seeded model
enables incorporating of managerial institution and offers much richer managerial insights, at
very little cost in terms of model fit. As mentioned, the seeded topic might get “flooded” with
substantively less relevant words if fewer topics are chosen. Alternatively, all words of
substantive interest might get dispersed over several topics if more topics are chosen.
Finally, model C that ignores the length of the review performs worse than the proposed
model for each hold out sample. This provides empirical validity to the notion that longer
reviews have a more even distribution of topics. To the extent that the topics discussed in
reviews are indicative of reviewer’s attribute preferences, review lengths can serve as an easily
measurable and observable segmentation variable. It is plausible that someone who posts a short
review primarily about a single topic, say salads, might be a better target for a banner ad of a
salad bar, than someone who posts a long review discussing salads, burgers and steaks. To the
best of our knowledge, current targeting technologies for social media do not consider the length
of content posted online. Our findings suggest this might be a fruitful arena.
====Insert Table 6 Here====
5.2 Scalability
Of the 761,962 reviews in our data, 9,253 are for chain restaurants and the remaining for
standalone restaurants. Although our approach involved estimating topic proportions (vectors of
200 elements) for each of 761,962 reviews, it is possible that other applications of this model
26
might require larger datasets (e.g. comparisons of topic proportions from user generated content
across cities or even countries). As such, it is important to assess the scalability of our model to
larger datasets.
We estimate the entire model (i.e. every parameter) on datasets of varying number of
reviews, and report time taken to convergence. Although inspection of time series of log-
likelihoods across iterations of the MCMC chain reveals that convergence is achieved in 600
iterations irrespective of sample size, we report computation times for 2,000 iterations. We used
a standard machine with an Intel 3930K processor capable of maximum speed of 4.5 Ghz (on a
single core) and a RAM of 48 Gb. Convergence times for datasets with 50,000, 100,000 and
660,000 documents are 3.4 hours, 8.7 hours and 61.9 hours respectively. Convergence times
seem to increase approximately linearly with sample size. For most applications of the model
that are not real time, this estimation time seems acceptable. Therefore, we believe our model
holds promise for real time marketing applications. A brand manager might wish to track the
proportion of a topic seeded with key brands on a daily basis, based on the analysis of all product
reviews posted for the product category. Even though such applications might be based on
smaller datasets (the number of reviews posted on any given day are not very high), we refer the
reader to an active research stream in computer science concerned with reducing computation
time using both deterministic and stochastic estimation techniques (Mimno et al. 2012, Zhai et
al. 2012).
Section 6. Conclusion
The growth of the internet has led to the availability of very large quantities of data that
are often less structured than data collected offline. Such data are often in the form of opinions of
consumers (e.g. blogs, product reviews), from an increasingly representative subset of the
population, are in the public domain, and are available for long periods of time (e.g. 8 years in
this research). This provides an unprecedented opportunity for marketers not just to understand
what consumers are saying about their products at a point in time, but also to continuously track
changes in consumer opinion over time. However, a major challenge for researchers is that much
of these data are textual. It is perhaps for this reason that much the research based on user-
generated online content has focused on numerical descriptors of these data or simpler measures
like word count. Techniques to analyze large volumes of text are at a nascent stage even in
27
computer science. Yet, there is considerable interest from practitioners in using these data to gain
usable knowledgeable. A recent report by the McKinsey Global Institute (Manyika et al. 2011)
suggests that analyzing such data will become a “key basis of competition, underpinning new
waves of productivity growth, innovation, and consumer surplus.”
Early research using online textual data in marketing has been focused on inferring
market structure and product attributes in specific product categories; to ascertain the extent to
which these correlate with consumer level data collected from more traditional experimental and
survey based techniques; and to incorporate measures of such data in demand models. We extend
this work by using textual data to address an issue that has perhaps been infeasible otherwise:
how can researchers track changes in consumer opinion over time, and assess the impact of
exogenous events on such changes? Specifically we assess the impact of a regulation to post
calories in chain restaurants, on consumer opinion pertaining to chain restaurants. Across
marketing and computer science, we were unable to find other research that use textual data to
infer the effect of any factor on consumer opinion. We find significant changes in proportions of
various topics of discussion due to the implementation of the regulation. Methodologically, we
extend the Latent Dirichlet Allocation set of models in computer science. These represent the
state-of-the-art in that literature, and we introduce these models to marketing. We look forward
to several strategy- and policy-relevant applications as well as more sophisticated models in this
area of topic detection and measurement.
28
References
Allison, D. B., K. R. Fontaine, J. E. Manson, J. Stevens, T.D. VanItallie. 1999. Annual Deaths Attributable to Obesity in the United States. The Journal of the American Medical Association. 282(16), 1530--1538.
AlSumait, L., D. Barbará, J. Gentle, C. Domeniconi. 2009. Topic Significance Ranking of LDA Generative Models. Proceedings of the European Conference on Machine Learning and Knowledge Discovery in Databases: Part I. 67--82.
Archak, N., A. Ghose, P. G. Ipeirotis. 2011. Deriving the Pricing Power of Product Features by Mining Consumer Reviews. Management Science. 57(8), 1485--1509.
Arora, S., R. Ge, A. Moitra. 2012. Learning Topic Models - Going beyond SVD. Proceedings of the 2012 IEEE 53rd Annual Symposium on Foundations of Computer Science. 1--10.
Bird, S., E. Loper, E. Klein. 2009. Natural Language Processing with Python. O'Reilly Media Inc.
Blattberg, R. C., S. J. Hoch. 1990. Database Models and Managerial Intuition: 50% Model+ 50% Manager. Management Science. 36(8), 887--899.
Blei, D. M., 2012. Probabilistic topic models. Communications of the ACM. 55(4) 77--84.
Blei, D. M., A. Ng, M. Jordan. 2003. Latent Dirichlet Allocation. Journal of Machine Learning Research. Volume 3, 993--1022.
Bollinger, B., P. Leslie, A. Sorensen. 2011. Calorie Posting in Chain Restaurants. American Economic Journal: Economic Policy. 91-128.
Cao, J., T. Xia, J. Li, Y. Zhang, S. Tang. 2009. A Density-Based Method for Adaptive LDA Model Selection. Neurocomputing. 72(7-9), 1775--1781.
Chang, J., J. Boyd-Graber, S. Gerrish, C. Wang, D. M. Blei. 2009. Reading Tea Leaves: How Humans Interpret Topic Models. Neural Information Processing Systems, 1-9.
Decker, R., M. Trusov. 2010. Estimating Aggregate Consumer Preferences from Online Product Reviews. International Journal of Research in Marketing, 27(4), 293--307.
Deveaud, R., E. SanJuan, P. Bellot. 2012. LIA at TREC 2012 Web Track: Unsupervised Search Concepts Identification from General Sources of Information, Proceedings of the 21th Text REtrieval Conference (TREC 2012), Gaithersburg, USA, November 7-9.
Dickey, J. M. 1983. Multiple Hypergeometric Functions: Probabilistic Interpretations and Statistical Uses. Journal of the American Statistical Association. 78(383), 628--637.

29
Downs, J. S., J. Wisdom, B. Wansink, G. Loewenstein. 2013. Supplementing Menu Labeling With Calorie Recommendations to Test for Facilitation Effects. American Journal of Public Health. 103(9), 1604--1609.
Eliashberg, J., S. K. Hui, J. Zhang. 2007. From Story Line to Box Office: A New Approach for Green-lighting Movie Scripts. Management Science. 53(6), 881--893.
Finkelstein, E. A., J. G. Trogdon, J. W. Cohen, W. Dietz. 2009. Annual Medical Spending Attributable to Obesity: Payer and Service Specific Estimates. Health Affairs. 28(5), 822--831.
Ghose, A., P. G. Ipeirotis, B. Li. 2012. Designing Ranking Systems for Hotels on Travel Search Engines by Mining User-generated and Crowdsourced Content. Marketing Science. 31(3), 493--520.
Godes, D., D. Mayzlin. 2004. Using Online Conversations to Study Word-of-Mouth Communication. Marketing Science. 23(4), 545--560.
Godes, D., J. C. Silva. 2013. Sequential and Temporal Dynamics of Online Opinion. Marketing Science. 31(3). 448--473.
Griffin, A., J. R. Hauser. 1993. The Voice of the Customer. Marketing Science. 12(1), 1--27.
Griffiths, T., M. Steyvers. 2004. Finding Scientific Topics. Proceedings of the National Academy of Sciences of the United States of America. 101(Suppl 1), 5228--5235.
Hartmann, W., H. S. Nair, S. Narayanan. 2011. Identifying Causal Marketing Mix Effects Using a Regression Discontinuity Design. Marketing Science. 30(6), 1079--1097.
Hastie, T., R. Tibshirani, J. Friedman, J. Franklin. 2005. The Elements of Statistical Learning: Data Mining, Inference and Prediction. The Mathematical Intelligencer. 27(2), 83--85.
Jalonick, M. C. 2013. FDA Head Says Menu Labeling 'Thorny' Issue. Associated Press, March 12.
Kullback, S., R. Leibler. 1951. On Information and Sufficiency. Annals of Mathematical Statistics. 22 (1), 79-86.
Kuo, T., C. J. Jarosz, P. Simon, J. E. Fielding. 2009. Menu Labeling as a Potential Strategy for Combating the Obesity Epidemic: a Health Impact Assessment. American Journal of Public Health. 99(9), 1680--1686.
Lee, T. Y., E. T. Bradlow. 2011. Automated Marketing Research Using Online Customer Reviews. Journal of Marketing Research. 48(5), 881--894.
Lin, J., 1991. Divergence Measures Based on the Shannon Entropy. IEEE Transactions on Information Theory. 37(1), 145--151.
30
Li, X.. L. M. Hitt. 2008. Self-Selection and Information Role of Online Product Reviews. Information Systems Research, 456-474.
Lu, B., M. Ott, C. Cardie, B. Tsou. 2011. Multi-aspect Sentiment Analysis with Topic Models. Data Mining Workshops (ICDMW), 2011 IEEE 11th International Conference. 81--88.
Manyika, J., M. Chui, B. Brown, J. Bughin, R. Dobbs, C. Roxburgh, A. H. Byers. 2011. Big Data: the Next Frontier for Innovation, Competition, and Productivity. McKinsey Global Institute, May.
Mimno, D., M. D. Hoffman, D. M. Blei. 2012. Sparse Stochastic Inference for Latent Dirichlet Allocation. Proceedings of the 29th International Conference on Machine Learning.
Mimno, D., H. M. Wallach, E. Talley, M. Leenders, A. McCallum. 2011. Optimizing Semantic Coherence in Topic Models. Proceedings of the Conference on Empirical Methods in Natural Language Processing, 262--272.
Minka, T. P. 2000. Estimating a Dirichlet Distribution. http://research.microsoft.com/en-us/um/people/minka/papers/dirichlet/minka-dirichlet.pdf.
Netzer, O., R. Feldman, J. Goldenberg, M. Fresko. 2012. Mine Your Own Business: Market-Structure Surveillance Through Text Mining. Marketing Science. 31(3), 521--543.
Roe, B., A. S. Levy, B. M. Derby. 1999. The Impact of Health Claims on Consumer Search and Product Evaluation Outcomes: Results from FDA Experimental Data. Journal of Public Policy and Marketing. 89--105.
Steyvers, M. T. Griffiths, T. 2007. Probabilistic Topic Models. Handbook of Latent Semantic Analysis. 427(7), 424--440.
Thistlethwaite, D. L., D. T. Campbell. 1960. Regression-discontinuity Analysis: An Alternative to the Ex Post Facto Experiment. Journal of Educational Psychology. 51(6), 309.
Wierenga, B. 2006. Motion pictures: Consumers, Channels, and Intuition. Marketing Science. 25(6), 674--677.
Yaniv, I., R. M. Hogarth. 1993. Judgmental Versus Statistical Prediction: Information Asymmetry and Combination Rules. Psychological Science. 4(1), 58--62.
Zhai, K., J. Boyd-Graber, N. Asadi, M. L. Alkhouja. 2012. Mr. LDA: A Flexible Large Scale Topic Modeling Package Using Variational Inference in MapReduce. Proceedings of the 21st International Conference on World Wide Web, 879--888.

31
Table 1: Most Frequently Occurring Words by Restaurant Type and Time Period
Reviews and Data Period
Most frequently occurring 100 words
Reviews from chain restaurants (before July 1, 2008)
good,love,$,chicken,steak,fries,service,salad,burger,lunch,pretty,chipotle,better,location,burrito,fast,free,best,fresh,cheese,chain,line,cosi,meat,sandwich,nice,wait,didn,bad,burgers,bread,sauce,taste,give,meal,delicious,hot,friend,minutes,square,night,find,side,tasty,guys,city,bit,sandwiches,worth,dinner,white,mexican,wasn,street,staff,isn,feel,nyc,friends,york,burritos,places,lobster,drinks,drink,kind,price,quick,chips,taco,bar,beef,lot,rice,doesn,experience,hour,huge,red,half,extra,bacon,things,makes,bell,games,fun,manhattan,joint,garden,mcdonald,friendly,wanted,cheap,hard,olive,full,expensive,salads,favorite
Reviews from standalone restaurants (before July 1, 2008)
good,service,$,nice,pretty,bar,best,chicken,night,delicious,love,sauce,didn,better,dinner,bit,cheese,friend,lunch,meal,wait,wine,salad,tasty,fresh,friends,pizza,drinks,sushi,dishes,side,bad,wasn,dish,hot,rice,experience,meat,soup,staff,worth,friendly,atmosphere,dessert,fried,taste,amazing,give,special,find,feel,drink,burger,decor,fries,sweet,prices,favorite,perfect,places,brunch,pork,bread,excellent,nyc,cheap,kind,fish,chocolate,sandwich,lot,city,tables,decent,dining,price,fun,room,served,spicy,steak,thought,large,huge,beef,things,beer,recommend,waiter,full,top,street,happy,york,minutes,french,flavor,home,cream,shrimp
Reviews from chain restaurants (after July 1, 2008)
good,service,burger,steak,$,fries,salad,lunch,chicken,better,pretty,location,sandwich,love,nice,chipotle,didn,cheese,meal,fresh,fast,best,bad,line,wait,delicious,meat,bread,burrito,bit,staff,burgers,give,experience,minutes,sauce,free,side,chain,taste,wasn,friendly,hot,price,nyc,guys,bar,night,dinner,sandwiches,tasty,friend,pizza,waiter,square,decent,quality,find,cooked,feel,half,city,asked,quick,lobster,drink,lot,subway,drinks,worth,wanted,prices,amazing,places,special,toppings,put,bacon,huge,extra,week,rice,full,hour,happy,medium,thought,shrimp,kind,review,potatoes,shake,white,clean,top,friends,waiting,things,favorite,cheap
Reviews from standalone restaurants (after July 1, 2008)
good,service,$,nice,delicious,pretty,chicken,best,bar,sauce,night,didn,love,better,dinner,meal,cheese,bit,wait,friend,lunch,fresh,dish,salad,pizza,amazing,wine,drinks,experience,pork,wasn,side,friends,taste,tasty,rice,dishes,bad,burger,fried,friendly,staff,meat,special,worth,sweet,give,soup,dessert,bread,hot,fries,spicy,price,brunch,perfect,drink,sandwich,nyc,flavor,sushi,minutes,atmosphere,favorite,waiter,find,feel,places,served,prices,lot,recommend,fish,happy,thought,excellent,kind,top,decent,beef,tasted,full,steak,hour,beer,wanted,cooked,tables,chocolate,quality,decor,asked,cream,city,things,large,huge,dining,awesome,super

32
Table 2: Seeded Topics, Other Coherent Topics and Associated Words
ID Name Coherence Score for Unseeded
Topics
Top 10 words in decreasing order of posterior probability of belonging to the topic
1 “Health” Seeded calories,calorie,healthy,fat,low,diet,protein, count,light,chicken
2 steak_wolfgang -265 steak,wolfgang,luger,spinach,peter,bacon, steakhouse,creamed,porterhouse,good
3 filet_steak -301 filet,steak,potatoes,lobster,good,mignon, mashed,crab,spinach,sides
4 chipotle_burrito(1) -308 chipotle,burrito,rice,beans,salsa,chicken, corn,cheese,sour,cream
5 chipotle_burrito(2) -311 chipotle,burrito,burritos,qdoba,mexican, bowl,fast,chicken,location,chips
6 juice_orange -326 juice,orange,cheap,business,buy, plastic,clear,realize,cups,puts
7 seated_server -337 seated,server,waiter,minutes,hostess, party,reservation,arrived,bar,wait
8 games_game -344 games,game,fun,play,dave,tickets, kids,card,arcade,playing
9 cake_chocolate -356 cake,chocolate,dessert,week,good, steak,salad,creme,filet,meal
10 olive_garden -361 olive,garden,italian,pasta,salad, breadsticks,bread,square,unlimited,og
11 sandwich_potbelly -364 sandwich,potbelly,sandwiches,bread, peppers,lunch,line,subway,hot,wreck
12 chef_benihana -365 chef,benihana,hibachi,shrimp,rice, show,chicken,fun,birthday,fried
13 medium_steak -366 medium,steak,rare,cooked,steaks, meat,good,waiter,filet,plate
14 burger_fries -375 burger,fries,guys,burgers,toppings, good,free,cheeseburger,regular,Cajun
15 salad_salads -376 salad,salads,dressing,bowl,ingredients, toppings,lunch,chopped,$,fresh
16 tip_% -381 tip,%,bill,18,waiter,service,gratuity, waitress,didn,added
17 cosi_sandwich -382 cosi,sandwich,bread,salad,sandwiches, tomato,chicken,lunch,good,soup
18 wings_hooters -383 wings,hooters,girls,beer,waitress, buffalo,hot,waitresses,chicken,pretty
19 onions_lettuce -384 onions,lettuce,grilled,cheese,sauce,tomatoes, mushrooms,ketchup,tomato,mustard
20 dinner_appetizers -385 dinner,appetizers,night,good, main,entrees,party,shrimp,drinks,delicious

33
Table 3: Distributions of Topic Proportions Before and After the Regulation (Chain Restaurants)
Topics Mean topic proportion
(across reviews)
Proportion of reviews for which topic proportion
exceeds 0.5%
All Pre Post All Pre Post
“Health” 0.48% 0.43% 0.48% 6.14% 6.09% 6.15%
steak_wolfgang 1.69% 1.80% 1.67% 9.20% 8.42% 9.30%
filet_steak 1.51% 1.08% 1.57% 11.00% 7.61% 11.47%
chipotle_burrito(1) 1.56% 1.57% 1.56% 9.38% 9.94% 9.30%
chipotle_burrito(2) 2.62% 3.52% 2.50% 14.59% 16.65% 14.31%
juice_orange 0.28% 0.17% 0.29% 3.22% 4.21% 3.09%
seated_server 0.91% 0.54% 0.96% 10.58% 7.79% 10.96%
games_game 1.00% 1.62% 0.91% 5.81% 7.88% 5.53%
cake_chocolate 0.42% 0.51% 0.41% 7.74% 9.40% 7.51%
olive_garden 0.86% 1.25% 0.81% 5.77% 6.71% 5.64%
sandwich_potbelly 1.76% 0.42% 1.95% 9.59% 6.45% 10.02%
chef_benihana 0.52% 0.47% 0.53% 4.25% 4.39% 4.23%
medium_steak 0.65% 0.61% 0.65% 9.07% 7.88% 9.23%
burger_fries 2.55% 2.40% 2.57% 12.72% 11.37% 12.91%
salad_salads 1.35% 1.26% 1.36% 10.52% 10.65% 10.50%
tip_% 0.55% 0.44% 0.56% 6.66% 4.92% 6.90%
cosi_sandwich 1.35% 1.74% 1.30% 8.41% 10.47% 8.12%
wings_hooters 0.54% 0.82% 0.51% 5.31% 6.80% 5.10%
onions_lettuce 0.48% 0.46% 0.48% 7.77% 7.43% 7.82%
dinner_appetizers 0.42% 0.34% 0.44% 7.84% 7.70% 7.85%
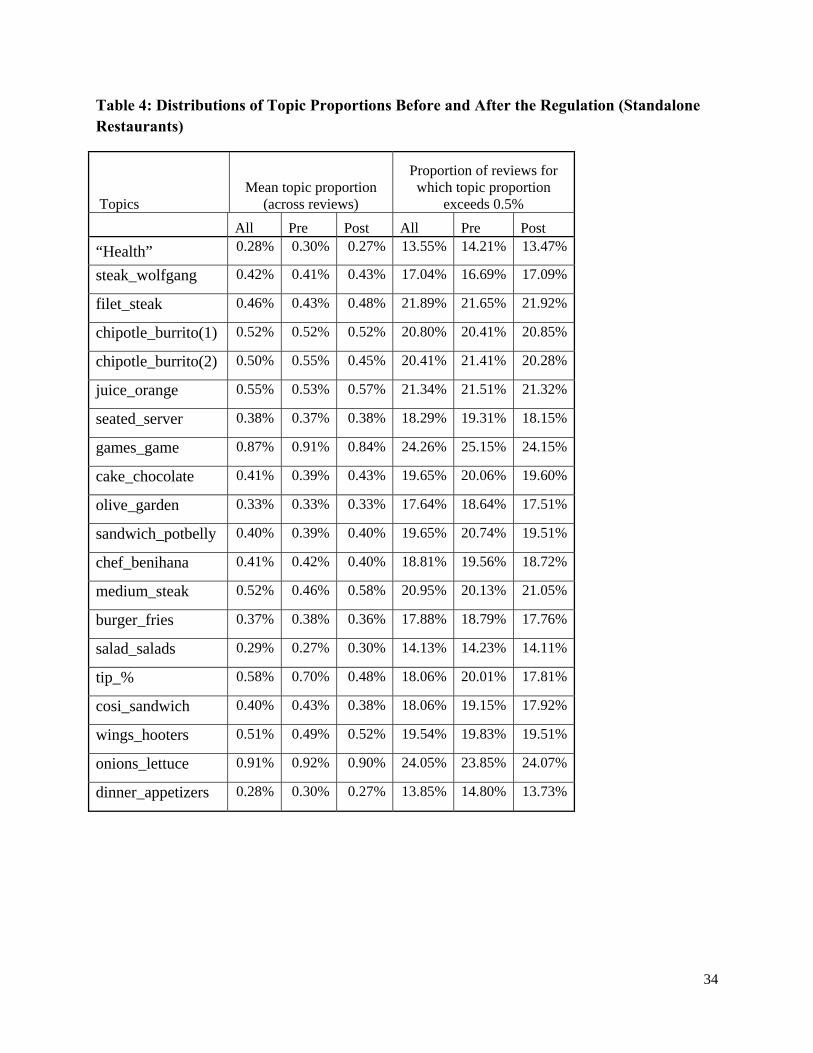
34
Table 4: Distributions of Topic Proportions Before and After the Regulation (Standalone Restaurants)
Topics Mean topic proportion
(across reviews)
Proportion of reviews for which topic proportion
exceeds 0.5%
All Pre Post All Pre Post
“Health” 0.28% 0.30% 0.27% 13.55% 14.21% 13.47%
steak_wolfgang 0.42% 0.41% 0.43% 17.04% 16.69% 17.09%
filet_steak 0.46% 0.43% 0.48% 21.89% 21.65% 21.92%
chipotle_burrito(1) 0.52% 0.52% 0.52% 20.80% 20.41% 20.85%
chipotle_burrito(2) 0.50% 0.55% 0.45% 20.41% 21.41% 20.28%
juice_orange 0.55% 0.53% 0.57% 21.34% 21.51% 21.32%
seated_server 0.38% 0.37% 0.38% 18.29% 19.31% 18.15%
games_game 0.87% 0.91% 0.84% 24.26% 25.15% 24.15%
cake_chocolate 0.41% 0.39% 0.43% 19.65% 20.06% 19.60%
olive_garden 0.33% 0.33% 0.33% 17.64% 18.64% 17.51%
sandwich_potbelly 0.40% 0.39% 0.40% 19.65% 20.74% 19.51%
chef_benihana 0.41% 0.42% 0.40% 18.81% 19.56% 18.72%
medium_steak 0.52% 0.46% 0.58% 20.95% 20.13% 21.05%
burger_fries 0.37% 0.38% 0.36% 17.88% 18.79% 17.76%
salad_salads 0.29% 0.27% 0.30% 14.13% 14.23% 14.11%
tip_% 0.58% 0.70% 0.48% 18.06% 20.01% 17.81%
cosi_sandwich 0.40% 0.43% 0.38% 18.06% 19.15% 17.92%
wings_hooters 0.51% 0.49% 0.52% 19.54% 19.83% 19.51%
onions_lettuce 0.91% 0.92% 0.90% 24.05% 23.85% 24.07%
dinner_appetizers 0.28% 0.30% 0.27% 13.85% 14.80% 13.73%

35
Table 5: The Effect of Calorie Posting Regulation on Topic Proportions
Topic Coefficient of
Posting Coefficient of
Chain Posting
“Health” M (0.05) 3.50 SD 0.04 0.55
steak_wolfgang M 0.17 6.92 SD 0.08 1.14
filet_steak M 0.03 16.61 SD 0.07 0.95
chipotle_burrito(1) M 0.09 17.76 SD 0.08 1.09
chipotle_burrito(2) M (0.23) 27.84 SD 0.08 1.20
juice_orange M (0.14) (4.63) SD 0.08 1.10
seated_server M (0.13) 3.39 SD 0.05 0.75
games_game M (0.04) 1.78 SD 0.12 1.80
cake_chocolate M 0.07 1.10 SD 0.06 0.83
olive_garden M (0.11) 11.02 SD 0.05 0.70
sandwich_potbelly M (0.18) (1.50) SD 0.05 0.73
chef_benihana M (0.13) (0.97) SD 0.05 0.77
medium_steak M 0.39 1.57 SD 0.08 1.17
burger_fries M (0.07) 45.05 SD 0.07 1.06
Salad_salads M 0.03 12.24 SD 0.06 0.82
tip_% M (0.35) 3.08 SD 0.07 1.03
cosi_sandwich M (0.20) 3.56 SD 0.06 0.90
wings_hooters M (0.02) (3.14) SD 0.08 1.14
onions_lettuce M 0.32 (2.35) SD 0.11 1.60
dinner_appetizers M (0.09) 2.76 SD 0.04 0.54
Note: M and SD stand for the mean and standard error of the coefficient estimate. p-value<0.05 for parameter estimates in bold.
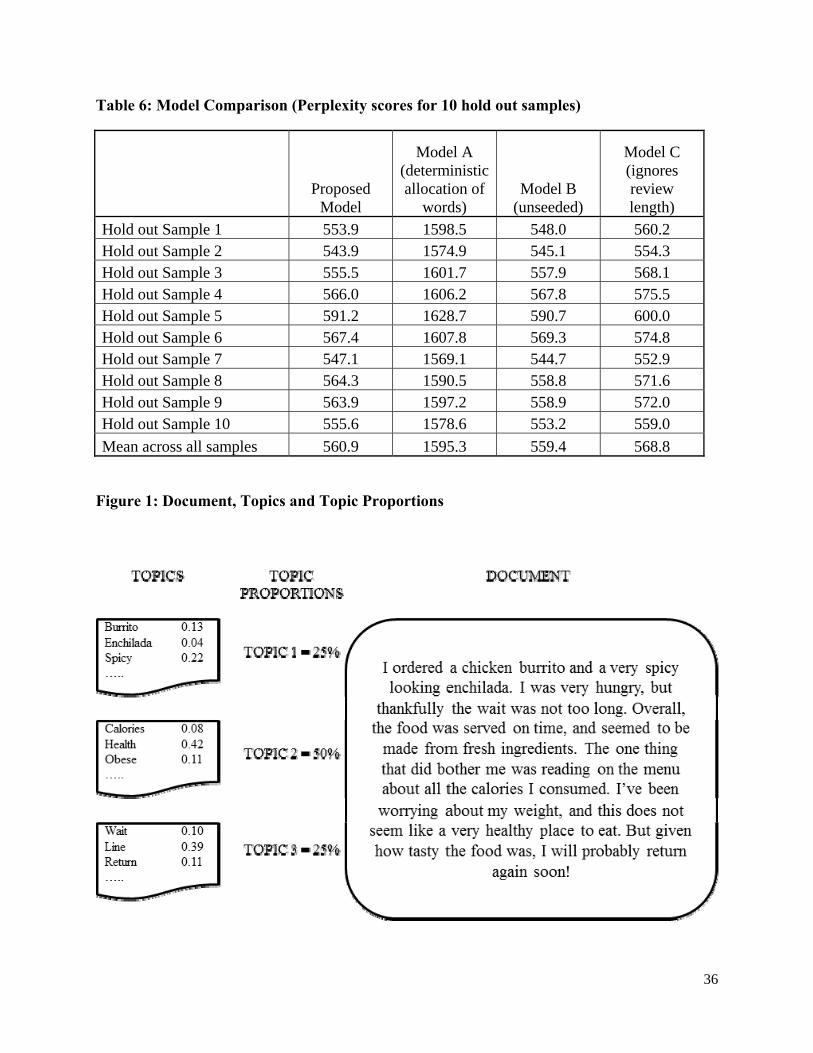
36
Table 6: Model Comparison (Perplexity scores for 10 hold out samples)
Proposed
Model
Model A (deterministic allocation of
words) Model B
(unseeded)
Model C (ignores review length)
Hold out Sample 1 553.9 1598.5 548.0 560.2 Hold out Sample 2 543.9 1574.9 545.1 554.3 Hold out Sample 3 555.5 1601.7 557.9 568.1 Hold out Sample 4 566.0 1606.2 567.8 575.5 Hold out Sample 5 591.2 1628.7 590.7 600.0 Hold out Sample 6 567.4 1607.8 569.3 574.8 Hold out Sample 7 547.1 1569.1 544.7 552.9 Hold out Sample 8 564.3 1590.5 558.8 571.6 Hold out Sample 9 563.9 1597.2 558.9 572.0 Hold out Sample 10 555.6 1578.6 553.2 559.0
Mean across all samples 560.9 1595.3 559.4 568.8
Figure 1: Document, Topics and Topic Proportions
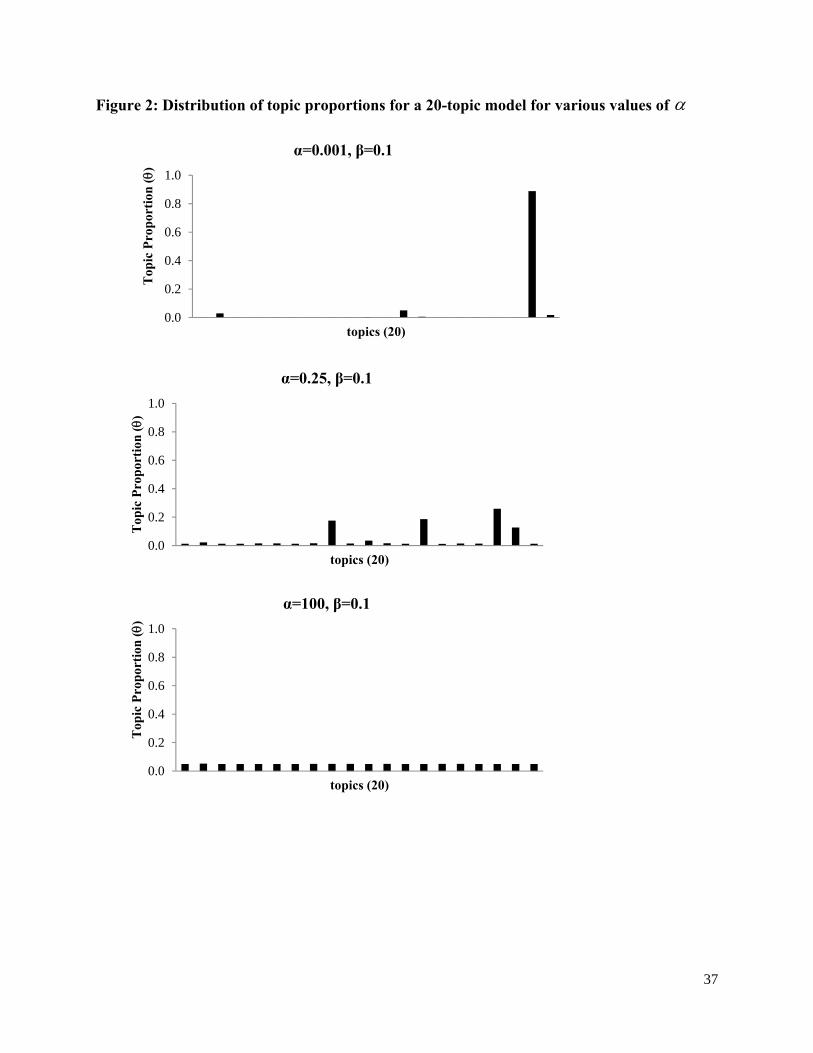
37
Figure 2: Distribution of topic proportions for a 20-topic model for various values of
0.0
0.2
0.4
0.6
0.8
1.0
Top
ic P
rop
orti
on ()
topics (20)
α=0.001, β=0.1
0.0
0.2
0.4
0.6
0.8
1.0
Top
ic P
rop
orti
on ()
topics (20)
α=0.25, β=0.1
0.0
0.2
0.4
0.6
0.8
1.0
Top
ic P
rop
orti
on ()
topics (20)
α=100, β=0.1

38
Online Appendix 1: Derivation of Equation (1)
Our objective is to estimate:
( , , , | , )
( | , , , , ) ( , , | , )
( | , , , , ) ( | , , ) ( | , ) ( | )
( | , ) ( | ) ( | ) ( | )
p
p p
p p p p
p p p p
w θ z
w θ z θ z
w θ z z θ θ
w z z θ θ (A1.1)
The joint probability for observing a single document with a given topic assignment is given by:
1
( , | , )
( | , , , , ) ( , | , )
( | , , , , ) ( | , , ) ( | , ) ( | )
( | , ) ( | ) ( | ) ( | )
( | , ) ( | )
,
d
d d
d d dd d d d
d d dd d d d d d
d d dd d d
nid id id
di
p
p n p n d d
p n p n p n p d d
p p p n p d d
p w z p z p
w z
w θ z θ z
w θ z z θ θ
w z z θ θ
θ ( | ) ( | )d dn p d d θ
(A1.2)
To get the probability of observing a given document given the hyper-parameters, we need to
integrate over , and sum over the K possible values of idz .
11( | , ) ( | , ) ( | ) ( | ) ( | )
d
id
nKd id id id
d d d diz
p n p w z p z p n p d d
w θ θ (A1.3)
A useful result yielding a more compact notation is as follows,
1
( )( | , ) ( | ) ( | , ) ( | )][ idI w vV
id id id id id idd d
v
p w z k p z i p w v z k p z kv
θ θ
where I is the indicator function. Therefore,
1 1
( )
1 1 1
1 1 1
( | , )
( | , ) ( | ) ( | ) ( | )
( ( | ) ( | )
( | ) ( |
[ ( | k, ) | )]
[ ( |)
d
id
d
id
d
dd
n Kid id id
d d di z
n K VI w vid id id
d d di k v
n K Vid id
d di k v
p w v
p n
p w z p z p n p d d
p z p n p d d
p
z k
wn pp v z
w
θ θ
θ θ
θ ( )(, ) | )] idI w viddp z k dk d θ

39
(A1.4)
The model assumptions allow us to further simplify this. Note that if idw word v in the vocabulary and idz topic k then ( | , )kid idp w zv = ,k v . Also ( | ) ,kid
dp z k since idz is drawn from a categorical distribution with parameter d .
( )
1 1 1
( ),
1 1 1
( | , )
( | ) ( | ) (
(
[ ( | , ) | )]
( ) [| ]| )
d
id
d
id
d
n K VI w vid id id
d d di k v
n K VI w v
d d k vi k
k
vd
p
p n p p z d d
p n p d
p w v z k k
d
w
θ θ
θ
(A1.5)
Equation (1) is simply the product of (A1.5) over D documents.

40
Online Appendix 2: Optimizing Hyper-Parameters incorporating document length.
Recall that D is total number of documents in the corpus; d is the index of specific document. dn
is the number of words in a document. k is the topic index and there are K topics in the model. v is a unique word in the vocabulary and the size of the vocabulary is V. Finally k
dn is the number
of words in document d assigned to topic k. To optimize the joint probability with respect to , we focus on the terms that contain as follows.
1
1
( ( ))( )
( , | , )( ( )) ( )
K
D dDd k
K
kd
dd d d
n nn
Pn K n n
w z (A2.1)
Taking logs for convenience:
1 1
( )( ( , | , ) )
( ( ))
{ ( ( ))} { ( )}
dK
d
D K
dk
kdd d
d
K nLog P D log
n
log n n log K n n
w z
(A2.2)
At the optimal value of = * we have,
*
* * *
11
* *
1
( ( , | , ) ) { ( ( )) ( ( ))}
{( ( ( )) ( ( ))}
D K
d dkd
D
k
d d dd
dLog P log n n log n
log K n log K n n
w z
(A2.3)
Directly maximizing this log likelihood (by setting the derivative w.r.t * of the above equation to 0) yields an intractable expression. We make use of two bounds (listed below) on gamma functions instead (Minka 2000), where x is the actual positive real number, x̂ another positive real number (which , as shown below, we can view as an estimate of x ) and n is an integer.
ˆ ˆ ˆ ˆ ˆ ˆ( ) ( ) ( ) ( ) ( ( ) ( ))( ( ) ( ))log x n log x log x n log x x log x log x x n x (A2.4a)
And
ˆ ˆ ˆ ˆ( ) ( ) ( ) ( ) ( ( ) ( ))( )log x log x n log x log x n x n x x x (A2.4b)
is the digamma function. We can consequently rewrite equation A2.3 by substitute the bounds defined in equations A2.4a and A2.4b. For the first portion of equation A2.3, we use equation A2.4a, where *
dx n and dkn n . For the latter half of equation A2.3 we use
equation A2.4b, where *dx K n and dn n . This results in:

41
1 1
1
( ( , | , )
{ ( ( )) ( ( ))
( ( ) ( ))( ( ) ( )}
{ ( ( )) ( ( ))
( ( ) ( ))( )
n
n }
D
d dd k
d d d d d
D
d
Kkd
kd
d dd
d d d d d
Log P
log n n log n
n n n n log log n
log K n log K n
K n n
n
K n K n K
w z
(A2.5)
We can group all terms that do not involve into a constant term.
*
*
*
1 1
*
1
( ( , | , )
{ ( ( ) ( ))( ( )}
{( (K ) ( )
n
) )}n(
Kk
D
d d dd
d dk
D
d d d dd
Log P
n n n n l
n
og
n K n K C
w z
(A2.6)
Maximizing this lower bound w.r.t. would mean that the bound would more closely approximate the maximum of the log likelihood (it can be seen that the double derivative is 0).
Taking the derivative w.r.t. and setting it to 0 yields:
**
*
*1 1
1
( ( , | , )0
1{ ( ( ) ( )) }
{( ( ) ( ))( )}
D K
d d d dd k d
D
d d d dd
kd
dLog P
d
n n n n nn
K n n K n Kn
w z
(A2.7)
This yields a simpler update:
1 1
1
{( ( ) ( ))}
n {( ( ) ( ))}
D
d d dd k
D
Kkd
d d d dd
n n n n
K K n Kn n
(A2.8)
We can iteratively update the value of * until convergence, yielding the maximum likelihood estimate of * . In practice this converges relatively quickly. We can similarly derive the update for the hyper-parameter .

42
Online Appendix 3: Other Topics Names and Coherence Scores (C.S.)
ID Name C.S. ID Name C.S. ID Name C.S. 1 white_castle -385 37 chick_fil -443 73 gift_card -481
2 capital_grille -391 38 wine_glass -443 74 service_good -481
3 drink_drinks -391 39 bad_reviews -444 75 didn_boyfriend -482
4 steak_chris -391 40 soup_bon -444 76 money_worth -484
5 lunch_lines -394 41 dont_lot -446 77 wasn_bad -484
6 side_bison -396 42 delicious_fresh -447 78 $_99 -485
7 staff_friendly -398 43 potato_sweet -449 79 bit_better -485
8 bbq_chicken -399 44 eye_rib -450 80 service_good -485
9 fish_tacos -399 45 didn_asked -451 81 quick_bite -486
10 full_wonderful -399 46 fast_wendy -453 82 hard_rock -487
11 coffee_tea -402 47 fresh_ingredients -454 83 beef_patties -488
12 free_cosi -402 48 high_quality -454 84 good_nice -488
13 chicken_fried -403 49 tasted_didn -455 85 soda_coke -488
14 pizza_delivery -404 50 flavor_taste -457 86 $_pay -489
15 steak_house -405 51 good_better -457 87 onion_rings -489
16 good_pretty -414 52 extra_$ -458 88 door_top -490
17 manager_told -415 53 huge_portions -458 89 good_expectations -490
18 burger_shake -416 54 outback_steak -458 90 better_price -491
19 customers_counter -418 55 didn_worst -460 91 location_number -491
20 friday_tgi -419 56 !!_!!! -463 92 surprised_find -491
21 seating_tables -419 57 hit_miss -463 93 things_.) -491
22 friend_didn -423 58 birthday_coupon -464 94 ago_good -492
23 subway_sandwich -423 59 standard_good -464 95 hot_dog -492
24 chips_mexican -424 60 cream_ice -466 96 kind_doesn -493
25 palm_steak -426 61 york_city -466 97 pretty_cheap -493
26 good_service -427 62 service_bit -467 98 meal_end -495
27 sandwiches_pret -427 63 cashier_?" -469 99 pretty_cool -496
28 burger_fries -429 64 happy_hour -471 100 guy_lady -497
29 friends_group -429 65 nice_options -472 101 lobster_red -497
30 recommend_highly -430 66 ihop_pancakes -476 102 counter_walk -498
31 breakfast_egg -433 67 lunch_office -476 103 isn_places -498
32 fries_french -434 68 good_give -478 104 love_yum -498
33 service_slow -436 69 line_lunch -479 105 good_pretty -499
34 minutes_wait -438 70 ---_ny -480 106 good_nice -501
35 square_ruby -438 71 free_better -480 107 room_dining -501
36 bacon_tomato -440 72 nice_bit -480 108 avoid_awful -502
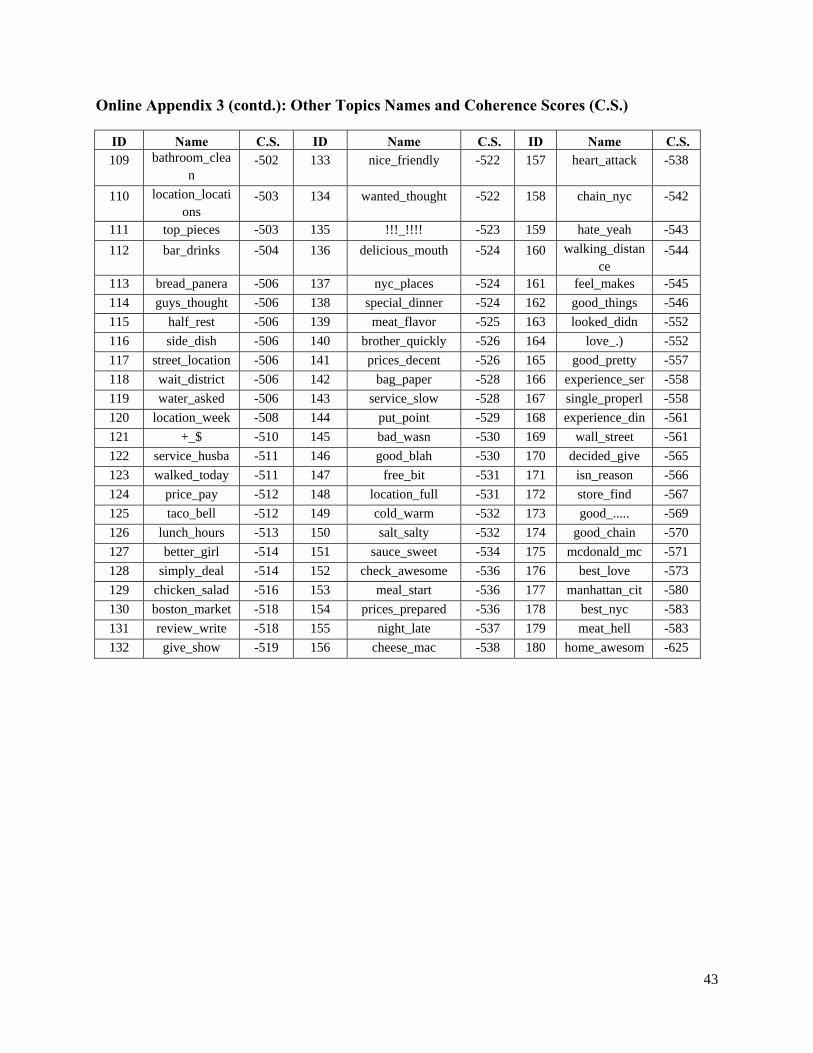
43
Online Appendix 3 (contd.): Other Topics Names and Coherence Scores (C.S.)
ID Name C.S. ID Name C.S. ID Name C.S. 109 bathroom_clea
n -502 133 nice_friendly -522 157 heart_attack -538
110 location_locations
-503 134 wanted_thought -522 158 chain_nyc -542
111 top_pieces -503 135 !!!_!!!! -523 159 hate_yeah -543
112 bar_drinks -504 136 delicious_mouth -524 160 walking_distance
-544
113 bread_panera -506 137 nyc_places -524 161 feel_makes -545
114 guys_thought -506 138 special_dinner -524 162 good_things -546
115 half_rest -506 139 meat_flavor -525 163 looked_didn -552
116 side_dish -506 140 brother_quickly -526 164 love_.) -552
117 street_location -506 141 prices_decent -526 165 good_pretty -557
118 wait_district -506 142 bag_paper -528 166 experience_ser -558
119 water_asked -506 143 service_slow -528 167 single_properl -558
120 location_week -508 144 put_point -529 168 experience_din -561
121 +_$ -510 145 bad_wasn -530 169 wall_street -561
122 service_husba -511 146 good_blah -530 170 decided_give -565
123 walked_today -511 147 free_bit -531 171 isn_reason -566
124 price_pay -512 148 location_full -531 172 store_find -567
125 taco_bell -512 149 cold_warm -532 173 good_..... -569
126 lunch_hours -513 150 salt_salty -532 174 good_chain -570
127 better_girl -514 151 sauce_sweet -534 175 mcdonald_mc -571
128 simply_deal -514 152 check_awesome -536 176 best_love -573
129 chicken_salad -516 153 meal_start -536 177 manhattan_cit -580
130 boston_market -518 154 prices_prepared -536 178 best_nyc -583
131 review_write -518 155 night_late -537 179 meat_hell -583
132 give_show -519 156 cheese_mac -538 180 home_awesom -625