THE EFFECT OF ANIMATED BANNER ADVERTISEMENTS ON A VISUAL
54
THE EFFECT OF ANIMATED BANNER ADVERTISEMENTS ON A VISUAL SEARCH TASK by MOIRA KATHLEEN BURKE A THESIS Presented to the Department of Computer and Information Science and the Honors College of the University of Oregon in partial fulfillment of the requirements for the degree of Bachelor of Arts June 2001
Transcript of THE EFFECT OF ANIMATED BANNER ADVERTISEMENTS ON A VISUAL

THE EFFECT OF ANIMATED BANNER ADVERTISEMENTS
ON A VISUAL SEARCH TASK
by
MOIRA KATHLEEN BURKE
A THESIS
Presented to the Department of Computer and Information Science and the Honors College of the University of Oregon
in partial fulfillment of the requirements for the degree of Bachelor of Arts
June 2001

ii
APPROVED: ____________________________________ Dr. Anthony J. Hornof

iii
An Abstract of the Thesis of
Moira Kathleen Burke for the degree of Bachelor of Arts in the Department of Computer and Information Science to be taken June 2001 Title: THE EFFECT OF ANIMATED BANNER ADVERTISEMENTS
ON A VISUAL SEARCH TASK
Approved: ____________________________________ Dr. Anthony J. Hornof
The growth of the Internet as a commercial medium has led advertisers to exploit
humans' inherent sensitivity to movement in the form of animated banner ads. An
experiment was designed to compare the exogenous, or involuntary, attention capture of
four types of banners: animated commercial banners, static commercial banners, flashing
text banners, and blank banners. Participants performed a simple visual search task in the
presence of the different banner types, and software recorded search times and errors.
Subjective workload ratings were also collected using NASA's Task Load Index system.
No significant difference in search time was found between the four conditions; however,
participants rated the search task with the animated banner distractors as much more
work-intensive.

iv
TABLE OF CONTENTS
Page
ABSTRACT iii
INTRODUCTION 1
Increase in Computer Use and Growth of the Internet 1 Animation as an Aid and Attention-Getter 2 Animation in Banner Advertisements 3
Animation in Attention-Capture Research 5 RESEARCH QUESTION 7
EXPERIMENT 1 8
Introduction 8 Materials and Methods 9
Subjects 9 Equipment 9 Software 9 Hardware 9 Design 10 Basic Task 10 Target and Distractors 10 Layout 11 Banners 12
Point Completion Deadline 14 Incentives and Penalties 14 Blocking 15
Procedure 16 Basic Experiment 16 NASA Task Load Index (TLX) Ratings 17 Results 19 Search Time and Error Rates 19 TLX Workload Scores 21 Discussion 22

v
EXPERIMENT 2 23
Materials and Methods 23
Subjects 23 Equipment 23 Design 23
Procedure 25 Results 25 Search Time and Error Rates 25 TLX Workload Scores 27 Discussion 28 Search Time and Error Rates 28 TLX Workload Scores 30 Post-Experiment Questionnaire 31
CONCLUSION 33 Future Research 33 Future of Web Advertising 34
REFERENCES 37
APPENDIX A: EXPERIMENT DOCUMENTS 40
Preliminary Questionnaire 40 Instructions - Visual Search Study 41
Instructions - Workload Evaluation 43 Form A (TLX Ratings) 44 Form B (TLX Weights) 45 Post-Experiment Questionnaire 47
APPENDIX B: ADDITIONAL EXPERIMENT RESULTS
Mean Search Times 48 Experiment 1 Experiment 2 49

1
INTRODUCTION
Increase in Computer Use and Growth of the Internet
From punch cards to GUIs,1 advancements in the computer interface have made
machines more accessible to a nontechnical audience. Computer.com even features
grandmas and children in its commercials ("Nephew," n.d.). Home computer ubiquity
coupled with the Internet boom has led more and more people to use computers to
perform everyday tasks. Consequently, as computers become de rigueur for research,
communication, even entertainment, advertisers exploit the technology to reach netizens
of various demographic groups in a dynamic, hip medium.
However, unlike the sequential and captivating nature of television, radio, and
paper media, the Internet's hypertext2 encourages spasmodic exploration. Thus,
advertisers and webpage hosts vie to entice visitors who are a click away from a
competitor's site. Designers must use the most appropriate technology and techniques to
create layouts that steer the viewer's eyes in a predetermined course. The prevalence of
animated banner ads over the past five years indicates that advertisers have relied on
animation as an ostensibly surefire attention-getter.
1 Graphical User Interface (GUI) - The graphic layer through which people interact with a computer; Windows and MacOS are two examples. Non-GUI systems use command prompts, and include DOS and UNIX.

2
Animation as an Aid and Attention-Getter
A primitive context explains why movement, especially in the peripheral vision,
attracts attention: hunters roaming the plains needed to sense the prowling tiger to
survive. Graphic designers have manipulated this rudimentary instinct in the form of
blinking icons, swirling logos, and scrolling banner advertisements, all intended to
liminally lure the casual web surfer.
Furthermore, high resolution monitors and fast
processors have enabled animation to become an integral part
of popular software, especially to assist the user in performing
a task. For example, Microsoft Office products include an
animated office assistant, "Clippit," to aid novice users with
the program (see Figure 1). Clippit periodically offers tips and suggestions, and users can
click on the icon for additional help. When not in active use, Clippit occasionally blinks
and dances. Giving the traditional help system an animated, lively demeanor could make
the program more attractive to users. However, empirical evidence suggests that both the
persona and even the mere presence of an animated assistant play a large role in
effectiveness and user anxiety (Rickenberg & Reeves, 2000). If the animated agent is too
intrusive, users may avoid or even resent it.
Yet animation can provide meaningful clues in an interface, especially one with a
traditionally steep learning curve, such as a sophisticated painting program. For example,
the selection tool (see Figure 2) is a common digital painting instrument used to delineate
a specific area in an image. What is the best way to represent the selection tool in a
2 hypertext - A nonlinear cross-referencing system fundamental to the structure of the Web. Users click on hyperlinked text to jump to another part of the current document or to another document.
Figure 1: Clippit, the MS Office assistant.

3
toolbar, where each icon must fit in a small area? Photoshop and other
popular painting programs use marquee and lasso metaphors, but these
might not be immediately recognizable to a beginner. Several studies
show that animating an icon clarifies its purpose and invites a user to try it
(Baecker, Small, & Mander, 1991; Dormann, 1994; Rist, André, &
Müller, 1997), though others warn that animation should be haltable by
expert users (Alpert, 1991). While animation could assist a novice, gratuitou
might annoy expert users.
The problems of digital animation carry over to the analog world, as w
1980 the Federal Highway Administration released a report investigating the
aesthetic effects of "commercial electronic variable-message signage," indica
certain aspects of animated road signs were hazardous. In particular, the "an
message flow," brightness and contrast, and cycle length all have a high impa
safety. In fact, the danger comes from human's limited attention capacity: in
favoring official signs and filtering out billboards, when people are hungry o
gas they look for signs advertising those things, lowering the attentional prio
driving and leading to accidents.
Animation in Banner Advertisements
The most prevalent form of advertisement on the Web today is the ba
x 60 pixel3 image, often at the top of a webpage. Advertisers value banners f
customizability and automatic log of clickthrough4 statistics. The Internet A
3 pixel - Short for "picture element," a pixel is the smallest discrete unit of an image on a comoften a single-colored dot. 4 clickthrough - When a consumer clicks on a banner advertisement and is taken to the adve
Figure 2: Part of Photoshop's toolbar, with the marquee (upper left) andlasso (lower left) selection tools.
s movementell. In
safety and
ting that
imation and
ct on traffic
stead of
r in need of
rity of
nner: a 468
or their
dvertising
puter screen,
rtiser's website.

4
Bureau (IAB), founded in 1996, recommends standard sizes adopted by most businesses
to maintain a professional appearance. The IAB lauds the effectiveness of banner ads
(PricewaterhouseCoopers, 1999), although a few years after their inception in the mid-
nineties, banner clickthrough rates had fallen, and Benway and Lane (1998) announced
the "banner blindness" phenomenon, in which people missed information prominently
displayed in colorful, banner-shaped images.
Thus, advertisers turned to more drastic methods to attract consumers, and found
animation to be a successful option. ZDNet (1996) found that animations increased
clickthrough rates by at least 15%, and as much as 40% ("Research," 1998). With the
new prevalence of high bandwidth5 Internet connections, more advanced animations
created with Flash,6 DHTML,7 and other rich media8 allow advertisements to interact
with users. People can now purchase a book through a Barnes and Noble advertisement,
typing their credit card number into a form field embedded in the ad, all without leaving
the current site they are exploring. However, like animated software assistants, animated
banner ads also risk irritating people. Online discussion groups like Plastic.com post
daily complaints about web advertising, including "nothing [is] more annoying than
banner ads," and "banner ads and other advertising atrocities on the web . . . don't really
5 bandwidth - The rate of data transmission across a network. A high-bandwidth T1 line operates at roughly 1.5 Megabits per second, and low-bandwidth modem connection is roughly 14.4 Kilobits per second. 6 Flash - An interactive, multimedia file format created with a Macromedia software package. Flash file sizes are extremely small, allowing even users with a low bandwidth connection to interact in real time. 7 Dynamic Hypertext Markup Language (DHTML) - An extension of the basic WWW coding language, HTML, which allows a web page to change dynamically without an extra (time-consuming) call to the server. 8 rich media - The latest forms of interactive, multimedia technology used on the Web, often for entertainment or marketing. Rich media include Flash, DHTML, and many 3D modeling applications.
5
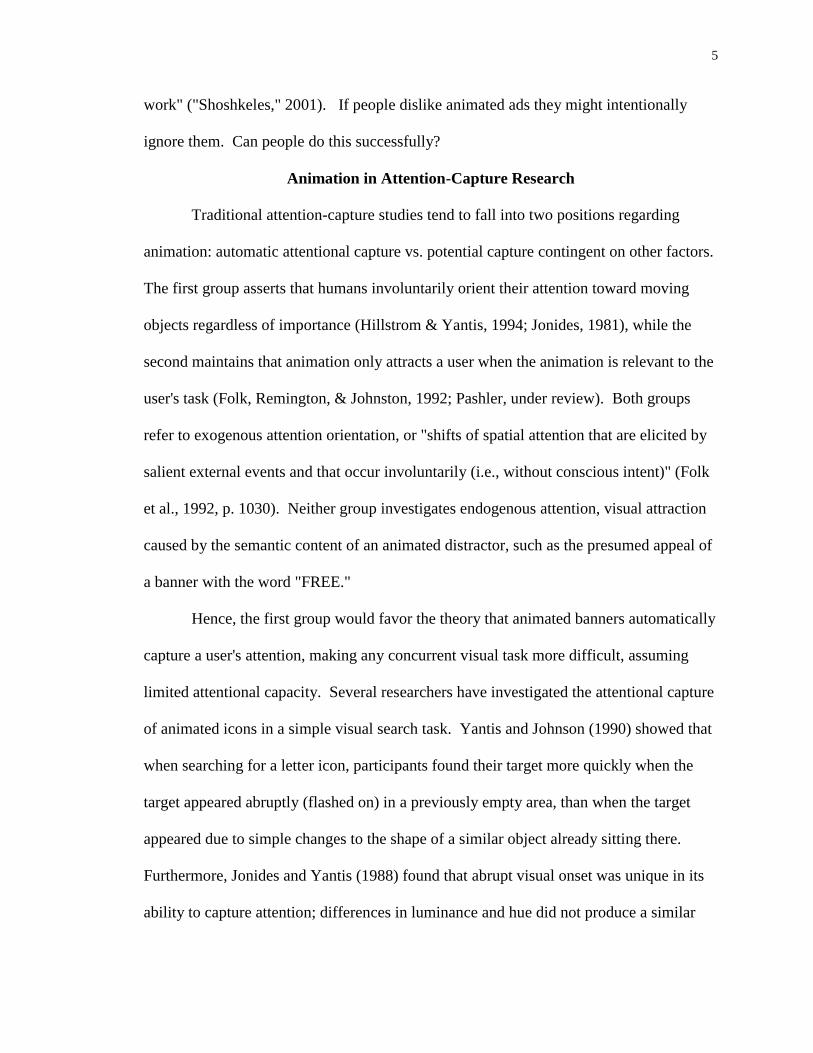
work" ("Shoshkeles," 2001). If people dislike animated ads they might intentionally
ignore them. Can people do this successfully?
Animation in Attention-Capture Research
Traditional attention-capture studies tend to fall into two positions regarding
animation: automatic attentional capture vs. potential capture contingent on other factors.
The first group asserts that humans involuntarily orient their attention toward moving
objects regardless of importance (Hillstrom & Yantis, 1994; Jonides, 1981), while the
second maintains that animation only attracts a user when the animation is relevant to the
user's task (Folk, Remington, & Johnston, 1992; Pashler, under review). Both groups
refer to exogenous attention orientation, or "shifts of spatial attention that are elicited by
salient external events and that occur involuntarily (i.e., without conscious intent)" (Folk
et al., 1992, p. 1030). Neither group investigates endogenous attention, visual attraction
caused by the semantic content of an animated distractor, such as the presumed appeal of
a banner with the word "FREE."
Hence, the first group would favor the theory that animated banners automatically
capture a user's attention, making any concurrent visual task more difficult, assuming
limited attentional capacity. Several researchers have investigated the attentional capture
of animated icons in a simple visual search task. Yantis and Johnson (1990) showed that
when searching for a letter icon, participants found their target more quickly when the
target appeared abruptly (flashed on) in a previously empty area, than when the target
appeared due to simple changes to the shape of a similar object already sitting there.
Furthermore, Jonides and Yantis (1988) found that abrupt visual onset was unique in its
ability to capture attention; differences in luminance and hue did not produce a similar

6
effect. Dynamic discontinuities, such as a flash, catch attention; static discontinuities,
such as feature changes, do not.
Folk, Remington, and Johnston (1992) purport a strong restriction to animation's
supposed power: they claim that animation is only distracting when the motion is relevant
to a person's primary task. The "Contingent Involuntary Orienting" hypothesis states that
"involuntary orienting of attention will occur if the event shared the critical property and
will not occur if it does not" (p. 1032). Pashler (under review) bolsters this theory in a
visual search experiment, in which participants actually performed faster in the presence
of irrelevant, animated (shimmying) distractors.
Based on the two conflicting sets of studies, from a traditional research standpoint
the effect of animated banner advertisements is unclear. Are people involuntarily drawn
to the motion, or does exogenous capture occur only if the banner has relevant material
on it? And, though Benway and Lane only looked at static graphics in their banner
blindness study, perhaps a similar effect now holds for animated banners, as consumers
become inured to the banners' effects.

7
RESEARCH QUESTION
Do animated advertisements attract people's attention involuntarily? One
indicator of this exogenous attention capture would be slower task performance. Thus,
can computer users perform a simple visual search task in the presence of an animated
banner as quickly and accurately as in the presence of a similar static graphic, or no
graphic? Furthermore, based on the colloquial reports of animation as annoying, does the
presence of animation affect the way the user feels about the task or its difficulty?
8
EXPERIMENT 1
Introduction
Given the conflicting body of animation research and yet the prevalence of
animated advertisements, a study was designed to test how animation affected a simple
Web task. The study investigated response times in a visual search task, and how the
participants felt about the task's difficulty afterward, using a well-known rating system,
NASA Task Load Index (TLX).
Participants were asked to find a particular word on a screen with many other
distractor words. Meanwhile, banners (described below) appeared on the screen, some of
which were animated. This scenario is common on the Web; people look through lists of
links while advertisements blink at the top of the page.
Since links are sometimes arranged in columns and sometimes scattered on a
webpage, and banners themselves may appear in many different locations, the study
investigated layout (columnar vs. scattered), banner location predictability, and banner
type. To keep running time under 1 1/2 hours, the study was divided into two portions
(noted Experiment 1 and 2).
Experiment 1 looked at the combination of layout and banner type, when banners
were centered at the top and bottom of the screen during the task. After the analysis of
the results of Experiment 1, Experiment 2 was designed with slightly different focus: a

9
more difficult search task and variable banner placement. Participants were given four
words to search for, only one of which would appear on the screen, much like a real-
world Web task, in which multiple words could fit someone's search criteria. Experiment
2 looked at banners that appeared in various locations throughout the search area. Only
the columnar layout was used.
Materials And Methods
Subjects
Four adults (2 female) aged 19 to 24 with a mean age of 22 participated in the
experiment for $10 to $15. All participants were comfortable using GUIs and had normal
or corrected-to-normal vision.
Equipment
Software
Experiment software was run using Macromedia Director, a multimedia authoring
tool commonly used to make interactive CD-ROMs and Shockwave movies for the Web.
The software was written in Lingo, Director's scripting language. Director was chosen
for its adeptness with both animated and static graphics, and for its relation to
Macromedia Flash, with which many modern banner advertisements are made.
Hardware
The experiment was presented on a Sun 18" LCD monitor with 0.28 mm pitch,
controlled by a 350 MHz PII processor running Windows 98. The participants responded
using a new Microsoft Wheel Mouse optical mouse.

10
Design
Basic Task
For each experimental trial, the participant was instructed to find a particular
target and click on it with the mouse. Each trial had two parts: the precue stage and the
search stage. In the precue stage, a copy of the target object, called the precue, appeared
on the screen. When ready, the participant would click on a button beneath the precue,
making it disappear, and initiating the search stage. Just below the precue's previous
position, a two-dimensional layout of objects would appear. One of the objects would
match the precue; the others were distractors, including other words and banners,
designed to make the search harder. The participant would search for the target item and
click on it.
Target and Distractors
Each experimental trial contained one target object for the participant to find and
click on with the mouse, and 23 distractor objects. Targets and distractors were four-
letter words written in 18-point Helvetica type enclosed in a 2.4 x 0.7 cm rectangle. Six
hundred seventy-two four-letter words were used, gathered from an automated,
exhaustive search of the first two levels of text on Wired.com. Words were filtered for
appropriateness and limited to one or two syllables to facilitate vocal repetition during the
search process.

11
Layout
Experiment 1 used two layouts: columnar and scattered. In the columnar layout
(see Figure 3), items were arrayed in three columns of eight rows, with 1.25 cm between
rows and 8.48 cm between columns. Two banners (described below) were centered
above and below the target/distractor objects.
In the scattered layout (see Figure 4), items were also arrayed in rows, but each column
was divided into a triplet of possible positions, with the target and distractors placed in
one of the three positions chosen at random for each triplet, giving the layout an
Figure 3: Columnar layout used in Experiment 1, drawn to scale. The precue location is also shown.

12
unpredictable appearance. The vertical distance between screen objects remained 1.25
cm, but the horizontal spacing varied from .32 to 11.2 cm, depending on which position
in each triplet was used.
Banners
Figure 5 shows the four banner types used in the experiment: (a) blank banners,
(b) animated commercial banners, (c) static commercial banners, and (d) flashing text
banners.
Figure 4: Scattered layout used in Experiment 1, drawn to scale.

13
O
en
an
fr
fl
te
T
as
fo
9 pto
Figure 5: Samples of the four banner types used in the experiment. Sample frames for the animated banners are shown.
ne hundred ten animated commercial banners from popular news websites, search
gines, and portals,9 including the New York Times website, AltaVista, Yahoo!, AOL,
d CNN.com were chosen. Static commercial banners consisted of a representative
ame from each animated commercial. Finally, as an extreme example of animation,
ashing text banners were created: each had a bright cyan background with large black
xt that alternated flashing on the left and right halves of the banner every 150 msec.
he cycles for the two banners were offset by 80 msec, making them change
ynchronously. Text for these banners rotated through the target and distractor words
r any given trial.
ortal - A website with many categorized links and (usually) a search engine, giving people an easy place
start browsing the Web. Popular portals include AOL, MSN, and Yahoo!.

14
Point Completion Deadline
To isolate search time and selection time, the point completion deadline (PCD)
designed by Hornof (in press) was used in this experiment. Briefly, participants were
instructed to hold the mouse stationary until they found the target. Once they moved the
mouse more than five pixels in any direction, they had a small amount of time to click on
the target. If participants took longer than should have been necessary for a single mouse
point,10 a buzzer sounded and the trial was recorded as an error. Participants were given
as long as they liked to practice with the PCD before the experiment so that they could
grow accustomed to not moving the mouse until they found the target, and thus error
rates were minimized during the real trials.
Incentives and Penalties
Every participant was paid a minimum of $10, but each had the opportunity to
earn an additional bonus of up to $5 based on speed and accuracy in the trials. Each trial
had a potential bonus of four cents, with one cent deducted for every second that passed
on the clock. When participants hit the target, they would hear a 150 msec "ding" and
earn the trial bonus. If participants clicked on anything other than the target, or if the
PCD expired, a 350 msec buzzer sounded and a five-cent penalty was deducted from
their earnings. A longer penalty sound was used to slow the onset of the next trial,
delaying participants and subtly encouraging them to avoid making mistakes. In the case
10 This time was determined by Fitts' Law, which describes the time necessary to move the mouse to a target, based on the distance to the target its width along the axis of travel from the initial location. Welford's version is used here: Movement time = a + b log2(d/w + 0.5) msec, with a and b both set to 300 to accommodate for slower participants, as in Hornof (in press).

15
of a PCD expiration, an alert box would also appear reminding participants not to move
the mouse until they had seen the target. The software displayed cumulative earnings at
the end of each block of trials. Overall, incentives and penalties were weighed to
encourage fast but mostly accurate responses.
Blocking
Trials were grouped into two blocks with one layout per block. Every participant
experienced both blocks to eliminate between-groups error. Each of the four banner
types was used with each of the 24 potential target locations. Thus, each block had
4x24=96 trials. Trials were randomized in each block, and blocks were counterbalanced
with a randomized Latin square.11
Whenever a participant made an error, an additional trial with the same banner
type and target position combination was added to the end of the block, and the
remaining trials for that block were reshuffled. This way participants completed a correct
trial for every combination. Subtleties in the experimental software led to 98% of all
combinations being presented to every participant.
To reveal search time in an unimpeded environment, an additional target-only
block was added. In this block, only the target appeared in the search portion of the trial,
with no other distractors on the screen. Each of the 24 target positions appeared three
times to give a mean search and selection time for each position. Participants began
11 Latin square - An experimental design used to remove an effect due to the order of the blocks. Specifically, a square matrix of the numbers 1 through n such that no number occurs more than once in any row or column. Each column represents a block; each row a participant. For the experiment, a Latin rectangle was actually used, where enough Latin squares were stacked vertically to accommodate the number of participants.

16
target-only trials with two cents, rather than seven cents, since the task was much easier
and there were three times as many trials as in other blocks. The target-only block was
presented in between the other two blocks for all participants.
Procedure
Basic Experiment
Participants began the experiment by filling out a preliminary questionnaire,
detailing their usage of computers and the Web.12 Next, they read detailed instructions
about the precue, target, point completion deadline, bonuses, and block structure. The
lights were then dimmed and participants were positioned 56 cm from the screen with the
precue at eye level. This eye-to-screen distance was remeasured before each block.
Approximately half of the participants chose to use an optional mousepad, although the
optical mouse did not require one.
Before the timed portion of the experiment, participants were given unlimited
practice trials from the first block to get used to the point completion deadline. When
they were ready, the software was restarted and data collection began. At the start of
each block, participants were given five additional practice trials to get used to the block
conditions. During these trials, the words "Practice trial" appeared above the precue.
For each trial, the precue would appear alone on the screen. Participants took
as long as they needed to memorize it. When ready, participants clicked the box beneath
the precue. The precue would disappear, and the target and distractors would appear.
When the participant clicked on a target or distractor, the item's colors would invert
briefly for feedback, and either a ding or buzzer sounded, as previously described. At the

17
end of each block, a summary screen showed how much money the participant had
earned so far.
NASA Task Load Index (TLX) ratings
After the timed experiment, participants were asked to subjectively evaluate their
experience with the different conditions. The Task Load Index (TLX) system developed
by NASA (Hart & Staveland, 1988) was used to allow comparison of subjective ratings
across participants. TLX measures "workload," defined by the following factors: mental
demand, physical demand, temporal demand, impression of performance, effort, and
frustration.13 Participants rated each factor on a visual scale and then performed a
pairwise weighting comparison, indicating for each pair which factor contributed more to
the sense of workload. Though either of these measures separately would vary
significantly between participants, combining the two to reveal the relative importance of
each factor provides a reasonable metric with which many participants' responses can be
compared.
Combination of the ratings and weights is calculated as follows:
1. The number of times each factor was chosen in the pairwise comparisons is
divided by six, giving an average weight.
2. The average weight is multiplied by the magnitude rating, giving a workload
score.
The scores for each factor can now be compared, both between factors and between
participants. Overall workload is the sum of the factor scores. Thus, the factors
12 This and all subsequently mentioned experiment documents can be found in Appendix A. 13 See Appendix A for detailed factor definitions and evaluation forms.

18
considered more important to workload are weighted more heavily in the overall
workload score. This process can be repeated to gain comparable overall workload
scores for several experimental conditions or tasks.
Participants were shown each banner type and layout again before being asked to
record their subjective ratings for that banner type. Again, these blocks of banners and
layouts were administered with a randomized Latin square to reduce an order effect. All
eight layout/banner combinations were not used because of time constraints. Instead, the
following five representative conditions were chosen:
columnar layout with blank banner
scattered layout with static commercial banner
scattered layout with animated commercial banner
scattered layout with flashing text banner
target only condition
Participants ran a few trials in a given block to refresh their memory, and then gave TLX
ratings and weights for the condition in that block. The experimenter then jumped the
software to the next block and asked participants to evaluate the next condition.
In addition to the TLX evaluations, participants also gave an exit interview,
conducted verbally with the experimenter. Participants described the level of difficulty
of different parts of the experiment, ranked the different banner types for distraction, and
described any strategies they used to perform well.
19
Results
Search Time and Error Rates
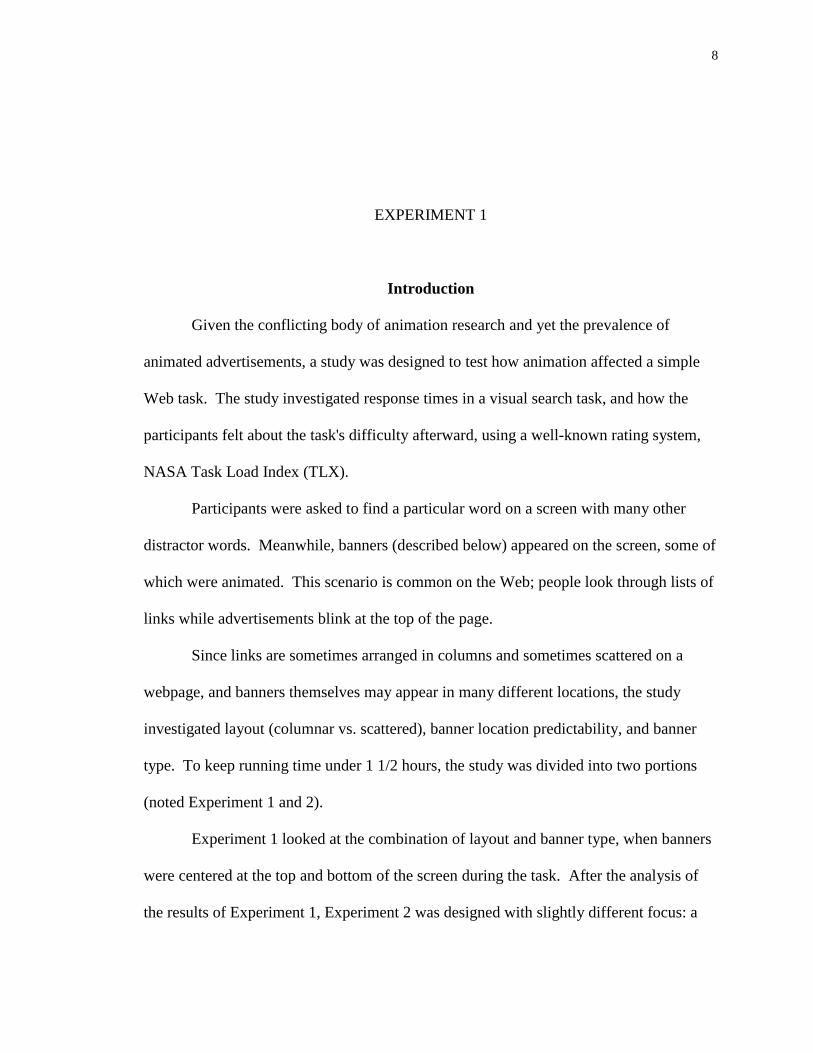
Table 1 shows the mean search time for each banner type and layout combination,
along with the target-only condition for comparison.14 Error and practice trials are
excluded from analyses unless specifically noted.
Table 1. Search times for each banner type and layout combination in Experiment 1, averaged across target position and participant. Error and practice trials are excluded. Banner Type Layout Mean Search Time
(in msec) Standard Deviation
(in msec) Columnar 2529 1417 Blank Scattered 2421 1459 Columnar 2615 1564 Animated Commercial Scattered 2601 1431 Columnar 2748 1688 Static Commercial Scattered 2850 1912 Columnar 3068 2507 Flashing Text Scattered 2914 2105
Target-only 281 93
A 2 x 4 factorial repeated-measure ANOVA failed to show a significant main effect for
either layout or banner type, nor did it reveal a significant interaction between the two at
the 0.05 level.
Error rates were also not significantly different between conditions (see Table 2).
Participants experienced two kinds of errors: misses, in which they clicked on something
other than the target, and timeouts, in which the point completion deadline expired. No
significant difference was found between either misses or timeouts across the different
banner types; total errors were also approximately the same.

20
Banner Type Layout Misses Timeouts Columnar 1.25 0.25 Blank Scattered 0.25 0.75 Columnar 0.25 0.5 Animated Commercial Scattered 0.5 0.75 Columnar 0.5 0.5 Static Commercial Scattered 0.75 0.5 Columnar 0.25 0.75 Flashing Text Scattered 0.25 1.25
Target-only 0.5 1
A serial position effect is evident; participants found targets in the upper-left
positions much more quickly than those to the lower-right. This effect appears strongly
in the columnar layout, F(23,361) = 6.74, p < .0001, and almost as strongly in the
scattered layout, F(23,361) = 4.61, p < .0001 (see Figure 6).
14 Mean
Fb uc
Table 2: Number of errors for each banner type and layout combination, averaged across target position and participant. Errors are divided into two groups: misses and timeouts.
0
500
1000
1500
2000
2500
3000
3500
4000
1 9 17
Target Position
Mea
n Se
arch
Tim
e (m
sec)
ScatteredColumnar
igure 6. Mean search times split by target position show a strong serial position effect for oth the columnar and scattered layouts. Target positions are numbered 1 to 24, starting at thepper left and counting down each column. X-axis labels show the topmost item in each olumn.
search times split by target position are listed in Appendix B.

21
TLX Workload Scores
Though actual search times were not significantly different for the various banner
types, the TLX scores show that participants reported having to work the hardest in the
presence of the flashing text banners. Figure 7 shows the overall workload scores for the
five conditions tested. Participants also gave a high workload score to the animated
commercial banners, and a lower score to the static commercial banners. Notice that
when flashing text banners were on the screen, participants reported more than double the
workload of the target-only condition.
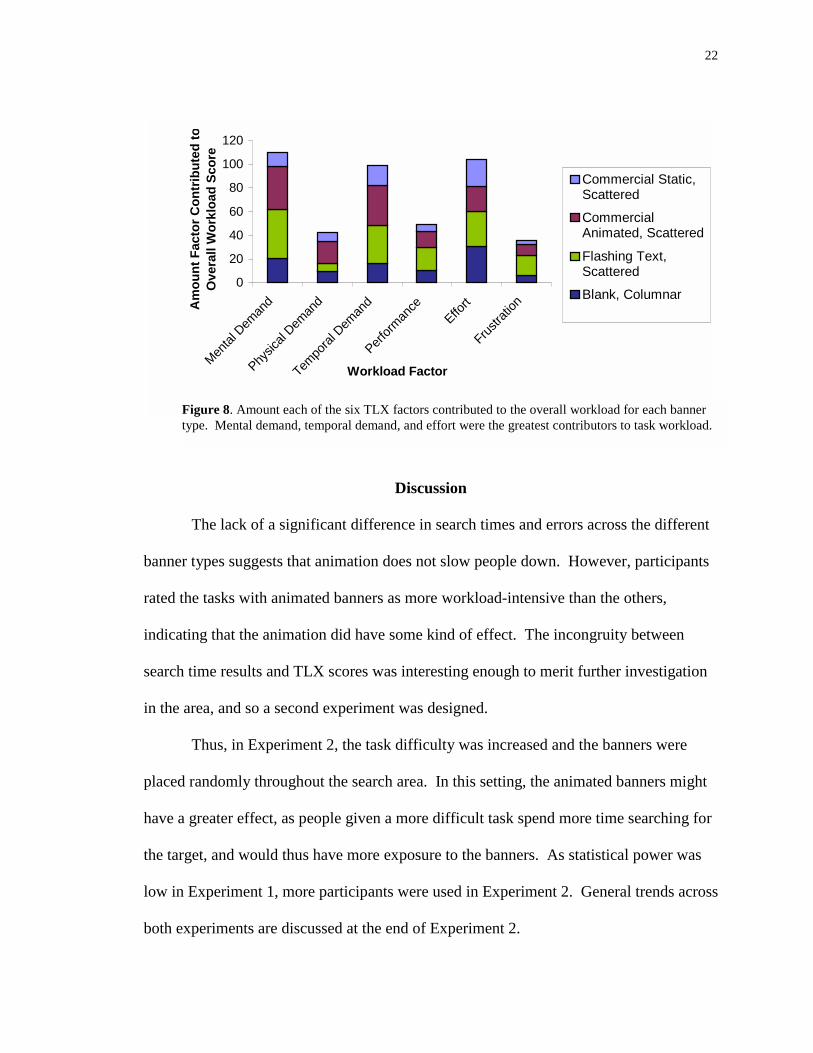
Figure 8 shows how much each of the six TLX factors contributed to the overall
workload score for the four banner types. Of the six factors, mental and temporal
demand, along with effort, contributed the most to the overall task workload for all
banners. Participants reported that physical demand, performance, and frustration added
little to the overall workload.
94.46
146.38131.96
115.62
67.79
0
20
40
60
80
100
120
140
160
Blank,Columnar
Flashing Text,Scattered
CommercialAnimated,Scattered
CommercialStatic,
Scattered
Target Only
Banner Type and Layout
Wor
kloa
d Sc
ore
Figure 7. Overall TLX workload scores for the five measured conditions participants rated in Experiment 1.
22
Discussion
The lack of a significant difference in search times and errors across the different
banner types suggests that animation does not slow people down. However, participants
rated the tasks with animated banners as more workload-intensive than the others,
indicating that the animation did have some kind of effect. The incongruity between
search time results and TLX scores was interesting enough to merit further investigation
in the area, and so a second experiment was designed.
Thus, in Experiment 2, the task difficulty was increased and the banners were
placed randomly throughout the search area. In this setting, the animated banners might
have a greater effect, as people given a more difficult task spend more time searching for
the target, and would thus have more exposure to the banners. As statistical power was
low in Experiment 1, more participants were used in Experiment 2. General trends across
both experiments are discussed at the end of Experiment 2.
0
20
40
60
80
100
120
Mental
Dem
and
Physic
al Dem
and
Tempo
ral D
eman
d
Perform
ance
Effort
Frustra
tion
Workload Factor
Am
ount
Fac
tor C
ontr
ibut
ed to
Ove
rall
Wor
kloa
d Sc
ore
Commercial Static,Scattered
CommercialAnimated, Scattered
Flashing Text,Scattered
Blank, Columnar
Figure 8. Amount each of the six TLX factors contributed to the overall workload for each banner type. Mental demand, temporal demand, and effort were the greatest contributors to task workload.

23
EXPERIMENT 2
Materials and Methods
Subjects
Twelve adults (6 female) aged 19 to 51 with a mean age of 27 participated in the
experiment for $10 to $15. All participants were comfortable using GUIs and had normal
or corrected-to-normal vision.
Equipment
Experiment 2 used the same software and hardware as Experiment 1.
Design
Experimental design was identical to Experiment 1, with the following exceptions
(as shown in Figure 9):
1. Four precues were used instead of one. Precues were arranged in a column
above the search area. Only one of the precue words matched the target word.
2. Banners now appeared in rows in the search area, rather than being centered
above and below. Each of the two banners covered the area previously used
by two distractor words. Thus, in any given trial there were 20 words on the
screen (one target word and 19 distractors), rather than 24 (one target and 23
distractors). However, all 24 target positions were investigated. In the case of
blank banners, distractor words that would be covered by the banners were

24
simply removed. Banners appeared in random rows; banner location was not
balanced across participants.
3. Only the columnar layout was used.
4. Each trial had a potential bonus of seven cents, rather than four, to account for
the difficulty of the task.
5. Since only one layout was used, the only factor that could be used to divide
trials into blocks was banner type. However, blocking by banner type would
eliminate the unpredictability of the next banner. Instead, the list of all banner
Figure 9: Columnar layout used in Experiment 2, drawn to scale. The four precues are also shown.

25
type and target positions (a total of 4x24=96) combinations was shuffled and
divided into four pseudo-blocks, to give participants the chance to rest
between blocks.
6. To allow for comparison of blocks between participants, the initial shuffling
was performed the same way for each participant, using a given random
number seed.15 This way, each block would have the same set of
combinations. The trials in each pseudo-block were then shuffled
(differently) for each participant to eliminate an order effect. As in
Experiment 1, an additional target only block was added.
Procedure
Experiment 2 used the same general procedure as Experiment 1. In this case, all
experimental conditions were evaluated with NASA TLX: blank banners, animated
commercial banners, static commercial banners, flashing text banners, and the target only
condition.
Results
Search Time and Error Rates
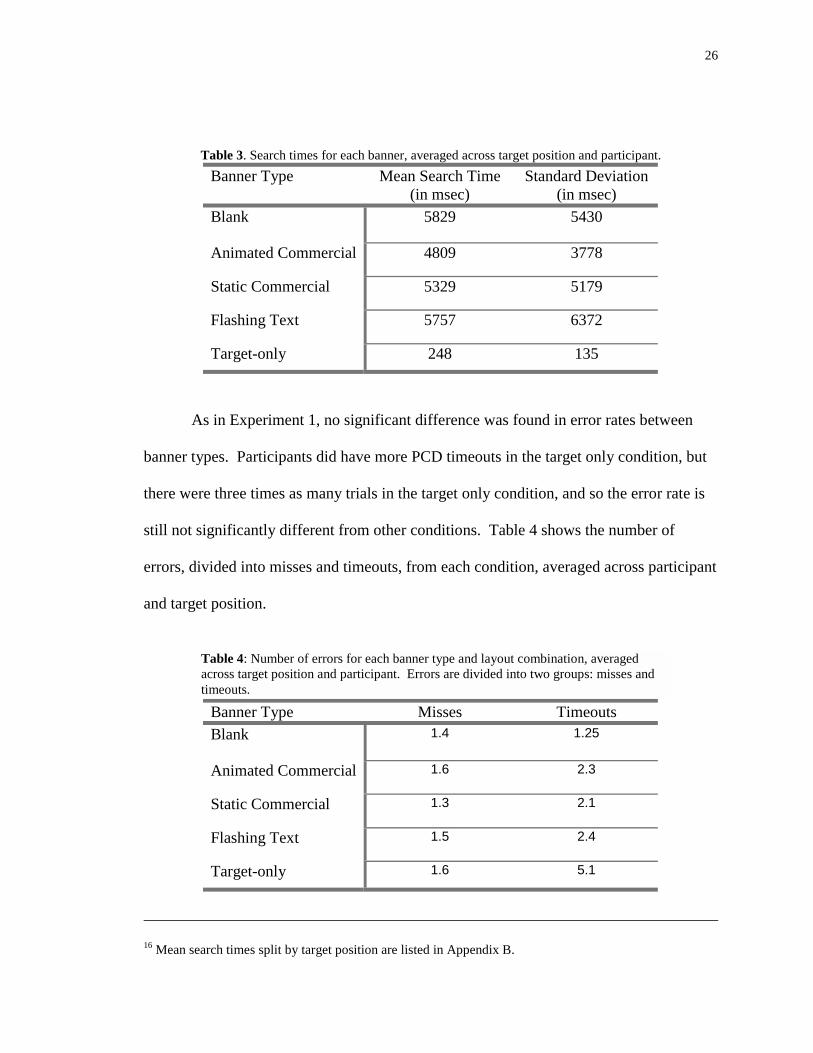
Table 3 shows the mean search times for each banner type, along with the target-
only condition for comparison.16 Results from a repeated measures ANOVA again fail to
show a significant difference in search time caused by banner type.
15 Random number seed - The initial number put into a random number generator. Random number generators are not truly random; instead they perform a complicated algorithm on a seed number to get a seemingly-random list of numbers. If a generator is fed the same seed twice, it will generate the same "random" sequence.
26
Table 3. Search times for each banner, averaged across target position and participant.
Banner Type Mean Search Time (in msec)
Standard Deviation (in msec)
Blank 5829 5430
Animated Commercial 4809 3778
Static Commercial 5329 5179
Flashing Text 5757 6372
Target-only 248 135
As in Experiment 1, no significant difference was found in error rates between
banner types. Participants did have more PCD timeouts in the target only condition, but
there were three times as many trials in the target only condition, and so the error rate is
still not significantly different from other conditions. Table 4 shows the number of
errors, divided into misses and timeouts, from each condition, averaged across participant
and target position.
Banner Type Misses Timeouts Blank 1.4 1.25
Animated Commercial 1.6 2.3
Static Commercial 1.3 2.1
Flashing Text 1.5 2.4
Target-only 1.6 5.1
16 Mean search times split by target position are listed in Appendix B.
Table 4: Number of errors for each banner type and layout combination, averaged across target position and participant. Errors are divided into two groups: misses and timeouts.

27
One noteworthy effect occurs when a target is sandwiched between two flashing
text banners. In this case, the target takes an average of 4.3 seconds longer to find than if
the flashing text banners were placed elsewhere, F(1, 298)=7.0, p<.01. This effect is not
seen with the other banner types, nor does it hold if the target is merely adjacent to one of
the banners.
TLX Workload Scores
As in Experiment 1, participants expressed a much greater sense of workload with
the flashing banners than with any other condition, even though search times varied little
(see Figure 11). Again, the animated commercial banners ranked highly in terms of
workload, but this time, static commercial banners ranked approximately the same as the
blank banner condition.
Figure 10. Overall TLX workload scores for the five conditions participants rated in Experiment 2.
110.54
160.71
121.44107.83
86.6
0
20
40
60
80
100
120
140
160
180
Blank Flashing Text CommercialAnimated
CommercialStatic
Target Only
Banner Type / Condition
Wor
kloa
d Sc
ore

28
Participants again reported a higher mental demand for all but the target-only
condition, and all conditions required effort and temporal demand. Figure 11 shows the
contribution of each of the six TLX factors to the overall workload.
Discussion
Search Times and Error Rates
As in Experiment 1, participants searched just as quickly in the presence of
animated banners as with static or blank banners. These results suggest that animation
does not capture attention to the point of impeding a simple visual search task. While
more ostentatious banners might potentially produce an effect, the banners used in this
experiment came from popular professional sites, and thus comprise a representative
sample of advertisements accepted by influential members of the Web community.
Figure 11. Amount each of the six TLX factors contributed to the overall workload for each banner type.
020406080
100120140160
Mental
Dem
and
Physic
al Dem
and
Tempo
ral D
eman
d
Perform
ance
Effort
Frustra
tion
Workload Factor
Am
ount
Fac
tor C
ontr
ibut
ed to
Ove
rall
Wor
kloa
d Sc
ore Commercial Static
Commercial AnimatedFlashing TextBlank

29
Greater differences in search time might have been found if there had been more
participants in the experiment. Statistical power was low, and so only a large effect could
have been detected. However, these results are a fair indicator that if animation does
have an impact on the task, the effect is small.
Furthermore, this experiment only delves into one particular visual search task in
which people are looking for an exact word they know it will appear in a black and white
rectangle, not in a banner. The experiment does not consider the effect of peripheral
animation on a more demanding search task or cognitive task such as reading. Quite
frequently, websites list their internal links at the top of the page, just below an animated
advertisement, which presents a task similar to that performed in the experiment, but
different results could occur on a reading-intensive site.
Also, this experiment intentionally negates the appeal of banner content;
participants had no incentive to look at the banners, and they were encouraged to
complete their search task quickly. Web surfers are often lured by the content of ads
rather than the medium, especially when ads are carefully aimed at a target audience.
Interestingly, one experimental result calls into question previous advertising tips
suggested by WebWeek. In 1996, the online magazine recommended that site designers
"bracket important content between two banners" ("Research," 1998). However, this
experiment shows that content sandwiched between two flashing banners takes
significantly longer to find. Perhaps WebWeek's suggestion was prudent in 1996, but
five years of animated advertisements have since dulled consumers' attention.

30
TLX Workload Scores
Even though participants completed their search tasks just as quickly in the
presence of animated ads, they reported a greater sense of workload afterward through
the TLX scores. Both the flashing text and animated commercial banners were
considered more mentally demanding than the other banners.
However, the static commercial banners had fairly low workload scores. In
Experiment 1, the static banners were slightly higher than the blank banner condition, and
in Experiment 2, the static banners came in (nonsignificantly) lower than the blank
condition. Since the content of the animated and static commercial banners was virtually
the same, the animation must have contributed to the increased workload. Thus,
advertisers should be wary of using animation, since in this case it required greater
mental demand, but did not capture attention insofar as it did not slow people in their
task.
Since the flashing text banners contained four-letter words from the list of targets
and distractors, the Contingent Involuntary Orienting hypothesis may have led to the
increased workload scores. Participants might have noticed the flashing words and
recognized some of them from the precue list or distractor set, and thus needed to use
more mental capacity to filter them out. Perhaps if the flashing text on the banners had
been the same size and/or color as the target and distractor set, search times might have
been significantly greater, as well.

31
Post-Experiment Questionnaire
Participants detailed even more factors to their search experience through the
post-experiment questionnaire. In general, participants reported being able to "tune out"
the banners, although some found the flashing text and brightly colored banners difficult
to ignore. One participant even admitted to intentionally clicking on the wrong word if
she had not found the target within a few seconds just to make the banners disappear. Her
error rate was similar to that of other participants, so perhaps she just wanted to click on
the wrong word, but did not.
When asked to rank banners from most distracting to least, nearly every
participant ranked the flashing text banners as the most distracting. From there,
participants varied in rankings, often citing color and type of animation as important
factors. Many participants found the blank banners easiest, but several others preferred
having static commercial banners to break up the visual field. According to one
participant, blank banners led to "too much of the same," making the search more
difficult.
The questionnaire also revealed the robustness of the PCD and the various
strategies that participants used to perform well. When asked if they were able to move
the mouse before finding the target word, participants reported being buzzed nearly every
time. The only exception occurred for two participants when they began moving the
mouse to a word they thought was the target, and then realized that an adjacent word was
actually the correct target, which they were able to reach in time. Most participants
searched the columnar layouts from left to right, scanning either down or up each
column, although some performed a preliminary overall inspection around the center of

32
the screen first. Such a strategy, if successful, would account for the dip in search times
(seen in Figure 7) for the center elements of the columns in the columnar layout.

33
CONCLUSION
Future Research
This study strongly indicates the need for future research. Animation may not
have had an effect on search time in this experiment; however, in a more difficult task, it
might play a larger role. Reading is a common Web task, and it requires a much greater
cognitive demand than simple visual scanning. Even filling out of an online form entails
more mental processing; investigating the effect of animated banner ads on either of these
two tasks would be worthwhile to the Web community.
Furthermore, these experiments isolated participants from the Internet; the search
area did not particularly resemble a real webpage, and banners were not really linked to
advertisers' sites. Here, banners were investigated from a more traditional standpoint, in
which many other factors are removed to distill the pure effect of the animation. Targets
and distractors were written in 18-point Helvetica, which is almost twice as large as
typical Web fonts such as 10-point Arial and 12-point Times. Rarely are Web links
enclosed in black bounding-boxes.
Also, on the Web, people have incentives for looking at banners, which were not
present here. Benway and Lane's (1998) banner blindness study put relevant information
in banner-like images; if participants in future experiments knew they would need to look
at banners occasionally to complete their task, the different banner types might then show
an effect.

34
This study bridges the bodies of traditional attention-capture and Web marketing
research. The Web imposes myriad factors on banner effectiveness, each of which could
be investigated separately, in the vein of traditional studies, or as a gestalt entity, as in the
banner blindness study and other advertising surveys. This experiment probed a few
individual features of the Web; subsequent studies will add more to the animation
discussion.
Future of Web Advertisements
Advertisers have already begun to seek new ways to attract consumers. Last
February, the IAB released new banner standards, featuring "skyscrapers," wide ads that
run down the side of a page (taking up either 120 x 600 or 160 x 600 pixels, depending
on the type of ad), large rectangles (336 x 280), and pop-up windows (250 x 250) (Olsen,
2001a). The vice chairman of the IAB reported to CNET that "'agencies need more space
to get some emotion in there', although he hastened to clarify that the new standard was
not meant to imply banners are not working" (Olsen, 2001b).
CBS MarketWatch has introduced another form of advertisement: the banner
background. In March, CBS began tiling a faded Budweiser logo across the background
of its financial website (see Figure 12). While the repeated logo adds to the visual clutter
of the page, the lack of animation might be appreciated by consumers. However, because
the Budweiser background cannot be directly linked to the advertiser's site, only well
known advertisers could successfully employ this strategy.

35
Interestingly, a CNET article discussing the new background advertisements has a large
ad in the middle of the story (see Figure 13), to which one critic responded, "CNET
seems to treat the advertising as the main content, and the story as a convenient wrapper"
("Mmmm, beer," 2001).
Figure 15. CNET article with large rectangular advertisement in the center of the text.
Figure 12. CBS MarketWatch site on March 23, 2001. The Budweiser advertisement covers the background of the page.

36
Though many people consider advertising a necessary evil to keep the Web cost-
free, much thought should be given to its implementation. This research shows that for a
simple visual search task, animation did not catch peoples' eyes to the extent that they
were slowed in their task. While further investigation is warranted, this study reveals that
advertisers should not automatically equate animation with attentional capture, especially
considering the increased mental demand reported by participants. Advertisers using
animated banners should be wary of irritating their audience with a potentially ineffective
technique.

37
REFERENCES
Alpert, S. R. (1991). Self-describing animated icons for human-computer interaction: a
research note. Behaviour and Information Technology, 10(2), 149-152.
Baecker, R., Small, I., & Mander, R. (1991). Bringing icons to life. Proceedings of
CHI '91: Conference on Human Factors in Computing Systems, 1-6.
Benway, J. P., & Lane, D. M. (1998). Banner blindness: web searchers often miss
"obvious" links. Internetworking. [Online]. Available:
http://www.sandia.gov/itg/newsletter/dec98/banner_blindness.html [2000,
October 14].
Dormann, C. (1994). The design of animated signs as help. CHI '94 Conference
Companion: Conference on Human Factors in Computing Systems, 137-138.
Federal Highway Administration. (1980). Safety and environmental design
considerations in the use of commercial electronic variable-message signage
(FHWA Rep. No. RD-80/051). Available:
http://www.scenicflorida.org/cevms/chfhward80051a.html [2001, April 23].
Folk, C. L., Remington, R. W., & Johnston, J. C. (1992). Involuntary covert orienting is
contingent on attentional control settings. . Journal of Experimental Psychology:
Human Perception and Performance, 18, 1030-1044.

38
Hart, S.G., & Staveland, L.E. (1988). Development of NASA-TLX (task load index):
results of empirical and theoretical research. Human Mental Workload, 139-183.
Hillstrom, A. P., & Yantis, S. (1994). Visual motion and attentional capture. Perception
& Psychophysics, 55(4), 399-411.
Hornof, A. J. (in press). Visual search and mouse pointing in labeled versus unlabeled
two-dimensional visual hierarchies. ACM Transactions on Computer-Human
Interaction.
Jonides, J. (1981). Voluntary versus automatic control over the mind's eye's movement.
Attention and Performance, 9, 187- 203.
Jonides, J., & Yantis, S. (1988). Uniqueness of abrupt visual onset in capturing
attention. Perception & Psychophysics, 43(3), 346-354.
Mmmm, beer. (2001, March 15). Plastic.com. [Discussion Group, Online]. Available:
http://www.plastic.com/article.pl?sid=01/03/15/033216&mode=thread [2001,
March 23].
Nephew. (n.d.) [Television Commercial]. Available:
http://www.adcritic.com/content/computer.com-nephew.html [2001, April 27].
Olsen, S. (2001). Group to issue standards for bigger web ads. CNET. [Online].
Available: http://news.cnet.com/news/0-1005-200-4942655 [2001, March 23].
Olsen, S. (2001). MarketWatch toasts happy hour with bud. CNET. [Online].
Available: http://news.cnet.com/news/0-1005-200-5126422.html [2001, March
23].

39
Pashler, H. (under review). Involuntary orienting to flashing distractors in delayed
search? . Journal of Experimental Psychology: Human Perception and
Performance.
PricewaterhouseCoopers. (1999). IAB Internet Advertising Revenue Report [Executive
Summary, 1999 Third-Quarter Results]. [Online]. Available:
http://www.iab.net/adrevenue/PwC_IAB99Q3.PDF [2001, April 9].
Research sources and findings [Banner ad placement study]. (1998, April 13).
Webreference.com. [Online]. Available:
http://www.webreference.com/dev/banners/research.html [2001, March 23].
Rickenberg, R., & Reeves, B. (2000). The Effects of Animated Characters on Anxiety,
Task Performance, and Evaluations of User Interfaces. CHI 2000 Letters, 2(1),
49-56.
Rist, T., André, E., & Müller, J. (1997). Adding animated presentation agents to the
interface. Proceesings of IUI '97: International Conference on Intelligent User
Interfaces, 79-86.
Shoshkeles - Another Name for the Most Annoying Web Ads Ever? (2001, April 16).
Plastic.com. [Online]. Available: http://www.plastic.com/article.pl?sid=
01/04/16/2045201&mode=thread [2001, April 17].
Yantis, S., & Johnson, D. N. (1990). Mechanisms of attentional priority. Journal of
Experimental Psychology: Human Perception and Performance, 16, 812-825.

40
APPENDIX A
EXPERIMENT DOCUMENTS
Preliminary Questionnaire
Visual Search Study
Investigator: Moira Burke This information will be kept confidential. Age: ____ Sex: Male: ____ Female: ____ How many years of experience do you have using a graphical user interface, such as Macintosh or MS Windows? How many years have you been using the World Wide Web? _____________ How often do you do the following on the World Wide Web: Daily Weekly Rarely Never
Browse for information ____ ____ ____ ____
Surf for entertainment ____ ____ ____ ____
Check email ____ ____ ____ ____
Shop online ____ ____ ____ ____
Use a search engine (e.g. ____ ____ ____ ____
Yahoo!, AltaVista, Google)
Play games ____ ____ ____ ____
Other (specify) ____________ ____ ____ ____ ____

41
Instructions
Visual Search Study Investigator: Moira Burke
Precue and target: When you begin the experiment, you will see a four-letter word on the computer screen, called a precue. Remember the word shown on the precue, and when you are ready, use the mouse to click on it. The precue will disappear and several boxes with four-letter words in them will appear on the screen. The word that had been displayed on the precue will be in one of these boxes; your job is to find that target word and click on it. Sometimes there will be more than one precue. Only one of the precues has the target word, but you won't know which one it is, so you'll have to remember all of them. Click on the empty box beneath the precues to make the precues disappear. Only move mouse when you see the target: You can take as long as you like to study the precue(s). But, once you click on the precue and the other boxes appear, you should find and click on the target as quickly as possible but with no mistakes. Do not move the mouse until you have spotted the target. If you move the mouse earlier, the computer program will interrupt you and a buzzer will sound. Other items on the screen: In many of the screens an animated image, or banner will appear. In some cases, the text or the colors on the banner will change over time. Block structure and practicing: The experiment is grouped into blocks. The target and other words on the screen will be arranged the same way across an entire block. So, if the words are lined up in columns, you can be certain that they'll be in columns for all of the screens in the block. If the words are scattered around the screen, they'll be scattered for all of the screens in the block. You will be warned when you are about to start a new block, and you will be given five practice screens at the beginning of each block before the timed trials begin. Also, you can take as much time as you'd like to practice at the beginning of the experiment. Payment and bonuses: You are guaranteed to make ten dollars, but depending on how well you perform, you could possibly make up to five dollars more. Every time that you click on the precue and a new screen appears, you are given a few cents. But you lose money continuously, at a rate of one cent per second, up until the moment that you click on the target. If you take too long, you will start to lose money. You can also lose money if you miss the target or if you move the mouse before you found the target. In either case, a buzzer will sound and you will lose all of the money for that screen plus an additional five cents. Every time you hear the buzzer, you lost five cents.

42
At the end of the experiment, the computer will tell you your total earnings. Your participation is entirely voluntary, and you may withdraw from the experiment at any time and still receive the base pay of ten dollars.

43
Instructions
Workload Evaluation Please evaluate the workload you experienced during the previous tasks. Workload has six main factors, defined below. During the course of the experiment, you experienced several conditions that I'd like you to consider. These may include the types of banners you saw, the organization of the target and distractor boxes, and how many items appeared at once. I'll ask you to evaluate the workload for each of these conditions separately. Please do the following: 1. Read the workload definitions below, and be sure you understand them. For each of the conditions: 2. I'll give you a block of untimed trials to refresh your memory. Take as many trials as you
need to remember how the condition felt. 3. Fill out Form A, ranking each of the six workload factors. 4. Fill out Form B, comparing each of the factors. 5. Let me know when you've finished filling out the forms for that condition, and I'll set the
software to the next condition for you to try, and give you the next set of forms.
Workload Factor Definitions Title
Endpoints
Descriptions
MENTAL DEMAND Low/High How much mental and perceptual activity was required (e.g., thinking, deciding, calculating, remembering, looking, searching, etc.)? Was the task easy or demanding, simple or complex, exacting or forgiving?
PHYSICAL DEMAND Low/High How much physical activity was required (e.g., pushing, pulling, turning, controlling, activating, etc.)? Was the task easy or demanding, slow or brisk, slack or strenuous, restful or laborious?
TEMPORAL DEMAND Low/High How much time pressure did you feel due to the rate or pace at which the tasks or task elements occurred? Was the pace slow and leisurely or rapid and frantic?
PERFORMANCE Good/Poor How successful do you think you were in accomplishing the goals of the task set by the experimenter (or yourself)? How satisfied were you with your performance in accomplishing these goals?
EFFORT Low/High How hard did you have to work (mentally and physically) to accomplish your level of performance?
FRUSTRATION LEVEL Low/High
How insecure, discouraged, irritated, stressed and annoyed versus secure, gratified, content, relaxed and complacent did you feel during the task?

44
FORM A Please evaluate the task by marking each scale at the point which matches your experience for this condition. Each line has two endpoint descriptors that describe the scale. Note that "own performance" goes from "good" on the left to "poor" on the right. Please consider your responses carefully in distinguishing among the task conditions. Consider each scale individually. Your ratings will play an important role in the evaluation being conducted, thus your active participation is essential to the success of this experiment, and is greatly appreciated. CONDITION ________ __________________________________________________
Note that "own performance" goes from "good" on the left to "poor" on the right.
45
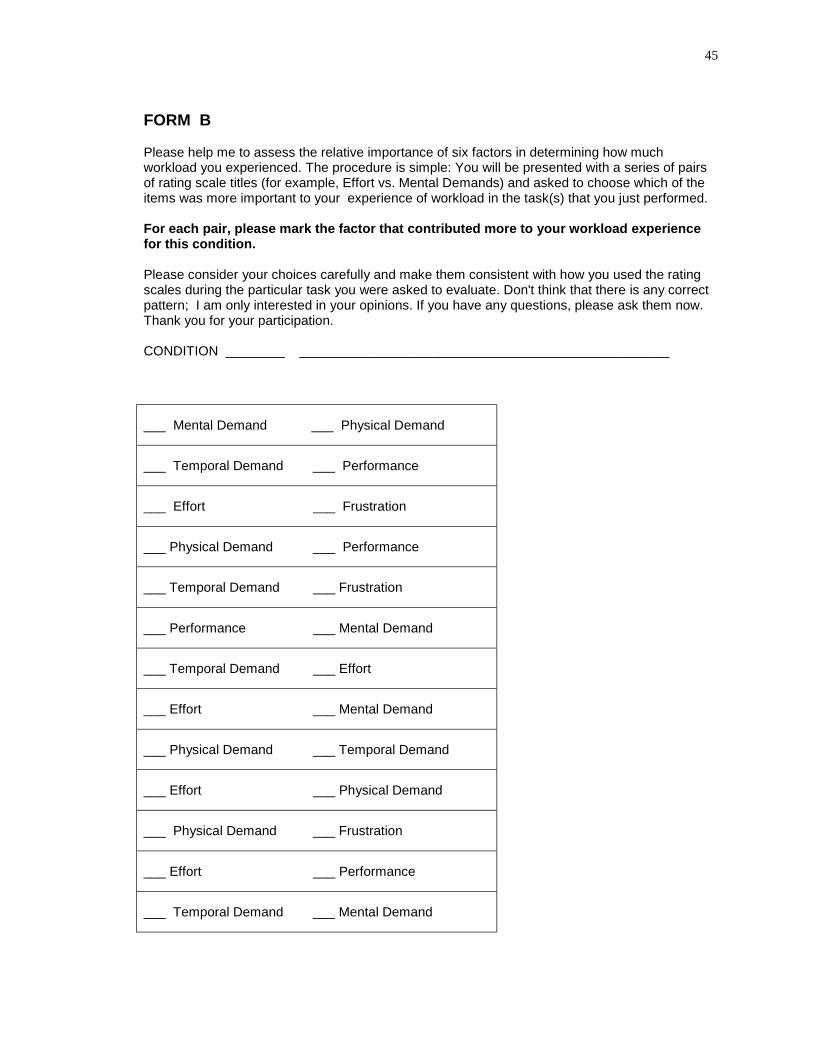
FORM B Please help me to assess the relative importance of six factors in determining how much workload you experienced. The procedure is simple: You will be presented with a series of pairs of rating scale titles (for example, Effort vs. Mental Demands) and asked to choose which of the items was more important to your experience of workload in the task(s) that you just performed. For each pair, please mark the factor that contributed more to your workload experience for this condition. Please consider your choices carefully and make them consistent with how you used the rating scales during the particular task you were asked to evaluate. Don't think that there is any correct pattern; I am only interested in your opinions. If you have any questions, please ask them now. Thank you for your participation. CONDITION ________ __________________________________________________
___ Mental Demand ___ Physical Demand
___ Temporal Demand ___ Performance
___ Effort ___ Frustration
___ Physical Demand ___ Performance
___ Temporal Demand ___ Frustration
___ Performance ___ Mental Demand
___ Temporal Demand ___ Effort
___ Effort ___ Mental Demand
___ Physical Demand ___ Temporal Demand
___ Effort ___ Physical Demand
___ Physical Demand ___ Frustration
___ Effort ___ Performance
___ Temporal Demand ___ Mental Demand

46
___ Mental Demand ___ Frustration
___ Frustration ___ Performance

47
Post-Experiment Questionnaire
Visual Search Study Investigator: Moira Burke
The experimenter will verbally ask these questions to the participant. What did you think? (Easy? Hard? But not: How did you do?) Do you feel like the animated banners caught your attention? Do you think you got used to them after awhile? Were some of them more distracting than others? Which was/were the worst? Was it easier when the boxes were lined up, rather than scattered randomly? Did you have any tricks or strategies that you used to perform well? Were you able to fool the computer and sometimes begin moving the mouse before you found the target? Did you do this intentionally? Please share any other comments at all that you have regarding this experiment.

48
APPENDIX B
ADDITIONAL EXPERIMENT RESULTS
Mean Search Times: Experiment 1: Mean search times (in msec) for each target position, split by banner type and layout. See text for a description of target position in scattered layouts. Columnar Layout Scattered Layout Target Position
Blank Anim Comm
Static Comm
Flashing Blank Anim Comm
Static Comm
Flashing
1 1000 1729 3495 1679 1045 741 1141 1145 2 804 906 808 770 956 954 933 816 3 1583 2483 1412 2150 2229 761 983 1800 4 1108 929 2383 1320 1466 2687 1983 2045 5 1275 1154 2427 1925 3858 1308 2849 2130 6 1362 1395 2587 1233 1720 3062 1612 1654 7 2437 1454 1845 1983 1723 1966 2591 3599 8 3116 2237 2833 1995 2216 3654 2099 2350 9 3296 1995 2241 2604 3233 3388 2895 2579 10 2283 1633 2045 2575 2487 2308 1699 1425 11 1979 2237 2133 1887 2444 2112 3133 2037 12 3750 1933 2756 2650 2570 2954 2633 2127 13 1958 3370 2366 2555 2829 2812 4079 4579 14 2516 2875 3175 3820 2858 2075 3358 2033 15 3595 3162 3141 3120 3087 2833 3495 3466 16 2579 3283 2150 3744 1841 2150 4326 3091 17 3308 2877 3020 2724 2208 3254 3229 2716 18 3404 3291 2595 3287 2883 2400 3449 3387 19 2933 4195 3291 4091 2804 2403 3155 2600 20 3050 3354 4145 2512 3091 2672 3854 3250 21 3162 3437 3183 2675 2137 2741 3937 4049 22 3272 3520 4183 3820 2466 2650 2344 2183 23 3137 3625 3254 3391 3529 2816 3120 2540 24 4277 3500 3520 3654 2745 3404 3383 3370

49
Experiment 2: Mean search times (in msec) for each target position, split by banner type Target Position
Blank Animated Commercial
Static Commercial
Flashing
1 6925.758 1621.21 1176.924 2562.498 2 3172.222 4701.389 2418.056 3946.667 3 8254.999 2579.166 4926.922 9415.278 4 3043.055 3443.054 3403.029 9651.389 5 3422.223 4170 3056.06 6256.409 6 5906.411 2828.205 5322.222 3247.221 7 6133.333 3301.515 6528.571 4354.445 8 4524.243 5514.102 5239.744 5127.778 9 4029.486 3657.142 4721.429 5010.256 10 6411.11 4104.167 5138.889 4694.872 11 7883.333 3825.556 5612.819 9977.273 12 5419.444 5320.832 8347.222 3615.15 13 6929.487 8337.501 4954.761 4729.488 14 6712.5 3738.461 3734.615 6180.952 15 4947.435 7698.612 6693.054 4281.945 16 9575.757 3993.055 4610.605 5383.334 17 5616.666 4971.795 5265.152 4223.077 18 7123.809 5726.39 4719.232 5713.635 19 5428.788 4193.94 3481.818 6912.501 20 6167.777 4772.619 8480.768 5184.525 21 5058.974 4636.666 7101.19 6502.778 22 4556.945 6737.18 6632.053 7946.429 23 5178.789 8312.5 7378.334 6536.111 24 8168.181 6922.221 8605.556 6970.833