The Effects of Proposition 209 on College Enrollment and ...
43
The Effects of Proposition 209 on College Enrollment and Graduation Rates in California * Peter Arcidiacono, † Esteban Aucejo, ‡ Patrick Coate, § and V. Joseph Hotz ¶ December 2011 Abstract Proposition 209 banned the use of racial preferences in admissions at public colleges in California. Although enrollments for minorities fell post-Prop 209, two-thirds of the drop came from the CSU system which consists primarily of non-selective institutions. More notably, we find that minority graduation rates increased after Prop 209 was implemented, a finding consistent with the argument that affirmative action bans result in better matching of students to colleges. To address the robustness of the positive effects on graduation and the role of matching, we analyze unique data for all applicants and enrollees within the University of California (UC) system before and after Prop 209. The positive Prop 209 effects on minority graduation rates persist, even after controlling for observed and unobserved qualifications of UC enrollees. We present evidence that certain institutions are better at graduating more-prepared students while other institutions are better at graduating less- prepared students and that these matching effects are particularly important for the bottom tail of the qualification distribution. In terms of graduation rates, we find that Prop 209 led to a more efficient sorting of minority students. Keywords: Affirmative Action, College Enrollment, College Graduation. * We wish to thank Richard Sander for helping to secure access to the University of California admissions data used in this paper. † Duke University and NBER ‡ Duke University § Duke University ¶ Duke University and NBER
Transcript of The Effects of Proposition 209 on College Enrollment and ...

The Effects of Proposition 209 on College Enrollment
and Graduation Rates in California∗
Peter Arcidiacono,† Esteban Aucejo,‡ Patrick Coate,§ and V. Joseph Hotz¶
December 2011
Abstract
Proposition 209 banned the use of racial preferences in admissions at public colleges inCalifornia. Although enrollments for minorities fell post-Prop 209, two-thirds of the dropcame from the CSU system which consists primarily of non-selective institutions. Morenotably, we find that minority graduation rates increased after Prop 209 was implemented, afinding consistent with the argument that affirmative action bans result in better matchingof students to colleges. To address the robustness of the positive effects on graduationand the role of matching, we analyze unique data for all applicants and enrollees within theUniversity of California (UC) system before and after Prop 209. The positive Prop 209 effectson minority graduation rates persist, even after controlling for observed and unobservedqualifications of UC enrollees. We present evidence that certain institutions are better atgraduating more-prepared students while other institutions are better at graduating less-prepared students and that these matching effects are particularly important for the bottomtail of the qualification distribution. In terms of graduation rates, we find that Prop 209 ledto a more efficient sorting of minority students.
Keywords: Affirmative Action, College Enrollment, College Graduation.
∗We wish to thank Richard Sander for helping to secure access to the University of California admissions dataused in this paper.
†Duke University and NBER‡Duke University§Duke University¶Duke University and NBER
1 Introduction
In 1996, the voters of California approved Proposition 209 – Prop 209 hereafter – whichstipulates that: “The state shall not discriminate against, or grant preferential treatment to,any individual or group on the basis of race, sex, color, ethnicity, or national origin in theoperation of public employment, public education, or public contracting.” The Proposition tookeffect in 1998. It set off a debate about the consequences of its ban on the use of affirmativeaction in the admissions at California’s public colleges and universities1 and its impact on theeducational opportunities and attainment for minorities that has continued across the U.S. asother states contemplated similar bans or had them imposed by courts.2
Proponents of affirmative action in college admissions claim that bans like Prop 209 reduceminority enrollments at public colleges, especially ones with selective admissions, and therebyhelp to preserve existing racial and ethnic disparities in employment and earnings in later life.3 Incontrast, opponents of affirmative action argued that such bans reduce the problem of “minoritymismatch.” According to the mismatch hypothesis,4 affirmative action in admissions leads tounderrepresented minorities being admitted to colleges with entering credentials that are lowerthan their non-minority counterparts, with this disparity typically more pronounced at more-selective ones. As a result, minority students are likely to achieve lower grades and are less likelyto graduate than their non-minority counterparts, which would be remedied if affirmative actionwas banned.5
In this paper we examine the effects that Prop 209 had on college enrollments and graduationrates in California. As noted above, much of the debate about the effects of affirmative actionbans centers on their impacts on the college attendance of underrepresented minorities, whetherthey graduate and how long it takes them if they do.6 Furthermore, as documented in Turner(2004), Bound and Turner (2007, 2011), and Bound, Lovenheim and Turner (2010a), while thenumber of students attending college has increased over the past three decades in the U.S., collegegraduation rates (i.e., the fraction of college enrollees that graduate) and college attainment rates(i.e., the fraction of the population with a college degree) have hardly changed since 1970 andthe time it takes college students to complete a baccalaureate (BA) degree has increased (Bound,Lovenheim and Turner, 2010b). The disparities between the trends in college attendance andcompletion or time-to-completion of college degrees is all the more stark given that the earningspremium for a college degree relative to a high school degree nearly doubled over this sameperiod (Goldin and Katz, 2008).
We follow recent studies of the effects of affirmative action bans (Hinrichs, 2010, 2011, andBackes, 2011) and examine how the one under Prop 209 affected enrollments and graduationrates at baccalaureate granting colleges. In particular, we focus much of our analyses on what
1Hereafter, we refer to both colleges and universities as “colleges.”2Affirmative action bans affecting public university admissions also were passed in Washington, Georgia, Ne-
braska, Michigan and Arizona, were court-ordered in Texas and were instituted by executive order in Florida.3See Kellough (2006) for a concise introduction to various arguments for and against affirmative action.4See Arcidiacono et al. (2011) for characterization of this hypothesis.5See the debate over mismatch effects in law schools in Sander (2004), Ayres and Brooks (2005), Ho (2005),
Chambers et. al. (2005), Barnes (2007) and Rothstein and Yoon (2008).6Research also has examined the effects of affirmative action (or banning it) on aspects of the college application
process (Card and Krueger, 2005; Long 2004) and Antonovics and Backes (2011). Also see Arcidiacono (2005) forevidence for the effects of affirmative action on labor market earnings after college.
1
happened to enrollments and graduation rates for the campuses/schools within the Universityof California (UC) and California State University (CSU) systems, as the admissions proceduresof both systems were subject to Prop 209’s ban. We distinguish the effects that occurred atselective public colleges from those with less-selective admissions policies, since previous researchhas found that the effects of such bans have been concentrated among selective colleges (Hinrichs2010, 2011). Finally, we also examine what, if any, indirect effects the implementation of Prop 209had on California’s private universities. While private universities in the state were not subjectto this ban, they may have been affected to the extent that they “compete” with California’spublic universities for students.7
To examine the effects of Prop 209 we use two different sources of data. As in several recentstudies (Hinrichs 2010, 2011, and Backes 2011), we begin our analysis with college-level datafrom the Integrated Postsecondary Education Data System (IPEDS) to examine the patternsof the enrollments and graduation rates – both on-time and within 6 years – of students at allCalifornia public and private colleges both before and after this ban took effect. These dataprovide us with a comprehensive picture of what happened at different types of colleges, i.e.,public vs. private and more- vs. less-selective. Exploiting the longitudinal nature of these data,we formulate model-based estimates of the effects of Prop 209 on enrollment and graduation thatcontrol for institution by race/ethnic group fixed effects to better isolate the causal effects of thisban. But, as we discuss below, the IPEDS data have some important limitations for our analysis.Chief among them is that they contain no information on student preparation for college (highschool grade point averages (GPA) and SAT or ACT test scores) or family background (parentalincome) of enrolled or graduating students. As a result, it is difficult to sort out the impactof affirmative action bans on enrollment and graduation outcomes at different types of schoolsfrom differences and changes in the composition of students attending particular colleges. Thedifficulty in accounting for the latter differences has plagued many of the recent evaluations ofaffirmative action bans.8
To help sort out these two forces, we make use of a second, and unique, source of student-level data for the universe of individuals that applied to one or more of the UC campuses inthe years before and after Prop 209. These data, obtained from the University of CaliforniaOffice of the President (UCOP).9 These data contain measures of high school GPAs and SATscores and of parental income and education, which allow us to both control for these factors inevaluating the effects of Prop 209 but also assess how they influence minority (and non-minority)graduation probabilities at the various UC campuses. The UCOP data provide information notonly on which UC campus a student enrolled and gradyated, if they did, but also on the otherUC campuses to which they applied and the ones to which they were admitted. We use theinformation on the UC campuses to which students were admitted, and the quality of those UCcampuses, to implement a modified version of the Dale and Krueger (2002) to control for studentqualifications beyond those measured by high school GPA and test scores.
Using the IPEDS data, we find that after the implementation of Prop 209 college enrollmentrates of African Americans and Hispanics in California’s 4-year public colleges fell, both relative
7Backes (2011) also examines the effects of bans on the college enrollments and completion rates of minorities.8As Hinrichs (2011) notes in his study of the effects of such bans on college graduation rates using IPEDS
data, “I do find that graduation rates for underrepresented minorities at selective universities rise, although Iacknowledge that this may be due to the changing composition of students who enroll at such universities.” (p.5).
9These data were obtained by Professor Richard Sander of UCLA under a Freedom of Information Act request.
2
to pre-Prop 209 rates and relative to the corresponding rate of whites and Asian Americans.These findings are consistent with previous research on the effects of bans on minority enroll-ment (Tienda et al. 2003; Long, 2007; Hinrichs, 2010; Backes, 2011). However, two-thirds of thedecline in minority public college enrollment occurred in the CSU system, which primarily con-sists of non-selective institutions. This result is particularly surprising given that less-selectiveUC schools – which are still more selective than CSU schools – saw increases in minority en-rollment. Given that admissions in the CSU should have been relatively unaffected by Prop209, we would have expected increases in minority enrollment in the CSU system as a result ofminority students now being rejected from more-selective UC schools. We present evidence thata different policy change, unique to the CSU system and implemented around the same time asProp 209, appears to have been responsible for the observed declines in minority enrollmentswithin this system.
In contrast to the results on enrollment, minority college graduation rates, both on-timeand within 6 years of enrollment, improved for California’s public 4-year colleges with the im-plementation of Prop 209 and improved relative to the corresponding rates of whites or AsianAmericans. And we find that on-time college (degree) attainment rates either remained constantor increased slightly after passage of Prop 209. Moreover, the improvements in minority gradu-ation rates tend to be larger at either the less-selective UC campuses (for African Americans) orthe CSU system (Hispanics). Again, these patterns show up in our unadjusted tabulations andour model-based estimates using IPEDS data.
Our finding that minority college graduation rates improved after the implementation of Prop209 is consistent with what one would predict would happen after such a ban if minority mismatchoccurred under affirmative action admissions policies. But, it also is consistent with Prop 209disproportionately reducing the number of less-academically prepared minorities attending allpublic colleges, including less-selective ones, and minority graduation rates increasing solely dueto the change in pool of minority college enrollees.
Using the UCOP student-level data, we still find that underrepresented minorities are morelikely to graduate from a UC campus post-Prop 209, even after one controls for direct andindirect measures of pre-college preparation and family background. The improvements overpre-Prop 209 graduation rates range from 3% to 7% depending on the controls used. Moreover,the increase in graduation rates for minorities are substantially larger than the correspondingestimates for other racial/ethnic groups.
What might account for these improvements in graduation rates in the UC system after theimplementation of Prop 209? Are they the result of better matching of students to campusesbased on the former’s academic preparation? We investigate how campuses differ in the academicpreparation of their students and their graduation rates. Unsurprisingly, we find that more-selective UC campuses, such as UC Berkeley and UCLA, enroll better prepared minority andnon-minority students and have higher graduation rates than less-selective campuses, such asUC Santa Cruz and UC Riverside. This is true both before and after the implementation of Prop209. Both the graduation rates and academic preparation of minority students improved at eachcampus after Prop 209 went into effect. However, these improvements in graduation rates werenot uniform across campuses and were not that highly correlated with school selectivity. Forexample, UC Santa Barbara had the biggest improvement in graduation rates for minority (andnon-minority) students after Prop 209 was implemented, even though it ranked in the bottomthird of UC campuses in the 1997 U.S. News & World Report university rankings. These
3

patterns suggest that campuses differ in their capacities to train and graduate students withdiffering academic preparations and that better matching of students to campuses on academicpreparation after Prop 209 may have contributed to the improvements in graduation rates.
To better isolate the potential importance of student-campus matching, we estimate a modelof the graduation rates of UC enrollees that allows campuses to differ in their likelihood of grad-uating students with differing academic preparation. We find substantial heterogeneity acrosscampuses in their graduation “productivities,” especially across students with differing academicpreparations. While some UC campuses (UC Santa Barbara) appear to have had an absoluteadvantage in producing high graduation rates across the academic preparation of minority stu-dents, other campuses are particularly well-suited for graduating more-prepared students (UCLAand UC San Diego) and other campuses are particularly well-suited for graduating less-preparedstudents (UC Riverside and UC Santa Cruz). The match between the school and the universityis particularly important for students who are less prepared, as those who are more prepared arelikely to graduate regardless of the school they attend. Finally, we find that part of the reasongraduation rates for minorities improved after Prop 209 was because of more efficient matching,with the largest improvements occurring among less-prepared students.
The remainder of the paper is organized as follows. In Section 2, we summarize enrollmentand graduation trends at California’s colleges for minority and non-minority students usingIPEDS data. Section 3 presents forecasts of the effects of Prop 209 from estimates of a model ofcollege enrollment and graduation decisions that we estimate with the college-level IPEDS data.As noted above, we find somewhat anomalous evidence that minority enrollment rates declinedwith the CSU system, even though they went up at less-selective UC campuses. We examine analternative explanation for these findings in Section 3.2. In Section 4 we take a closer look atthe effects of Prop 209 with new and rich individual-level data for the UC system. We describethese data in Section 4.1 and present estimates of the net effect of Prop 209 on the graduationrates of minorities and non-minorities UC enrollees in Section 4.2. Finally, in Sections 4.3 and4.4 we present our findings concerning across-campuses differences in the production of minoritygraduation rates and their implications for the role that better student-campus matching canand did play in improving these rates.
2 Enrollment and Graduation at California’s Colleges Beforeand After Prop 209
We begin by examining what happened to enrollments and graduations at California’s univer-sities and colleges before and after the enactment of Prop 209. We use data from the IntegratedPostsecondary Education Data System (IPEDS). IPEDS includes information on all post sec-ondary institutions that participate in Title IV federal student financial aid programs, such asPell Grants or Stafford Loans.10 We focus on enrollments and graduation of students seeking abachelor’s degrees at 4-year institutions.
Over the period we consider (1996 - 2001), there were 83 4-year colleges/universities in10Institutions that do not participate in these programs can still submit their information to IPEDS on a
voluntary basis.
4

Table 1: Characteristics of California’s 4-Year Universities and Colleges, 1996-2001
Share of Share of Share ofCalif. 4-yr 1996 Graduates
Number College Enrollments in ≤ 6 yrs4-yr Colleges/Universities 83U. of Calif. (UC) campuses 8 9.6% 33.9% 43.8%Calif. State Univ. (CSU) campuses 22 26.5% 39.8% 27.7%Private Universities 49 59.0% 24.2% 27.7%For-Profit Universities 4 4.8% 2.1% 0.8%Public Univ. in Top 50 U.S. News Ranking† 6 7.2% 29.1% 38.5%Private Univ. in Top 50 U.S. News Ranking† 6 7.2% 8.0% 11.0%
Data Source: IPEDS. Share of graduates refers to the 1996 entering cohort.† Number of colleges/universities that were in the 1997 U.S. News & World Report Top 50 “National Universities”or Top 50 “Liberal Arts Colleges.” See U.S. News & World Report, Sept 16, 1996, 121(11): 110, 116.
California [Table 1].11 Eight of these institutions were campuses in the University of California(UC) system, 22 were in the California State University (CSU) system, 49 were private, not-for-profit schools and there were 4 for-profit universities with campuses in California during thisperiod. While private schools outnumber public schools, their share of enrollments was muchsmaller, as shown in column 3 of Table 1. The CSU system had the largest share of enrollments,but their graduation rates were lower, with the UC system having the largest share of graduatesfrom the 1996 entering cohort.
We report enrollments by entry “cohorts”12 of students that enrolled as freshman in the fallof the years 1996 through 2001. The IPEDS data also contains the number of graduates for eachof these enrollment cohorts. The cohorts that entered in the years 1996 and 1997 are the “Pre-Prop 209” cohorts, while those that entered from 1998 through 2001 are the “Post-Prop 209”ones. With respect to graduation, the IPEDS collects data on the number of people in a givenenrollment cohort that graduate in 4 years or less, which characterize “on-time” graduation, andin 6 years or less, which is a fairly good measure of the number of an enrollment cohort that willever graduate from the institution.
2.1 College Enrollments
The top panel of Table 2 records the average number of freshmen that enrolled in California’s4-year colleges prior to Prop 209 years, 1996 and 1997, and for the post-Prop 209 years, 1998-2001, by race and ethnicity. The number of college enrollees grew for all race/ethnic groupsexcept for African Americans. However, some of this enrollment growth was the result of growthin California’s college age population. In the second panel of Table 2, we tabulate the averagenumber of high school seniors who graduated from California’s public high schools in the springof each year, for the Pre- and Post-Prop 209 years. The sizes of the cohorts of California’s
11In fact, there were more institutions in California during this period, but some of them were not included inthe sample due to missing values. Most of these institutions are private for-profit ones and represent a quite smallproportion of the total sample.
12Enrollment numbers correspond to the Bachelor adjusted cohort of IPEDS database, i.e., revised cohort minusexclusions, where exclusions denote students who died, or became permanently disabled, or left the school to servethe armed forces, among others.
5

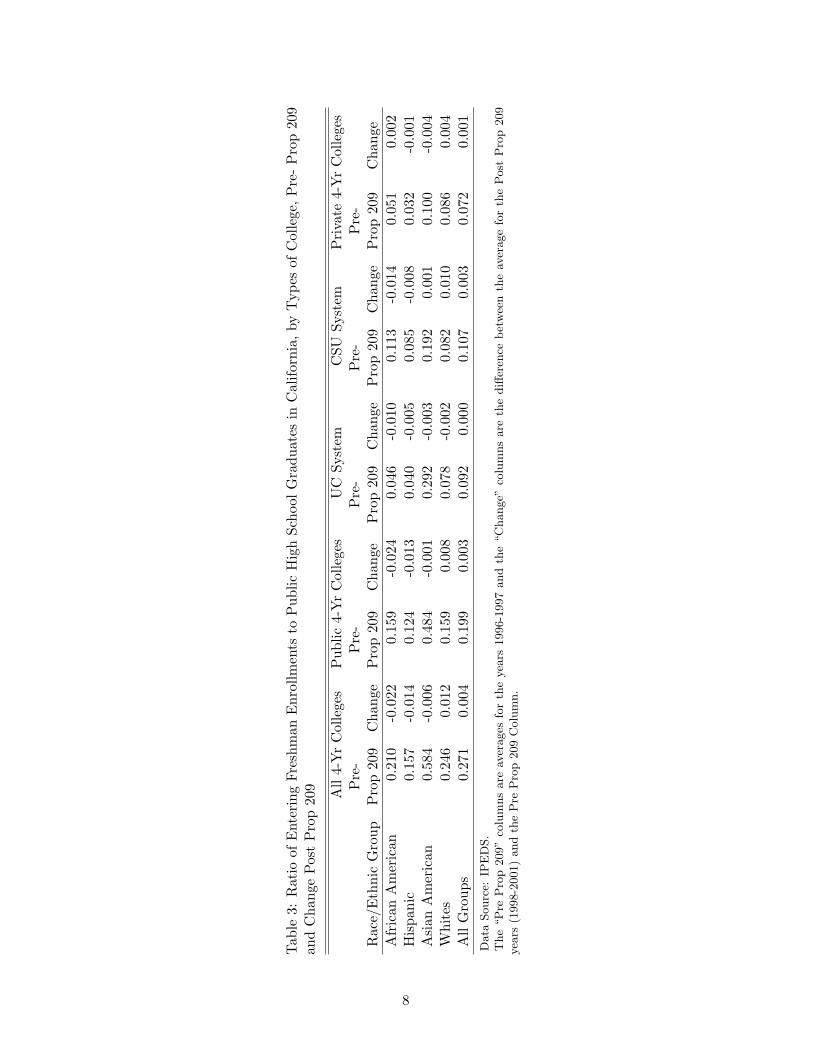
public high school graduates grew for each racial and ethnic group over this period, with theHispanic graduation cohorts growing by an average of 5.7% per year over this period and withthe size of high school graduating classes growing an average of 4.1% per year for all race/ethnicgroups. While the total number of California’s public high school graduates recorded in Table 2underestimates the number of students who were “at risk” of entering one of California’s collegesas a freshman,13 we use them to form college freshman college enrollment rates,14 in order toaccount for differential population growth. Such enrollment rates are presented in Table 3 forthe various race/ethnic groups and for various classifications of California’s 4-year colleges.
While there is a slight increase in the overall enrollment rate at California’s 4-year collegesafter Prop 209 is implemented [columns 1 and 2, Table 3], enrollment rates fell for AfricanAmericans, Hispanics and Asian Americans. The declines in college enrollment rates for AfricanAmericans and Hispanics at California’s colleges are driven by the declines that occur at Califor-nia’s public 4-year colleges. The latter colleges were subject to the provisions of Prop 209. Theaverage annual enrollment rates for African Americans declined by 15% (or by 0.024) post-Prop209 and by 10.3% (or by 0.013) for Hispanics. These declines in enrollment rates occurred bothwithin the UC system and the campuses of the CSU system. The magnitude of the declines inenrollment rates for both minorities were larger for the CSU system, given that the CSU sys-tem accounted for more than 71% of the freshman enrollments of African Americans at 4-yearcolleges and 68% for Hispanics prior to the implementation of Prop 209. But, the declines wereproportionately larger at UC campuses, with rates for African Americans declining by 21.3%and by 12.7% for Hispanics.
The final two columns of Table 3 show the pre-Prop 209 college enrollment rates and theirchange after Prop 209 is implemented at California’s 49 private colleges. None of these collegeswere subject to the affirmative action bans under the Proposition. In contrast to what we foundfor California’s public colleges, the freshmen enrollments rates at private 4-year colleges actuallyincreased slightly for African Americans and declined very slightly among Hispanics. At thesame time, the enrollment rates for both of these groups at private colleges in California arequite low before and after Prop 209, i.e., the numbers of minorities attending private 4-yearcolleges in California were small.
An important feature of the IPEDS data that complicates drawing conclusions about en-rollment (or graduation) trends for minority (or non-minority) groups is the precipitous rise,starting in 1998, in the number of entering students at California’s universities that did notdesignate a race or ethnic group, i.e., students “declined to state” their race or ethnicity andit was recorded as “Unknown.” The average number of college freshmen enrolled in collegewith Unknown race/ethnicity goes from 4,835 a year before Prop 209 to 7,851 after Prop 209is implemented [Top panel, Table 2], a 62% increase. While not shown in Table 2, 80% of thisincrease is due to the rise in the incidence of Unknowns among enrollees at California’s 4-yearpublic colleges. Between 1997 and 1998, the first year after the implementation of Prop 209,Unknowns enrolling at 4-year public colleges goes from 4,252 to 6,805, a 60% increase. Moreover,
13The more complete pool of students at risk to enroll as freshmen at one of California’s public (or private)colleges would include three other groups of students: (a) those who graduated from a private high school inCalifornia; (b) those who graduated from out-of-state high schools in the U.S.; and (c) those who graduated fromforeign high schools or their equivalents.
14More formally, college enrollment rates are defined to beEnrolljt
HSGradjt, where Enrolljt is the number of college
freshman of race/ethnic group j entering one of California’s public universities in year t, and HSGradjt thenumber of graduates from California’s public high schools in the spring of year t for race/ethnicity group j.
6
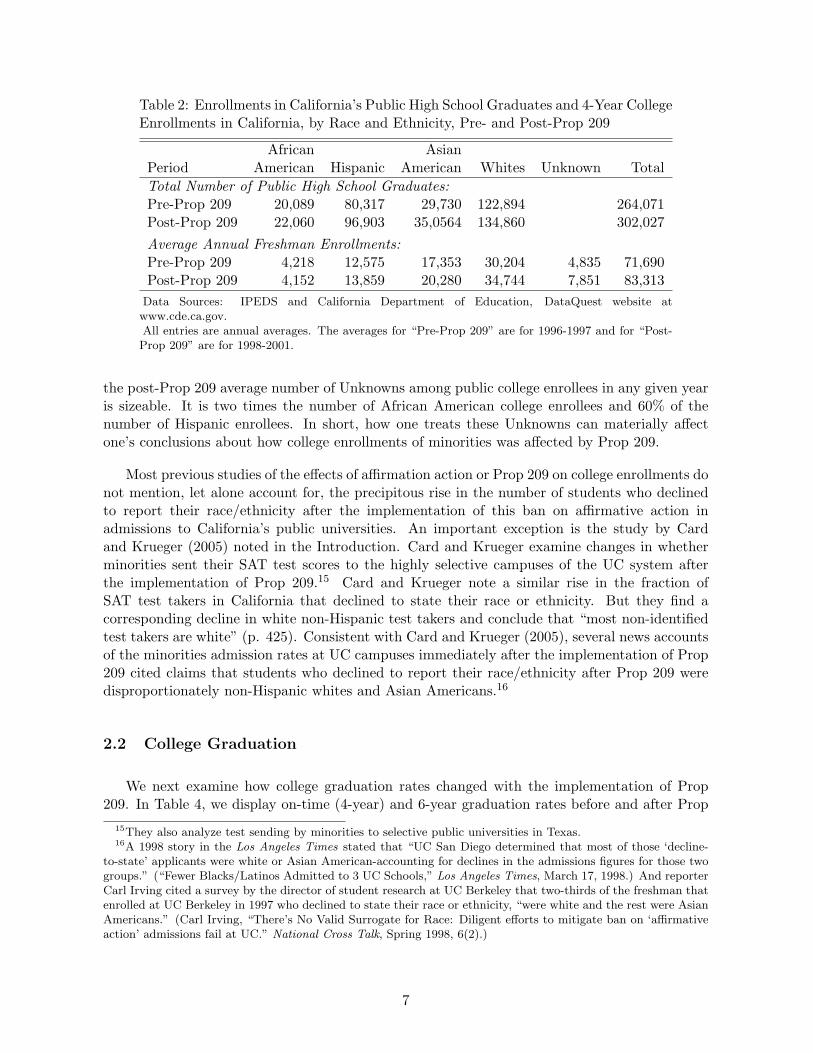
Table 2: Enrollments in California’s Public High School Graduates and 4-Year CollegeEnrollments in California, by Race and Ethnicity, Pre- and Post-Prop 209
African AsianPeriod American Hispanic American Whites Unknown TotalTotal Number of Public High School Graduates:Pre-Prop 209 20,089 80,317 29,730 122,894 264,071Post-Prop 209 22,060 96,903 35,0564 134,860 302,027Average Annual Freshman Enrollments:Pre-Prop 209 4,218 12,575 17,353 30,204 4,835 71,690Post-Prop 209 4,152 13,859 20,280 34,744 7,851 83,313
Data Sources: IPEDS and California Department of Education, DataQuest website atwww.cde.ca.gov.All entries are annual averages. The averages for “Pre-Prop 209” are for 1996-1997 and for “Post-Prop 209” are for 1998-2001.
the post-Prop 209 average number of Unknowns among public college enrollees in any given yearis sizeable. It is two times the number of African American college enrollees and 60% of thenumber of Hispanic enrollees. In short, how one treats these Unknowns can materially affectone’s conclusions about how college enrollments of minorities was affected by Prop 209.
Most previous studies of the effects of affirmation action or Prop 209 on college enrollments donot mention, let alone account for, the precipitous rise in the number of students who declinedto report their race/ethnicity after the implementation of this ban on affirmative action inadmissions to California’s public universities. An important exception is the study by Cardand Krueger (2005) noted in the Introduction. Card and Krueger examine changes in whetherminorities sent their SAT test scores to the highly selective campuses of the UC system afterthe implementation of Prop 209.15 Card and Krueger note a similar rise in the fraction ofSAT test takers in California that declined to state their race or ethnicity. But they find acorresponding decline in white non-Hispanic test takers and conclude that “most non-identifiedtest takers are white” (p. 425). Consistent with Card and Krueger (2005), several news accountsof the minorities admission rates at UC campuses immediately after the implementation of Prop209 cited claims that students who declined to report their race/ethnicity after Prop 209 weredisproportionately non-Hispanic whites and Asian Americans.16
2.2 College Graduation
We next examine how college graduation rates changed with the implementation of Prop209. In Table 4, we display on-time (4-year) and 6-year graduation rates before and after Prop
15They also analyze test sending by minorities to selective public universities in Texas.16A 1998 story in the Los Angeles Times stated that “UC San Diego determined that most of those ‘decline-
to-state’ applicants were white or Asian American-accounting for declines in the admissions figures for those twogroups.” (“Fewer Blacks/Latinos Admitted to 3 UC Schools,” Los Angeles Times, March 17, 1998.) And reporterCarl Irving cited a survey by the director of student research at UC Berkeley that two-thirds of the freshman thatenrolled at UC Berkeley in 1997 who declined to state their race or ethnicity, “were white and the rest were AsianAmericans.” (Carl Irving, “There’s No Valid Surrogate for Race: Diligent efforts to mitigate ban on ‘affirmativeaction’ admissions fail at UC.” National Cross Talk, Spring 1998, 6(2).)
7
Tab
le3:
Rat
ioof
Ent
erin
gFr
eshm
anE
nrol
lmen
tsto
Pub
licH
igh
Scho
olG
radu
ates
inC
alifo
rnia
,by
Typ
esof
Col
lege
,P
re-
Pro
p20
9an
dC
hang
ePos
tP
rop
209 All
4-Y
rC
olle
ges
Pub
lic4-
Yr
Col
lege
sU
CSy
stem
CSU
Syst
emP
riva
te4-
Yr
Col
lege
sP
re-
Pre
-P
re-
Pre
-P
re-
Rac
e/E
thni
cG
roup
Pro
p20
9C
hang
eP
rop
209
Cha
nge
Pro
p20
9C
hang
eP
rop
209
Cha
nge
Pro
p20
9C
hang
eA
fric
anA
mer
ican
0.21
0-0
.022
0.15
9-0
.024
0.04
6-0
.010
0.11
3-0
.014
0.05
10.
002
His
pani
c0.
157
-0.0
140.
124
-0.0
130.
040
-0.0
050.
085
-0.0
080.
032
-0.0
01A
sian
Am
eric
an0.
584
-0.0
060.
484
-0.0
010.
292
-0.0
030.
192
0.00
10.
100
-0.0
04W
hite
s0.
246
0.01
20.
159
0.00
80.
078
-0.0
020.
082
0.01
00.
086
0.00
4A
llG
roup
s0.
271
0.00
40.
199
0.00
30.
092
0.00
00.
107
0.00
30.
072
0.00
1D
ata
Sourc
e:IP
ED
S.
The
“P
reP
rop
209”
colu
mns
are
aver
ages
for
the
yea
rs1996-1
997
and
the
“C
hange”
colu
mns
are
the
diff
eren
cebet
wee
nth
eav
erage
for
the
Post
Pro
p209
yea
rs(1
998-2
001)
and
the
Pre
Pro
p209
Colu
mn.
8

209,17 and, in Table 5, college (degree) attainment rates.18 The layout of these tables parallelthat in Table 2.
While minority freshman college enrollment rates at California’s public colleges declined forboth African Americans and Hispanics after Prop 209, minority enrollees at public colleges weremore likely to graduate after it was implemented [“Public 4-Year Colleges,” Table 4]. The on-time graduation rates of African Americans went up by 0.025 for a 23.1% increase after Prop209 and by 0.034 in the 6-year graduation rate for a 9.3% increase. Hispanic on-time graduationrates at public colleges increased 0.033 for a 23.8% improvement and increased 0.030 for a 6.4%improvement in 6-year graduation rates. Moreover, the graduation rates of minority enrolleesimproved in both the UC and CSU systems, with the size of improvements in graduation ratesgreater for UC campuses but with larger relative improvements at CSU campuses. Finally,minority graduation rates improved, post-Prop 209, in California’s private colleges, even thoughthe latter group was not subject to this law. Below, we provide some limited evidence that theseimprovements in minority graduation rates at private colleges may have been the result of achange (improvement) in the academic preparedness of minority students entering these schoolsafter Prop 209 went into effect.
As shown in Table 4, the graduation rates of students enrolled at a public college thatdeclined to state their race or ethnicity with the passage of Prop 209 also increased after Prop209 went into effect, by 0.056 for on-time graduation (a 24% improvement) and by 0.045 in6-year graduation rates (a 8.0% improvement). The magnitude of these improvements withProp 209 for the Unknowns are comparable in size to those for minorities and substantiallylarger than those for Asian Americans or whites. At the same time, the post-Prop 209 collegegraduation rates for the Unknowns are closer to those for non-minorities than minorities. Thislatter pattern is consistent with news accounts and the contention by Card and Krueger (2005)that the post-Prop 209 rise in the college enrollees that were recorded as Unknowns were notminorities.
We also find improvements in rates of college degree attainment with Prop 209 for minoritiesat California’s public colleges [Table 5]. The number of on-time graduations from a public collegerelative to the number of public high school graduates improved for both African Americans andHispanics with the implementation of Prop 209. Again, we find improvement in on-time collegeattainment rates at California’s private colleges post Prop 209. Finally, with respect to minorityhigh school students who ever graduate from a California 4-year college, i.e., graduate in 6 yearsor less, after the implementation of Prop 209 [Table 5], the shares at public colleges go down.But, while the share of minorities ever attaining a BA degree from a UC campus declines, theshare improves slightly at CSU campuses.
The improvements in minority (and non-minority) graduation from college, post-Prop 209,are consistent with the implementation of Prop 209 resulting in greater sorting of students tocolleges based on the former’s academic preparedness that resulted in higher graduation rates,especially on-time graduation, even if college attainment rates declined among minorities. But,drawing conclusions about what role such matching played in the improvement of minority
17 More formally, the X-year college graduation rate is equal toGradXjt
Enrolljt, where GradXjt is the number of
college freshman of race/ethnic group j in entry cohort t that graduated from one of California’s colleges in Xyears or less, where X is either 4 or 6 years.
18The college (degree) attainment rates in Table 5 are defined asGradXjt
HSGradjt, where GradXjt is defined in footnote
17 and HSGradjt is defined in footnote 14.
9

graduation rates is premature for a number of reasons. First, we need to take into account timetrends in enrollments and graduation rates and how these trends vary across races. Second,the claims about improvements in student-college matching resulting from acts like Prop 209presume that colleges differ in their level of difficulty, or quality, and that supply of higher qualityinstitutions is limited. Third, assessing whether Prop 209 might have improved the sorting ofpotential students on their academic preparation requires that we have an independent measureof this preparation. In the next section, we attempt to address the first two of these concerns,deferring our discussion of the third concern until Section 4.2.
3 Estimating Prop 209 Effects with IPEDS Data
Below, we present forecasts from a student-level choice model to better isolate the role thatProp 209 had on the enrollment and graduation trends presented in the previous section. Themodel is estimated with the college-level IPEDS data. Using these more aggregated data, ratherthan student-level data, to estimate these effects has pluses and minuses. As we will see in Section4.2, using individual-level data on students who apply to one or more of the UC campuses allowsus the ability to control for direct and indirect measures of academic preparation of studentsthat are not feasible with the IPEDS data. But, using the IPEDS data allows us to see how theeffects of Prop 209 differed across public and private colleges as well as more- versus less-selectiveones. The before-versus-after trends discussed in the previous section clearly suggest that Prop209 may have had very different effects across these different types of colleges and the IPEDSdata allow us a unique data source to evaluate such differences.
In the Appendix we layout an empirical model of the college enrollment decisions that highschool graduates face that is estimable with college-level, aggregated data sources like IPEDS.With respect to college enrollment decisions, there are a series of choices that underly enrollmentrates. High school graduates decide whether or not to apply to one or more college out a feasibleset of colleges or to not go to college at all. Colleges decide which applicants to accept. And,finally, accepted students decide in which college they will enroll. Given the nature of our data,we cannot model each of these stages.19 Rather, we set out a simple model in which studentsare assumed to choose whether to enroll at a particular college or not go to any college andcharacterize the assumptions required to map the parameters of this model to the aggregateddata available on enrollments from the IPEDS. The model effectively reduces to a multinomiallogit model of a student’s choice of a college from the set of available colleges, public and private,in California and a logit model of students’ choice of whether to graduate from the college theychoose to attend. The parameter estimates for these models are displayed in the Appendix.
3.1 Forecasts of the Prop 209 Effects at California’s Colleges
We use the parameter estimates and model in the Appendix to forecast the effect of Prop209 on enrollment and graduation rates relative to the corresponding pre-Prop 209 rates forthese outcomes. Column (1) of Table 6 displays the average annual enrollment shares of 1997African American and Hispanic high school graduates – the last pre-Prop 209 cohort of high
19See Arcidiacono (2005) for an estimable structural model that characterizes each of these decisions usingstudent-level data.
10

Tab
le4:
Shar
eof
Col
lege
Enr
olle
esth
atG
radu
ate,
Pre
-Pro
p20
9an
dC
hang
ePos
t-P
rop
209,
byT
ypes
ofC
olle
ge
All
4-Y
rC
olle
ges
Pub
lic4-
Yr
Col
lege
sU
CSy
stem
CSU
Syst
emP
riva
te4-
Yr
Col
lege
sP
re-
Pre
-P
re-
Pre
-P
re-
Rac
e/E
thni
cG
roup
Pro
p20
9C
hang
eP
rop
209
Cha
nge
Pro
p20
9C
hang
eP
rop
209
Cha
nge
Pro
p20
9C
hang
eG
radu
ated
in4
Yea
rsor
Less
:A
fric
anA
mer
ican
0.16
90.
048
0.10
90.
025
0.28
20.
067
0.03
80.
017
0.35
70.
069
His
pani
c0.
206
0.03
40.
138
0.03
30.
321
0.04
30.
053
0.03
20.
466
0.01
8A
sian
Am
eric
an0.
345
0.03
50.
296
0.04
40.
441
0.06
20.
077
0.02
10.
578
0.00
2W
hite
s0.
399
0.02
10.
307
0.02
60.
486
0.04
90.
137
0.03
10.
559
0.02
1U
nkno
wn
0.25
80.
048
0.23
10.
056
0.46
60.
034
0.11
70.
025
0.40
10.
003
All
Gro
ups
0.32
60.
032
0.25
30.
038
0.43
80.
054
0.09
40.
030
0.52
70.
017
Gra
duat
edin
6Yea
rsor
Less
:A
fric
anA
mer
ican
0.39
80.
050
0.36
70.
034
0.66
40.
031
0.24
50.
047
0.49
50.
073
His
pani
c0.
503
0.02
70.
474
0.03
00.
710
0.02
10.
363
0.03
90.
614
0.00
5A
sian
Am
eric
an0.
669
0.02
20.
659
0.02
60.
804
0.02
20.
438
0.03
60.
717
-0.0
01W
hite
s0.
660
0.00
90.
642
0.01
10.
790
0.01
70.
502
0.02
60.
680
0.01
8U
nkno
wn
0.56
00.
034
0.56
70.
045
0.80
2-0
.009
0.45
20.
035
0.51
9-0
.013
All
Gro
ups
0.60
70.
023
0.58
90.
027
0.77
90.
019
0.42
70.
039
0.65
60.
012
Data
Sourc
e:IP
ED
S.
The
“P
reP
rop
209”
colu
mns
are
aver
ages
for
the
yea
rs1996-1
997
and
the
“C
hange”
colu
mns
are
the
diff
eren
cebet
wee
nth
eav
erage
for
the
Post
Pro
p209
yea
rs(1
998-2
001)
and
the
Pre
Pro
p209
Colu
mn.
11

Tab
le5:
Rat
ioof
No.
ofFr
eshm
anth
atG
radu
ate
from
Col
lege
toN
o.of
Hig
hSc
hool
Gra
duat
es,by
Typ
esof
Col
lege
,P
re-P
rop
209
and
Cha
nge
Pos
t-P
rop
209 All
4-Y
rC
olle
ges
Pub
lic4-
Yr
Col
lege
sU
CSy
stem
CSU
Syst
emP
riva
te4-
Yr
Col
lege
sP
re-
Pre
-P
re-
Pre
-P
re-
Rac
e/E
thni
cG
roup
Pro
p20
9C
hang
eP
rop
209
Cha
nge
Pro
p20
9C
hang
eP
rop
209
Cha
nge
Pro
p20
9C
hang
eG
radu
ated
in4
Yea
rsor
Less
:A
fric
anA
mer
ican
0.03
50.
005
0.01
70.
001
0.01
30.
000
0.00
40.
001
0.01
80.
005
His
pani
c0.
032
0.00
20.
017
0.00
20.
013
0.00
00.
005
0.00
20.
015
0.00
0A
sian
Am
eric
an0.
201
0.01
90.
144
0.02
10.
129
0.01
70.
015
0.00
40.
058
-0.0
02W
hite
s0.
098
0.01
00.
049
0.00
70.
038
0.00
30.
011
0.00
40.
049
0.00
3A
llG
roup
s0.
088
0.01
00.
050
0.00
90.
040
0.00
50.
010
0.00
40.
038
0.00
2G
radu
ated
in6
Yea
rsor
Less
:A
fric
anA
mer
ican
0.08
30.
001
0.05
8-0
.004
0.03
1-0
.005
0.02
80.
001
0.02
50.
005
His
pani
c0.
079
-0.0
030.
059
-0.0
030.
028
-0.0
030.
031
0.00
00.
020
0.00
0A
sian
Am
eric
an0.
390
0.00
90.
319
0.01
20.
235
0.00
40.
084
0.00
70.
072
-0.0
03W
hite
s0.
162
0.01
00.
102
0.00
70.
061
-0.0
010.
041
0.00
70.
060
0.00
3A
llG
roup
s0.
165
0.00
90.
117
0.00
80.
072
0.00
20.
046
0.00
60.
047
0.00
1D
ata
Sourc
e:IP
ED
S.
The
“P
reP
rop
209”
colu
mns
are
aver
ages
for
the
yea
rs1996-1
997
and
the
“C
hange”
colu
mns
are
the
diff
eren
cebet
wee
nth
eav
erage
for
the
Post
Pro
p209
yea
rs(1
998-2
001)
and
the
Pre
Pro
p209
Colu
mn.
12
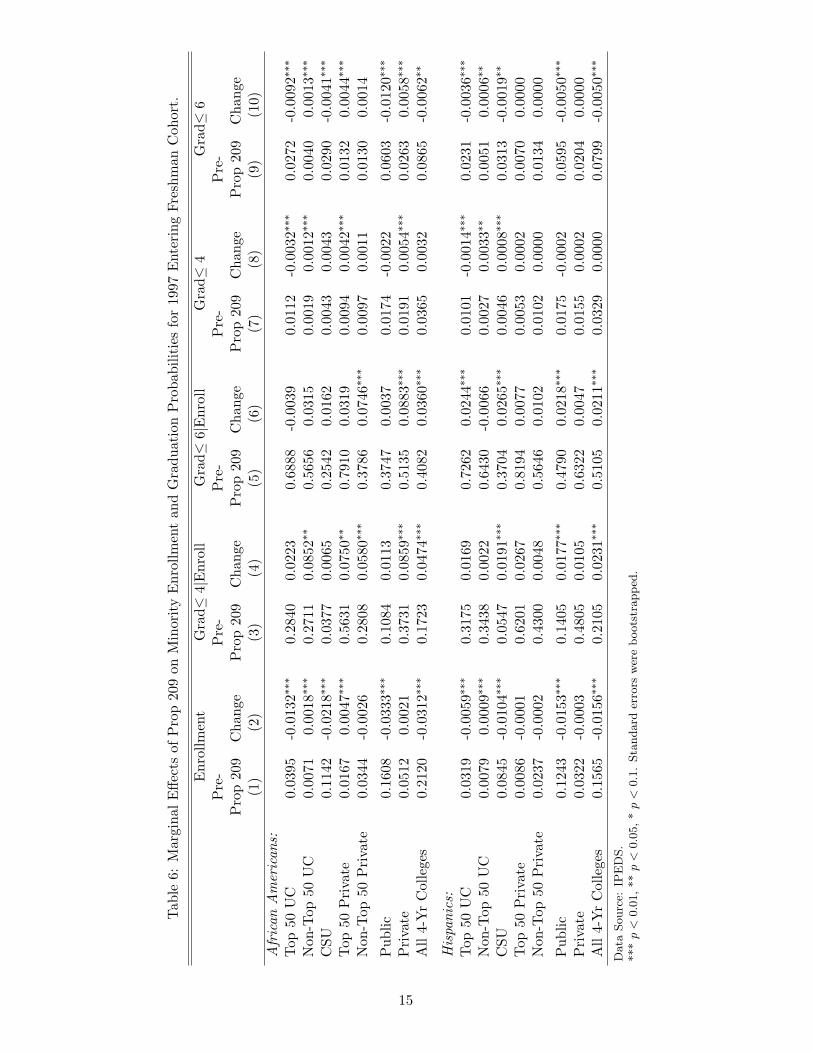
school graduates – for different types of colleges and column (2) displays the change in theseshares due to Prop 209 that is predicted by our model. For this cohort, the share of AfricanAmericans enrolled in public schools would have been predicted to fall by 3.33% if Prop 209had been implemented a year earlier. Private schools would have increased their enrollmentshare by 0.21%, which is statistically insignificant from zero. The latter increase would haveonly partially offset the enrollment declines in public universities, implying that Prop 209 wouldhave lead to a decline of 3.12% in enrollments in 4-year colleagues in California for this cohortof African American high school graduates. This is a sizeable decline, especially consideringthat only 21.2% of African Americans in this pre-Prop 209 cohort actually enrolled in a 4-yearcollege. Our model predicts that the share of Hispanic high school graduates in this cohort thatwould have enrolled in a 4-year colleges would have declined by 1.56% if Prop 209 had beenimplemented a year early or about half the size of the African American effect. (This decline isstatistically significant.) However, we note that the actual share of Hispanics in this cohort thatenrolled in a 4-year college was slightly lower (15.6%) than that of African Americans.
While the enrollment rates of African American and Hispanics declined at the Top 50 (ranked)UC campuses, they actually increased at non-Top 50 UC campuses (UC Riverside and UC SantaCruz). But, our estimates imply that Prop 209 led to statistically significant declines in theenrollments of both African Americans and Hispanics in the CSU system, even though almostall of the CSU campuses are less selective in their admissions than any of the UC campuses,including UC Riverside and UC Santa Cruz. Moreover, these declines at CSU campuses aresizeable and account for 65% of the overall enrollment drop for both minority groups. In Section3.2, we explore the possibility that a different policy change, that only affected the CSU system,may account for the latter declines in minority enrollments.
Columns (3) and (4) and columns (5) and (6) in Table 6 display estimates of the marginaleffects of Prop 209 on college graduation rates for African Americans and Hispanics. Theseestimated effects are obtained by calculating the graduation probabilities at each school forAfrican Americans and Hispanics in the same 1997 high school graduation cohort and thenweighting these probabilities by the predicted enrollments for these two groups at each school.We find that college graduation rates for African Americans and Hispanics – both 4-and 6-year– would have been significantly higher if Prop 209 had been implemented a year earlier. This istrue for almost all types of colleges, including those in the CSU system which had substantiallylower pre-Prop 209 (conditional) graduation rates. The estimated Prop 209 effects on 4-yeargraduation rates are particularly strong for African Americans. Our model predicted that collegeenrollees for this minority group would have experienced a 4.7 percentage point increase ingraduation rates, where the pre-Prop 209 4-year graduation rate for African Americans in the1997 cohort is less than 8%. As we found for enrollments, the predicted Prop 209 effects onconditional graduation rates for Hispanics are muted relative to African Americans. Graduationrates conditional on enrollment increase by 1.8 and 2.2 percentage points for 4-year and 6-yeargraduation rates respectively, with base rates absent Prop 209 of 21% and 51%.
Finally, we present estimates of the marginal effects of Prop 209 on the college degree at-tainment rates for African American and Hispanics in columns (8) and (10) of Table 6. Theseestimates are obtained by multiplying the predicted probabilities of enrolling by the predictedprobabilities of graduating at each institution and then summing up these probabilities overcolleges for each college type. Our model predicts that Prop 209 increased the on-time collegeattainment rates of African Americans, with the positive effects on conditional graduation rates
13

outweighing the negative effects on enrollments. However, we find that 6-year college attain-ment rates for African Americans decline by 0.62%, relative to the pre-Prop 209 rate of 8.6%.Furthermore, for Hispanics, we estimate that Prop 209 had no effect on 4-year graduation rates,but a negative effect of 0.5% for 6-year graduation rates.
3.2 Did another policy contribute to the CSU enrollment drop?
Based on the evidence presented in the previous section, it appears that Prop 209 reducedminority enrollments at campuses within the CSU system. As already noted, we would haveexpected minority enrollments in the CSU system to respond in a similar way to those at less-selective UC schools, with minorities turned away from top schools after Prop 209 expectedto increase the pool of minorities available for enrollment at less-selective schools. Indeed, theadmission rate for African Americans to the CSU system fell by only 0.4% but the enrollmentrate conditional on being admitted fell by 6%.20 As we discuss below, a policy implemented inthe CSU system at the same time that Prop 209 may account for drops in minority enrollmentsat CSU campuses that our model attributed to Prop 209.
In the fall of 1998 – the same year that Prop 209 took effect – CSU campuses were required tocomply with an executive order issued by the CSU Board of Trustees and the CSU Chancellor’sOffice. This order, Executive Order 665 (EO 665), established that all incoming freshmen in theCSU system must take the English Placement Test (EPT) and the Entry Level Mathematics(ELM) test, unless they were exempted by having sufficiently high SAT, ACT or AP scores. Inaddition, students who did not pass the EPT and/or ELM also were required to enroll in theappropriate preparatory courses in their first semester of enrollment. All preparatory courseshad to be completed within the student’s first 12 or 15 months after initially enrolling on campus;otherwise, the student was not allowed to continue at the university, resulting in administrativedisqualification. It is this latter restriction that made EO 665 binding as many students alreadywere taking remedial classes.
The implementation of EO 665 may have deterred enrollments in the CSU system, especiallyamong minorities. According to the Legislative Analyst’s Office of California (LAO) more thantwo thirds of admitted freshmen failed at least one of the entry exams and one third failedboth tests. Furthermore, compared to non-minorities, minorities were much more likely tohave taken one or more of the remedial courses. Table 7 shows the percentages of studentsenrolled in CSU Freshman remediation courses by race and ethnicity; 80% and 47% of theAfrican American and white freshmen, respectively, were enrolled in math remediation coursesin 1997. In addition, 64% of African Americans had to enroll in English remediation coursescompared to only 28% of whites. Furthermore, according to the LAO, 20% of freshmen studentsat CSU could not complete remediation courses on time, with one third of them leaving theCSU system voluntarily, another third being dis-enrolled and the final third given an extensioninto their second year of college to complete their remedial course work. We do not have dataon the distribution of these reductions in enrollment by race and ethnicity but, if they wereproportional to the distribution of those who had to take these courses, the imposition of EO665 may have reduced the enrollments of minorities at CSU campuses at just the same time thatProp 209 went into effect.
20See Statistical Abstracts for the California State University system athttp://www.calstate.edu/AS/abstract.shtml. Similar patterns are observed for Hispanics.
14
Tab
le6:
Mar
gina
lE
ffect
sof
Pro
p20
9on
Min
ority
Enr
ollm
ent
and
Gra
duat
ion
Pro
babi
litie
sfo
r19
97E
nter
ing
Fres
hman
Coh
ort.
Enr
ollm
ent
Gra
d≤4|
Enr
oll
Gra
d≤6|
Enr
oll
Gra
d≤4
Gra
d≤6
Pre
-P
re-
Pre
-P
re-
Pre
-P
rop
209
Cha
nge
Pro
p20
9C
hang
eP
rop
209
Cha
nge
Pro
p20
9C
hang
eP
rop
209
Cha
nge
(1)
(2)
(3)
(4)
(5)
(6)
(7)
(8)
(9)
(10)
Afr
ican
Am
eric
ans:
Top
50U
C0.
0395
-0.0
132∗
∗∗0.
2840
0.02
230.
6888
-0.0
039
0.01
12-0
.003
2∗∗∗
0.02
72-0
.009
2∗∗∗
Non
-Top
50U
C0.
0071
0.00
18∗∗
∗0.
2711
0.08
52∗∗
0.56
560.
0315
0.00
190.
0012
∗∗∗
0.00
400.
0013
∗∗∗
CSU
0.11
42-0
.021
8∗∗∗
0.03
770.
0065
0.25
420.
0162
0.00
430.
0043
0.02
90-0
.004
1∗∗∗
Top
50P
riva
te0.
0167
0.00
47∗∗
∗0.
5631
0.07
50∗∗
0.79
100.
0319
0.00
940.
0042
∗∗∗
0.01
320.
0044
∗∗∗
Non
-Top
50P
riva
te0.
0344
-0.0
026
0.28
080.
0580
∗∗∗
0.37
860.
0746
∗∗∗
0.00
970.
0011
0.01
300.
0014
Pub
lic0.
1608
-0.0
333∗
∗∗0.
1084
0.01
130.
3747
0.00
370.
0174
-0.0
022
0.06
03-0
.012
0∗∗∗
Pri
vate
0.05
120.
0021
0.37
310.
0859
∗∗∗
0.51
350.
0883
∗∗∗
0.01
910.
0054
∗∗∗
0.02
630.
0058
∗∗∗
All
4-Y
rC
olle
ges
0.21
20-0
.031
2∗∗∗
0.17
230.
0474
∗∗∗
0.40
820.
0360
∗∗∗
0.03
650.
0032
0.08
65-0
.006
2∗∗
His
pani
cs:
Top
50U
C0.
0319
-0.0
059∗
∗∗0.
3175
0.01
690.
7262
0.02
44∗∗
∗0.
0101
-0.0
014∗
∗∗0.
0231
-0.0
036∗
∗∗
Non
-Top
50U
C0.
0079
0.00
09∗∗
∗0.
3438
0.00
220.
6430
-0.0
066
0.00
270.
0033
∗∗0.
0051
0.00
06∗∗
CSU
0.08
45-0
.010
4∗∗∗
0.05
470.
0191
∗∗∗
0.37
040.
0265
∗∗∗
0.00
460.
0008
∗∗∗
0.03
13-0
.001
9∗∗
Top
50P
riva
te0.
0086
-0.0
001
0.62
010.
0267
0.81
940.
0077
0.00
530.
0002
0.00
700.
0000
Non
-Top
50P
riva
te0.
0237
-0.0
002
0.43
000.
0048
0.56
460.
0102
0.01
020.
0000
0.01
340.
0000
Pub
lic0.
1243
-0.0
153∗
∗∗0.
1405
0.01
77∗∗
∗0.
4790
0.02
18∗∗
∗0.
0175
-0.0
002
0.05
95-0
.005
0∗∗∗
Pri
vate
0.03
22-0
.000
30.
4805
0.01
050.
6322
0.00
470.
0155
0.00
020.
0204
0.00
00A
ll4-
Yr
Col
lege
s0.
1565
-0.0
156∗
∗∗0.
2105
0.02
31∗∗
∗0.
5105
0.02
11∗∗
∗0.
0329
0.00
000.
0799
-0.0
050∗
∗∗
Data
Sourc
e:IP
ED
S.
***
p<
0.0
1,**
p<
0.0
5,*
p<
0.1
.Sta
ndard
erro
rsw
ere
boots
trapped
.
15
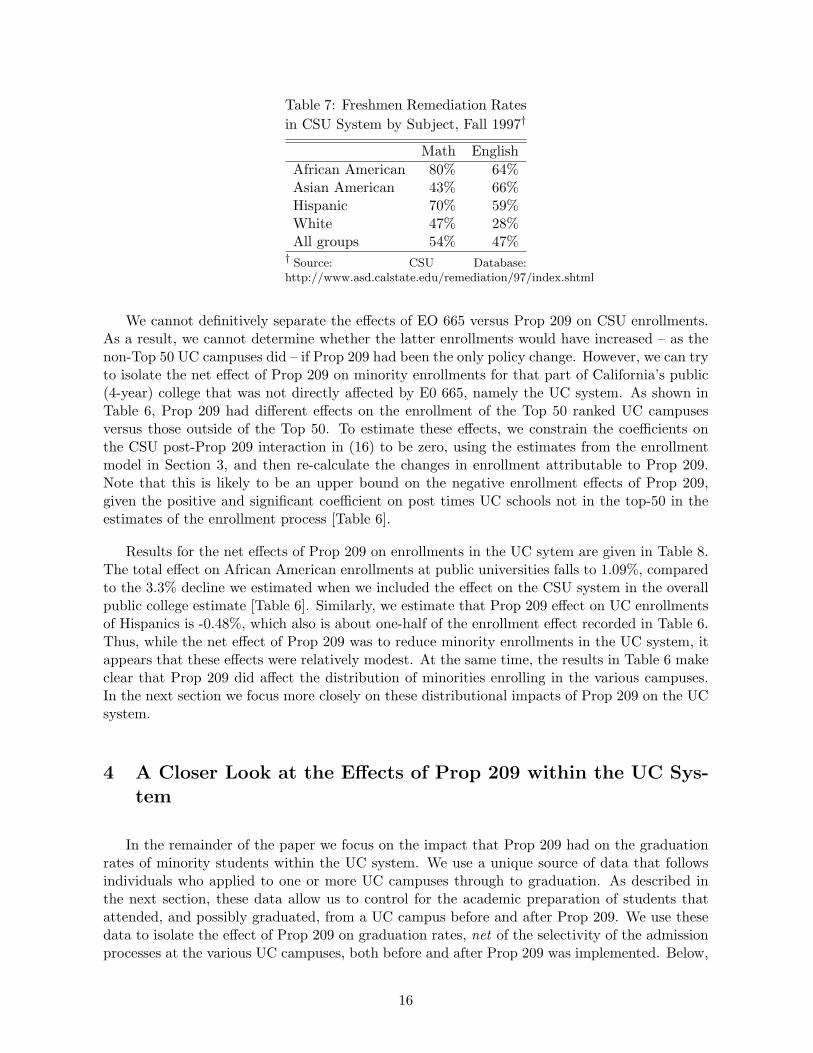
Table 7: Freshmen Remediation Ratesin CSU System by Subject, Fall 1997†
Math EnglishAfrican American 80% 64%Asian American 43% 66%Hispanic 70% 59%White 47% 28%All groups 54% 47%
† Source: CSU Database:http://www.asd.calstate.edu/remediation/97/index.shtml
We cannot definitively separate the effects of EO 665 versus Prop 209 on CSU enrollments.As a result, we cannot determine whether the latter enrollments would have increased – as thenon-Top 50 UC campuses did – if Prop 209 had been the only policy change. However, we can tryto isolate the net effect of Prop 209 on minority enrollments for that part of California’s public(4-year) college that was not directly affected by E0 665, namely the UC system. As shown inTable 6, Prop 209 had different effects on the enrollment of the Top 50 ranked UC campusesversus those outside of the Top 50. To estimate these effects, we constrain the coefficients onthe CSU post-Prop 209 interaction in (16) to be zero, using the estimates from the enrollmentmodel in Section 3, and then re-calculate the changes in enrollment attributable to Prop 209.Note that this is likely to be an upper bound on the negative enrollment effects of Prop 209,given the positive and significant coefficient on post times UC schools not in the top-50 in theestimates of the enrollment process [Table 6].
Results for the net effects of Prop 209 on enrollments in the UC sytem are given in Table 8.The total effect on African American enrollments at public universities falls to 1.09%, comparedto the 3.3% decline we estimated when we included the effect on the CSU system in the overallpublic college estimate [Table 6]. Similarly, we estimate that Prop 209 effect on UC enrollmentsof Hispanics is -0.48%, which also is about one-half of the enrollment effect recorded in Table 6.Thus, while the net effect of Prop 209 was to reduce minority enrollments in the UC system, itappears that these effects were relatively modest. At the same time, the results in Table 6 makeclear that Prop 209 did affect the distribution of minorities enrolling in the various campuses.In the next section we focus more closely on these distributional impacts of Prop 209 on the UCsystem.
4 A Closer Look at the Effects of Prop 209 within the UC Sys-tem
In the remainder of the paper we focus on the impact that Prop 209 had on the graduationrates of minority students within the UC system. We use a unique source of data that followsindividuals who applied to one or more UC campuses through to graduation. As described inthe next section, these data allow us to control for the academic preparation of students thatattended, and possibly graduated, from a UC campus before and after Prop 209. We use thesedata to isolate the effect of Prop 209 on graduation rates, net of the selectivity of the admissionprocesses at the various UC campuses, both before and after Prop 209 was implemented. Below,
16

Table 8: Marginal Net Effects of Prop 209on Minority Enrollments in UC System, for1997 Entering Freshman Cohort
Pre-Prop 209 Change
African Americans:Public 0.1608 -0.0109∗∗∗
Private 0.0512 0.0008All 4-Yr Colleges 0.2120 -0.0102∗∗∗
Hispanics:Public 0.1243 -0.0048∗∗∗
Private 0.0322 -0.0007All 4-Yr Colleges 0.1565 -0.0055∗∗∗
Data Source: IPEDS.*** p < 0.01, ** p < 0.05, * p < 0.1. Standarderrors were bootstrapped.
we present evidence that Prop 209 did have a net positive effect on the graduation rates ofminorities within the UC system.
Isolating the net effect of Prop 209 is important for addressing the extent to which reducingthe mismatch of students to colleges based on the former’s academic preparation played a keyrole in the graduation rates of minorities after Prop 209 was implemented. Recall from the Intro-duction that reducing this type of mismatch has been a key argument by proponents for banningaffirmation action in the admissions processes of public universities in California and other states.To examine whether the Prop 209 ban reduced such mismatch, we use these individual-level datato determine how the various UC campuses “converted” the academic preparedness of minor-ity (and non-minority) students into graduations. Interestingly, we find substantial differencesacross campuses in their “production” of graduation rates for students from different parts ofthe distribution of academic preparation. Such differences imply potential gains from bettermatching of students to colleges on academic preparation. We examine the potential sizes ofthese gains and the extent to which they can account for the observed improvements in minor-ity graduation rates under different assumptions about the consequences Prop 209 had for theadmission processes within the UC system.
4.1 Student-level Data for the UC System
The data we use were obtained from the University of California Office of the President(UCOP) under a California Public Records Act request. These data contain information onapplicants, enrollees and graduates of the UC system. Due to confidentiality concerns, someindividual-level information was suppressed. In particular, the UCOP data we were providedhave the following limitations:21
1. The data are aggregated into three year intervals from 1992-2006.21See Antonovics and Sander (2011) for a more detailed discussion of this data set.
17

2. The data provide no information on gender, and race is aggregated into four categories:white, Asian, minority, and other
3. Academic data, such as SAT scores and high school grade point average (GPA), were onlyprovided as categorical variables, rather than the actual scores and GPAs.
Weighed against these limitations is having access to two important pieces of information aboutthe individuals who applied to and possibly enrolled at a UC campus. First, we have informa-tion on every individual who applied to any of the schools in the UC system over the period,including to which campuses they applied and were admitted. As described below, we use thelatter information to adapt a strategy used in Dale and Krueger (2002) in order to account forunmeasured student qualifications. Second, we were provided with access to an index of eachstudent’s preparation for college, given by the sum of a student’s SAT I score, rescaled to bebetween 0 to 600, and his or her high school GPA, rescaled to be between 0 to 400. Below, werefer to this as a student’s high school Academic Index. We have data for the entering cohorts inthe three years prior to the implementation of Prop 209 (1995, 1996 1997), and for three yearsafter its passage (1998, 1999, 2000).
In Table 9, we present summary statistics for the individual-level UCOP data and its measuresof student qualifications by race and for applicants, admits, enrollees and graduates for campusesin the UC system, pre- and post-Prop 209. As already seen with the college-level IPEDS data,minority enrollments at UC campuses declined [“Enrolled” column, Table 9], minority graduationrates improved [“Graduated” column, Table 9] and the proportion of high school graduates thatattained a BA degree declined after Prop 209 went into effect. We find the same trends with theUCOP data as with IPEDS data for the enrollment, graduation and college degree attainmentrates of Whites [Table 9], Others, including the Unknowns [Table 9], and Asian Americans (notshown).
Relative to the number of public high school graduates, minority applications and admissionsto one or more UC campuses also decline after Prop 209 went into effect,22 while there aresmall and statistically insignificant changes in these rates for whites. With respect to academicpreparation (high school Academic Index), minorities had much lower scores at each stage of thecollege process than whites both prior to and after Prop 209 was implemented. This differencein preparation accounts, in part, for the lower proportion of minority high school students beingadmitted to a UC campus (“No. of Obs./No. of HS Grads”) compared to whites. However, afterProp 209 is implemented, the academic preparation of minority applicants, admits, enrollees,and graduates improved, both absolutely and relative to whites. Presumably, this improvementin academic preparation contributed to the higher graduation rates of minorities within the UCsystem after the implementation of Prop 209.
But, there was a notable change in the socioeconomic backgrounds of the minorities thatenrolled at and graduated from a UC campus after Prop 209 went into effect. In particular, therewas significant and sizeable decline in the proportion of minority enrollees and graduates frommore “advantaged” family backgrounds. For example, among admitted minorities who actuallyenrolled at a UC campus, there was an 0.039 reduction (a 10% decline) in the proportion withparents who had a BA degree and a corresponding 0.046 reduction (a 11% decline) among those
22Antonovics and Sander (2011) and Antonovics and Backes (2011) use these data to examine the effects ofProp 209 on minority applications to and admissions at UC campuses, respectively.
18

minorities that graduated from a UC campus after Prop 209 was implemented. Similarly, Post209 a greater share of applicants an admits had parents with incomes above $80,000. Yet, theshare of enrollees whose parental income was greater that $80,000 fell. That is, while minoritiesfrom more advantaged family backgrounds continued to apply and be admitted to UC campusesafter Prop 209 (though the set of UC campuses where they were admitted may have changed),they were less likely to enroll at one of the campuses and less likely to graduate from one ofthem. We are unable to determine whether, after Prop 209, these more advantaged minoritieswho applied and were accepted to a UC campus went to colleges not subject to Prop 209, i.e.,private colleges in California or public or private colleges outside of the state. But we doubtthat they disproportionately ended up at less-selective public colleges in the state, i.e., at CSUcampuses or one of California’s community colleges, or not attending college.
4.2 Net Effect of Prop 209 on UC Graduation Rates
Using the UCOP data, we adapt the (college) graduation decision-rules developed in Section3 to estimate the net impacts of Prop 209 for the UC system. Using the notation of the modelin the Appendix, Vijtr denotes the utility that individual i, from college entry cohort t and ofracial/ethnic group r, receives from graduating from UC campus j and is given by the followingfunction:
Vijtr = φ′0j + φ′
1r + POSTitrφ′2r + Aitrφ
′3 + Xitrφ
′4 + ζ ′itr (1)
where Aitr is student i’s high school academic index, Xitr is the vector of their observed familybackground characteristics, such as parental education, family income, etc., POSTitr is the post-Prop 209 indicator variable, and φ′
0j is a fixed effect for UC campus j. For now, our primaryinterest is in estimating φ′
2r, the effect of Prop 209 on the propensity of race/ethnic group r tograduate from a UC campus net of differences in the academic preparation (Aitr) and familybackground (Xitr). To proceed, let Qijrt denote a 0/1 indicator of whether student i graduatesfrom college and assume that the probability of graduating is given by a linear probability model,i.e.,
Pr(Qijtr = 1|Aitr, POSTitr, Xitr, r, φ′) ≡ P g′(Aitr, POSTitr, Xitr, r, φ
′)= φ′
0j + φ′1r + POSTitrφ
′2r + Aitrφ
′3 + Xitrφ
′4, (2)
where φ′ ≡ ({φ′0k}J
k=1, {φ′1l, φ
′2l}l=m,w,o, φ
′2, φ
′3, φ
′4) and we used ordinary least squares to estimate
φ′. Estimates for this specification are presented below.
While a student’s academic index characterizes two important factors (high school GPA andthe SAT scores) that go into a student’s admission decisions at those UC campuses to which sheapplied, there are other factors that go into these decisions, including letters of recommendation,personal essays, quality of one’s high school and its curriculum, that are not included in theUCOP data. But, as has been noted in the literature on the effects of graduating from aselective university (Black, Daniel, and Smith, 2001; Dale and Krueger, 2002; Black and Smith,2004; Hoxby, 2009) failure to control for the full set of criteria used in admissions decisions arelikely to result in biased estimates of the effects of attending more-selective colleges – or, inour case, of Prop 209 – on the likelihood of graduating and other subsequent outcomes (e.g.,earnings). To help mitigate this source of selection bias, we implement a modified version ofthe selection correction method of Dale and Krueger (2002), using information in the UCOP
19

Tab
le9:
Cha
ract
eris
tics
ofU
CA
pplic
ants
,A
dmit
s,an
dE
nrol
lees
byR
ace,
Pre
-Pro
p20
9an
dC
hang
ePos
tP
rop
209†
App
lied
Adm
itte
dE
nrol
led
Gra
duat
edP
re-
Pre
-P
re-
Pre
-P
rop
209
Cha
nge
Pro
p20
9C
hang
eP
rop
209
Cha
nge
Pro
p20
9C
hang
eU
nder
-rep
rese
nted
Min
oritie
s:H
igh
Scho
olA
cad.
Inde
x61
9.7
14.7
∗∗∗
645.
717
.2∗∗
∗64
1.5
15.6
∗∗∗
653.
712
.4∗∗
∗
Par
ents
have
BA
0.36
90.
004
0.38
1-0
.014
∗∗∗
0.38
5-0
.039
∗∗∗
0.41
7-0
.046
∗∗∗
Par
ents
’In
com
e≤
$30K
0.37
9-0
.019
∗∗∗
0.36
4-0
.008
∗0.
364
0.00
80.
334
0.01
2Par
ents
’In
com
e≥
$80K
0.19
50.
015∗
∗∗0.
203
0.00
9∗∗
0.21
1-0
.010
∗0.
238
-0.0
18∗∗
∗
Gra
duat
ion
Rat
e0.
624
0.04
4∗∗∗
No.
ofO
bser
vati
ons
30,9
112,
511
24,3
32-4
7013
,278
-707
8,19
892
No.
ofO
bs./
No.
ofH
SG
rads
0.10
7-0
.011
∗∗∗
0.08
4-0
.016
∗∗∗
0.04
6-0
.010
∗∗∗
0.02
8-0
.005
∗
Whi
tes:
Hig
hSc
hool
Aca
d.In
dex
710.
411
.1∗∗
∗72
9.8
8.8∗
∗∗72
2.6
13.3
∗∗∗
730.
712
.4∗∗
∗
Par
ents
have
BA
0.80
1-0
.002
0.81
3-0
.010
∗∗∗
0.80
5-0
.008
∗∗0.
822
-0.0
08∗∗
Par
ents
’In
com
e≤
$30K
0.10
3-0
.008
∗∗∗
0.10
1-0
.006
∗∗∗
0.10
9-0
.006
∗∗∗
0.10
0-0
.006
∗
Par
ents
’In
com
e≥
$80K
0.52
80.
019∗
∗∗0.
533
0.01
3∗∗∗
0.52
50.
015∗
∗∗0.
540
0.01
6∗∗∗
Gra
duat
ion
Rat
e0.
769
0.02
5∗∗∗
No.
ofO
bser
vati
ons
67,7
818,
202
54,4
804,
385
27,6
171,
945
20,7
702,
211
No.
ofO
bs./
No.
ofH
SG
rads
0.18
70.
003
0.15
0-0
.003
0.07
6-0
.002
0.05
70.
000
Oth
ers,
incl
udin
gU
nkno
wns
:H
igh
Scho
olA
cad.
Inde
x71
9.3
-2.6
∗∗74
1.3
-2.8
∗∗73
1.2
2.0
741.
61.
1Par
ents
have
BA
0.74
50.
018∗
∗∗0.
765
0.01
00.
751
0.01
00.
769
0.00
9Par
ents
’In
com
e≤
$30K
0.19
5-0
.013
∗∗0.
186
-0.0
080.
203
-0.0
100.
184
-0.0
04Par
ents
’In
com
e≥
$80K
0.40
20.
044∗
∗∗0.
413
0.03
4∗∗∗
0.38
40.
047∗
∗∗0.
409
0.04
0∗∗∗
Gra
duat
ion
Rat
e0.
741
0.01
5∗
No.
ofO
bser
vati
ons
10,1
4312
,161
8,23
18,
810
4,12
94,
693
3,08
13,
622
***
p<
0.0
1;**
p<
0.0
5;*
p<
0.1
.D
ata
Sourc
e:U
CO
Pin
div
idualdata
,P
re-P
rop
209
(1995-9
7);
Post
-Pro
p209
(1998-2
000).
Vari
able
s:N
o.
of
Obs
erva
tions
isth
eto
tal
num
ber
of
studen
tsw
ho
engaged
inact
ivity
indic
ate
din
colu
mn
hea
din
g;
No.
of
Obs
./N
o.
of
HS
Gra
ds
isra
tio
of
aco
lum
n’s
No.
of
Obse
rvati
ons
toth
enum
ber
of
public
hig
hsc
hool
gra
duate
sper
yea
rin
Califo
rnia
;G
raduation
Rate
issh
are
of
enro
lled
studen
tsth
at
gra
duate
din
5yea
rsor
less
;H
igh
Sch
oolAca
d.
Index
issu
mof
re-s
cale
dst
uden
t’s
SA
TI
score
(0to
600
scale
)plu
sre
-sca
led
studen
t’s
UC
-adju
sted
hig
hsc
hoolG
PA
(0to
400
scale
);Pare
nts
have
BA
isin
dic
ato
rva
riable
ofw
het
her
studen
thas
at
least
one
pare
nt
wit
hB
ach
elor
Deg
ree
or
more
;Pare
nts
’In
com
e≤
$30K
isin
dic
ato
rva
riable
for
whet
her
pare
nts
’annualin
com
eis≤
$30,0
00,w
her
eP
re-P
rop
209
inco
me
are
inflati
on-a
dju
sted
toPost
-Pro
p209
level
s;Pare
nts
’In
com
e≥
$80K
isco
rres
pondin
gva
riable
whet
her
pare
nts
’annualin
com
eis≥
$80,0
00;and
wher
eG
raduate
dden
ote
sth
ose
who
gra
duate
din
5yea
rsor
less
.†D
escr
ipti
ve
stati
stic
sfo
rA
sian
Am
eric
ans
are
om
itte
dfr
om
table
,but
are
available
from
the
auth
ors
upon
reques
t.
20

data on the selectivity of the UC campuses to which students were admitted as a proxy for theirunmeasured qualifications for college.
Following Dale and Krueger (2002), we construct the following set of dummy variables thatmeasure the selectivity of the UC campuses to which a given student was admitted. The UCcampuses were ranked from most selective to least selective based on the U.S. News & WorldReport Top 50 University rankings for 1997. Recall that this ranking of the 8 UC campuses(with a campus’s rank in parentheses) was: UC Berkeley (27); UCLA (31); UC San Diego (34);UC Irvine (37); UC Davis (40); UC Santa Barbara (47); UC Santa Cruz (NR); and UC Riverside(NR). The first dummy variable was set equal to 1 for all the students that were admitted atUC Berkeley (the most selective) and 0 otherwise. The second dummy was set equal to 1 for allstudents admitted at UC Berkeley and/or UCLA and 0 otherwise. We continue creating dummyvariablies in this way, with the final one set equal to 1 for students that were admitted to one ormore campus that was at least as selective as UC Santa Cruz, the second-least selective schoolin our data. More formally, denote aijrt = 1 if individual i of group r at time t was admittedto a school at least as good as j, with aijtr = 0 otherwise. Denote the resulting vector asaitr ≡ (ai1rt, ai2rt, ..., ai7rt).
To implement the selection-correction method exactly as Dale and Krueger did in their study,one would estimate the following specification of the (linear) probability model of graduatingfrom a UC campus that includes aitr:
P g∗(Aitr, Xitr, aitr, POSTitr, r, φ∗) = φ∗
0j + φ∗1r + POSTitrφ
∗2r + Aitrφ
∗3 + Xitrφ
∗4 +
7∑j=1
aijtrφ∗5j (3)
However, resulting estimates of the parameters in (3), especially φ∗2r, still are likely to be biased
because, unlike the case considered in Dale and Krueger (2002), the admissions processes ofcampuses were required to change under Prop 209. In particular, Prop 209 required that aperson’s race or ethnicity could no longer be used as a criteria for admission at any UC campus.As a result, the probability that a minority applicant, with a given set of non-race/ethnicityqualifications, was admitted to a UC campus, especially highly selective ones, was likely to havechanged with the implementation of Prop 209. Based on the selectivity of the UC campusesto which a minority was admitted measured by aitr, it will appear as though minorities pre-Prop 209 were stronger than those post-Prop 209 because more minorities were admitted to themore-selective UC campuses based on their race/ethnicity prior to Prop 209 than after it wasimplemented.
To account for this problem, we adjust the Dale and Krueger (2002) method in the followingway. First, we run the regression in (3) and retrieve the Dale and Krueger “index” of collegepreparedness,
∑7j=1 aijtrφ5j , for each student that enrolled at a UC campus. We then regress
these indices on a student’s family background characteristics, Xitr, and the dummy indicatorof whether the student was a post-Prop 209 enrollee, allowing the effect of the latter variable todiffer by race/ethnicity. That is:
7∑j=1
aijtrφ5j = POSTitrθ1r + Xitrθ2 + ηitr (4)
We then attempt to purge any post-Prop 209 differences in the Dale and Krueger index by
21

forming the adjusted residuals from the regression in (4), i.e.,
Γitr =7∑
j=1
aijtrφ5j − POSTitrθ1r, (5)
and then estimate the following adaption of the specification in (2):
P g(Aitr, Xitr, Γitr, POSTitr, r, φ) = φ0j + φ1r + POSTitrφ2r + Aitrφ3 + Xitrφ4 + Γitr (6)
where φ ≡ ({φ0k}Jk=1, {φ1l, φ2l}l=m,w,o, φ2, φ3, φ4). Estimates for this adaptation of Dale and
Krueger also are presented below.
Results for all specifications are given in Table 10. Column (1) presents estimates of thechanges in graduation rates, post-Prop 209, for the various race/ethnic groups with no adjust-ments for students’ academic qualifications or background. Column (2) presents estimates thatcontrol for observable measures of preparation and background as in (1), while column (3) dis-plays estimates that also controls for the “corrected” version of the Dale and Krueger index ofunobserved academic qualifications. Without any adjustments [column (1)], graduation rates forminorities in the UC system increased by 4.4% (= 0.025 + 0.019) for a 7.1% improvement overthis group’s pre-Prop 209 graduation rates. Controlling for observed measures of preparednessand family background [Column (2)] result in only a small decline in the post-Prop 209 improve-ment in minority graduation rates to 4.3% (= 0.017 + 0.026). Once we control for the correctedDale and Krueger index [column (3)], the estimated net effect of Prop 209 falls to 3.1% (= 0.013+ 0.018), for 5% improvement over pre-Prop 209 graduation rates. The size of this net effect ofProp 209 is equivalent to a 0.5 standard deviation increase in the student’s academic index.23
Furthermore, the positive effects are significantly stronger for minorities, suggesting the possi-bility of improved school matches for this group. In the next section, we more closely examinewhether matching was the mechanism for the improvements in minority graduation rates.
4.3 Differences across UC Campuses in “Production” of Graduation Rates
In order to assess the role that changes in student-campus matching on student preparationmay have had in the net improvement in minority graduation rates that accompanied Prop 209,we begin by examining, in Table 10, the distribution of academic preparation and graduationrates across the UC campuses for minorities and whites, respectively. The campuses are listedin order of their U.S. News & World Report ranking. Focusing initially on the pre-Prop 209tabulations, one sees that the academic index and graduation rates are systematically relatedto the rankings of UC campuses, with more-selective campuses having students that are betterprepared and more likely to graduate. This is true for minorities and for whites. And, consistentwith the tabulations in Table 9, whites have higher academic indices and graduation rates thando minorities, a pattern that holds campus-by-campus.
Somewhat more surprising are the across-campus patterns in the post-Prop 209 changes instudent preparedness and graduation rates found in Table 10. In particular, the post-Prop 209changes in preparedness and graduations are not systematically related to the selectivity of the
23Such an increase in a student’s academic index could be achieved, for example, by a 50 point increase in thestudent’s verbal or math section of the SAT.
22
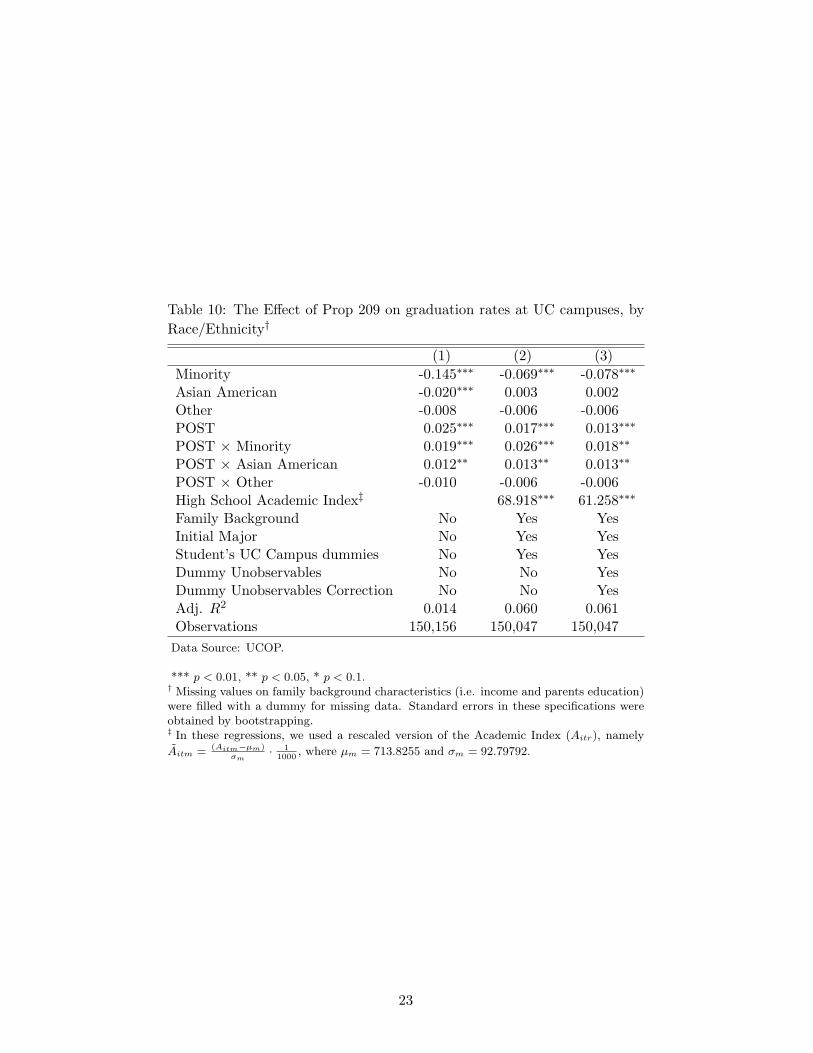
Table 10: The Effect of Prop 209 on graduation rates at UC campuses, byRace/Ethnicity†
(1) (2) (3)Minority -0.145∗∗∗ -0.069∗∗∗ -0.078∗∗∗
Asian American -0.020∗∗∗ 0.003 0.002Other -0.008 -0.006 -0.006POST 0.025∗∗∗ 0.017∗∗∗ 0.013∗∗∗
POST × Minority 0.019∗∗∗ 0.026∗∗∗ 0.018∗∗
POST × Asian American 0.012∗∗ 0.013∗∗ 0.013∗∗
POST × Other -0.010 -0.006 -0.006High School Academic Index‡ 68.918∗∗∗ 61.258∗∗∗
Family Background No Yes YesInitial Major No Yes YesStudent’s UC Campus dummies No Yes YesDummy Unobservables No No YesDummy Unobservables Correction No No YesAdj. R2 0.014 0.060 0.061Observations 150,156 150,047 150,047
Data Source: UCOP.
*** p < 0.01, ** p < 0.05, * p < 0.1.† Missing values on family background characteristics (i.e. income and parents education)were filled with a dummy for missing data. Standard errors in these specifications wereobtained by bootstrapping.‡ In these regressions, we used a rescaled version of the Academic Index (Aitr), namely
Aitm = (Aitm−µm)σm
· 11000
, where µm = 713.8255 and σm = 92.79792.
23

various campuses. For example, UC Santa Barbara had the largest post-Prop 209 improvementsin student academic preparedness and graduation rates, even though it ranked sixth out of theeight UC campuses in the U.S. News & World Report rankings. Furthermore, UC Berkeley andUC Riverside, which were the top and bottom ranked UC campuses, were both in the bottomthird of post-Prop 209 gains in minority academic preparedness and graduation rates. Finally,while the magnitudes of the post-Prop 209 gains in academic preparation and graduation ratesof whites displayed in Table 10 differ from those for minorities, the pattern of their distributionsacross the UC campuses is remarkably similar.
What accounts for the unequal distribution of post-Prop 209 changes in academic prepared-ness and gains in graduation rates across the UC campuses? Consistent with the matching storycited earlier, campuses may differ in their institutional ability to graduate students of differingpreparedness and that the implementation of Prop 209 led to a sorting of students across cam-puses based on these differences. But, there are other possible explanations. For example, thedistribution of students may have changed across the campuses due to temporal changes in thepopularity of particular majors, e.g., pre-med or engineering. Or, the number and backgroundsof students that enrolled at various campuses after Prop 209 was implemented may have beenaffected by other institutional changes, including differential growth across campuses, over thisperiod that had nothing to do with Prop 209.24
To better isolate the potential importance of student-campus matching we estimated a variantof the graduation choice model in (6) that allows campuses to differ in their conversion of differentdegrees of academic preparation to the probability of graduating. In particular, the probabilityof graduation from campus j is:
P gj (Aitr, Xitr, Γitr, POSTitr, φr) = φ0jr + φ1r + POSTitrφ2r + Aitrφ3jr + Xitrφ4r + Γitr (7)
where φr ≡ ({φ0kr}Jk=1, φ1r, φ2r, {φ3kr}J
k=1, φ4r). This specification allows variation across cam-puses in the graduation rates of students with different academic preparations.25 For example,those campuses with a comparative advantage at preparing less academically prepared minority(or non-minority) students for graduation would have high values of φ0jr and low values of φ3jr.Since we are primarily interested in the matching of underrepresented minority students, in thissection we only report results for this group of UC enrollees.
Estimates of the UC campus-specific intercepts and coefficients on the academic index vari-able are given in Table 12.26 Based on these estimates, we can decisively reject that all of the
24For example, UC Riverside’s undergraduate program grew by over 56% from 1995 to 2001, while enrollmentsat UC Berkeley, UCLA and UC Santa Barbara hardly changed at all over the same period. All of these changeswere part of the University of California’s master enrollment plan that had been in place well in advance of Prop209.
25The specification in (7) assumes that Prop 209 has no differential effect on graduation probabilities across UCcampuses except through the assignment rules. To test this, we estimated the following version of (7)
P g∗j (Aitr, Xitr, Γitr, POSTitr, r, φ
∗) = φ∗0jr + φ1r + POSTitrφ∗2jrAitrφ
∗3jr + AitrPOSTα∗
jr + Xitrφ∗4r + Γitr
that allowed for post-Prop 209 differences in baseline graduation rates by race/ethnicity and and in each campus’sconversion of student preparation (Aitr) to graduation rates. We could not reject the hypothesis, φ∗2jr = φ2r, ∀j,and α∗
jr = 0, ∀j, r, i.e., we found no evidence that campuses changed their treatment of students after Prop 209went into effect that affected their chances of graduating.
26We also estimated (7) with data for the other demographic groups. While the campus-specific interceptsand coefficients differed across groups, the relative rankings of the coefficients by campus were similar across allrace/ethnic groups.
24

Tab
le11
:H
igh
Scho
olA
cade
mic
Inde
xan
dC
olle
geG
radu
atio
nR
ates
byU
Cca
mpu
sfo
rM
inor
itie
s&
Whi
tes,
Pre
Pos
tP
rop
209
&C
hang
ePos
tP
rop
209
Min
orit
ies
Whi
tes
Aca
d.In
dex
Gra
d.R
ate
Aca
d.In
dex
Gra
d.R
ate
Pre
Pre
Pre
Pre
Cam
pus‡
Pro
p20
9C
hang
eP
rop
209
Cha
nge
Pro
p20
9C
hang
eP
rop
209
Cha
nge
UC
Ber
kele
y67
915
0.67
50.
030
794
50.
847
0.02
6U
CU
CLA
674
290.
656
0.05
776
619
0.83
90.
036
UC
San
Die
go68
141
0.66
10.
061
760
130.
826
-0.0
05U
CIr
vine
621
330.
626
0.03
969
38
0.68
50.
047
UC
Dav
is63
712
0.54
00.
091
721
20.
776
0.00
9U
CSa
nta
Bar
bara
605
440.
599
0.10
468
235
0.74
30.
054
UC
Sant
aC
ruz
590
290.
598
0.04
468
34
0.68
80.
033
UC
Riv
ersi
de58
214
0.58
30.
005
669
-10.
636
-0.0
14D
ata
Sourc
e:U
CO
P.
‡C
am
puse
sare
list
edin
ord
erofth
eir
rankin
gin
the
1997
U.S
.N
ews
&W
orld
Rep
ort
Top
50
Nati
onalU
niv
ersi
ties
.
25

Table 12: Graduation Estimates of UCCampus-Specific Intercepts and Academic In-dex Slopes†
AcademicCampus Intercept Index§
UC Berkeley -0.387*** 0.513***UCLA -0.504*** 0.723***UC San Diego -0.265** 0.388**UC Irvine -0.187* 0.272*UC Davis -0.523*** 0.692***UC Santa Barbara -0.122 0.223UC Santa Cruz -0.002 -0.016
Data Source: UCOP.*** p < 0.01, ** p < 0.05, * p < 0.1.† Estimated on UCOP data for pre- and post-Prop209 minority UC enrollees. (N = 23,177). The esti-mated coefficient on the Academic Index variable (seebelow) was 32.703∗∗∗ and estimated overall interceptwas 0.681∗∗∗.§ In this regression, we used a rescaled version of theAcademic Index (Aitr), namely Aitm = (Aitm−µm)
σm·
11000
, where µm = 713.8255 and σm = 92.79792.
UC campuses have the same baseline graduation rates (i.e., that φ0jr = 0 ∀j) or the same ratesof converting student academic preparation into graduations (i.e., that φ3jr = 0 ∀j). The rel-ative magnitudes of φ0jrs and φ3jrs across the UC campuses are correlated with their degreeof selectivity. Namely, the correlation coefficient for the institution-specific intercepts and theaverage minority academic index for the institution is -0.79 with the correlation coefficient forthe slope and minority academic index being 0.80. Hence, more (less) selective schools have acomparative advantage in graduating better (worse) prepared students.
To better illustrate the student-campus sorting implied by the estimates in Table 12, weused the parameter estimates in Table 12 to predict campus-specific graduation probabilitiesfor minority students from different parts of the academic index distribution. More formally,we calculated the following predicted graduation probabilities for hypothetical student h withacademic preparation As:
P gk (As, Xh, Γh, POSTh, φm) = φ0km + φ1m + POSThφ2m + Asφ3km + Xhφ4m + Γh (8)
where As is the cutoff value for sth percentile of the minority distribution of A, and where theseprobabilities were evaluated for each UC campus k = 1, ..., J , for various values of As, at thevalues of (X, Γ, POST ) for the members of the minority (r = m) sample of UC enrollees. Therankings of the UC campuses for each percentile are based on the means of the appropriatepredicted graduation.
The rankings of UC campuses by their predicted minority graduation rates are displayed inTable 13. Several patterns emerge from this Table. First, the rankings of campuses in terms oftheir graduation rate productivity differ across the academic index distribution. (This is consis-tent with the across-campus differences in the estimates of φ0jrs and φ3jrs in Table 12.) Second,some of the UC campuses appear to have absolute advantage (or disadvantage) in producing high
26

graduation rates across the distribution of student preparedness, while others have a compara-tive advantage (or disadvantage) in producing graduations with students of differing academicpreparations. For example, UC Santa Barbara is predicted to produce among the highest, if notthe highest, minority graduation rates at each part of the academic index distribution, whereas,somewhat surprisingly, UC Berkeley would produce among the lowest. Alternatively, UCLA,the second-most selective UC campus, is predicted to produce relatively low graduation ratesfor less-prepared students but is one of the best campuses at producing high graduation ratesamong the best-prepared minorities. In contrast, UC Santa Cruz and UC Riverside, the twoleast-selective UC campuses, appear to have comparative advantages in graduating less-preparedminorities but not better-prepared ones.
4.4 Can (and Did) Re-Allocating Students across Campuses Improve Minor-ity Graduation Rates?
As documented in the preceding section, UC campuses differed in their “productivity”of graduating students from differing academic backgrounds. Moreover, it appears that less-selective campuses had either absolute productivity advantages in producing higher graduationrates among all students or had comparative ones with less prepared students. We also havedocumented [Table 6] that minority enrollments increased at the less-selective UC campuses af-ter Prop 209, while more-selective ones lost minority enrollments. Finally, we found that Prop209 did result in higher minority graduation rates [Table 10], even after we netted out the effectsof changes in the academic and parental backgrounds of minorities that accompanied Prop 209.So, to what extent were these Prop 209 gains in minority graduation rates the result of betterstudent-campus matching based on academic preparation that many proponents of banning theuse of affirmative action in college admissions claim will result from such bans? And, more gen-erally, to what extent can re-allocating students across campuses improve minority graduationrates?
In this section we attempt to provide partial answers to these questions. We do so by exam-ining the consequences for minority graduation rates from using several “rules” for allocating,or assigning, students across the UC campuses. The assignment rules we consider either cap-ture how minorities (and non-minorities) were allocated across the UC campuses under Prop209 or provide a quantitative benchmark for how much student-campus matching on academicpreparation could have changed minority graduation rates. To avoid confounding the effect ofre-allocating students across campuses with those from changes in the composition of minor-ity enrollees that occurred with Prop 209, we use the same “population” of minority students,namely those who enrolled at a UC campus prior to Prop 209, calculating the campus assign-ments and implied graduation rates under each rule.
We consider the following three rules for assigning minority students across the UC campuses:
AR1: Assign students to the campus that maximizes their probability of graduating
AR2: Assign students to campuses following (implicit) rule used to assign minorities post-Prop209
AR3: Assign students to campuses following (implicit) rule used to assign whites post-Prop 209
27

Tab
le13
:R
anki
ngs
ofU
CSc
hool
sby
Pre
dict
edG
radu
atio
nR
ates
atV
ario
usPer
cent
iles
ofth
eH
igh
Scho
olA
cade
mic
Inde
xPer
cent
iles
base
don
Min
ority
Coe
ffici
ents
Est
imat
es†
Per
cent
ileof
the
Min
ority
Aca
dem
icIn
dex
10th
25th
50th
75th
90th
UC
Riv
ersi
de(0
.603
)U
CSa
nta
Bar
bara
(0.6
28)
UC
Sant
aB
arba
ra(0
.671
)U
CSa
nta
Bar
bara
(0.7
15)
UC
LA
(0.7
56)
UC
Sant
aC
ruz
(0.5
94)
UC
Riv
ersi
de(0
.627
)U
CR
iver
side
(0.6
53)
UC
San
Die
go(0
.689
)U
CSa
nta
Bar
bara
(0.7
53)
UC
Sant
aB
arba
ra(0
.590
)U
CSa
nta
Cru
z(0
.616
)U
CSa
nta
Cru
z(0
.642
)U
CIr
vine
(0.6
85)
UC
San
Die
go(0
.738
)U
CIr
vine
(0.5
49)
UC
Irvi
ne(0
.590
)U
CIr
vine
(0.6
37)
UC
LA
(0.6
85)
UC
Irvi
ne(0
.726
)U
CSa
nD
iego
(0.5
27)
UC
San
Die
go(0
.577
)U
CSa
nD
iego
(0.6
32)
UC
Riv
ersi
de(0
.680
)U
CD
avis
(0.7
13)
UC
Ber
kele
y(0
.466
)U
CB
erke
ley
(0.5
23)
UC
LA
(0.6
03)
UC
Sant
aC
ruz
(0.6
67)
UC
Ber
kele
y(0
.711
)U
CLA
(0.4
50)
UC
LA
(0.5
22)
UC
Ber
kele
y(0
.589
)U
CB
erke
ley
(0.6
54)
UC
Riv
ersi
de(0
.703
)U
CD
avis
(0.4
16)
UC
Dav
is(0
.486
)U
CD
avis
(0.5
64)
UC
Dav
is(0
.644
)U
CSa
nta
Cru
z(0
.690
)D
ata
Sourc
e:U
CO
P.
†A
ver
age
pre
dic
ted
gra
duati
on
pro
babilit
ies
inpare
nth
eses
.T
he
pre
dic
ted
pro
babilit
ies
wer
efo
rmed
usi
ng
the
esti
mate
dco
effici
ents
for
spec
ifica
tion
(7)
for
min
ori
ties
and
wer
epre
dic
ted
usi
ng
the
chara
cter
isti
csofm
inori
tyst
uden
tsth
at
enro
lled
at
one
ofth
eU
Cca
mpuse
sin
the
yea
rs1995-2
001.
28

The first assignment rule (AR1) focuses exclusively on achieving high graduation rates, providingthe benchmark for the potential impact of student-campus matching on academic preparation.To operationalize AR1, we use the predicted graduation probabilities for minority student hgiven in (8) to assign her to that UC campus that yields the highest probability that she willgraduate. Let that school be denoted by jmax, and the graduation probability associated withit is P g
jmax(Ah, Xh, Γh, POSTh, φm). As noted above, we evaluate these graduation probabilitiesfor the sample of pre-Prop 209 (POST = 1) minority (r = m) UC enrollees.
The second assignment rule, AR2, characterizes how minorities were allocated across the UCcampuses after Prop 209 went into effect. We also investigate a third assignment rule (AR3) thatcharacterizes what would have happened to minority graduation rates if minority students hadbeen allocated across the UC campuses as whites were after Prop 209. While Prop 209 stipulatedthat California’s public universities could not use race or ethnicity as a criteria for admission,this does not imply that the post-Prop 209 across-campus assignment rules for the enrollmentof minorities and whites will necessarily be the same. Minorities and whites may have differedin their preferences for attending a particular campus and/or differed in their in-state privateand out-of-state college alternatives. Furthermore, in contrast to AR1, neither AR2 or AR3 isinsured, by design, to improve the graduation rates of enrolled students. Comparing the resultsfor AR2 and AR3 helps one assess the importance these other factors might play in minoritygraduation rates.
To operationalize AR2 and AR3, we estimated a multinomial logit model of the UC campusthat students actually attended for each of two samples: post-Prop 209 minority UC enrollees forAR2 and post-Prop 209 white UC enrollees for AR3. The probability of choosing a given campusis a function of the same measures of student academic preparedness, A, and family background,X, used in the estimation of the campus-specific graduation model presented above. Let πARn,n = 2, 3, denote the estimated parameter vectors for the UC campus enrollment models for thesamples corresponding to assignment rules AR2 and AR3, respectively. The predicted probabilityof being assigned to UC campus j under assignment rule ARn is given by:
P aj (Ah, Xh, πARn) =
exp(AhπARn1j + XhπARn
2j )∑Jk=1 exp(AhπARn
1k + XhπARn2k )
(9)
for n = 2, 3. As with the graduation probabilities evaluated under AR1, we evaluate theseassignment probabilities at the characteristics of the pre-Prop 209 UC minority enrollees. Finally,the graduation probabilities associated with these two assignment rules are weighted averages ofthe predicted graduation probabilities for the UC campuses, using the rule-specific assignmentprobabilities in (9) as weights, i.e.:
P gARn(Ah, Xh, Γh, POSTh, φm, πARn) ≡
J∑k=1
P gk (Ah, Xh, Γh, POSTh, φm)P a
k (Ah, Xh, πARn) (10)
for n = 2, 3.
The estimated minority graduation rates for the three assignment rules are recorded at the topof Table 14, along with the actual graduation rates for the pre-Prop 209 minority UC enrollees.As noted above, we used the characteristics of the latter group of minorities to generate thepredictions associated with each of the assignment rules to facilitate comparisons.27 For both
27While not presented, we also evaluated AR1, along with AR2 and AR3, on the post-Prop 209 minority UCenrollees and the pre- and post-Prop 209 white UC enrollees.
29

the observed rates and those predicted under each of the three assignment rules, we displaythe (overall) mean graduation rate and those for the deciles of the minority academic indexdistribution. The mean graduation rate observed for the pre-Prop 209 minority enrollees is0.624 and ranges from just below 50% for minorities in the bottom decile of the Academic Indexdistribution to over 78% for the top decile. The graduation rates predicted for assignment ruleAR1 are higher than the actual rates at each decile of the academic preparedness distribution.The same is true for those in the bottom half of this distribution under AR2 and AR3.
To better gauge the predicted changes in graduation rates relative to the pre-Prop 209 ones,we present, in rows (A), (B) and (C) of Table 14, the differences between the predicted graduationrates and the pre-Prop 209 observed rates. Below the labeled rows in this table, we express thesedifferences as a percentage of the observed minority graduation rates and, where appropriate, asa percent of the difference between the predicted rates for AR1 and the actual ones.
The average maximum possible improvement in minority graduation rates through matchingunder AR1 is 0.046, which is a 7.3% improvement over pre-Prop 209 minority graduation rates.This average masks more sizeable predicted gains across the distribution of minority academicpreparedness. In particular, minorities in the bottom half of the academic index distributionwould experience an improvement in graduation rates of almost 11% if students were re-allocatedaccording to AR1. At the same time, the sizes of these gains suggest there are limits to whatcan be achieved via better matching, an issue to which we return below.
What would the re-allocation of minority students across the UC campuses under AR1 looklike and how big a change would it be to the pre-Prop 209 distribution? We present, in Table 15,tabulations of the shares of minorities that would be assigned to each of the eight UC campusesunder the three assignment rules, as well as the actual shares of minorities that enrolled atthese campuses prior to Prop 209. Prior to Prop 209 minorities were disproportionately enrolledat the more-selective UC campuses. Almost one-half of them were at the three most selectivecampuses, UC Berkeley, UCLA and UC San Diego, with UC Berkeley and UCLA having thetwo largest shares. At the same time, UC Santa Barbara had a sizeable share (14.3%) of theminorities enrolled in the UC system prior to Prop 209. Under AR1, the allocation of minoritieswould change dramatically [columns under (A)]. In particular, almost 75% of them would beenrolled at UC Santa Barbara, with the remaining 15.8% and 9.4%, enrolling at UC Riverside andUCLA, respectively. No minorities would enroll at any of the other campuses. Recall that UCSanta Barbara appeared to have an absolute advantage in converting minority enrollments intograduations. This advantage is exploited under AR1 and is manifest in the improved graduationrates, especially for academically less-prepared minorities, displayed in Table 14.
In row (B) of Table 14 we display the changes in minority graduation rates that would haveoccurred if the pre-Prop 209 cohorts of UC enrollees would have sorted themselves across theUC campuses in the manner that minorities did after Prop 209 (AR2). Note that this is acounterfactual evaluation, since we know that the characteristics of the minorities that enrolledwithin the UC system after Prop 209 did change [Table 9]. We find an average improvement of0.009 in minority graduation rates, a 1.4% improvement over pre-Prop 209 rates. The magnitudesof the gains in minority graduation rates from the re-allocation under AR2 are modest, but higherfor the bottom half of the academic preparedness distribution where minority graduation rateswould improve by 3.7%. The AR2 allocation achieves 19.1% of the maximum attainable gainsassociated with AR1 [row (A)]. (It would achieve more of the maximum possible gains for thebottom part of the preparedness distribution, accounting for 35% of this possible gain for those
30

in the bottom half of the distribution.)
We next examine how much of the 0.031 net effect of Prop 209 on minority graduation ratespresented above [Table 10] can be accounted for by the post-Prop 209 re-allocation of minoritystudents. In the third row under row (A), we see that this re-allocation would account for 28% ofthe overall estimated net gain from Prop 209, while the share is almost 67% of this average netgain among those in the lower half of the academic preparedness distribution. Thus, while otherfactors were at play, the net impact of Prop 209 on minority graduation rates, the re-allocationof students across campuses was a contributor, especially for those with less preparation.
A look at the two columns under (B) of Table 15 shows how AR2 re-allocated studentsacross the UC campuses. While obviously less dramatic than the re-allocation associated withAR1, we predict that the pre-Prop 209 UC enrollees would have been reallocated from the threemost-selective UC campuses (UC Berkeley, UCLA and UC San Diego) to the less-selective ones(UC Riverside and UC Santa Cruz). In contrast to the re-allocation under AR1, only a modestshare of the minorities would be re-allocated to UC Santa Barbara under AR2, the UC campusthat we found had an absolute advantage at graduating its minority students.
Finally, we examine what would have happened to minority graduation rates after Prop 209was implemented if minorities had been assigned to UC campuses in the same way that whiteswere. In row (C) of Table 14 we present the graduation rates associated with this counterfactualchange in assignment rules (AR3). On average, minorities would have done better under AR3than under AR2, although the difference in the average graduation rates is only 0.003 [= 0.0012- 0.0009]. Under the white post-Prop 209 rule, minorities would have attained over 25% of themaximum possible gain from re-allocation of students across campuses. Moveover, under thewhite assignment rule, the gains in graduation rates would have been even greater than theminority assignment rule generated for those in the bottom half of the academic preparednessdistribution.
What about the re-allocation of students under AR3 would have produced these graduationgains for minorities? Comparing the AR3 re-allocation in the columns under (C) of Table 15 withthose for AR2 in the columns under (B), we see that the post-Prop 209 assignment rule for whiteseven more dramatically moved students out of the most-selective campuses than did AR2 and,importantly, re-allocated many more of them to UC Santa Barbara, the most productive campusfor producing graduation rates for students of all levels of academic preparation. As we notedabove, Prop 209 does not require that minority and non-minorities have the same enrollmentrules. Furthermore, our analysis does not imply that any of the UC campuses, especially themore-selective ones, circumvented Prop 209 in their admissions procedures. While beyond thescope of this paper, it is entirely possible, and likely, that there are racial and ethnic differencesin geographical preferences for the college one attends or in the sets and types of colleges, in-stateor out-of-state, to which they are admitted. Finally, minorities may have less information abouttheir likelihood of graduating from a more-selective college than whites.28 Any or all of thesefactors may account for why minorities and whites ended up attending different campuses withinthe UC system.
At the beginning of this section, we posed two questions. With regard to the first one – did28See Arcidiacono, Aucejo, Fang, and Spenner (2011) for conditions under which minorities may be worse
of under affirmative action. The argument hinges on schools having private information about the student’sprobability of success.
31

better student-campus matching on academic preparation account for the net effect Prop 209 hadon minority graduation rates – the answer is: “yes somewhat.” We found that the assignmentrule that mimiced what minorities did after Prop 209 was implemented (AR2) accounted for28% of our estimated net effect of Prop 209 on minority graduation rates and almost 67% forthe bottom part of the preparedness distribution. As noted above, there are a range of otherfactors that also may have played a role. With regard to the second question – what was thescope for better matching to improve minority graduation rates – our findings indicate limits tohow much this mechanism can improve minority graduation rates, regardless of whether it comesabout via an affirmative action ban or by some other means. The only exception we would maketo this conclusion is for less-prepared minority students, who we estimate would realize muchlarger improvements in graduation rates via better matching. This finding is of great policyrelevance, since less-prepared minorities disproportionately lost enrollments after Prop 209 wasimplemented.
More generally, finding ways – even limited ones – to improve the graduation rates of mi-norities is of growing importance, given the increasing penalties to not having a college degree.These penalties apply not only to those who do not attend college but also to those who dobut do not graduate. Consider, for example, the disparity in labor market earnings betweenthose who attend but do not graduate from college and those that do. Based on data fromthe 2008-2010 waves of the American Community Survey (ACS), we estimate that the annualearnings of African American men who completed their BA degree is 47.1% higher than for thosewho attended but did not graduate from college. The corresponding differentials are even largerfor African American women (51.1%) and sizeable for both Hispanic men (36.1%) and women(41.1%).29
29By way of comparison, the corresponding differentials are 46.5% for white men and 43.0% for white women.
32

Tab
le14
:M
inor
ity
Gra
duat
ion
Rat
esw
ithi
nU
CSy
stem
byA
cade
mic
Pre
para
tion
,P
re-P
rop
209
&un
der
Alt
erna
tive
Pos
t-P
rop
209
Cam
pus
Ass
ignm
ent
Rul
es†
Ove
rall
Dec
iles
ofM
inor
ity
Aca
dem
icIn
dex
Dis
trib
utio
nA
ssig
nmen
tR
ule
Mea
n1
23
45
67
89
10P
re-P
rop
209
Min
ority
(Act
ual)
0.62
40.
497
0.53
90.
576
0.58
00.
609
0.64
40.
666
0.68
80.
726
0.78
5
AR
1:M
axim
ize
Gra
d.R
ates
Rul
e0.
670
0.55
80.
599
0.62
50.
648
0.66
80.
683
0.70
20.
720
0.74
60.
807
AR
2:Pos
t-P
rop
209
Min
ority
Rul
e0.
633
0.52
50.
563
0.58
50.
605
0.62
50.
641
0.66
30.
685
0.72
00.
778
AR
3:Pos
t-P
rop
209
Whi
teR
ule
0.63
60.
520
0.56
60.
590
0.61
20.
632
0.64
80.
668
0.68
90.
721
0.77
5
(A)
Max
imum
−P
reM
inor
ity
(Act
ual)
0.04
60.
061
0.06
00.
049
0.06
80.
059
0.03
90.
036
0.03
20.
020
0.02
2%
ofP
reM
inor
ity
(Act
ual)
7.3%
12.2
%11
.1%
8.5%
11.6
%9.
8%6.
0%5.
3%4.
6%2.
8%2.
8%
(B)
Pos
t(M
inor
ity)−
Pre
Min
ority
(Act
ual)
0.00
90.
028
0.02
40.
009
0.02
50.
016
-0.0
03-0
.003
-0.0
03-0
.006
-0.0
07%
ofP
reM
inor
ity
(Act
ual)
1.4%
5.5%
4.4%
1.6%
4.2%
2.7%
-0.5
%-0
.5%
-0.4
%-0
.8%
-0.9
%%
of[M
ax−
Pre
Min
ority
(Act
.)]
19.1
%45
.5%
39.8
%18
.4%
36.4
%27
.6%
-8.9
%-9
.6%
-9.4
%-2
7.7%
-30.
3%%
ofA
ve.
Net
Eff.
ofP
rop
209‡
28.1
%88
.9%
76.9
%29
.2%
79.3
%52
.9%
-11.
1%-1
1.0%
-9.7
%-1
8.2%
-21.
8%
(C)
Pos
t(W
hite
)−
Pre
Min
ority
(Act
ual)
0.01
20.
023
0.02
70.
014
0.03
20.
023
0.00
40.
002
0.00
1-0
.005
-0.0
10%
ofP
reM
inor
ity
(Act
ual)
1.9%
4.5%
5.0%
2.4%
5.4%
3.8%
0.6%
0.2%
0.1%
-0.6
%-1
.2%
%of
[Max
−P
reM
inor
ity
(Act
.)]
25.6
%37
.2%
44.9
%28
.6%
46.7
%39
.4%
9.3%
4.5%
3.1%
-22.
8%-4
3.8%
Data
Sourc
e:U
CO
P.
†See
text
for
des
crip
tion
ofhow
the
pre
dic
ted
gra
duati
on
rate
sw
ere
form
edfo
rea
chofth
eth
ree
ass
ignm
ent
rule
s,A
R1,A
R2,A
R3.
Equati
ons
use
dto
esti
mate
this
.‡E
stim
ate
ofav
erage
net
effec
tofP
rop
209
is0.0
31,w
hic
his
the
sum
ofth
eco
effici
ents
on
PO
ST
and
PO
ST×
Min
orit
yin
Col.
3,Table
10.
33

Tab
le15
:D
istr
ibut
ion
ofM
inor
ity
Enr
olle
esac
ross
UC
Cam
puse
s,P
re-P
rop
209
&P
redi
cted
unde
rA
lter
nati
vePos
t-P
rop
209
Ass
ignm
ent
Rul
es†
(A)
(B)
(C)
Pre
AR
1:A
R2:
AR
3:A
R1−
AR
2−
AR
3−
Pro
p20
9M
axPos
tPos
tP
reM
in(A
ctua
l)P
reM
in(A
ctua
l)P
reM
in(A
ctua
l)M
inor
ity
Gra
dP
rop
209
Pro
p20
9%
of%
of%
ofC
ampu
s(A
ctua
l)R
ate
(Min
)(W
hite
)Est
imat
eAct
ual
Est
imat
eAct
ual
Est
imat
eAct
ual
UC
Ber
kele
y0.
180
0.00
00.
100
0.04
1-0
.180
-100
%-0
.079
-44%
-0.1
39-7
7%U
CLA
0.21
80.
094
0.14
00.
083
-0.1
24-5
7%-0
.078
-36%
-0.1
35-6
2%U
CSa
nD
iego
0.08
40.
000
0.07
20.
069
-0.0
84-1
00%
-0.0
12-1
4%-0
.015
-18%
UC
Irvi
ne0.
087
0.00
00.
113
0.11
8-0
.087
-100
%0.
026
30%
0.03
136
%U
CD
avis
0.11
80.
000
0.12
70.
164
-0.1
18-1
00%
0.00
98%
0.04
639
%U
CSa
nta
Bar
bara
0.14
30.
747
0.15
20.
194
0.60
442
1%0.
009
6%0.
050
35%
UC
Sant
aC
ruz
0.07
70.
000
0.10
70.
189
-0.0
77-1
00%
0.03
039
%0.
112
147%
UC
Riv
ersi
de0.
094
0.15
80.
190
0.14
30.
064
68%
0.09
610
2%0.
048
51%
Data
Sourc
e:U
CO
P.
†See
text
for
des
crip
tion
ofhow
the
ass
ignm
ent
pro
babilit
ies
for
each
ofth
eth
ree
ass
ignm
ent
rule
s,A
R1,A
R2,A
R3,w
ere
det
erm
ined
.
34

References
[1] Antonovics, Kate and Richard H. Sander (2011). “Affirmative Action Bans and the ChillingEffect.” Working Paper University of California San Diego.
[2] Antonovics, Kate and Ben Backes (2011). “Were Minority Students Discouraged From Ap-plying to University of California Campuses After the Affirmative Action Ban?” Unpub-lished manuscript, Fall.
[3] Arcdiacono, Peter, Aucejo, Esteban, Fang, Hanming and Spenner, Kenneth (2011). “DoesAffirmative Action Lead to Mismatch? A New Test and Evidence” forthcoming in Quanti-tative Economics.
[4] Arcidiacono, Peter and Jacob Vigdor (2010). “Does the River Spill Over? Estimating theEconomic Returns to Attending a Racially Diverse College,” Economic Inquiry 47(3).
[5] Arcidiacono, Peter, Shakeeb Khan, and Jacob Vigdor (2008). “Representation versus Assim-ilation: How do Preference in College Admissions Affect Social Interactions?” forthcomingin Journal of Public Economics.
[6] Aucejo, Esteban, Federico Bugni, and V. Joseph Hotz (2011). “Identification on Regressionswith Missing Covariate Data.” Duke University Working Paper.
[7] Ayres, Ian, and Richard Brooks (2005). “Does Affirmative Action Reduce the Number ofBlack Lawyers?” Stanford Law Review 57(6): 1807-1854.
[8] Backes, Ben (2011). “Does affirmative action raise minority college attainment?” forthcom-ing in Journal of Human Resources.
[9] Barnes, Katherine Y. (2007). “Is Affirmative Action Responsible for the Achievement GapBetween Black and White Law Students?” Northwestern University Law Review 101(4):1759-1808.
[10] Berkson, Joseph (1955). “Maximum Likelihood and Minimum χ2 Estimates of the LogisticFunction,” Journal of the American Statistical Association 50(269): 130-162.
[11] Bettinger, Eric and Bridget Long (2011). “Addressing the Needs of Under-Prepared Stu-dents in Higher Education: Does College Remediation Work?” Forthcoming in Journal ofHuman Resources.
[12] Black, Dan A., Kermit Daniel and Jefrrey A. Smith (2001). “Racial Differences in the Effectsof College Quality and Student Body Diversity on Wages.” in Diversity Challenged, HarvardEducational Review.
[13] Black, Dan A. and Jeffrey A. Smith. (2004). “How robust is the evidence on the effects ofcollege quality? Evidence from matching.” Journal of Econometrics 121: 99-124.
[14] Bound, John and Sarah Turner (2007). “Cohort crowding: How resources affect collegiateattainment,” Journal of Public Economics 91: 877–899.
[15] Bound, John and Sarah Turner (2011). “Dropouts and Diplomas: The Divergence in Col-legiate Outcomes.” in Handbook of the Economics of Education, Vol. 4, E. Hanushek, S.Machin and L. Woessmann (eds.) Elsevier B.V., 573-613.
35
[16] Bound, John, Michael Lovenheim and Sarah Turner. (2010a). “Why have College Comple-tion Rates Declined? An Analysis of Changing Student Preparation and Collegiate Re-sources.” American Economic Journal: Applied Economics 2(3): 129–157.
[17] Bound, John, Michael Lovenheim and Sarah Turner. (2010b). “Increasing Time to Bac-calaureate Degree in the United States.” NBER Working Paper 15892.
[18] Card, David and Krueger, Alan B. “Would the Elimination of Affirmative Action AffectHighly Qualified Minority Applicants? Evidence from California and Texas.” Industrialand Labor Relations Review 58(3): 416-434.
[19] Chambers, David L., Timothy T. Clydesdale, William C. Kidder, and Richard O. Lempert(2005). “The Real Impact of Eliminating Affirmative Action in American Law Schools: AnEmpirical Critique of Richard Sander’s Study.” Stanford Law Review 57(6): 1855-1898.
[20] Cortes, K.E. (2010). “Do bans on affirmative action hurt minority students? Evidence fromthe Texas Top 10% Plan.” Economics of Education Review 29(6): 1110-1124.
[21] Dale, Stacy Berg, and Alan B. Krueger (2002). “Estimating the Payoff to Attending aMore Selective College: An Application of Selection on Observables and Unobservables.”Quarterly Journal of Economics 117(4): 1491-1527.
[22] Dickson, Lisa M. (2006). “Does Ending Affirmative Action in College Admissions Lower thePercent of Minority Students Applying to College?” Economics of Education Review 25(1):109-119.
[23] Duncan, Greg J., J. Boisjoly, D.M. Levy, M. Kremer, and Jacqueline Eccles (2006). “Empa-thy or Antipathy? The Impact of Diversity.” American Economic Review 96(6): 1890-1905.
[24] Goldin, Claudia and Lawrence Katz (2008).The Race between Education and Technology.Cambridge: Harvard University Press.
[25] Grove, Wayne and Andrew Hussey (2011). “Affirmative Action in MBA Programs: Inves-tigating the Mismatch Hypothesis for Race and Gender.” working paper.
[26] Hill, E.(2001). “Improving Academic Preparation for Higher Education.” California Leg-islative Analyst’s Office (LAO) Report.
[27] Hinrichs, Peter (2010). “The Effects of Affirmative Action Bans on College Enrollment,Educational Attainment, and the Demographic Composition of Universities.” Forthcomingin Review of Economics and Statistic.
[28] Hinrichs, Peter (2011). “Affirmative Action Bans and College Graduation Rates.” WorkingPaper Georgetown University.
[29] Ho, Daniel E. (2005). “Why Affirmative Action Does Not Cause Black Students to Fail theBar.” Yale Law Journal 114(8): 1997-2004.
[30] Hoxby, Caroline M. (2009). “The Changing Selectivity of American Colleges.” Journal ofEconomic Perspectives 23(4): 95118.
[31] Kain, John F., Daniel M. O’Brien, and Paul A. Jargowsky (2005). “Hopwood and the Top10 Percent Law: How They Have Affected the College Enrollment Decisions of Texas HighSchool Graduates,” Unpublished manuscript, University of Texas-Dallas.
36

[32] Theil, Henri (1969). “A Multinomial Extension of the Linear Logit Model.” InternationalEconomic Review 10(3): 251-259.
[33] Kellough, J. Edward (2006). Understanding Affirmative Action: Politics, Discriminationand the Search for Justice. Georgetown University Press: Washington D.C.
[34] Long, Mark C. (2004a) “College Applications and the Effect of Affirmative Action.” Journalof Econometrics 121(1-2): 319-342.
[35] Long, Mark C. (2004b). “Race and College Admission: An Alternative to Affirmative Ac-tion?,” The Review of Economics and Statistics 86(4): 1020-1033.
[36] Long, Mark C. (2007) “Affirmative Action and its Alternatives in Public Universities: WhatDo We Know?.” Public Administration Review 67(1): 311-325.
[37] Long, Mark C. and Marta Tienda (2008), “Winners and Losers: Changes in Texas UniversityAdmissions post-Hopwood,” Educational Evaluation and Policy Analysis 30(3): 255-280.
[38] Loury, Linda D. and David Garman (1995). “College Selectivity and Earnings.” Journal ofLabor Economics 13(2): 289-308.
[39] Rothstein, Jesse and Albert Yoon (2008). “Mismatch in Law School.” mimeo, PrincetonUniversity.
[40] Sander, Richard H. (2004). “A Systemic Analysis of Affirmative Action in American LawSchools.” Stanford Law Review 57(2): 367-483.
[41] Sander, Richard H. (2005a). “Mismeasuring the Mismatch: A Response to Ho.” Yale LawJournal 114(8): 2005-2010.
[42] Sander, Richard H. (2005b). “Reply: A Reply to Critics.” Stanford Law Review 57(6):1963-2016.
[43] Tienda, Marta, Kevin T. Leicht, Teresa Sullivan, Michael Maltese, and Kim Lloyd (2003).“Closing The Gap?: Admissions & Enrollments at the Texas Public Flagships Before andAfter Affirmative Action,” unpublished manuscript, Princeton University.
[44] Turner, Sarah (2004). “Going to College and Finishing College: Explaining Different Edu-cational Outcomes,” in College Choices: The Economics of Where to Go, When to Go, andHow to Pay For It, C. M. Hoxby (ed.), Chicago: University of Chicago Press.
37

A Appendix
In this appendix we present the model and parameter estimates that underlie Table 6. LetUijtr denote the utility that high school graduate i in college entry cohort t who is a member ofracial/ethnic group r would get from enrolling in college j is given by
Uijtr = Ujtr + εijtr (11)
where Ujtr is the student’s systematic utility that varies by college and race and εijtr is theunobserved and idiosyncratic component of utility that is assumed to be independent of Ujtr
and distributed i.i.d. Type I extreme value. Also let Ui0tr denote the utility of not enrolling inany of the J colleges, which we normalize to zero.
To formulate an estimable version of (11), we need to invoke some additional assumptions.First, we assume that each student’s choice set includes the complete set of California collegesand, going further, that all students are accepted to each of these colleges. Clearly, some studentsdo not apply to particular colleges and students who apply are not always accepted. To accountfor these realities, we allow the net utility students derive from colleges to differ across types ofschools, reflecting differences in the difficulty of a college’s curriculum and/or a student’s abilityto complete it. Second, we allow cohorts to differ over time, such as in their college readiness,by including a race-specific linear time trend. Third, to incorporate the effects of Prop 209, wealso allow the utilities of enrolling at different types of colleges to change post-Prop 209. Fourth,we express the systematic utilities of minority groups, Ujtr, relative to those of non-minorities inorder to focus attention on the minority vs. non-minority differences in the effects of Prop 209.We allow for three racial/ethnic groups: African Americans, Hispanics and a “majority” groupconsisting of whites, Asian Americans, and the Unknowns.30 Let this majority group be denotedby r = m and African Americans and Hispanics be denoted by r = b and r = h, respectively.
Incorporating these assumptions, we rewrite Ujtr from (11) as follows:
Ujtr = Ujtm + δ0jr + δ1rt +K∑
k=1
δ2krI(Cj = k)POSTt (12)
for r = b, h, where Ujtm is the college-cohort specific utility for the majority group, I(Cj = k)is an indicator function denoting whether college j is of type k, where types are defined below,POSTt denotes an dummy variable equal to 1 if the student is in a cohort t that is Post-Prop209 and equal to 0 otherwise, and the δ2krs are the effects of Prop 209 on enrollments at differenttypes of colleges. Note that the second term of (12) absorbs the time-variant or pre-Prop 209characteristics of colleges and/or race groups into a college-race specific fixed effect, δ0jr. Finally,we assume that high school students make their college enrollment decisions according to:
j∗itr = arg maxj
Uijtr (13)
where j ∈ {0, 1, ..., J} and j = 0 denotes the choice of not enrolling in college.30Grouping the Unknowns with whites and Asian Americans is consistent with the anecdotal evidence cited in
Section 2.1 and the findings of Card and Krueger (2005). To the extent that African Americans and Hispanic rep-resent a portion of the increase in students with unknown race/ethnicity with Prop 209, we will be overestimatingthe negative effects of Prop 209 on these groups.
38
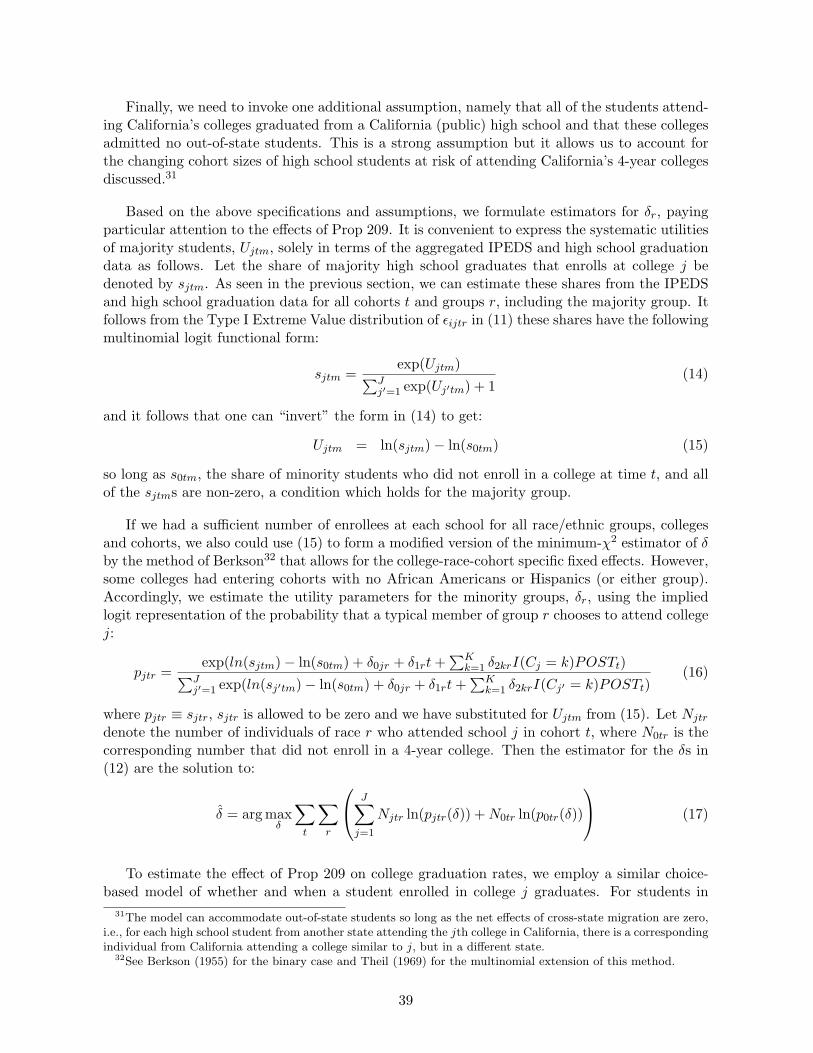
Finally, we need to invoke one additional assumption, namely that all of the students attend-ing California’s colleges graduated from a California (public) high school and that these collegesadmitted no out-of-state students. This is a strong assumption but it allows us to account forthe changing cohort sizes of high school students at risk of attending California’s 4-year collegesdiscussed.31
Based on the above specifications and assumptions, we formulate estimators for δr, payingparticular attention to the effects of Prop 209. It is convenient to express the systematic utilitiesof majority students, Ujtm, solely in terms of the aggregated IPEDS and high school graduationdata as follows. Let the share of majority high school graduates that enrolls at college j bedenoted by sjtm. As seen in the previous section, we can estimate these shares from the IPEDSand high school graduation data for all cohorts t and groups r, including the majority group. Itfollows from the Type I Extreme Value distribution of εijtr in (11) these shares have the followingmultinomial logit functional form:
sjtm =exp(Ujtm)∑J
j′=1 exp(Uj′tm) + 1(14)
and it follows that one can “invert” the form in (14) to get:
Ujtm = ln(sjtm)− ln(s0tm) (15)
so long as s0tm, the share of minority students who did not enroll in a college at time t, and allof the sjtms are non-zero, a condition which holds for the majority group.
If we had a sufficient number of enrollees at each school for all race/ethnic groups, collegesand cohorts, we also could use (15) to form a modified version of the minimum-χ2 estimator of δby the method of Berkson32 that allows for the college-race-cohort specific fixed effects. However,some colleges had entering cohorts with no African Americans or Hispanics (or either group).Accordingly, we estimate the utility parameters for the minority groups, δr, using the impliedlogit representation of the probability that a typical member of group r chooses to attend collegej:
pjtr =exp(ln(sjtm)− ln(s0tm) + δ0jr + δ1rt +
∑Kk=1 δ2krI(Cj = k)POSTt)∑J
j′=1 exp(ln(sj′tm)− ln(s0tm) + δ0jr + δ1rt +∑K
k=1 δ2krI(Cj′ = k)POSTt)(16)
where pjtr ≡ sjtr, sjtr is allowed to be zero and we have substituted for Ujtm from (15). Let Njtr
denote the number of individuals of race r who attended school j in cohort t, where N0tr is thecorresponding number that did not enroll in a 4-year college. Then the estimator for the δs in(12) are the solution to:
δ = arg maxδ
∑t
∑r
J∑j=1
Njtr ln(pjtr(δ)) + N0tr ln(p0tr(δ))
(17)
To estimate the effect of Prop 209 on college graduation rates, we employ a similar choice-based model of whether and when a student enrolled in college j graduates. For students in
31The model can accommodate out-of-state students so long as the net effects of cross-state migration are zero,i.e., for each high school student from another state attending the jth college in California, there is a correspondingindividual from California attending a college similar to j, but in a different state.
32See Berkson (1955) for the binary case and Theil (1969) for the multinomial extension of this method.
39
race/ethnic group r who were in cohort t that enrolled in college j, let the utility of graduatingfor minority group r = b, h relative to the majority group m be given by:
Vijtr = Vjtr + ζijtr
= Vjtm + φ0jr + φ1rt +K∑
k=1
φ2krI(Cj = k)POSTt + ζijtr (18)
for r = b, h, where φ0jr is race/ethnic and college specific fixed effect and the parameters, φ2krs,characterize the relative effects of Prop 209 on college graduation rates. Let gjtr denote theobserved share of students in race/ethnic group r of cohort t that graduated among those in thisgroup and cohort that enrolled in college j. These shares can be estimated from the data. Weagain express the systematic utility of graduating for the majority group, Vjtm in terms of gjtm
and g0tm and formulate the estimator of the parameters vectors φr = (φ0r, φ1r, φ21r, ..., φ2Kr) interms of the following representation of the graduation probabilities:
qjtr =exp(ln(gjtm)− ln(g0tm) + φ0jr + φ1rt +
∑Kk=1 φ2krI(Cj = k)POSTt)
exp(ln(gjtm)− ln(g0tm) + φ0jr + φ1rt +∑K
k=1 φ2krI(Cj = k)POSTt) + 1(19)
where qjtr ≡ gjtr. Denote the number of college graduates of race r in cohort t at school j asGjtr, then it follows that the number of students that do not to graduate is Njtr − Gjtr. Theparameters are then estimated using:
{φ} = arg maxφ
∑t
∑r
∑j
(Gjtr ln(qjtr(φ)) + (Njtr −Gjtr) ln(1− qjtr(φ))) (20)
We estimate (20) separately for both 4 and 6 year graduations in order to determine if Prop 209had a different effect on on-time versus ever graduation rates.
Finally, in the specifications of the college-specific utilities for enrollment and graduationdecisions, we categorize California’s college into one of the following five, mutually exclusive,types:
1. UC campuses that were in the 1997 U.S. News & World Report Top 50 National Univer-sities;33
2. UC campuses that were not in the 1997 U.S. News & World Report Top 50 NationalUniversities;
3. Campuses that were part of the CSU system;
4. Private (profit or non-profit) colleges/universities that were in either the 1997 U.S. News& World Report Top 50 National Universities or the Top 40 Liberal Arts Colleges;34
5. Private colleges/universities that did not make either of the U.S. News & World Reporttop rankings in 1997.
33Source: “Best national universities.” U.S. News & World Report, Sept 16, 1996, 121(11): 110.34Source: “Best national liberal arts colleges.” U.S. News & World Report, Sept 16, 1996, 121(11): 116.
40

Note that none of the CSU campuses were ranked in the Top 50 U.S. universities or collegesin that year, whereas only UC Riverside and UC Santa Cruz were not among the ranked UCcampuses.
Estimates of the post interacted with type of college for the enrollment specification (equation(17)) and graduation specification (equation (20)) for both 4 and 6 year graduates are given inTable 16. Enrollment results are reported in the first column. Both African Americans andHispanics see significantly negative effects of Prop 209 at Top-50 UC schools with significantlypositive effects at UC schools outside the Top 50. Prop 209 then shifted enrollments from the topUC schools to the UC schools that were less prestigious. This makes the enrollment results forCSU particularly surprising as the effect of Prop 209 is negative for both African Americans andHispanics. Top-50 private schools see significant increases in enrollment for African Americans,but significant decreases for private schools outside the Top-50. No significant enrollment changesfor Hispanics were seen at private schools.
Table 16 also presents estimates the effects of Prop 209 by race/ethnicity for the probability ofgraduating from college in 4 and 6 years, respectively. For African Americans, there are positiveeffects on 4 and 6 year graduation rates conditional enrollment for all types of colleges, thoughthe results are only consistently significant at the two groups of private colleges. Positive effectsare generally for Hispanics as well, with significant effects on 6 year college rates at Top-50 UCand privates schools as well as at CSU. These increased graduation rates could have occurred forat least two reasons. First, Prop 209 could lead to better minority students on average at eachschool, shifting the worst students at each school down a level and the worst students overall out.Second, Prop 209 may have shifted students to schools where they were a better match, raisingtheir graduation probabilities. We explore these explanations further in Section 4.2 where wehave individual-level data.
41

Tab
le16
:E
nrol
lmen
tan
dG
radu
atio
nC
oeffi
cien
ts
Enr
ollm
ent
Gra
d≤4|
Enr
oll
Gra
d≤6|
Enr
oll
Coe
ff.St
d.E
rr.
Coe
ff.St
d.E
rr.
Coe
ff.St
d.E
rr.
Afr
ican
Am
eric
ans:
Top
50U
C-0
.447
∗∗∗
(0.0
42)
0.11
0(0
.105
)0.
059
(0.0
90)
Non
-Top
50U
C0.
183∗
∗(0
.076
)0.
400∗
∗(0
.177
)0.
227
(0.1
59)
CSU
-0.2
51∗∗
∗(0
.032
)0.
167
(0.1
22)
0.13
4∗(0
.071
)Top
50P
riva
te0.
208∗
∗∗(0
.060
)0.
329∗
∗(0
.129
)0.
266∗
(0.1
54)
Non
-Top
50P
riva
te-0
.116
∗∗(0
.052
)0.
340∗
∗∗(0
.119
)0.
367∗
∗∗(0
.121
)
His
pani
cs:
Top
50U
C-0
.222
∗∗∗
(0.0
22)
0.07
8(0
.052
)0.
186∗
∗∗(0
.052
)N
on-T
op50
UC
0.09
5∗∗
(0.0
37)
0.01
0(0
.080
)0.
059
(0.0
83)
CSU
-0.1
50∗∗
∗(0
.017
)0.
325∗
∗∗(0
.057
)0.
139∗
∗∗(0
.040
)Top
50P
riva
te-0
.030
(0.0
41)
0.12
1(0
.087
)0.
135∗
∗∗(0
.110
)N
on-T
op50
Pri
vate
-0.0
27(0
.031
)0.
024
(0.0
67)
0.02
2(0
.075
)D
ata
Sourc
e:IP
ED
S.
***
p<
0.0
1,**
p<
0.0
5,*
p<
0.1
.
42


![[XLS] · Web view28 209 70227595 29 209 70775496 30 209 70554395 31 209 70775195 32 209 70559596 33 209 70774296 34 209 70778999 35 209 70773995 36 209 70226095 37 209 70776596 38](https://static.fdocuments.in/doc/165x107/5b0cded17f8b9ab7658b981b/xls-view28-209-70227595-29-209-70775496-30-209-70554395-31-209-70775195-32-209.jpg)