The effect of geographical distance on online - cpb.nl effect of geographical distance on online...
28
-
Upload
truongxuyen -
Category
Documents
-
view
226 -
download
1
Transcript of The effect of geographical distance on online - cpb.nl effect of geographical distance on online...


The effect of geographical distance on online
transactions
Evidence from the Netherlands
Ali Palali∗1, Bas Straathof1, and Rinske Windig1
1CPB Netherlands Bureau for Economic Policy Analysis
October 2, 2017
Abstract
The rise of online trade alters the role of distance between (potential) buyers and sellers.
We use data from eBay subsidiary Marktplaats.nl, one of the largest online trading plat-
forms in the Netherlands, to estimate how distance affects the probability of a transaction
between small geographical regions. We find that distance negatively and modestly affects
the probability of having a transaction between two regions, and that the distribution of
this probability is highly skewed: ranging from a change of 0.000 to -0.008 percentage points
per marginal kilometer. The unconditional probability of a transaction is 27 percent. Dis-
tance is less influential for 1) advertisements with more photos, 2) advertisements placed by
high-frequency advertisers and 3) for new goods in comparison to second hand goods. This
suggests that information frictions might be the driving force behind the distance effect on
online trade in the Netherlands.
Keywords: Distance effect, online trade, eBay
JEL codes: D44; R12
∗Corresponding author. Email: [email protected]
We thank Gerard Verweij for sharing the distance data between the postcode areas in the Netherlands.
1 Introduction
The total value of trade between pairs of countries is known to vary substantially with
the distance between them (Disdier and Head, 2008a). Is the internet changing the
average distance between buyers and sellers? Online trading platforms such as eBay.com,
Alibaba.com and Marktplaats.nl allow all kinds of buyers and sellers to find each other
regardless of their geographical location and the product they wish to trade.
Hortacsu et al. (2009), using transaction data from eBay and Mercadolibre, find dis-
tance effects ranging between -0.05 and -0.10, much smaller than comparable studies using
offline trade data.1 Lendle et al. (2016) compare the effect of distance between eBay and
regular trade of the same type of goods in 61 countries in their study. Directly compar-
ing online trade (-0.508) and offline trade (-1.408), they find that distance effects are 65
percent smaller in online trade. The empirical evidence presented in these studies clearly
supports the hypothesis that the distance effect on international trade is weaker for online
platforms.
The smaller importance of distance on online platforms could have various implica-
tions. Online trading platforms could not only affect international trade, but also change
the role of distance within countries. As these platforms alter location-based rents, they
might alter the geographical distribution of economic activity within a country (Leamer,
2007). For example, households become less dependent on what local stores are offering if
they can reach different variety of products through online platforms. As a consequence,
certain stores no longer need to establish themselves in a city center.2 Over time, online
trading platforms could affect the prosperity of a country or the wealth distribution within
a country. This in turn influences investments needed in infrastructure, public services
and social security, and so on.3
How online trading platforms will change the location of economic activity depends on1In an early discussion of the subject, Leamer and Levinsohn (1995) mention a distance elasticity of
about -0.6. In a more recent meta-analysis, Disdier and Head (2008a) find an average distance effect ofbetween -0.63 and -0.96.
2The rise of Amazon, for example, has coincided with the decline of brick-and-mortar bookstores(Lieber and Syverson, 2012) and music specialty retailers (Zentner, 2008).
3For a more in-depth discussion of the effects of e-commerce on market outcomes see Lieber andSyverson (2012).
2

the channels through which distance may affect trade. There are several ways this could
happen: via transportation costs, information frictions, or heterogeneity in preferences
and resources. Lendle et al. (2016) find that higher-rated sellers are affected less by
distance, which, the authors claim, points towards information frictions as being the main
cause for the difference between the effect of distance in on- and offline trade. Information
frictions include all costs a buyer incurs in order to gather or interpret information about
the product they are buying (Lendle et al., 2016).
In online trade, information asymmetry occurs when the seller has more information
on the product than the buyer because the buyer typically does not see the product
in person before making a purchase. Especially for non-standardized goods information
frictions could be higher for online trade for than for offline trade. In his study of rice
and corn traders in the Philippines, Allen (2014) confirms that information frictions are
an important factor. As mobile phone usage increased, traders had more access to price
information from the other side of the island and prices changed accordingly. Roughly half
of the regional variation in prices was explained by information friction. More evidence
for this effect can be found in crowd-funding, where the effect of distance between artist
and investors could be fully explained by social-related frictions (Agrawal et al. (2011)).
Information frictions are therefore important to consider when studying online trade.
We focus on the role of distance on an online trading platform that targets users
located in a single, densely populated country, the Netherlands. We use data from eBay
subsidiary Marktplaats.nl, one of the largest online trading platforms in the Netherlands,
to estimate how distance affects the probability of a transaction on online platforms for
a variety of product categories. The Netherlands has two characteristics that make it an
interesting case. The first is that online trade has become widespread in the Netherlands:
according to Statistics Netherlands the share of Dutch people making online purchases
was 82 percent in 2013. Second, information frictions are likely to be relatively important
in the Netherlands compared to the other two mechanisms as distances between regions
in the Netherlands are rather small. Transportation costs are largely fixed for users of
Marktplaats.nl: for many goods the prices charged for shipment are independent of the
location of the sender and receiver and items are generally delivered the next day.
3
The empirical strategy that we use is similar to the approach that Silva et al. (2014)
follow to explain differences in the number of trading sectors between pairs of countries.
Instead of focusing on international trade between sectors, we focus on the probability
that a transaction takes place on Marktplaats.nl between two regions defined by two
digit post-code areas. Actual economic transactions are not registered on Marktplaats.nl.
Therefore, we cannot observe who exactly purchases the product. However, we have
information on who places the maximum bid. Using this information, we assume that
the user who places the maximum bid on an advertisement buys the product. In other
words, we treat transactions as a latent variable that can be approximated by the pair of
an advertisement and its highest bid.
The basic theoretical framework consistent with our empirical strategy is that of An-
derson and van Wincoop (2003). In their study the authors provide a general equilibrium
model in which international trade flows are determined by the pattern of trade costs
between countries. They show that price indices (‘multilateral resistance terms’) have to
be included in regressions on bilateral trade flows in order to take into account correla-
tion between bilateral trade flows. We account for this correlation by adding region fixed
effects, following the strategy proposed by Baier and Bergstrand (2009).
For over 1400 different product categories, we estimate the probability of having at
least one transaction between two postcode areas, finding that distance reduces the proba-
bility of a transaction for most of the product categories. We also find that the distribution
of this probability is highly skewed. The influence of distance ranges from a change of
-0.008 percentage points in the probability of a transaction per marginal kilometer, to
0. The mean predicted change per marginal kilometer is -0.0016 percentage points. A
second-stage regression on the estimated marginal distance effects suggests that distance
is less influential for advertisements with more number of photos, advertisements which
are placed by high-frequency advertisers and for new goods in comparison to second hand
goods. These findings together suggest that information frictions might be the driving
force behind the distance effect on online trade in the Netherlands.
The analysis of distance effects on online platforms fits in the broader literature on
the role of distance in international trade. As before, Disdier and Head (2008b) find that
4

the effect of distance on trade has grown in size over the years. This means that although
technology has advanced and trade costs have gone down, the influence of distance has
increased. This contradiction has been coined the ‘distance puzzle’. The distance puzzle
has since been a subject of research, with some authors confirming it Carrere et al. (2013),
and some finding solutions, theoretical Chaney (2013) or empirical Anderson and Yotov
(2012) in nature. One thing that this debate highlights, however, is that trade costs are
not the only mechanism through which distance influences trade.
1.1 Use of Marktplaats.nl in the Netherlands
Marktplaats is the largest online platform for trading in the Netherlands with approxi-
mately 2.1 million daily visitors. Founded in 1999, this online platform has rapidly grown
and was taken over by eBay in 2004. In 2006 there were a total of 44 million advertise-
ments on Marktplaats. In 2015 this number has reached to 60 million coming from 1.8
million unique users.
Today users from all over the country place advertisements for any types of products
on Marktplaats changing from books and clothing to automobiles and houses. Figure 1
below shows how per-capita number of advertisements is distributed across the country.
The distribution of dark shaded areas indicate that the use of Marktplaats is common in
all regions in the Netherlands, not only in high density population areas.
5

Figure 1: Per capita number of advertisements in the Netherlands
Marktplaats.nl differ from the well-known eBay in many aspects. First of all, Markt-
plaats.nl does not oversee the transactions. Once sellers and buyers agree on a price they
perform the transaction themselves. This means bids placed on Marktplaats.nl are not
binding. A potential buyer with the maximum bid can say no to the seller once bidding
process is over. Seller, then, can re-place the advertisement on the website. Moreover,
there is no feedback/review mechanism where buyers and sellers can rate each others
unlike other platforms. Therefore, it is not possible to track untruthful buyers and sellers.
The paper is organized as follows. In section 2 we present our data set with several
sample statistics. In section 3 we explain the empirical methodology used to investigate
the distance effect. In section 4 we present the results of our empirical analysis. Finally
in section 5 we conclude.
6

2 Data
Advertisement data that we are using come from Marktplaats.nl, the largest online mar-
ket place in the Netherlands. The raw data set includes all advertisements placed on
Marktplaats.nl from July 2013 until July 2016. For all advertisements we have informa-
tion on the postcode of the user who places the advertisement (seller), type of the user
(casual user, hobby user or professional user; own categorization of Marktplaats), state of
the product being advertised (new, used or good as new), total number of photos placed
with the advertisement and product categories.
Product category information in our data set is highly detailed. For each advertisement
we have two levels of product category information. The first level consists of 29 different
categories such as antique goods, computer and software, automobiles, books, women and
men clothing. The second level has around 1400 categories dividing the first categories
into subcategories, for example, dividing clothing to t-shirts, sports-clothing, etc., and
dividing automobiles to Toyoto, Volvo, etc. This enables us to analyze the effect of
geographical distance on online transactions separately for each product category, which
gives as a detailed picture of the distance effect.
For advertisements placed with a bidding option (37 percent) we also have information
on total number of bids and the maximum bid placed for the product as well as the post-
code information of the user who placed the maximum bid.4 Marktplaats.nl differs from
eBay and other platforms in that Marktplaats does not facilitate payments between buy-
ers and sellers. Also, Markplaats.nl does not offer users the possibility to rate each other
nor to leave reviews. Because of the design of the platform, we do not have information
on actual transactions, but only on the interaction between (potential) sellers and buyers
prior to a transaction. We use information on advertisement-bid combinations as a proxy
for actual transactions, assuming that the user with the highest bid on an advertisement
is the most likely buyer.5
4We are aware of the fact that this causes a selection problem in our sample. Comparing the availableobservable characteristic for advertisements placed with and without a bidding option shows that theshare of used products (36% vs. 29%) and casual users (40% vs. 24%) are higher for the former group.Therefore, such advertisements are over-represented in our analytical sample. The number of photos arearound 3 for both groups.
5Throughout our study we use the term ”probability of a transaction”. The reader should keep in
7

Marktplaats.nl provides postcodes of the advertisers and bidders with four digits
(neighborhood level), we focus on the first two digits (town level) because the number
of transactions in a particular product category between four digit postcode area pairs
is very small. Focusing on the first two digits of the postcode information yields ninety
postcode areas for advertisers and bidders - and 8100 location pairs. We then count the
total number of transactions between each postcode pairs. Figure 2 below displays the
distribution of the postcode area pairs with at least one transaction on Marktplaats. For
a small number of product categories, there are transactions between almost all postcode
area pairs whereas for some the share of postcode area pairs with a transaction is very low.
For many product categories the percentage of postcode area pairs with no transactions
at all is more than 80%. On average there is at least one transaction between only 27
percent of the postcode area pairs.
Figure 2: Distribution of the share of municipality pairs with transactions over productcategories
01
23
4D
ensi
ty
0 .2 .4 .6 .8 1Share of postcode area pairs with transactions
DensityMean
As a measure for distance, we use driving distance in kilometers between postcode areas
taken from official traffic statistics provided by the Dutch Ministry of Transportation.
Figure 3 below displays the distribution of the distance between postcode areas in the
Netherlands. The average distance is around 140 kilometer. Overall, the distribution
shows that most of the the postcode areas are not far from each other.
mind that we do not observe the actual transaction, and we assume that the highest bidder is the buyer.
8

Figure 3: Distribution of the distance between postcode areas
0.0
01.0
02.0
03.0
04.0
05D
ensi
ty
0 100 200 300 400Distance in kilometers
DensityMean distance
Figure 4 displays a brief overview of the relationship between distance and probability
of having a transaction. In order to show this simple relationship, we calculated the
share of post-code are pairs with at least one transaction for post-code area pairs with
0-5km distance, 5-10km distance, 10-15km distance, and so on. For example, 65 percent
of the post-code area pairs with a distance of 5km or less have at least one transaction.
The share decreases to 30 percent for post-code area pairs with a distance between 100-
105km. The figure indicates a clear negative relationship between distance and probability
of having a transaction. The economic magnitude of this effect, and how it changes after
controlling for post-code area characteristics and other observable characteristics is an
empirical question.
9

Figure 4: Unconditional relationship between probability of having a transaction anddistance
.2.3
.4.5
.6.7
Sha
re o
f pos
t−co
de a
rea
pairs
with
at l
east
one
tran
sact
ion
0 50 100 150 200 250Distance in km
In order to investigate the sensitivity of the distance effect to product and user charac-
teristics, we use variations in user and product state information across product categories
as well as the total number of photos in each advertisement. Based on the frequency of
online activity, Marktplaats categorizes the sellers into three groups: casual user (with
few advertisements and low spending), hobby user (with many advertisements and low
spending) and professional user (with many advertisements and high spending). Figure 5
shows the distribution of the share of different user types over product categories. Most
of the users are casual or hobby users, 41 percent and 52 percent, respectively. Only seven
percent of the users are categorized as professional users. Similarly Figure 6 shows the
distribution of the share of the product state over product categories. Fourteen percent
of the products are new, 32 percent are used and 26 percent are categorized as good as
new. 28 percent are not categorized; therefore, they are shown as unknown. Since the
seller choses the category while placing the advertisement on Marktplaats.nl, the products
which are categorized as unknown can be systematically different than the others.
10

Figure 5: Distribution of the user types over product categories
0.0
05.0
1.0
15.0
2.0
25D
ensi
ty
0 20 40 60 80 100User type: Casual
DensityMean
0.0
05.0
1.0
15.0
2.0
25D
ensi
ty
0 20 40 60 80 100User type: Hobby
DensityMean
0.0
5.1
.15
.2D
ensi
ty
0 20 40 60 80 100User type: Professional
DensityMean
11
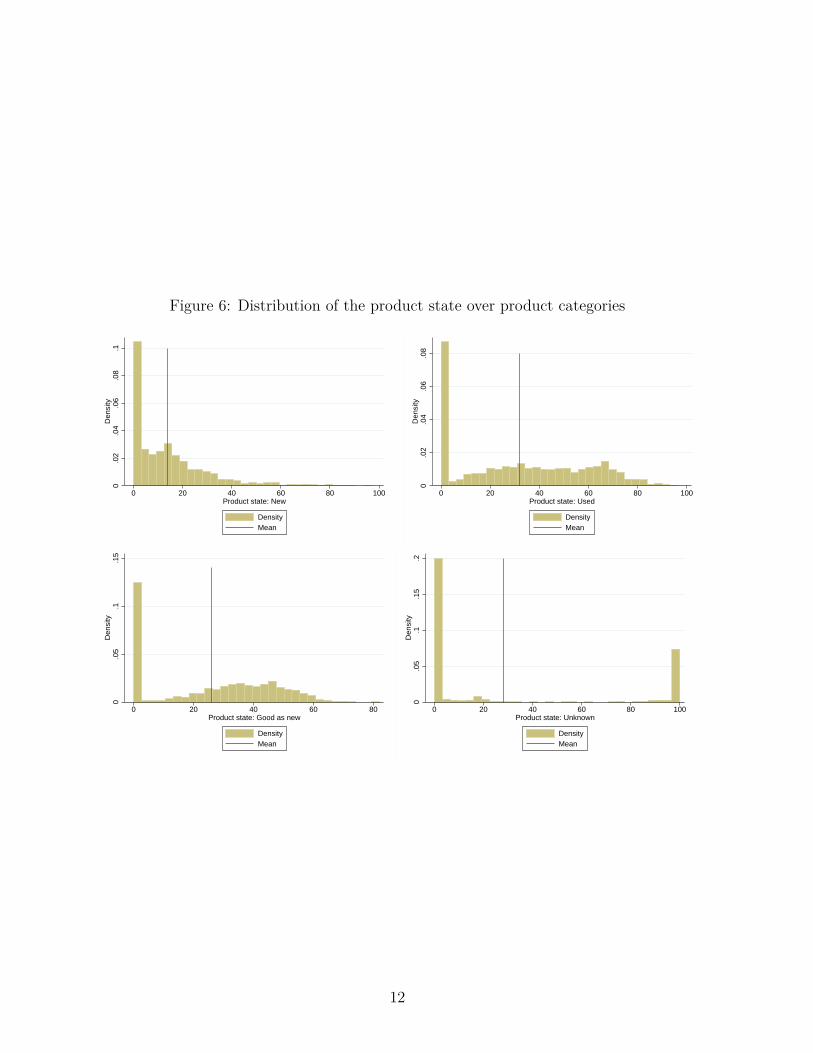
Figure 6: Distribution of the product state over product categories
0.0
2.0
4.0
6.0
8.1
Den
sity
0 20 40 60 80 100Product state: New
DensityMean
0.0
2.0
4.0
6.0
8D
ensi
ty
0 20 40 60 80 100Product state: Used
DensityMean
0.0
5.1
.15
Den
sity
0 20 40 60 80Product state: Good as new
DensityMean
0.0
5.1
.15
.2D
ensi
ty
0 20 40 60 80 100Product state: Unknown
DensityMean
12

3 Empirical Methodology
Our empirical strategy is similar to the approach Silva et al. (2014) use to explain differ-
ences in the number of trading sectors between pairs of countries. Instead of focusing on
international trade between sectors, we focus on the probability that at least one trans-
action takes place from one region to another.6 As mentioned earlier actual economic
transactions are not registered on Marktplaats.nl and we treat transactions as a latent
variable that can be approximated by the pair of an advertisement and its highest bid.
We estimate the probability of having at least one advertisement with a bid between two
postcode areas (Yijt = 1) using a logit model with the following equation:
Y ∗ijt = β0 + β1Dij + β2Si + β3Bj + β4Tt + εijt (1)
where Y ∗ijt is the latent propensity of transaction variable with
Yijt =
1 if Yijt∗ > 0
0 otherwise(2)
Dij is the geographical distance between postcode areas, and Si and Bj are the post-
code area fixed effects for sellers and buyers, respectively. Tt is year fixed effects and
εijt is the error term. Conditional on the seller and buyer postcode area fixed effects, we
can extract the effect of the geographical distance on the probability of a transaction.
As demonstrated by Baier and Bergstrand (2009), the area fixed effects avoid biased
estimates caused by geographical correlation between transactions.
Due to the non-linearity of the logit model, the coefficient on distance alone provides
insufficient information on the magnitude of the effect of distance on the probability.
Therefore, we calculate the marginal effect of the distance on the probability of having6Note that our estimation strategy and underlying theoretical foundation is very similar to Hortacsu
et al. (2009). However, instead of using the total number of transactions between two regions we focuson probability to have at least one transaction. Hortacsu et al. (2009), the authors study the online tradebetween states, which indicates that there are indeed online transactions between all the regions. Wefocus on 2-digit postcode areas in the Netherlands. Our data show that 73% of all postcode area pairs donot have any transaction at all. In many product categories, this percentage is even higher. Therefore, webelieve that we can investigate the question of whether there is a transaction or not in a better mannerthan the question of how many transactions given our data set.
13

at least one transaction between two postcode areas. Marginal effects have an intuitive
interpretation as they indicate the effect of 1km change in distance on the probability of
having a transaction between two post-code are pairs. Marginal effect of distance in the
logit model is
ME(Dij) = β1Pijt(1 − Pijt) (3)
where
Pijt = exp(β0 + β1Dij + β2Si + β3Bj + β4Tt)1 + exp(β0 + β1Dij + β2Si + β3Bj + β4Tt)
(4)
Equation 4 shows that the marginal effect of distance does not only depend on the
estimated coefficient for distance, but also on the other estimated coefficients as well as
the values that all the variables take on. Therefore, we calculate the marginal effect for
the mean distance in our sample and for values of 1, 5, 10, 20, 40, 80 and 160 km in order
to investigate the non-linear nature of the relationship between distance and probability
of having a transaction.
The channels through which distance may affect online transactions, namely trans-
portation costs, information frictions, and heterogeneity in preferences and resources, can
largely depend on the type of the product being sold online. For example, information
frictions may play a large role in the decision to buy an automobile, compared to the
decision to buy post stamps. This implies that the distance effect itself might depend
on fundamental product characteristics, which makes the information on product cate-
gories crucial in our analysis. The data at hand provide detailed information on product
categories. The first way to control for such an information is to include variables on
product categories into equation 1, and analyze possible interaction effects. However, we
have around 1400 product categories which makes it infeasible to follow such a strategy.
Therefore, we follow another strategy. In order to systematically use the rich information
on product categories, we first estimate the effect of distance on probability of having a
transaction separately for each product category and then proceed with a second-stage
analysis using the estimated marginal effects from individual product category regressions.
14
We perform the following regression in our second-stage analysis of the marginal effects
estimated in the first-stage.
ME(Dij)p = γ0 + u1p (5)
Where ME(Dij)p’s are the estimated marginal effects of distance for different product
categories p. We weight the observations with the inverse of the standard errors of the
marginal effects in order to control for imprecisions. γ0 is then can be interpreted as the
weighted-average distance effect. u1p is the error term.
Finally in order to investigate how the distance effect changes according to the differ-
ences in observable characteristics of advertisements, users and products, we add product
category averages into the equation 5.
ME(Dij)p = δ0 + δ1Pp + u2p (6)
Where Pp is average product category characteristics: share of different user types,
share of different product states, maximum bid and the number of photos. u2p is the
error term. δ1 then shows how the distance effect changes according to the differences in
characteristics of advertisements, users and products.
4 Results
We perform the logit estimation in equation 1 separately for each product category and
calculate the corresponding marginal effects. The results are summarized in Figure 7
below. Figure 7 plots the distribution of the estimated marginal effects from the individual
logit models first for the mean distance at the sample, and then for fixed values of 1km,
5km, 10km, 20km, 40km, 80km and 160km, respectively. For all of the product categories
we find a negative estimate, suggesting that as the distance between two postcode areas
increases, the probability of having a transaction decreases. The estimated marginal
effects change from -0.008 to 0 where on average it is around -0.0016. Some of the
products with near-zero effects are small items: baby clothing, post-stamps and coins,
15

books, cds and dvds, and expensive items: motors and luxurious automobiles. For such
products the distance between buyers and sellers seems to have no effect at all. Some of
the products categories with the strongest distance effects are bicycles, houses, general
automobiles, home appliances and computers.
Figure 7: Distribution of the marginal effect over product categories
020
040
060
080
0D
ensi
ty
−.006 −.004 −.002 0Marginal effects (at mean) for the coefficient estimates of distance
DensityMean marginal effect
010
020
030
040
050
0D
ensi
ty−.01 −.008 −.006 −.004 −.002 0
Marginal effects (at 1 km) for the coefficient estimates of distance
DensityMean marginal effect
010
020
030
040
050
0D
ensi
ty
−.01 −.008 −.006 −.004 −.002 0Marginal effects (at 5 km) for the coefficient estimates of distance
DensityMean marginal effect
010
020
030
040
050
0D
ensi
ty
−.01 −.008 −.006 −.004 −.002 0Marginal effects (at 10 km) for the coefficient estimates of distance
DensityMean marginal effect
16

Figure 7 continued0
100
200
300
400
500
Den
sity
−.01 −.008 −.006 −.004 −.002 0Marginal effects (at 20 km) for the coefficient estimates of distance
DensityMean marginal effect
010
020
030
040
050
0D
ensi
ty
−.01 −.008 −.006 −.004 −.002 0Marginal effects (at 40 km) for the coefficient estimates of distance
DensityMean marginal effect
020
040
060
0D
ensi
ty
−.01 −.008 −.006 −.004 −.002 0Marginal effects (at 80 km) for the coefficient estimates of distance
DensityMean marginal effect
020
040
060
080
010
00D
ensi
ty
−.01 −.008 −.006 −.004 −.002 0Marginal effects (at 160 km) for the coefficient estimates of distance
DensityMean marginal effect
In order to see how the marginal effect changes with the fix values of distance, we also
calculate the marginal effects for each product category for all distances from 1 to 200 km.
Figure 8 displays the average marginal effects across product categories. Marginal effect
of distance increases in magnitude up to 75km. For distances larger than 75km, marginal
effect decreases in magnitude as the distance increases, indicating that the distance effect
is non-linear and becomes smaller for large distances.
17

Figure 8: Average marginal effects across product categories calculated at different dis-tances
−.0
018
−.0
016
−.0
014
−.0
012
−.0
01A
vera
ge m
argi
nal e
ffect
acr
oss
prod
uct c
ateg
orie
s
0 50 100 150 200Distance in kilometers at which the marginal effect is calculated
The results of the second-stage analysis are presented in Table 1. In all estimations we
weight the observations with inverse standard errors. Therefore, the estimates with low
standard errors get higher weights. This is necessary in order to correct for the imprecision
of the estimates. In all estimations we regress the estimated marginal effects of distance
on a constant. The estimate for constant in row (a) shows that the weighted-average
distance effect is -0.0007, which indicates that 1 km increase in distance is associated
with 0.0007 percent-point decrease in the probability of having at least one transaction
on Marktplaats.nl. The results presented in other rows show that marginal effect of
distance slight increases as distance between two post-code areas increases up to 40km,
and then it starts decreasing for larger distances.
18

Table 1: Second-stage analysis of the distance effect over product categories
Distance values Marginal effectat Mean -0.0007∗∗∗ (0.0001)at distance=1km -0.0008∗∗∗ (0.0001)at distance=5km -0.0009∗∗∗ (0.0001)at distance=10km -0.0009∗∗∗ (0.0001)at distance=20km -0.0009∗∗∗ (0.0001)at distance=40km -0.0010∗∗∗ (0.0001)at distance=80km -0.0009∗∗∗ (0.0000)at distance=160km -0.0006∗∗∗ (0.0000)Standard errors in parentheses∗ p < 0.05, ∗∗ p < 0.01, ∗∗∗ p < 0.001Weights: Inverse of the standard errors.For post-code area fixed effects and year fixed effects, sample means are used in all estimations
Even though we find statistically significant effects, the magnitude of the distance
effect is small. An average marginal effect of approximately -0.0010 for short distances
suggests that 10 km increase in distance causes a decrease in the probability of having a
transaction by -0.01. Since the average probability of having a transaction in our data set
is 0.27, this suggest that 10 km increase in distance is associated with approximately a
modest four percent change in average probability. Note that this is an average marginal
effect. For certain product categories such as books and clothing this effect becomes zero,
and for certain product categories such as automobiles and home appliances the marginal
effect increases.
In Table 2 we add control variables for some advertisement characteristics, product
state and user types into the second-stage analysis. In each column we use the estimated
marginal effects obtained using the mean distances (row 1 of Table 1). Each control
variable is the average over product categories. Column (1) repeats the baseline result.
In column (2) we investigate how the distance effect is associated with the number of
photos placed with an advertisement. The coefficient estimate is positive and significant.
Therefore, we can see that for product categories where the average number of photos
in advertisements is higher, distance effect is found to be smaller. This is in line with
the effects of information frictions, as more pictures provide more information about the
product, which decreases the information asymmetry between the seller and the buyer.
19

Column (3) shows that the distance effect is smaller for advertisements with a higher
maximum bid. Column (4) indicates that the state of product is also significantly as-
sociated with the distance effect. Compared to the used products, the distance effect is
smaller for new products. This is also in line with the information frictions mechanism.
Used products can be considered as more uncertain; therefore, more prone to the distance
effect. Finally column (5) shows that compared to casual users, the distance effect is
smaller for the products sold by hobby users. Since these users have more experience in
placing advertisements on Marktplaats, they maybe know how to alleviate uncertainty
problem, which decreases the influence of information frictions. Insignificant results for
professional users can be due to the low number of observations.
20

Table 2: Second-stage analysis of the marginal effect over product categories
(1) (2) (3) (4) (5)M. Effect M. Effect M. Effect M. Effect M. Effectx10000 x10000 x10000 x10000 x10000
Photos 0.49∗∗∗ 0.47∗∗∗ 0.26∗∗∗ 0.68∗∗∗
(0.06) (0.07) (0.07) (0.17)
Mean bids 0.01 0.01 -0.01(0.01) (0.01) (0.01)
Product state (Reference: Used):
New 0.11∗∗∗ 0.10∗∗∗
(0.02) (0.02)
Good as new 0.03 0.01(0.02) (0.02)
Unknown 0.07∗∗∗ 0.05∗∗∗
(0.01) (0.01)
User type (Reference: Casual):
Hobby 0.06∗∗∗
(0.02)
Professional 0.01(0.02)
Constant -7.11∗∗∗ -9.01∗∗∗ -8.96∗∗∗ -12.35∗∗∗ -16.21∗∗∗
(0.25) (0.40) (0.42) (1.08) (1.54)N 1418 1418 1418 1418 1418Standard errors in parentheses∗ p < 0.05, ∗∗ p < 0.01, ∗∗∗ p < 0.001In all estimations the results at row (1) of Table 1 are used.In order to rescale the coefficients we used marginal effects x 10000 in these regressions.
The second stage of our analysis with linear regression uses the results from the first
stage with logit analysis. Even though we do not present both stages as a novel estima-
tion strategy, one might still question the consistency of the second stage results. In order
to check if our results are somehow coincidental due to the different distributional as-
sumptions between the two stages we perform a sensitivity analysis with pseudo distance
21

effects. For this analysis we first generate a random distance variable for each product
category with the same distribution as that of the observed data. We then perform our
logit estimation using the random distance variable, and use estimated marginal effects
again in the second stage. Figure 9 below displays the pseudo distance effects. As ex-
pected distribution is close to normal with a mean effect of 0. Once we use these marginal
effects in the second stage analysis, we have very small and insignificant effects. The
results show that our findings are not coincidental due to distributional assumptions in
two stages.
Figure 9: Distribution of the pseudo marginal effect over product categories
050
100
150
200
250
Fre
quen
cy
−.0001 −.00005 0 .00005 .0001Marginal effects (at mean) for the coefficient estimates of distance
FrequencyMean marginal effect
5 Conclusions
Our empirical analysis focusses on how distance affects the probability of having a trans-
action between two regions in the Netherlands. We use logit models in which we control
for year fixed effects as well as buyer and seller area fixed effect. We perform such logit
estimations separately for each product category, resulting in around 1400 distance effect
estimates. We then use these estimates in a second-stage analysis where observations are
weighted with inverse standard errors in order to report a single weighted-average distance
effect.
The regression results indicate that there is a modest distance effect. A ten kilometer
22

increase in distance between two regions causes a decrease in the probability of having
a transaction by -0.01. Considering that the average probability of having a transaction
between two post-code areas in our data set is 0.27, this effect suggest that ten kilome-
ter increase in distance is associated with approximately four percent change in average
probability. Moreover, we find that the distance effect is highly non-linear as such the
marginal effect of an increase in distance becomes smaller for larger distances.
The effect of distance on the probability of a transaction is smaller for advertisements
with a higher number of photos, advertisements placed by experienced users and adver-
tisements for new products in comparison to used products. Consequently, we conclude
that information frictions might be the driving force behind the distance effect on online
trade in the Netherlands.
The finding the distance effect is partly driven by information frictions can be in-
teresting from a policy point of view. Policies aiming at reducing information frictions
through better reputation building mechanisms can result in a higher volume of online
trade. Moreover, this also suggest that as online platforms become more aware of the
role of information frictions they can change their user interfaces in a way that facilitates
information transfer between buyers and seller. For example, in case of Marktplaats, in-
troduction of a reputation building mechanism such as user reviews or response rates can
result in a decrease in the overall distance effect and an increase in the total volume of
transactions.
23

ReferencesAgrawal, A. K., C. Catalini, and A. Goldfarb (2011). The georaphy of crowdfunding. National
Bureau of Economic Research (No. w16820).
Allen, T. (2014). Information frictions in trade. Econometrica 82 (6), 2041–2083.
Anderson, J. E. and E. van Wincoop (2003). Gravity with gravitas: A solution to the borderpuzzle. the american economic review. 93 (1), 170–192.
Anderson, J. E. and Y. V. Yotov (2012). Gold standard gravity. Technical report, NationalBureau of Economic Research.
Baier, S. L. and J. H. Bergstrand (2009). Bonus vetus ols: A simple method for approxi-mating international trade-cost effects using the gravity equation. Journal of InternationalEconomics 77 (1), 77–85.
Carrere, C., J. De Melo, and J. Wilson (2013). The distance puzzle and low-income countries:An update. Journal of Economic Surveys 27 (4), 717–742.
Chaney, T. (2013). The gravity equation in international trade: An explanation. Technicalreport, National Bureau of Economic Research.
Disdier, A. C. and K. Head (2008a). The puzzling persistence of the distance effect on bilateraltrade. The Review of Economics and Statistics 90 (1), 37–48.
Disdier, A.-C. and K. Head (2008b). The puzzling persistence of the distance effect on bilateraltrade. The Review of Economics and statistics 90 (1), 37–48.
Hortacsu, A., F. Martinez-Jerez, and J. Douglas (2009). The geography of trade in onlinetransactions: Evidence from ebay and mercadolibre. American Economic Journal: Microeco-nomics 1 (1), 53–74.
Leamer, E. (2007). A flat world, a level playing field, a small world after all, or none of theabove?: A review of thomas l. friedman’s the world is flat. Journal of Economic Literature,XLV , 83–126.
Leamer, E. E. and J. Levinsohn (1995). International trade theory: the evidence. Handbook ofinternational economics 3, 1339–1394.
Lendle, A., M. Olarreaga, S. Schropp, and P. L. Vezina (2016). There goes gravity: ebay andthe death of distance. The Economic Journal 126 (591), 406–441.
Lieber, E. and C. Syverson (2012). Online versus offline competition. Oxford handbook of thedigital economy 189.
Silva, J. S., S. Tenreyro, and K. Wei (2014). Estimating the extensive margin of trade. Journalof International Economics 93 (1), 67 – 75.
Zentner, A. (2008). Online sales, internet use, file sharing, and the decline of retail musicspeciality stores. Information Economics and Policy 20, 288–300.
24


![Photoelectric effect [45 marks] - Peda.net](https://static.fdocuments.in/doc/165x107/61869499ebec7b11d64c02eb/photoelectric-eect-45-marks-pedanet.jpg)