The Ecosystem-Economy Relationship: Insights … Ecosystem-Economy Relationship: Insights from Six...
90
The Ecosystem-Economy Relationship: Insights from Six Forested LTER Sites A Report to the National Science Foundation Grant No. DEB-9416809 Paul N. Courant, Ernie Niemi, and W. Ed Whitelaw November, 1997 -. . . .
Transcript of The Ecosystem-Economy Relationship: Insights … Ecosystem-Economy Relationship: Insights from Six...
The Ecosystem-Economy Relationship:Insights from Six Forested LTER Sites
A Report to the National Science Foundation
Grant No. DEB-9416809
Paul N. Courant, Ernie Niemi, and W. Ed Whitelaw
November, 1997
-. . . .

Whitelaw, E. 1997. Presentation to the Pacific Northwest Regional Economic Conference.Spokane, Washington. April.
Whitelaw, E. 1997. Presentation to the Pacific Northwest Chapter of Wetland Scientistsand the Society for Ecological Restoration. Corvallis, Oregon. May.
Whitelaw, E. 1997. Presentation to the Western Economic Association InternationalConference. Seattle, Washington. July.
2

CONTENTS
1 Introduction ................................................................................................................................ 4
II. A Conceptual Framework of the Forest-Economy Relationship ................................................ 6
A. Ecosystem-Economy Interactions ........................................................................................6
B. The Competing Demands for Forest Resources................................................................. 1 1
Ill. Analytical Issues...................................................................................................................... 1 8
A. Defining the Relevant Economy ......................................................................................... 1 8
6. Relevant Variables: Economic Value, Impact, and Equity .................................................. 25
C. Relevant Time Periods ........................................................................................................ 26
D. Economic Base Models ...................................................................................................... 28
E Autonomous Forces .......................................................................................................... 30
F. Sustainability and Congestibility ......................................................................................... 33
Iv. Six Case-Study Forests, Regions, and Competing Demands .................................................. 35
V. Assessing the Demands for Forest Resources: The Timber Industry .................................... 42.
A. Forest Land and Timberland Resources ............................................................................42
E3. Timber Production and Prices ............................................................................................4 4
C. Timber-Industry Employment and Incomes.........................................................................47
D. Timber’s Role in the Overall Economy ................................................................................52
E Summary............................................................................................................................ 5 5
VI. Assessing the Demands for Forest Resources: Demands Competing with the
Timber Industry.I..................................................................................................................... 56 c. .
A. Subsidies to the Timber Industry ........................................................................................56
B . Negative Externalities of Timber Production ....................................................................... 58
C. Consumption Amenities May Affect Locational Decisions of Households ....................... .62
D. Intrinsic Values Associated with Forested Ecosystems ................................................... 67
VII. Conclusions ............................................................................................................................. 71
A. Findings............................................ ..Y .............................................................................. 71
B. Recommendations .............................................................................................................. 73
VlIlXeferences .............................................................................................................................. 76
3..

I. INTRODUCTION
The debate over forest-management policy in the U.S. often is cast as a choice betweenjobs and [pick the environmental attribute of your choice].’ The purpose of this paper isneither to rehash nor to characterize these conflicts, but to discuss insights into them thathave emerged from an examination of the forest-economy relationship in different regionsof the U.S. Specifically, we examine the forest-economy relationship associated with six ofthe Long Term Ecosystem Research (LTER) sites: Bonanza Creek, Alaska; H.J. Andrews,Oregon; Sevilleta, New Mexico; Coweeta, North Carolina; Northern Temperate Lakes,Wisconsin, and Hubbard Brook, New Hampshire.
Decades ago, the jobs-vs.-environment tradeoff made more sense. It was not a huge errorto conclude that economic demand for forest resources came only from the extractiveconsumption of forest resources and development of forest lands. Usually, the allocation offorest resources to one of these uses significantly did not deprive the economy of otherbenefits and other jobs. Today, however, economic tradeoffi are more complex. Thecompetition for forest resources is more diverse and any forest-management decision islikely to promote some economic benefits, jobs, and environmental attributes at theexpense of others. The conventional demands of logging, urban development, irrigation,graziwz, mining, and road building compete more with one another and have been joinedby widespread demand for both goods, such as clean water, and services, such asrecreational opportunities. Additional demands have materialized with the concerns ofscientists and the public about the environmental impacts of forest use.
In short, it seems safe to say that competing demands exist, more or less, for the resourcesof every forested ecosystem, watershed, or other environmental unit in the U.S. Virtuallyany decision allocating resources to one component of the economy inevitably deprivesanother, so that some demands for goods or services are met while others are not, somegroups see an increase in employment opportunities or otherwise experience an increasein their standard of living while others experience a decrease, and some perceive that thedecision is fair while others see it as unfair. Thus, the characterization of forest-management issues as a contest between jobs and the environment is too simple.Competing allocations of forest resources represent alternative bundles of jobs, e
environmental quality, winners, and losers.
This report represents a component of the National Science Foundation’s initial efforts to(a) integrate economics and other social sciences into the LTER program, and (b) compareand contrast the characteristics across multiple LTER sites. As such, it is largely a scopingstudy to summarize the relevant literature, clarify important relationships, and identifyimportant research needs. The research proposal (DEB94-16809) underlying this reporthad three, objectives:
’ SZC, for example, Forest Ecosystem Management Assessment Team (1993), Gcrte (1992), andLippke and Conway (1994).
4
Descriptive objective: to develop a technically sound though intuitively accessibleframework and language for describing and eventually assessing the multiplerelationships between a forested ecosystem and a regional economy that can beapplied to different ecosystems and regional economies.
Explanatory objective: to improve understanding of the factors that influence themultiple relationships between forested ecosystems and regional economies.
Institutional-communicative objective: to lay the institutional foundation for (1)providing resource managers, policymakers, and the public with effective tools fordescribing and assessing the economic effects of changes in resource-managementpolicy, (2) undertaking further cross-site research regarding the relationshipsbetween ecosystems and regional economies, and (3) integrating economics research
Most of this report focuses on our descriptive and explanatory findings. Relying on readilyavailable data, we describe the forest-economy relationship as it exists in six widelydispersed sections of the U.S. One of our major Endings is that there are importantsimilarities in the fundamental, structural components of this relationship as one movesamong the six regions. In Chapter II we conceptualize these components into a frameworkthat explains four major types of competing demands for forest resources. In theremainder of the report we apply the conceptual framework to the six case-study regions.We &st provide some background on each case study (Chapter III) and then (Chapter IV)describe the economic importance of a major, historically important, extractive activity ateach site. In most cases, this is the industrial production of timber. In Chapter V we assessthe timber industry’s demand for forest resources, and in Chapter VI we describe theimportant competing demands for forest resources. In Chapter VII we offer someconcluding remarks regarding the implications of our findings for forest management andfuture research.
c
a-
-:_. .
5
II. A CONCEPTUAL FRAMEWORK OF THE FOREST-ECONOMYRELATIONSHIP
Understanding the economic effects of policies and practices that affect forest use-achange in ecosystem management broadly defined-requires an analytical framework fortracing the change through both the demand and supply sides of various markets andindustries in both the long run and the short run.2 We elsewhere report on our efforts todevelop such a framework, the centerpiece of which is a typology of the competingdemands for forest resources (Courant et al. 199713). Here, to conserve space, wesummarize the framework briefly and then discuss how it helps clarify several forest-management issues.
A. Ecosystem-Economy Interactions
A forested ecosystem and the surrounding economy continuously interact with oneanother in multiple, complicated ways.3 Human activities associated with the production,distribution, and consumption of wealth derive goods and services from the ecosystem and,in doing so, they alter the ecosystem’s physical and biological characteristics. Thesechanges, in turn, affect the stock of goods and services available for enhancing humanstandards of living, thereby altering future human activities, and so the cycle of
.interactions between the ecological system and economic system continues. Hence, theevaluation of what the economy would look like with a given forest-management policy oractivity is, at least in principle, a complicated, dynamic exercise.
Forested ecosystems play important roles in the economy by producing things that benefithumans, things that impose costs on humans, or both.4 That is, forests affect our well-being, either along paths commonly associated with the economy and our standard of
2 This definitionof ecosystem management may cause some confusion for forest ecologists, who see *ecosystem management as an intentional effort to sustain a full set of ecological functions andprocesses while producing goods, services, and social benefits ( Personal communication with FredSwanson 1997). We deliberately take the broader perspective, recognizing that many decisionssffecting forest ecosystems, driven by the economic forces and incentives we describe in this report,are not consistent with the ecologists’ objectives.’ For a wide-ranging discussion of the ecosystem’s economic importance, see Daily (1997).4 ‘Ibis formulation of the interaction between ecosystems and the economy inherently places humansat the center and views forests as important only insofar as they affect the quality of life of humansociety, or parts thereof. We recognize that many find this anthropocentric view, at best, incomplete,for it ignores the biocentric view that a forested ecosystem enhanced by a forest-management policyhas value in and of itself. It also arti&islly views humans es exogenous to the ecosystem. Wenarrow our scope not just to keep 0i.u task from becoming i&actable but also because the focus onan ecosystem’s contribution to human quality of life mirrors a central consideration underlyinghuman actions affecting the ecosystem. We take a broad view, however, of the ways in which theec&i@tem affects human standards of living and quality of life, inclu&g humans’ aesthetic,cultural, and spiritual values and motivations.
6
living-subsistence, commercial production, and property development--or along paths noless important economically, but associated with the quality of life in our communities-attractive neighborhoods, recreation, and the presence of wildlife. In addition, there areimportant interactions with spirituality/religion, aesthetics, community comity, and senseof obligation to future generations. In short, forests are important to the economy becausethey can affect-and be affected by---all types of human activity. Although our focus is onforested ecosystems, this same observation seems to apply equally to others.
Describing the economically important products derived from a forest is not always astraightforward task. One approach combines ecological with economic concepts anddistinguishes among ecosystem goods, functions, and states (Quigley et al. 1996). Under
Box 2.1: Identifying EconomicallyImportant Products via Ecological
Functions of, e.g., Forested Wetlandsand Rivers
1 Help sustain the local and global web oflife.
1 Store and convey flood water anddiminish peak flows.
1 Provide habitat for fish, shellfish,waterfowl, and other wildlife.
1 Reduce erosion during flooding.1 Improve water quality by removing
sediment, nutrients, and chemicalcontaminants.
) Produce fiber, e.g., timber, and food e.g.,wild rice, for human consumption.
m Supply water for municipal and industrialuse.
B Provide recreational opportunities, e.g.,fishing, hunting, and viewing wildlife.
this approach, e&y&e& goods are -specificcomponents of ecosystems that might beextracted (e.g., timber or forage) or remain insitu, as when sections of a forest are used forrecreational hiking, and a waterfall is anotable landmark. Ecosystem functions areeconomically important processes, such as thestabilization of soils on upland slopes or ariparian zone’s filtration of sediment in runofffrom uplands. Box 2.1 illustrates, for example,the ecosystem functions associated withforested wetlands and rivers. Ecosystem statesare economically import*nt systemic orintegrated characteristics, such as thoseassociated with healthy ecosystems, sceniclandscapes, and watersheds with low floodrisk. Although this approach appears ix&allyto embody a seamless and comprehensivetransition from ecologic to economic issues, itdeceives us. It emphasizes only the good-those things from an ecosystem thatcontribute positively to the economy-andobscures or ignores the bad-those thingssuch as floods, fires, and pests that contributenegatively.
b Provide aesthetic value, e.g., open spaceand natural Scenery.
Source: Baskin (1997) and National ResearchCouncil (1992).
c
Two other approaches have similar problems.One categorizes all ecosystem products as
goods and services, and the other treats them as amenities. (Box 2.2 illustrates, forexample, the goods and services derived from forested petlands and rivers.) Neitherapproach distinguishes clearly between negatives and positives. And neither distinguishesthe state of the ecosystem itself from the separate flows of goods, services, and amenitiesfrom the ecosystem.
In our approach, we opt for the conventional economics shorthand and use either goodsand services or amenities to describe those attributes of forested ecosystems that are
a-
7
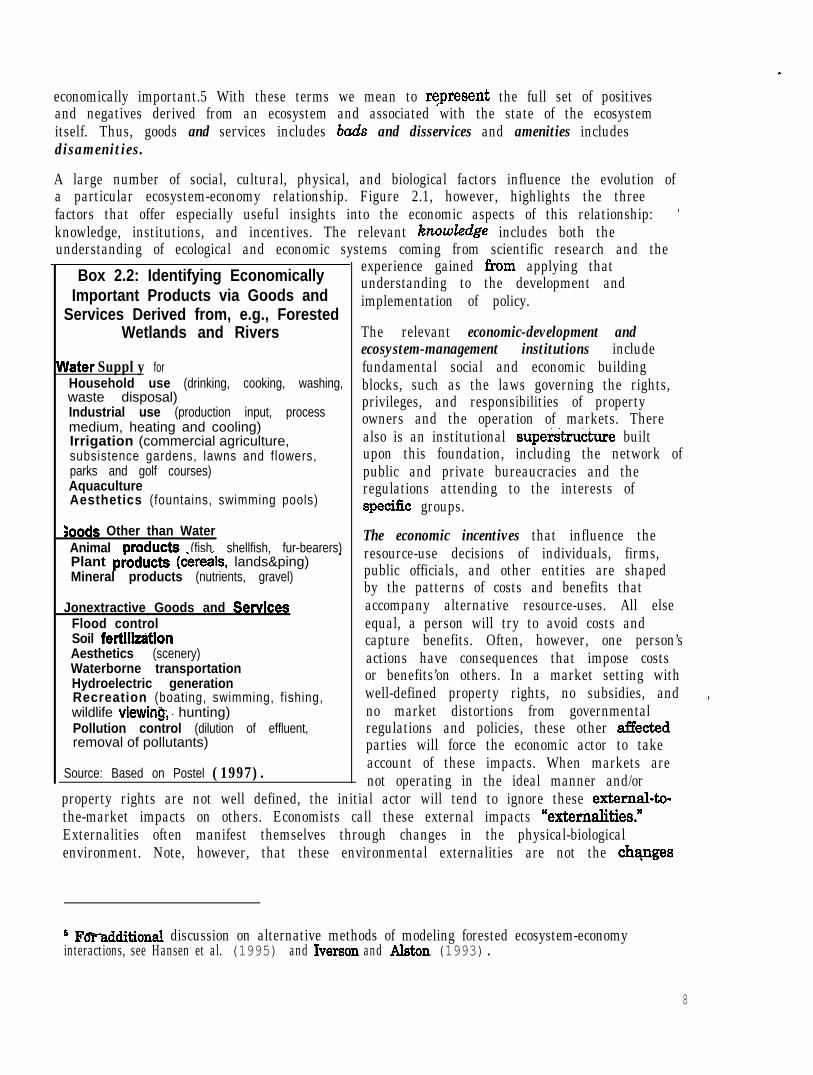
A large number of social, cultural, physical, and biological factors influence the evolution ofa particular ecosystem-economy relationship. Figure 2.1, however, highlights the threefactors that offer especially useful insights into the economic aspects of this relationship: ’knowledge, institutions, and incentives. The relevant knoz.uZedge includes both theunderstanding of ecological and economic systems coming from scientific research and the
Box 2.2: Identifying Economically experience gained &om applying that
Important Products via Goods andunderstanding to the development and
Services Derived from, e.g., Forestedimplementation of policy.
Wetlands and Rivers The relevant economic-development andecosystem-management institutions include
Uater Supply for fundamental social and economic buildingHousehold use (drinking, cooking, washing,waste disposal)
blocks, such as the laws governing the rights,
Industrial use (production input, processprivileges, and responsibilities of property
medium, heating and cooling) owners and the operation of markets. ThereIrrigation (commercial agriculture, also is an institutional supe&ru&re builtsubsistence gardens, lawns and flowers, upon this foundation, including the network ofparks and golf courses) public and private bureaucracies and theAquacultureAesthetics (fountains, swimming pools)
regulations attending to the interests ofspetic groups.
;oods Other than WaterAnimal oroducts (fish. shellfish, fur-bearers)
The economic incentives that influence the
Plant pioducts (c‘ere& lands&ping) -resource-use decisions of individuals, firms,
Mineral products (nutrients, gravel) public officials, and other entities are shapedby the patterns of costs and benefits that
Jonextractive Goods and Senrices accompany alternative resource-uses. All elseFlood control equal, a person will try to avoid costs andSoil fertiltitionAesthetics (scenery)
capture benefits. Often, however, one person’s
Waterborne transportationactions have consequences that impose costs
Hydroelectric generation or benefits’on others. In a market setting withRecreation (boating, swimming, f ishing, well-defined property rights, no subsidies, and ,wildlife viewins;. hunting) no market distortions from governmentalPollution control (dilution of effluent, regulations and policies, these other affectedremoval of pollutants) parties will force the economic actor to take
Source: Based on Postel (1997).account of these impacts. When markets arenot operating in the ideal manner and/or
property rights are not well defined, the initial actor will tend to ignore these external-to-the-market impacts on others. Economists call these external impacts “ex%ernalities.”Externalities often manifest themselves through changes in the physical-biologicalenvironment. Note, however, that these environmental externalities are not the chqnges
economically important.5 With these terms we mean to rgpresent the full set of positivesand negatives derived from an ecosystem and associated with the state of the ecosystemitself. Thus, goods and services includes bads and disservices and amenities includesdisamenities.
6 FsPadditional discussion on alternative methods of modeling forested ecosystem-economyinteractions, see Hansen et al. (1995) and Iverson and Al&m (1993).
8
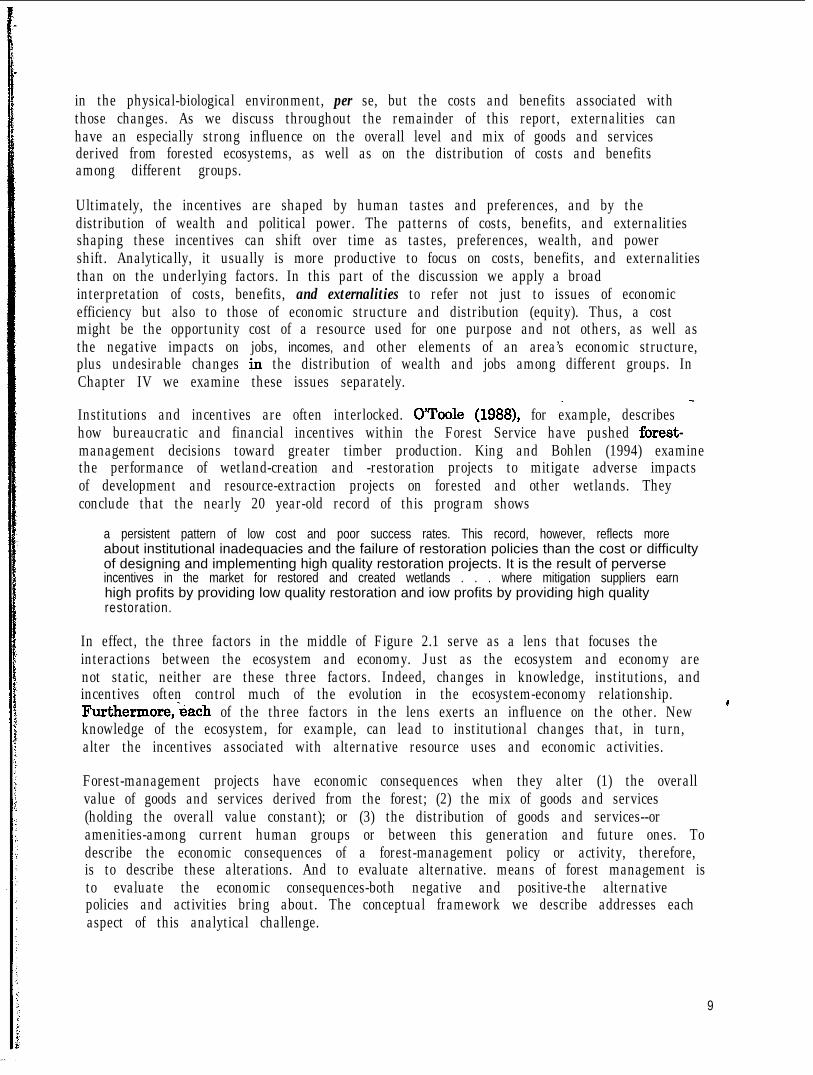
in the physical-biological environment, per se, but the costs and benefits associated withthose changes. As we discuss throughout the remainder of this report, externalities canhave an especially strong influence on the overall level and mix of goods and servicesderived from forested ecosystems, as well as on the distribution of costs and benefitsamong different groups.
Ultimately, the incentives are shaped by human tastes and preferences, and by thedistribution of wealth and political power. The patterns of costs, benefits, and externalitiesshaping these incentives can shift over time as tastes, preferences, wealth, and powershift. Analytically, it usually is more productive to focus on costs, benefits, and externalitiesthan on the underlying factors. In this part of the discussion we apply a broadinterpretation of costs, benefits, and externalities to refer not just to issues of economicefficiency but also to those of economic structure and distribution (equity). Thus, a costmight be the opportunity cost of a resource used for one purpose and not others, as well asthe negative impacts on jobs, incomes, and other elements of an area’s economic structure,plus undesirable changes in the distribution of wealth and jobs among different groups. InChapter IV we examine these issues separately.
Institutions and incentives are often interlocked. CYToole (1988), for example, describeshow bureaucratic and financial incentives within the Forest Service have pushed forest-management decisions toward greater timber production. King and Bohlen (1994) examinethe performance of wetland-creation and -restoration projects to mitigate adverse impactsof development and resource-extraction projects on forested and other wetlands. Theyconclude that the nearly 20 year-old record of this program shows
a persistent pattern of low cost and poor success rates. This record, however, reflects moreabout institutional inadequacies and the failure of restoration policies than the cost or difficultyof designing and implementing high quality restoration projects. It is the result of perverseincentives in the market for restored and created wetlands . . . where mitigation suppliers earnhigh profits by providing low quality restoration and iow profits by providing high qualityrestoration.
In effect, the three factors in the middle of Figure 2.1 serve as a lens that focuses theinteractions between the ecosystem and economy. Just as the ecosystem and economy arenot static, neither are these three factors. Indeed, changes in knowledge, institutions, andincentives often control much of the evolution in the ecosystem-economy relationship.Furthermore,‘each of the three factors in the lens exerts an influence on the other. New
F
knowledge of the ecosystem, for example, can lead to institutional changes that, in turn,alter the incentives associated with alternative resource uses and economic activities.
Forest-management projects have economic consequences when they alter (1) the overallvalue of goods and services derived from the forest; (2) the mix of goods and services(holding the overall value constant); or (3) the distribution of goods and services--oramenities-among current human groups or between this generation and future ones. Todescribe the economic consequences of a forest-management policy or activity, therefore,is to describe these alterations. And to evaluate alternative. means of forest management isto evaluate the economic consequences-both negative and positive-the alternative Ipolicies and activities bring about. The conceptual framework we describe addresses eachaspect of this analytical challenge.
9

Ecosystem
Economics,Economics,Markets, LegalMarkets, Legal
Figure 2.1: Ecosystem-Economy Interactions AreInfluenced by Knowledge, Institutions, and Incentives
Externalities,Ownership, SubsidiesRegulations
Economy
The dynamic character of each of the components of Figure 2.1 has important implicationsfor assessing the economic consequences of forest management. The greater theuncertainty about the potential change in any component, the less one can rely on the past ’as a reliable predictor of the future. This is especially true if more than one component ischanging, which is typically the case in the United States today, where rapid growth inknowledge about ecosystems indicates that many of them are far less resilient than in thepast (Mooney and Ehrlich 199’7), the extraction of resource commodities is playing asmaller economic role relative to services (more of this later in the report), and the nation,through the debate over the Endangered Species Act and other resource-and-environmental-management acts, is engaged in a wide-ranging examination of theinstitutions governing the rights, privileges, and responsibilities of property owners. See,for example, Knight and Bates (1995), and Perry and Amaranthus (1997).
Only where all the components of Figure 2.1 are highly stable or predictable-a rareevent-can an analyst justXably rely on techniques that take a static view of the economy.Inmost cases, the economic consequences of forest-management decisions will evolve overtime, shaped by (a) external economic and ecological forces independent of the decision; (b)
10
economic and ecological changes independent of the decision; and (c) economic andecological response to the decision. Using Figure 2.1 as a guide, one should account forexternal and local sources of dynamism for each of the five components in Figure 2.1, theecological and economic systems plus the three factors in the middle of the lens.
In the next chapter, we extend the conceptual framework of Figure 2.1 by adding ananalytical framework for addressing and understanding the right-hand element of the lensin Figure 2.1. Specifically, we explain an approach for comprehensively describing thecosts, benefits, and externalities associated with alternative uses of forest resources.
B. The Competing Demands for Forest Resources
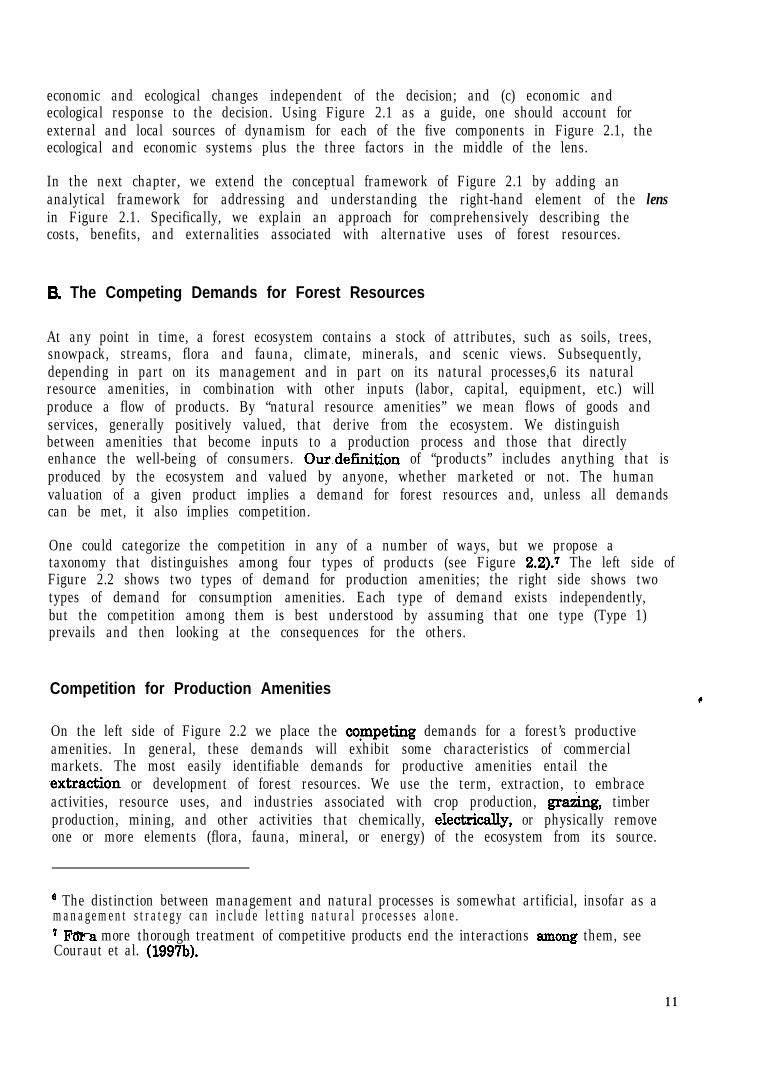
At any point in time, a forest ecosystem contains a stock of attributes, such as soils, trees,snowpack, streams, flora and fauna, climate, minerals, and scenic views. Subsequently,depending in part on its management and in part on its natural processes,6 its naturalresource amenities, in combination with other inputs (labor, capital, equipment, etc.) willproduce a flow of products. By “natural resource amenities” we mean flows of goods andservices, generally positively valued, that derive from the ecosystem. We distinguishbetween amenities that become inputs to a production process and those that directlyenhance the well-being of consumers. Our.definition of “products” includes anything that isproduced by the ecosystem and valued by anyone, whether marketed or not. The humanvaluation of a given product implies a demand for forest resources and, unless all demandscan be met, it also implies competition.
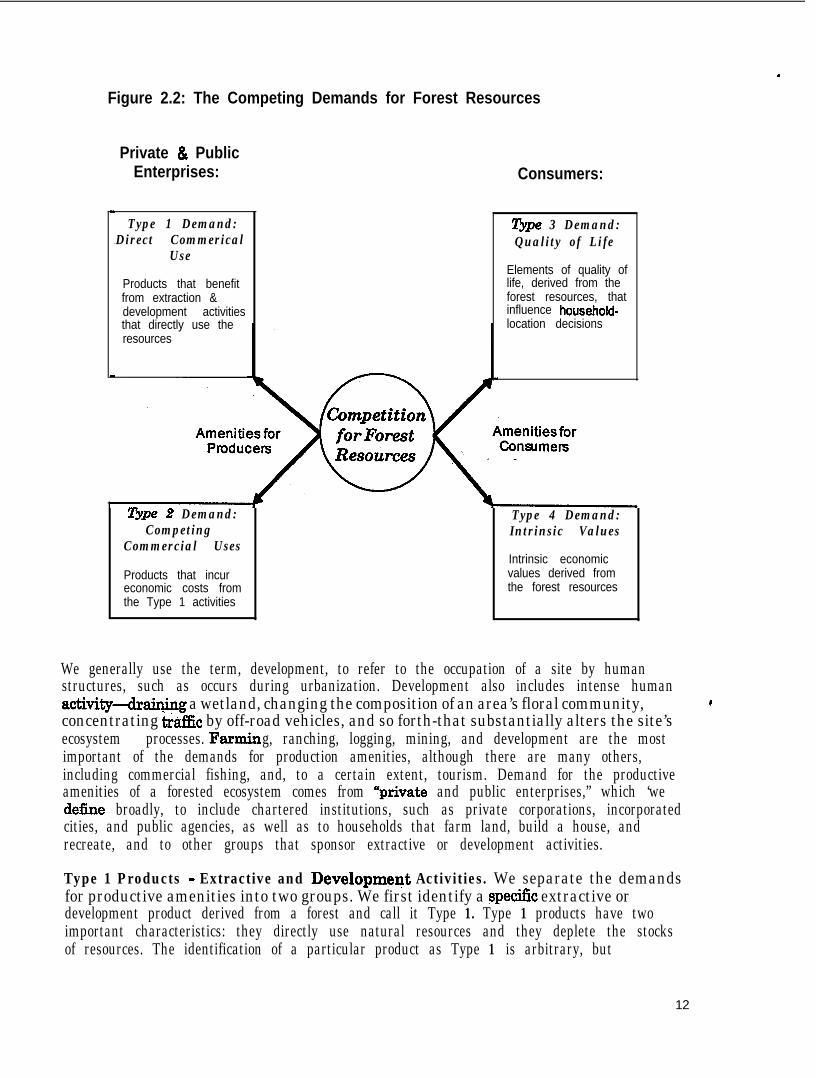
One could categorize the competition in any of a number of ways, but we propose ataxonomy that distinguishes among four types of products (see Figure 2.2).7 The left side ofFigure 2.2 shows two types of demand for production amenities; the right side shows twotypes of demand for consumption amenities. Each type of demand exists independently,but the competition among them is best understood by assuming that one type (Type 1)prevails and then looking at the consequences for the others.
Competition for Production Amenities
On the left side of Figure 2.2 we place the cqmpeting demands for a forest’s productiveamenities. In general, these demands will exhibit some characteristics of commercialmarkets. The most easily identifiable demands for productive amenities entail the.extraction or development of forest resources. We use the term, extraction, to embraceactivities, resource uses, and industries associated with crop production, gr&g, timberproduction, mining, and other activities that chemically, electrically, or physically removeone or more elements (flora, fauna, mineral, or energy) of the ecosystem from its source.
6 The distinction between management and natural processes is somewhat artificial, insofar as amanagement strategy can include letting natural processes alone.’ FWa more thorough treatment of competitive products end the interactions among them, seeCouraut et al. (199733).
11
.
Figure 2.2: The Competing Demands for Forest Resources
Private & PublicEnterprises: Consumers:
Type 1 Demand:Direct Commerical
Use
Products that benefitfrom extraction &development activitiesthat directly use theresources
Bpe 2 Demand:Competing
Commercial Uses
Products that incureconomic costs fromthe Type 1 activities
ripe 3 Demand:Quality of Life
Elements of quality oflife, derived from theforest resources, thatinfluence household-location decisions
Type 4 Demand:Intrinsic Values
Intrinsic economicvalues derived fromthe forest resources
We generally use the term, development, to refer to the occupation of a site by humanstructures, such as occurs during urbanization. Development also includes intense humanactivity--drain&g a wetland, changing the composition of an area’s floral community, cconcentrating t&t& by off-road vehicles, and so forth-that substantially alters the site’secosystem processes. Farming, ranching, logging, mining, and development are the mostimportant of the demands for production amenities, although there are many others,including commercial fishing, and, to a certain extent, tourism. Demand for the productiveamenities of a forested ecosystem comes from *private and public enterprises,” which ‘wedetie broadly, to include chartered institutions, such as private corporations, incorporatedcities, and public agencies, as well as to households that farm land, build a house, andrecreate, and to other groups that sponsor extractive or development activities.
Type 1 Products - Extractive and Developmeqt Activities. We separate the demandsfor productive amenities into two groups. We first identify a spetic extractive ordevelopment product derived from a forest and call it Type 1. Type 1 products have twoimportant characteristics: they directly use natural resources and they deplete the stocksof resources. The identification of a particular product as Type 1 is arbitrary, but
12

purposeful. This type of demand usually is associated with a familiar extractive industry,such as fkrming, ranching, logging, or mining, or with common development activities:developed recreation, urbanization, bridge construction, and the like. In general, only oneType 1 product benefits from a particular use of forest resources, but sometimes there maybe more than one. The construction and operation of a dam may benefit irrigators, barge ’companies, and consumers of hydroelectricity, for example, or logging may benefit thetimber industry and some sectors of the recreation industry (Quigley et al. 1996).
Type 2 Products - Products Upon Which Type 1 Production Imposes Costs. Afteridentifying’the products that benefit from a specific resource use, we then identify thosethat incur costs from that use, and call these Type 2 products. We purposefully distinguishbetween Type 1 and Type 2 products to drive home the message that there may becompetition, within the extractive and development sectors, for forest resources. Thismessage is important because, too often, the competition for forest resources ischaracterized as simply a jobs-vs.-environment contest between an industry seeking to usea resource as a productive input and those who want to protect the environment. Byhighlighting products that incur economic costs from extractive and developmentactivities, we emphasize the point that the positive consequences arising from one set ofextractive or development activities frequently has negative effects on one or more others.
, ..’There are three mechanisms by which production of outputs associated with extractive anddevelopment activities (Type 1 products) can impose costs on Type 2 products: directdisplacement of resource-related production; displacement through the existence ofnegative externalities; and subsidies. The reader should recognize that, given the arbitraryselection of the Type 1 product, these mechanisms apply equally to the Type 2 products. Italso is important to note that, although we discuss these mechanisms here in the contextof the competition between different demands for a forest’s production amenities, the somemechanisms apply to all types of demand for these resources. It is only to conserve spacethat we do not repeat the discussion as we subsequently address the remaining elementsof Figure 2.2.
Direct displacement occurs when two or more enterprises compete directly for the naturalresource amenities of a forest. In this setting, an increase in the output of a given Type 1product, other things equal, will reduce the output of a Type 2 product by reducing thesupply of some ecosystem amenities for Type 2 production. Direct displacement generallyoccurs through-a formal or informal competitive-bidding process. Through this process, a e
Type 1 use of a r&source decreases the resource’s availability for use in the production ofsome Type 2 product. As a result, the Type 2 product becomes either more scarce or morecostly than would otherwise be the case. There currently is considerable concern in thePacific Northwest, for example, about the impacts of logging and related activities on thequality of surface water available downstream for municipal-industrial water use (Bernton1996). With reductions in water quality, the affected water utility would have to curtailproduction or incur additional costs to obtain water from other sources.
Displacement also occurs when the production of a Type 1 product is accompanied bynegative external3ies.s Negative externalities are ubiquitous when Type 1 activities affect
8 time cases externalities are positive. We would include such cases under the rubric of economicimpacts of Type 1 production.
13
the quality of air, water, habitat and landscapes.9 Increased sedimentation firom timberproduction, for example, can create additional costs for downstream fisheries, landowners,municipal-industrial water users, and public agencies (Meehan 1991; Reid 1993). Thesecosts arise not because of competitive bidding for the use of the relevant resource butbecause the downstream effects are external to the incentives facing those who determinethe upstream economic activities. Externalities are an important source of market failure.Generally, solving market failures requires public policies that attempt to make individualincentives compatible with collective objectives (Field 1997; Goodstein 1995; Tietenberg1996).
The third mechanism by which a Type 1 use of forest resources can impose costs on otherproducers comes into play when government subsidies distort the prices or productionlevels of a Type 1 product. Similar distortions can arise from regulatory and other actions,such as trade policy, but, to conserve space, we lump them all under the rubric of subsidies.Subsidies draw money from, and thereby restrict the output and profits of, otherproducers, including some who have no other relationship to the Type 1 product or its useof forest resources. Hence, subsidies are akin to externahties. Subsidies can arise in threeways. One entails subsidies to the Type 1 product itse& for example, price-supportpayments for certain agricultural products (Environmental Working Group 1995; Offuttand Shoemaker 1990). Another occurs, through subsidies to the Type 1 use of a resource asa productive input, for example, below-cost pricing for timber, forage;hydropower;andnavigation derived from federal lands and facilities (Council of Economic Advisers 1994;U.S. House of Representatives 1994). Subsidies also can be directed at labor, capital, orsome other nonresource input to the Type 1 production process (Black and SmiIhe 1988;Meyer and Rosenbaum 1996; Nauth 1992).
Subsidies may be conspicuous, as when states give tax concessions to Type 1 industries orprotect them from competition (Black and SmiIIie 1988; Nauth 1992), but they may bemore hidden, as when firms in other sectors of the economy subsidize (relative to actuarialcost) unemployment insurance in some highly cyclical resource-extraction industries(Meyer and Rosenbaum 1996). Regardless of their visibility, subsidies suppress the level ofType 2 production and lower the well-being of those who otherwise would benefit from theforgone production and enjoyment of Type 2 products. These effects may materialize in thevicinity of the forest resources used in the production of the Type 1 product, but notnecessarily.
Q As one might expect, there is an extensive literature regarding when a particular cost or benefit isor is not an externality, or whether a particular price or production phenomenon stems fromdisplacement, an externality, or a subsidy. Any assessment of displacement, externalities, andsubsidies should be accompanied by a discussion of the vague boundaries among them. Baumol andOates (1988 pp. M-15), in an important text on environmental externalities, provide a usefulbackground for such discussion:“The externality is in some ways a straightforward concept; yet, in others, it is extraordinarilyelusive. We know how to take it into account in our anaIysis, and we are aware of many of itsimplications, but, despite a number of illuminating attempts to define the notion, [footnote omitted]ongis left with the feeling that we still have not captured all its ramifications. Perhaps this doesnot matter greatly. . . . Ultimately, definitions are a matter of taste and convenience.”
.
14
Competition Directly from Consumers
On the left side of Figure 2.2, forest resources are economically important because theyare inputs in the production of other things, such as housing, transportation systems (e.g.,pallets), and hydroelectricity that consumers want to have. On the right side, theconnection between these resources and consumers is more direct. That is, consumersconsider these resources economically important for what they are and for how theydirectly contribute to consumers’ well-being. Figure 2.2 shows there are two types of
i demand for forest resources coming directly from consumers: one affects consumers’residential location decisions; the other does not.
Type 3 Products - Consumption Amenities and Residential Location. Sometimes aforest produces amenities, such as recreational opportunities, scenic vistas, and healthyenvironments, that contribute directly to the well-being of people who have access to them.In economic parlance, these are known as consumption amenities. Their contribution toconsumers’ well-being makes consumption amenities economically important in their ownright, but they also influence the location decisions of households and &ms (Knapp andGraves 1989; Mathur 1993; Mueser and Graves 1996), thus, adding to their economicinterest. We use the term, tie 3 products, to represent consumption amenities thatinfluence location decisions and, as Figure 2.2 shows, they represent a sign&ant sour&e ofcompetition for forest resources.
Economists’ explanation of why some consumption amenities can influence locationrevolves around the concept of consumer surplus. Whenever a consumer derives benefits(increases in well-being) from a good or service that exceed the costs the consumer pays toobtain it, the net benefit represents a net increase in well-being. This increment is calledconsumer surplus. It is important because, whenever the costs and benefits of a good orservice are equal, the consumer’s consumer surplus is zero and acquisition of the good orservice does not represent an increase in his or her well-being. Increases in consumers’well-being can occur only when they are able to obtain goods and services that have apositive consumer surplus.
In general, consumption amenities offer the prospect of positive consumer surplus. Thenearer that people live to such amenities, etter their access, and the lower.their costof taking advantage of them. Thus, consueconomic we&being-by living near forests
can increase their consumer surplus-their cat offer recreational opportunities, wildlife
viewing, and other amenities.
Whitelaw and Niemi (1989) have likene consumer surplus to a second paycheckresidents receive from living in a place they have-easy access to amenities, so thatthe total welfare of residents within corn stance of the amenities is the sum of thissecond paycheck plus the purchasing pow eir money income. The size of the secondpaytiheck affects behavior in the lo conomies by influencing householddemand for residential location. In ges’in the value of amenities must alsoaffect money wages and housing costs the real wage. All else equal, ifamenities in a region improve, people ove to that region, bidding housingprices up and wages down, until there rs n g e from further migration.
I 1 5

Y
*
.
That location-specific consumption amenities are an important influence in residentiallocation decisions is well documented.10 Much of this literature attempts to compute thesize of the second paycheck associated with particular amenities, or derived from living inspecific cities or states,yinferred from wage and housing cost differences associated withthose locations. The range is quite large. For example, Blomquist et al. (1988) find a rangeof over $5,000 per year per household for 253 urban counties in 1980. For technicalreasons, this probably overestimates the true range. Given that median personal incomeper household then was $17,710 (U.S. Department of Commerce and Bureau of theCensus 1995), however, it is clear that the second paycheck can be a significant fraction ofthe first one.
Essentially all of the existing literature on the value of amenities implicitly assumes thatthe amenity value is reflected in wages and prices in the same county or city as theamenity itself. This view probably is too restrictive. Natural-resource amenities a fewhours drive from an urban area also will plausibly contribute to the quality of life in thatarea, showing up as lower wages and higher housing costs at locations that are somedistance from the amenity itself. Furthermore, forest resources in one place can materiallyinfluence the quality and quantity of recreational opportunities and other amenities somedistance away.
As pointed out by Roback (1988) and others, lower real wages that arise from consumptionamenities act as a special type of production amenity for firms that are able to reduce theircosts by locating where wages are lower. This mechanism allows natural-resourceconsumption amenities to affect where goods and services are produced. Thus, thequantity and quality of natural resource amenities can affect the levels and types of jobs(and economic activities in general) throughout the local and regional economies, includingsectors with no direct link to the use of ecosystem resources.
It is important to recognize that, where amenity-driven growth is sufficiently strong, thepredictable outcome is that the amenities become congested. Congestion can occur quickly,especially where the residential, and then commercial and industrial, development initiallyattracted by an area’s amenities occurs without bearing the full cost it imposes on providingroads, schools, and other public services. In such cases, not only do the amenities thattriggered this process become congested, but they often also become degraded.
Some element&of an ecosystem can act as both a production and a consumption amenity. ’Thus, a forested mountainside can produce lumber (Type l), support a watershed that hascommercial value downstream (Type 2) and provide an environment for backpacking Crepe3). In some cases, the boundary between Type 2 and Type 3 products and other Type 1activities is ambiguous. To distinguish among them, we employ a general principle: When agiven amenity diminished by a Type 1 activity is used directly as an input into theproduction of a marketed good, the marketed good is a Type 2 product. To the extent thatpeople choose to live inor near the ecosystem to take advantage of recreational and
1o The early contributions are Rosen (1979) and Boback (1982). For more recent work on this topicsee Beeson (1991); Berger and Blomquist (1992); Blomquist et al. (1988); Brady (1995); Brown(1994); Browne (1984); Cooper (1994); Cusbing (1987); Figlio (1996); Gabriel et al. (1996); Gottlieb(1994); Greenwood et al. (no date); and Sherwood-Call (1994).
16
tourism opportunities, whether marketed or not, we count the location of such people (andits indirect economic effects) as arising from a Type 3 use of the natural resource.
Type 4 Products - Intrinsic Economic Value. The Type 4 products shown in Figure2.2 are ecosystem products people value for their intrinsic properties. Intrinsic values,often termed “existence values,” do not entail an explicit current use of the resource. 11IzThey arise whenever individuals place a value on maintaining the existence of a species,scenic waterfall, or other resource for its own sake, or on the prospect that the resourcewill be useful, for example, to future generations. Actions that increase the robustness ofthe resources, for example, by preventing degradation of critical habitat for an endangeredspecies or by ensuring the flow of the waterfall, increase the welfare of those concernedabout these issues, and actions that degrade the resources decrease this welfare.
Unlike the other three uses of ecosystem amenities that we have discussed, Type 4products, by themselves, are unlikely to have any manifest economic effect on jobs,income, or other indicators of economic activity. The forests of New England may be ofintrinsic value to some residents of Miami, Los Angeles, and other distant places, but theeffect of this on economic activity in the region of the forests will be small unless it isarticulated through the political system. Still, the resource aftects the real well-being ofreal people, and this well-being belongs in any comprehensive analysis of the value of theresource.r3 For some environmental issues, such as maintaining the biodiversity andintegrity of ecosystems passed to future generations, Type 4 values may be very large.
.
I1 We use the phrase, intrinsic value, because it is more accessible to a layperson than equivalentphrases, such as passive nonuse value, that economists commonly employ. It refers to valueseparate from the current or expected use of a resource, including both consumptive andnonconsumptive use. Economists have devised several approaches for dividing the intrinsic value ofa resource into component p’&rts. A common approach is to distinguish between option value andexistence value (Cicchetti and Wilde 1992). Option value is the value one derives fkom knowing thatthe resource will be available for one’s use in the future. Existence value can be either the inherentvalue one places On the existence of the resource, itself, or the vicarious value of knowing that theresource is or will be available for others. The vicarious value, of knowing that the resource will beavailable for future generations is commonly called bequest value. For the purposes of thisdiscussion it is not necessary to examine these components separately.a Some ecologl sts argue that none of the intrinsic value categories fully recognize the value of the life-support services ecosystems provide that make the earth habitable (Baskin 1997). Althoughconventional economists have attempted to include biological diversity in their calculations of thevalue of life support services, they have not been able to directly get at what it is worth to havespecies work together within ecosystems to provide these services. It could be argued that theyconstitute a fifth type of demand in our typology. Cn the other hand, a case could also be made thatwithout life-support services, Types l-4 would be faced with large problems. We do not debate thepoint here but, instead, expand the category of Type 4 products to include this life-support value.nWhilethereisgen eral agreement on the statement in the text as a matter of principle, theliterature is sharply divided on the question of whether such value can be accurately measured. SeeArrow et al. (1993); Castle et al. (1994); Coursey et al. (1987); Eberle and Hayden (1991); Gregoryet aL(1995); and Stevens et al. (1991).
c
1 7
l
III. ANALYTICAL ISSUES
The conceptual framework described in the preceding chapter brings into focus severalcritical issues that inevitably arise whenever one is analyzing the ecosystem-economyrelationship for forest resources. These include:
l Defining the spatial characteristics of the relevant economy.
l Selecting appropriate variables and time periods for measuring the economicconsequences of ecosystem-management policies and activities.
l Placing ecosystem-management decisions in the context of autonomous factorsinfluencing adjacent economies.
l Clarifying the rights and responsibilities of property owners.
l Understanding concerns about sustainability.
A. Defining the Relevant Economy
The competing demands for a forest’s resources, represent&l@ the foti’typei &demand ’ ‘.shown in Figure 2.2 (Chapter II), generally do not originate from a common set of workers,households, firms, communities, and regions. Each interest group exerts an influence onforest management through its own set of competitive mechanisms, operating throughmarkets, administrative proceedings, political contests, and other forums. Accordingly, oneshould not expect that the different types of competition will exhibit common geographicboundaries.
A general, but typical, illustration reinforces this conclusion. In a given situation, thecompetition for forest resources coming from those who benefit from timber production(Type 1) might be concentrated on one side of the forest, in nearby communities havingboth milling capacity and transportation facilities appropriate for hauling heavy loads. If the *timber production results in increased turbidity and flooding in streams, the competitioncoming from those who incur these environmental externalities (Type 2) might encompassresidents of the mill communities as well as others living hundreds of miles downstream inthe watershed. The competition coming from those who see timber production as havingan adverse impact on the quality of life (Type 3) might in&de residents of the watershed,as well as residents who live nearby but are outside the watershed. Those competing forforest resouroes because they place an intrinsic value on forest resources affected bytimber production (Type 4) may live in the vicinity of the forest or far &eld.
Only by chance will all the competing demands for a forest’s resouroes share a commonboundary. Furthermore, in most situations, the economic landscape relevant to a forestextends far beyond the economy itself Although some individuals, groups, andcommunities with competitive interests in a forest’s resources live nearby, or perhaps even
18
within the forest itself, the bulk of the competition can come from hundreds, perhapsthousands of miles away.
Even this casual view of the relevant economic region(s) has important implications forforest researchers and managers. The common approach for evaluating the economicconsequences of forest-management alternatives circumscribes the relevant economy withthe boundaries of the forest. In others words, the spatial dimensions of the ecosystem andthe economy are assumed to be the same. Recent examples of this include the studiesunderlying the Northwest Forest Plan (Forest Ecosystem Management Assessment Team1993), the assessment of biophysical and socioeconomic characteristics of the SouthernAppalachian Highlands (Southern Appalachian Man and the Biosphere 1996), and theintegrated scientific assessment of the interior Columbia River Basin (U.S. Department ofAgriculture 1996).
To implement an alternative approach, based on the discussion thus far, one must defineboth economic region(s) and the geographic (or regional) compass of ecosystems. Werecommend starting with the ecosystems, then looking at the relevant economic regions,taking into account the special importance of metropolitan areas.
Ecosystems
Implicitly, we have defined ecosystems as sources of natural resource amenities that are ofeconomic interest. The science of ecology, of course, defines ecosystems in other tern%: “a - -unit comprising interacting organisms considered together with their environment” (ForestEcosystem Management Assessment Team 1993 p. IX II). For our purposes, it is essentialthat the.ecosystems under consideration have sufficient biological coherence so that theymake sense as potential loci of management from a scientific perspective. We say thisrecognizing full well that the boundaries of ecosystems (at least ones that are smaller than .continents) are subject to debate and controversy, and will vary depending on the purposesfor which they are being drawn.
One essential objective of the research program that we outline in this discussion is toimprove, at least marginally, the understanding of how human activity affects ecosystemsand the flows-of products derived from them. Although the equations of motion of a givenecosystem are. not fully known there can be little doubt that such activities as buildingroads, houses, and sewage systems, clearcutting, damming rivers, or, in some cases,walking on the landscape, change the state of the system in ways that change both thecurrent and future flows of products that interest people. Nonetheless, there is bothenormous political controversy and scientific uncertainty regarding the details of thissubject. Notwithstanding this controversy, we find that ecologists are generally willing andable to divide the world up into ecosystems, recognizing that there is overlap at theboundaries, that a given place may be part of more than an ecosystem, and that changes inbehavior may have ecological effects that are removed from the ecosystem in which the
c
1 9

0
*
initial behavior takes place. 14 This last possibility arises quite naturally when waterbornematerial transport is important. Forest management practices in a wooded upland mayhave important biological effects well downstream, in agricultural and urbanized valleysand in distant estuarine ecosystems.
Given our interest in ecosystem management, we tend to be interested in ecosystems offairly large size, so that the flow of products and stock of future potential products derivingfrom a given ecosystem are significant enough to be of interest to policymakers andcitizens. In this context, ecosystem management can be broadly defined as any humanactivity that alters the flow of ecosystem products (and generally the stock, which isimplicit in the.current state of the ecosystem, described biophysically). Note that in thisbroad definition, the management of the ecosystem need not be consciously intended assuch. The actions of Forest Service officials are surely ecosystem management, but so tooare tax, regulatory, and subsidy policies that affect the use of ecosystem resources, and soare actions of private landowners, ranchers, and backpackers. From social and politicalperspectives, it is useful to distinguish between conscious management activities and otherbehaviors and policies that affect ecosystems. But for our purposes they are all “ecosystemmanagement.”
Economic Regions
Delimiting economic regions suffers from problems that are similar to those involved indelimiting ecosystems. Here the mechanism of transporting material and energy (andservices) is some set of markets and other systems of economic exchange, rather thanrivers or air-sheds.
Generally, a place can be economically near to another place while being geographicallyvery distant. Consider the case of a printer in Los Angeles who uses paper processed inNew England. Environmental regulation in New England will then affect the economy ofsouthern California. The effect in this case is not likely to be large, partly becausealternative sources of supply can probably be found (although at higher cost) .and in partbecause the enterprise under consideration in Los Angeles is small relative to the regionaleconomy.
FIn,light of these’difficulties, we propose to start at the level of the ecosystem that is directlybeing managed, and to define the relevant economic region as the set of geographic areasfor which management changes %vill have discernible economic impacts. Differentmanagement tools will generally have different economic regions associated with them. Aregulation limiting ranching activities in riparian zones will likely have economic impact viachanges in local ranching behavior and changes in local and downstream water quality. Achange that affects logging practices in the same general area might also affect theeconomy of the local mill town. Each could affect recreational activity, but not necessarilythe same group of recreationists in the same places. In both cases, we would also include in
l4 In personal c ommunication with scientific staff at six of NSF’s Long Term Ecological Research(L’I%R) sites, we have found that ecologists can and do identify the ecosystems within which theirsites sit, and also larger ecosystems of which their sites are typical.
20

the relevant economic region the location of significant secondary economic impacts, e.g.,suppliers to the affected meat processors, logging contractors, and recreation-equipmentretailers.
What is true for paper manufacture is also true for logging-the economic effect ofecosystem management may take place in locations that are geographically neither nearnor contiguous to the relevant ecosystem. Loggers in the Pacific Northwest and Alaska, forexample, often travel long distances to find work and mills compete intensely for logs overdistances of several hundred miles (ECONorthwest 1996a). Within this environment ofarea-wide competition, employment reductions arising from a reduction in timber harvestin one locality are likely to occur at the least efficient sawmill in the entire area, ratherthan at the mill closest to the site of the reduced harvest. Similarly, the timber-harvestreduction might affect the paycheck, not of the logger who lives nearby, but of the onewho lives several hundred miles away. In short, the distribution of economic impacts thatfollow from a specific environmental-decision will generally becomphcated and dispersed,. . , __ _ _,
Of course, at some point the effects become too small to be worth considering or theregions are so far away that they are of little or no policy interest to relevant policymakers. For accounting and conceptual purposes it still makes sense to keep track oncethese bounds are reached, but as a practical matter such effects will generally be assignedto “the rest of the world.”
As an operational guide for defining the economic region(s) relevant to the management ofan ecosystem, Haynes and Horne (1997) recommend adapting a principle of ecological . .research: to set and understand context one level higher than the primary scale of interestand to examine and understand processes one level lower than the primary level. If theprimary area of interest is a river basin, then set and examine the context at the regionaland national levels. To understand processes, look at subbasin economies, such as thefunctional economic areas defined largely by data on labor commuting patterns (Johnson1995).
We generally endorse this approach, recognizing, however, that it leaves unanswered thequestion, How large is the relevant region? There is ‘no good, widely accepted answer. As apractical matter, therefore, we recommend that one begin large and gradually worksmaller. For a forest ecosystem of fairly large size, one should begin with the encompassingregional economy that functions as a distinct, subnational economic unit and consists of c
one (sometimes more) large metropolitan center, which serves as the economic node forthe region, plus the peripheral smaller metropolitan areas and nonmetropolitan areas thathave close economic ties to the metropolitan center. These nodal centers include thenation’s major cities: Boston, Chicago, Atlanta, etc.
After looking at the impact of forest-management decisions on the major subnationalregional economy, one should step down to a set of one or more nested, smaller economicregions. The steppingstones should be the one or more smaller, peripheral metropolitanareas that lie between the central nodal core and the ecosystem. We illustrate this processas we discuss the case studies in Chapter IV. In the following section, though, we describein more detail the economic importance of metropolitan areas.
21
IB
*
The Importance of Metropolitan Areas
Forest-policy analysts often assume’that the economic effects of forest-managementdecisions will impinge primarily on rural communities. They conclude that, because thesecommunities are isolated, they are necessarily dependent on the production of extractiveproducts, primarily timber, fkom the adjacent forest and, hence, they are especially fragilewith respect to changes in the flow of these products. Using this logic, the community-impact section of the environmental impact statement accompanying the Northwest ForestPlan, for example, focuses exclusively on the region’s rural counties and communities andassesses the extent to which reductions in timber production would place thesecommunities “at risk” (U.S. Department of Agriculture and U.S. Department of the Interior1994).
This view sees the forest-economy relationship in far simpler terms than we represent inFigures 2.1 and 2.2. Specifically, it sees the forest’s importance to the economy primarily, ifnot solely, through its production of extractive and development products (Type 1 in FigureZ-Z), overlooking the offsetting consequences for competing demands and products CrepesZ-4). Further, it exaggerates the economic isolation of rural communities and theeconomy’s sensitivity to changes in timber and other commodities. A common denominatorin these shortcomings is the failure to acknowledge the importance of metropolitan areasto the relationship between forested ecosystems and the economy. One generally cannotobtain a full understanding of potential impacts on rural communities from forest-management decisions by looking at these communities in isolation, separate from their. ::;: I;.;;:..economic integration with metropolitan areas.
The historical economic isolation of nonmetropolitan communities is diminishing and, inmany respects, it has expired. Clearly, some communities are more isolated than others,and within a given community, some residents are more integrated than others. Butvirtually all nonmetropolitan residents are getting closer economicaIly to metropolitancenters. To see the full extent of the competition for forest resources and to understandthe full economic consequences of forest-management decisions, except in rare instances,one must take into account the economic integration of nonmetropolitan areas withmetropolitan centers, near and far.
The 1920 census was the first to show more than half the U.S. population living in towns *and cities. Currently, more than three-fourths of the population live in metropolitan areas,and more than haIf live in metropolitan areas with more than 1 million people. Thegrowing concentration of the U.S. population in large metropolitan centers, however, doesnot mean that these centers are divorced from the surrounding nonmetropolitan areas. Tothe contrary, the economic and cultural ties between metropolitan and nonmetropolitanareas always have been and continue to be strong and complex.
Nonmetropolitan counties, which contain more than 80 percent of the land area in theUnited States, house about 21 percent of the people, provide about 18 percent of the jobs,and generate about 14 percent of the earnings (USDA Economic Research Service 1995).In general, rural residents are less likely than in the past to be tied to resource-intensiveindustries. Since World War II, farmin g employment, for example, has dropped from about8 m,il.lion to about 3 million, and only 5 million people-less than 2 percent of the totsIpopulation and less than 10 percent of the rural population-live on farms. In counties with
22
the highest concentration of farm jobs, these jobs, on average, pay considerably more thannonfarm jobs ($28,000 versus $19,000 in 1989). Nonetheless, of all the householdsoperating farms, nearly 60 percent rely partly on nonfarm income, with one or morehousehold members working in an off-farm job and earning, on average, nearly $30,000from nonfarm employment (USDA Economic Research Service 1995). Rural residents alsoare less likely than in the past to work in timber, mining, and other industries related toresource extraction. These industries historically located processing plants adjacent to theraw material to reduce the costs of transporting the raw material to the factory. Because oftechnological changes that both allow and require additional processing per unit of tialoutput, raw materials are a smaller component of costs for most final products, and manymanufacturers seek to locate, not near the raw material, but near large markets and largepools of qualified workers. Most of these industries are no longer dispersed throughoutrural areas. They have consolidated near urban centers for better access to both buyersand workers (Duffy 1994).
In conjunction with technological changes in manufacturing brocesses, the development of -’ .transportation systems also has reduced economic barriers between nonmetropolitan andmetropolitan areas (Mills 1987). Transportation systems, especially the trucking industryand the interstate highway system, have reinforced the technological changes and allowedmany manufacturing firms to locate outside metropolitan areas, but still have ready accessto urban customers and a large labor pool. In many sections of the country, the location ofmanufacturing on the fringes of metropolitan centers has considerably blurred thedistinction between urban and rural, so that communities once considered rural are &al-‘- .no more. . . . . . . _ ._........... . . . . . . ,. ._ . . . . . . . . ,,.. . . . . . . -
Many residents of nonmetropolitan areas have prospered from the increasing economicconnections to metropolitan areas. Nonmetropolitan areas, as a whole, now have a smallerportion of persons living in poverty than metropolitan areas (Danziger and others 1994). Infact, by most measures, nonmetropolitan poverty seems to be declining. In 1990, forexample, 766 nonmetropolitan counties in the United States had more than 20 percent oftheir population living in poverty, down from 2,083 counties in 1960 (USDA EconomicResearch Service 1995).
The migration patterns of workers and households and the locational decisions of &.mshave important consequences for nonmetropolitan-metropolitan links. The locationalpatterns of the‘elderly illustrate these consequences. Nonmetropolitan areas, which
F
historically have had a higher concentration of elderly persons, seem to be. attracting evenmore. Nationally, the number of persons 65 years and over has increased 60 percent since1970, and this group now represents about 13 percent of the total U.S. population (U.S.Department of Commerce, Bureau of the Census 1992). During each of the three previousdecades, elderly persons exhibited general movement fiorn metropolitanareas tononmetropolitan areas (Heberlein 1994).
An increasing elderly population in nonmetropolitan areas tends to reduce the isolation ofnonmetropolitan communities in several ways, primarily by supporting nonmetropolitan-metropolitan trading networks. Because of national entitlement programs, pensions,accumulated savings, and other factors, the elderly, as a group, now have greater wealthand income than in the past. Their expenditure of the transfer payments provides animportant source of &m&al support for nonmetropolitan retailers, health clinics, andother businesses. The economies of nonmetropolitan counties that experienced 15 percent
23

or greater in-migration of persons age 60 or older during the 1980s performed far morestrongly than the economies of other nonmetropolitan counties. On average, the elderlypopulation of these counties grew by about 50 percent during the decade and totalpopulation by 23 percent (versus 0.6 percent for nonmetropolitan counties as a whole),while total earnings grew more than 25 percent and employment by nearly 35 percent.These counties tend to be in the Sunbelt and to be close to natural-resource amenities.Many military retirees also locate near military bases to have access to medical andshopping facilities on the bases (U.S. Department of Agriculture 1995). As the contributionof retirees to the local economy grows, so .does the connection between metropolitan andnonmetropolitan areas.
Most discussions of the economic relationship between resource-rich rural areas and thebroader economy examine bilateral trade in which the rural periphery sells raw materials(perhaps with some processing) to the urban core. The core purchases these materials withmanufactured goods and specialized services. These may be produced in the core city, orthat city may act as an intermediary in trade with the rest of the’tiorld. ..
The typology of demands on natural resources that we present as Type l-3 products isgenerally consistent with this conventional view of intra-regional trade flows, but itsuggests that we should look at a greatly enriched variety of ways in which the trade maytake place. Most important, the consumption amenities that we discuss as Type 3 productsmay induce migration to cities that are near (but not directly part of) places that possesssuch amenities.15 People who like to sail may choose to live in Baltimore rather thanPhiladelphia; people who like to fish may choose to live in Detroitrather. than.St. Louis; ...,.. .... .-. ...software engineers who like to kayak may choose Portland over San Jose. Thus,ecosystem management at the periphery may have profound effects on population andeconomic behavior in the core, not only via the direct effects of resource-using industriesof Type 1 and Type 2 but also via the indirect effects on the quality of life (and willingnessto pay for quality of life) of urban residents, via the consumption amenities that generateproducts of Type 3.16
C
E Most studies of economic development potential associated with recreational sites at the peripheryfocus on the local effects. See, for example, English and Bergstrom (1994). This model, however,misses the possibility (which will generally be invisible in standard industrial and employmentdata) that the economy of the core is enhanced by recreational and other amenity values of theperiphery. If people choose their urban areas based on nearby, but rural, natural resourceamenities, the value of those amenities may largely be reflected in urban, not rural, labor andhousing markets.18 For people who value both urban and natural-resource amenities (e.g., kayakers who like opera)the connection between the core and periphery is even closer. All things being equal, such peoplewould most prefer to live in or near cities that are slso near mountain rivers. They will be willing toaccept, in some combination, lower wages and higher housing costs to live in such places. In thiscase;the relevant vectorlocations.
of consumption amenities includes both types of amenities and their
24
B. Relevant Variables: Economic Value, Impact, and Equity
A variety of economic consequences will follow any forest-management decision. Theeconomist can best help resource managers, decisionmakers and the public assess theeconomic consequences of any forest-management decision by providing an evaluativeapproach, based on economic analysis, that reflects the needs and concerns of thoseinvolved in the policy arena (Shabman and Stephenson 1996).
One way to measure the economic consequences and, hence, the relative strengths of thecompeting demands for forest resources is to compare the values society ascribes to thedifferent bundles of goods and services derived from the forest under alternative forest-management decisions17 This comparison can help members of the public and those whoallocate forest resources assess the extent to which the alternatives are economicahyefficient and have the potential to increase the economic well-being of society as a whole.In general, the value an individual places on a specific use is the .amount the person is _ .willing to pay for it if the person does not already possess the right to use the resource inthis manner, or if the right is possessed, the amount the person is willing to accept torelinquish the right and forgo this use. For a more detailed discussion of the issues andanalytical methods related to estimating the value society ascribes to different uses offorest resources, we refer the reader to standard texts on natural-resource economics suchas Freeman (1993), Goodstein (1995), and Tietenberg (1996).
Much of the public’s concern over forest management lies not with value but with howforest-management decisions will affect economic opportunities available to workers,families, and investors and the structures of the local, regional, and national economies.These effects are commonly called the economic impacts of a decision and are differentfrom the effects on economic value, which are based on costs and willingness to pay fordifferent outcomes.
Where there is competition for forest resources, any resource-allocation decisionnecessarily creates both winners and losers. The characteristics of these two groupsinfluence perceptions about the fairness of the decision. These perceptions, in turn, can
‘-play an important role as resource managers, decisionmakers, and the public evaluateforest-management decisions. Hence, an assessment of the competition for forestresources anbthe consequences of forest-management decision should examine issues Cassociated with ‘economic equity and keep track of winners and losers and examine theimpacts on perceptions of fairness. In particular, the assessment should examine issuesassociated with property ownership, subsidies and externalities, and groups of specialconcern. For additional discussion of these issues, see Courant et al. (1997b) and Niemi andWhitelaw (1997).
” FZonomists tend to identify the relevant bundle of goods and services by looking through the eyesof consumers rather than those of producers.
2 5
4
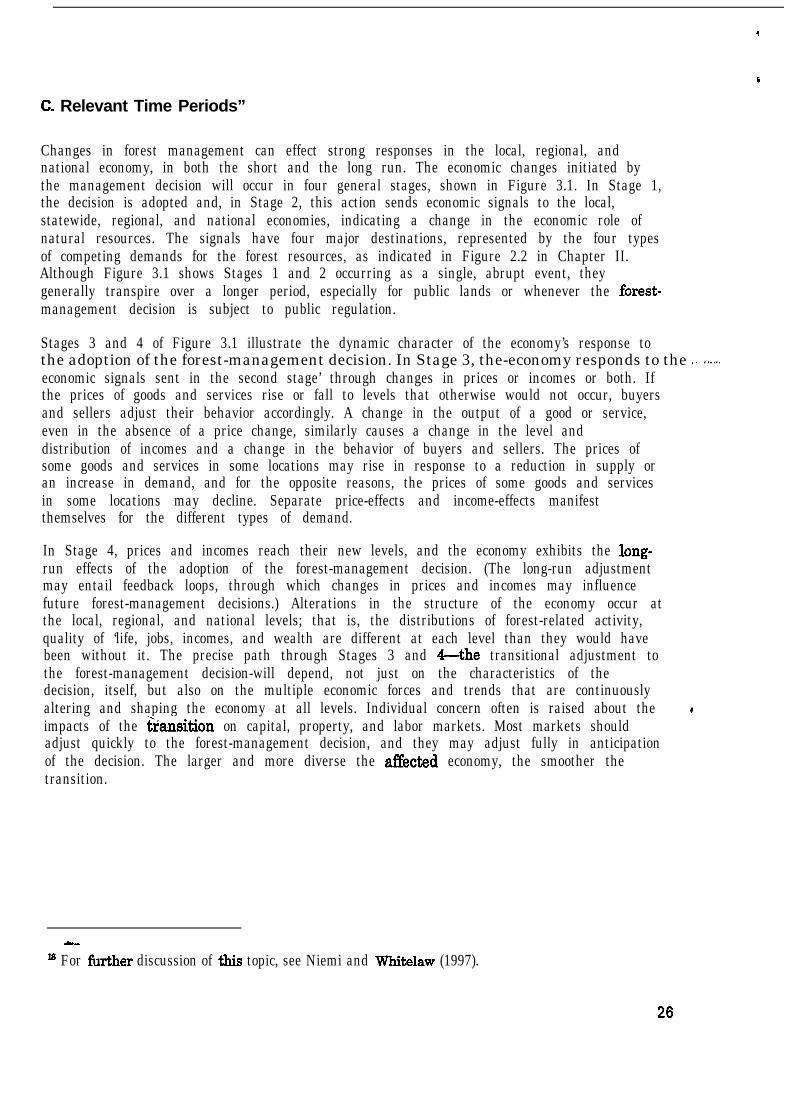
C. Relevant Time Periods”
Changes in forest management can effect strong responses in the local, regional, andnational economy, in both the short and the long run. The economic changes initiated bythe management decision will occur in four general stages, shown in Figure 3.1. In Stage 1,the decision is adopted and, in Stage 2, this action sends economic signals to the local,statewide, regional, and national economies, indicating a change in the economic role ofnatural resources. The signals have four major destinations, represented by the four typesof competing demands for the forest resources, as indicated in Figure 2.2 in Chapter II.Although Figure 3.1 shows Stages 1 and 2 occurring as a single, abrupt event, theygenerally transpire over a longer period, especially for public lands or whenever the forest-management decision is subject to public regulation.
Stages 3 and 4 of Figure 3.1 illustrate the dynamic character of the economy’s response tothe adoption of the forest-management decision. In Stage 3, the-economy responds to the ..’ ......economic signals sent in the second stage’ through changes in prices or incomes or both. Ifthe prices of goods and services rise or fall to levels that otherwise would not occur, buyersand sellers adjust their behavior accordingly. A change in the output of a good or service,even in the absence of a price change, similarly causes a change in the level anddistribution of incomes and a change in the behavior of buyers and sellers. The prices ofsome goods and services in some locations may rise in response to a reduction in supply oran increase in demand, and for the opposite reasons, the prices of some goods and servicesin some locations may decline. Separate price-effects and income-effects manifestthemselves for the different types of demand.
In Stage 4, prices and incomes reach their new levels, and the economy exhibits the long-run effects of the adoption of the forest-management decision. (The long-run adjustmentmay entail feedback loops, through which changes in prices and incomes may influencefuture forest-management decisions.) Alterations in the structure of the economy occur atthe local, regional, and national levels; that is, the distributions of forest-related activity,quality of ‘life, jobs, incomes, and wealth are different at each level than they would havebeen without it. The precise path through Stages 3 and 4-the transitional adjustment tothe forest-management decision-will depend, not just on the characteristics of thedecision, itself, but also on the multiple economic forces and trends that are continuouslyaltering and shaping the economy at all levels. Individual concern often is raised about the cimpacts of the &nsition on capital, property, and labor markets. Most markets shouldadjust quickly to the forest-management decision, and they may adjust fully in anticipationof the decision. The larger and more diverse the affected economy, the smoother thetransition.
--
1 For further discussion of this topic, see Niemi and Whitelaw (1997).
26
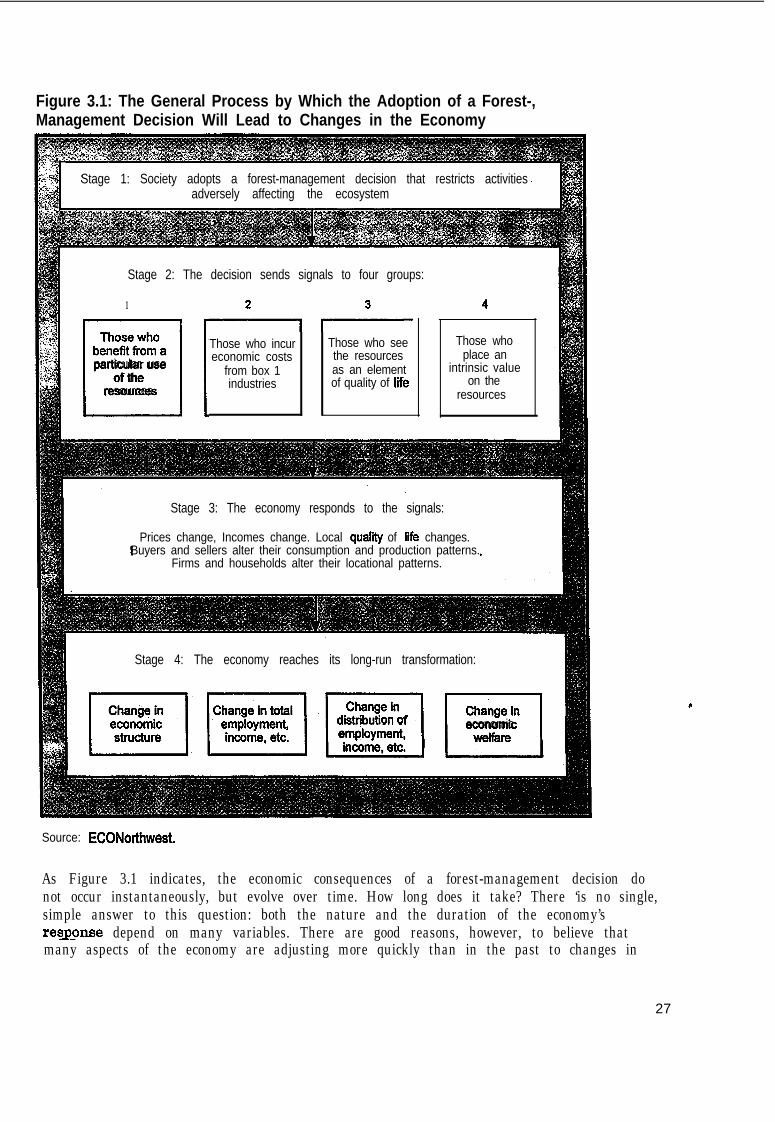
Figure 3.1: The General Process by Which the Adoption of a Forest-,Management Decision Will Lead to Changes in the Economy
Stage 2: The decision sends signals to four groups:
1 4
Those who+4-
benefit from a Those who incur
0:
Those who see Those who
particular use economic costs the resources place an
of the from box 1 as an element intrinsic value
resources industries of quality of Me on theresources
Stage 1: Society adopts a forest-management decision that restricts activitiesadversely affecting the ecosystem
Stage 3: The economy responds to the signals:
Prices change, Incomes change. Local quality of life changes.Buyers and sellers alter their consumption and production patterns.
Firms and households alter their locational patterns.
Stage 4: The economy reaches its long-run transformation:
ilIl),)“““‘”onot
. I I
economicwelfare I
Source: ECONorthwest.
As Figure 3.1 indicates, the economic consequences of a forest-management decision donot occur instantaneously, but evolve over time. How long does it take? There ‘is no single,simple answer to this question: both the nature and the duration of the economy’sresp_onse depend on many variables. There are good reasons, however, to believe thatmany aspects of the economy are adjusting more quickly than in the past to changes in
27
forest-management policy. For example, by the middle of 1997, lumber prices throughoutthe U.S. had stabilized in adjusting to the major decrease in federal timber sales in thePaciCc Northwest that accompanied the April 1994, adoption of the Northwest Forest Plan.This was far quicker than many industry analysts had expected (Bernton 1997). Labormarkets also are dynamic. Power (1996) reports that, of the workers nationwide who losttheir jobs because of plant closures or other mass layoffs in the 198Os, about half wereunemployed 10 weeks later and the percent remaining unemployed after twelve monthswas roughly the same as the rate of unemployment in the overall labor force.
This is not to say that everyone adjusts this quickly, or that the costs of adjusting to achange in forest-management policy are trivial. Instead, we are only pointing out thatadjusting to change is one of the widely-trumpeted virtues of market economies. Onenecessarily will overestimate the economic consequences of a policy change if one focusessolely on the initial impacts-the initial price effect, increase in unemployment, and soforth-and fails to trace through the adjustment and transition. ____.... .., .._. _... .,....,
D. Economic Base Models
In contrast with the dynamic reality of the ecosystem-economy relation, many analyticaltools for assessing the economic impacts of a forest-management decision take a staticview of the relationship between natural resources and the surrounding economies. This isespecialIy true of perhaps the most commonly used tool, the economic base model. Becauseit is so frequently applied, and yields results so misleading, we single it out.
An economic base model divides the economy of an area into two sectors: the export sector,which produces goods and services sold to buyers outside the area, and the local sector,which sells its products within the area. Proponents of the economic-base model concludethat, because the export sector brings in money from the outside that is spent and respenton local goods, it is the “economic base” that “supports” the local sector. With such models,the fate of a region’s economy is in the hands of outsiders: the only way the welfare of localresidents improves is if outsiders buy more of the goods being exported &om the area.Because resource-intensive industries typically export their products to other regions orcountries, proponents of the economic-base approach often conclude that these industriesplay a key role..in sustaining the welfare of local residents (Beuter 1996; Schallau 1994).
Economic base models also contain a simplifying assumption that arrests the economy inits current configuration so that an increase or decrease in the supply of a particular .’product can be traced through the, now-assumed-to-be-static economy. In general, theresults from this approach tend to overestimate the negative impacts and underestimate,even ignore, the positive impacts of any change from the status quo. This bias can be calledthe dumb-person bias, because the technique explicitly assumes that investors, managersof firms, workers, and consumers will not adapt to the forest-management decision butinstead wil.l continue to behave as if the management decision had not occurred(Mendelsohn et al. 1994). In reality, investors, managers, workers, and consumers areneither static nor dumb. The regional and subregional economies of the U.S. aretremendously dynamic, and they adapt remarkably to changing conditions. If the supply of
a productive input is restricted, or if the demand for a final product falls, investors will try
28

to reduce their risks and the managers of firms will adapt their production processesaccordingly.
Using an economic base model to crank through the effect on employment or income ofeliminating a given amount of employment in the basic industry, an analyst is answeringthe following question: What would happen if the given amount of employment wereeliminated, and
l those who lost their jobs as a result never worked again, but also did not move
l the local and regional establishments that sold goods and services to those who losttheir jobs permanently lost that business and obtained no replacement business (andalso did not move)
l those enterprises in the region that used the output of the original job-losers obtainedno replacement inputs fiorn elsewhere (and also did not move) * * .
0 everyone throughout this chain who lost her or his job acted exactly the same way asthe original job losers, in that they never worked again and stayed put?
There may be good reasons for answering this question: it puts an upper bound on theextent of adjustment an economic region will have to undergo in response to a change inpolicy (or technology, or demand). However, as Power (1996a) so nicely puts it, using theeconomic-base model for forecasting is like driving by looking in the rear-view mirror. Theeconomic-base model generates a measure of the maximum extent to which changes willtake place, but this is very different from a forecast of what will actually happen.Economic-base models tell us how many jobs (or, more generally, how much economicactivity) currently depend on a given industry or line of work. They also tell us who standsto gain or lose in the short run, which can aid in the design of policies and programsdesigned to help people who may suffer dislocation. 19 However, they tell us very little aboutwhat the local economy will look like after it adjusts to growth, decline, or other change ina basic industry.
Adjusting to change is one of the widely-trumpeted virtues of market economies. When aspecific industry in a specific location goes into decline, for whatever reasons, two sets ofthings must happen in some combination: (1) other activities will replace the industry indecline and (2) capital and people whose incomes fall will leave the area. To forecast how agiven local economy will adjust requires not only a detailed knowledge of what thateconomy currently does, but also knowledge of other things that it might do. Where thelocal economy has few economic assets, activity can be expected to decline and populationto fall. Even then, the overwhelming majority of the people affected will find other, work,at an average of about 76 to 90 percent of their old pay (Jacobson et al. 1993; Ruhm 1991).Where assets are more plentiful, the local economy will do better. When natural resourcesare important assets, it is quite likely that current activities coded as ‘basic” are competitivewith each other (e.g., logging vs. fishing) or that current basic activities are competitive
C
Is These are the workers who lose most, and the losses average much less than 100 percent. See,for%xample, Farber (1996), Heberlein (19941, Herzog and Schlottmann (19951, Jacobson et al.(19931, and Ruhm (1991).
29
with unseen alternatives (e.g., logging vs. retirement homes.) In these cases, coding of theeconomy’s current activities as “base” and “other” will not be at all helpful in forecasting theeconomy’s adjustment to change.
E Autonomous Forces
Any forest-management decision occurs within the context of powerful, international andnational economic trends that shape the competition for forest resources, which in turnshape the economic consequences of the decision. Such trends include changes in the agestructure of the population, changes in family structure, interregional migration, shifts inthe ethnic mix of regional populations, and a growing network of international agreementson managing environmental resources. Four trends are especially important:
1 . The decline in employment in resource-intensive industries and the increase inemployment in service and high-tech manufacturing sectors of the economy.
2 . The growing importance of education as a determinant of wages and householdincome.
3 . The increasing role of amenities and other nonwage factors as determinants of thelocational decisions of households and Crms.
4 . The evolving economic integration of nonmetropolitan and metropolitan areas.
These trends result from fundamental changes in tastes, technologies, and demographicswithin the U.S., as well as changes in the economic relation between the U.S. and othercountries. The economic forces underlying these changes will persist for many years,perhaps decades. The four trends have brought and will continue to bring about profoundshifts in the contributions natural resources make to the economic well-being of workers,families, and communities in the U.S. They do not, however, uniformly influence eachregional or subregional economy, or by extension, each community, or householdDepending on the characteristics of the individual economies, some will respond morestrongly to the trends, and others less so. Earlier in this report we discuss the last twotrends-the importance of amenities and the nonmetro-metro integration. In the following csections we provide a brief overview of the other two. For more detail on the four trends,see Niemi and Whitelaw (1997).
Employment and Incomes Stagnant or Declining in Resource-Intensive Industries
As we state earlier, groups use different mechanisms to compete for forest resources. Tothe extent that workers, communities, and political leaders place a premium on increasingthe employment opportunities available to them or their constituents, they promote forest-management decisions that will yield this result. Typically, this means promoting decisionsthat allocate more forest resources to resource-intensive industries, such as agriculture
3 0
and the resource-extractive industries, typically logging and mining20Long ago theseindustries, along with their derivative industries, such as food processing, sawmills andsmelters, were the primary sources of income and wealth in the United States. Today theyplay a much smaller role in the nation’s economy. Employment in the resource-relatedindustries has declined, both relatively and absolutely, and we can expect this decline tocontinue. Now, and for the foreseeable future, most increases in jobs and incomes willoccur in industries other than the resource-intensive industries. This trend represents afundamental reduction of the role of resource-intensive industries in the jobs-relatedcompetition .for uses of forest resources.
Between 1969 and 1994, direct employment in agriculture (farm employment andagricultural services), mining, and timber (lumber and wood products, pulp and paper, andforestry services) declined from about 7 percent of total U.S. employment to about 5percent. During this same time period, while the percentage of total U.S. employmentattributed to manufacturing declined, employment in the service sector, as a percentage.of,total U.S. employment, grew dramatically (U.S. Department of Agriculture 1995).
Several economic and social factors underlie the decline in the resource-related industriesas a source of jobs and income in the U.S. economy. The adoption of labor-savingtechnological advances by U.S. firms in the resource-extraction and heavy manufacturingindustries is a major factor (Kasa 1994; Lawrence and Slaughter 1993). Technologicalinnovation has been an important characteristic of some portions of the U.S. timberindustry (Greber 1993) and is expected to play a major role in the increasing globalizationof the wood furniture industry. Failure to apply new technologies to production has beencited as a contributing factor to the recent decline in the competitiveness of U.S. woodfurniture manufacturers in both the domestic and international markets (Smith and West1994; West and Sinclair 1991). Other factors affecting timber and other resource-relatedindustries during the past decade have been a marked decline in the influence of laborunions (Mishel and Voos 1992) and an accompanying decline in real incomes (Power1996a).
In the foreseeable future, these trends will not reverse. Economic forecasters do notexpect jobs or wages in the resource-extraction and manufacturing sectors to increasesignificantly (Franklin 1993). These industries are and will remain important elements ofthe nation’s economy, but they will not be as important as they were in the past. In fact,the resource-e&active sector most likely will eliminate jobs and shrink its payroll.
These trends have important implications for the competition for forest resources.Allocating a unit of forest resources-whether measured in acres, million board feet, orother units-to a resource-intensive industry in the future probably will generate fewerjobs and smaller incomes than in the past. Communities seeking to develop new jobsgenerally will have to look to industries other than resource-related industries.Communities that have depended heavily on resource-related industries generally shouldexpect economic stagnation or contraction in the future if they continue to look mainly tothese industries for maintenance of economic vitality.
ZJ IZSome situations, elements of the developed-recreation, such as destination ski’ resorts, also canbe resource intensive.
31
Education Increasingly Important to Wages
For many reasons, resource-intensive industries exhibit a declining ability to generate jobsand incomes. One of the most important of these is a shift in the factors determiningworkers’ wages. In the past, a general expectation existed that allocations of forestresources to the resource-extraction industries would result in jobs with high wages,allocations to recreation would yield jobs with low wages, and allocations to environmentalprotection would not yield any jobs at all. Over the past two decades, however, thisrelationship between resource allocation and wage level has disintegrated. Forest-relatedwages, like wages throughout the economy, are increasingly determined by structuralchanges in the economy that have diminished the scarcity of workers with the set of skillstraditionally employed in resource-extraction industries..
A review of historical data on education and earnings indicates that workers with moreeducation earn higher wages, but during the past two decades, education has become an _increasingly important determinant of workers’ earnings (Bound and Johnson 1995; Juhnand Murphy 1996). In 1980, for example, male workers aged 25 to 34 with a college degreeearned about 20 percent more than their counterparts with only a high school diploma, butby 1990, this differential had increased to about 50 percent. The comparable figures forfemale workers are about 30 percent morein 1980 and 60 percent more in 1990(Ehrenberg and Smith 1994) .
Multiple economic and demographic factors contribute to the growth in the earnings gapbetween workers who have a college education and those who do not. One of the moreimportant is a shift in occupational patterns, with an increase in the number ofemployment opportunities in managerial, professional, and other high-wage occupationsand a decrease in the number of workers in middle-wage occupations, including the bluecollar jobs that until recently have typised many of the older manufacturing industries(Brauer and Hickok 1995; Kutscher 1993). The shift in occupations has been accompaniedby explosive growth in the use of computers and other high-tech equipment that requirehigh-skilled workers to operate. In many instances, as industries install high-techequipment which lowers the overall demand for labor, and especially the demand forworkers with low-to-medium skills, the demand for high-skilled workers increases (Boundand Johnson 1992; Eck 1993). This process underlies much of the displacement of blue-collar workers in the resource-related industries, described above.
These trends are expected to continue as more and more high-tech equipment is developedin the future (Bound and Johnson 1992; Brauer and Hickok 1996). There is little, ifanything, that will compensate for the lack of education. In particular, increasing thesupply of raw material to resource-related industries, such as increasing the flow of logs tothe timber industry, will not arrest the fundamental economic forces causing the industryto invest in labor-saving technology, eliminate jobs, and reduce the wages of workerslacking a high level of education. Indeed, the resource-intensive industries are subject tothe same forces at play in the economy as a whole. Within these industries, jobs aregrowing fastest in the occupations-executive, administrative, managerial, professional,and precision-crafts-that require the highest training and pay the highest earnings (llg1996).
c
32
Within the context of these changes in the structure of wages and earnings, it is clear thatthe conventional resource-intensive industries have declining ability to satisfy theeconomic hopes of workers, families, and communities. Instead, these industries promiseeconomic decline for all but those relatively few who have the requisite skills to commandwage increases. The bulk of the workers in the resource-related industries cannot expectsubstantial wage increases without an increase in their skills.
F. Sustainability and Congestibility
We do not pretend to provide a thorough discussion of the literature and issues associatedwith the sustainability of alternative forest-management schemes. Instead, we return toFigures 2.1 and 2.2 (Chapter II) to make three points. The first is that for foreststhroughout the U.S. the four types of demands shown in Figure 2.2 are competing for aforest’s resources and the balance among the four is shifting in response to changes indemographics, tastes, technologies, and the resources, themselves. Consequently, strongeconomic pressures will seek to modify any effort to manage a forest to satisfy only one ofthe demands. In particular, a management scheme aimed solely to meet the demand fortimber (Type 1) inevitably will confront resistance, rooted in economics, if the schemedisplaces other commercial demands for forest amenities, derives subsidies from orimposes externalities on others (“&pe 2), degrades the quality of life for nearby residents(Type 3), or threatens the forest’s intrinsic values (Type 4). Stated differently, there will bepressures to manage every forest, whether privately or publicly owned, to respond to a mixof competing demands. Insofar as there are no organized, open markets to channel many,if not most, of the competing demands, those who do not see their demands being metinevitably will turn to political and public-relations arenas to pursue ‘their desires. Thesepressures can be largely explained and analyzed in economic terms.
The second point is that, whenever the consumption amenities of a forest are sufficientlyattractive to spur local growth in the human population, and there is no extra-marketregulatory mechanism, the process inevitably will converge to an outcome that isovercongested (Myers 1987). That is, the population will grow to a level where’ the benefitgained by new households arriving to take advantage of the amenities is less than the lossdue to crowding incurred by those already there. *-..Considerationof the first two points in the context of Figure 2.1 leads to the third point. Inour discussion of Figure 2.1 we describe how our knowledge, institutions, and incentivesact as a lens that focuses the interactions between a forest ecosystem and humaneconomic activity. It has typically been the case in the past that this lens has encouragedthe allocation of forest resources to extractive and development uses. These aresustainable only insofar as society is willing to forgo alternative uses, sustain subsidies, andendure externalities. That is to say, they are not sustainable forever. But merely ceasingthe bias favoring resource extraction and development will not set the stage for asustainable forest-economy relationship. Without active intervention to ensure that alldemands for forest resources--including those amenity-related demands that often areconsidered benign-are sensitive to scarcity, and resources are allocated systematically tothe strongest demands first, the ecosystem-economy relationship will inevitably deterioratean&unravel.
33

.
These three points highlight the greatest gaps in our knowledge of the ecosystem-economyrelationship. As we demonstrate in the next chapter, little is known of the extent of thedisplacements, subsidies, and externalities associated with particular forest uses, or abouthow to manage the attenuation of them. Even less is known about households’responsiveness to the consumer amenities of forests and about how to avoidovercongestion. In short, there are important gaps in our knowledge of the demands forforest resources we label Types 2 and 3 in Figure 2.2. Filling these gaps is mandatory ifecologists and economists are to contribute meaningfully to the changes in institutions andincentives needed to move toward sustainable management of the nation’s forests.
34
IV.SlX CASE-STUDY FORESTS, REGIONS, AND COMPETINGDEMANDS
Our case studies begin in the Pacific Northwest. Economic growth in the Pa&c Northwestduring the 1980s and 1990s was robust at the same time that timber industry income andemployment declined. 21 This rapid growth in Oregon and Washington is difficult, evenimpossible, to understand in light of standard input-output models (Richardson 1985),predictions made by many economic analyses during the period (Beuter 1995; Oliver et al.1997; Schamberger et al. 1992) and standard governmental practice (Schamberger et al.1992; U.S. Department of Agriculture and U.S. Department of the Interior 1994) used toestimate the economic effects of reduced logging on so-called timber-dependentcommunities. All of these predicted that a marked decline in timbe_r_p~od~~~ionwo-~d-lead. _ . _ _.to widespread economic havoc. Instead, the area exhibits widespread increases in economicprosperity.
.
In Oregon, for example, employment and income generated by the lumber-and-woodproducts industry-Standard Industrial Classification (SIC) 24-fell by 17 and 35 percentrespectively between the successive cyclical peak years, 1979 and 1989, while Oregon’stotal employment increased by 257,000 or 23 percent (Oregon Employment DepartmentVarious Years). The Northwest Forest Plan (U.S. Department of Agriculture 1994), whichformalized actions initiated by the owl’s listing in 1990, reducing planned timber harvestsby about three-quarters on federal lands and by three-eighths overall in westernWashington, Oregon, and northern California. Throughout this period, the regional‘economy has consistently outperformed the rest of the nation (Pearson 1997). Theinconsistency between these expectations and the Pacific Northwest’s actual response toreductions in logging indicates that, even if the export-base logic once offered a usefulmodel of the forest-economy relationship, something has changed to render it useless.
This experience supports the hypothesis that the ecosystem-economy linkages other thantimber-i.e., the demands we’ve labeled Types 2-3-are more powerful than the timberlinkage (Type 1). More fundamentally, it substantiates the analytical framework wepresent in the.previous chapters. But, if this framework works well to explain the forest- Feconomy relationship in the spotted-owl forests of the Pacific Northwest, how well does itwork elsewhere? To answer this question, we use the framework to examine the data andliterature describing the forests and economies in six disparate regions. There are few datathat are both uniformly available for all sites and relevant to the ‘amilysis. It is possible,however, to cobble together enough to draw some initial conclusions.
In the remainder of this chapter, we describe the six case-study forests, discuss theeconomic regions associated with each of them, and summarize the competing demands forforest resources at each site. In Chapter V we present and discuss data regarding thedifferent types of demand.’
*’ S:i, for example, Power et al. (199613) and Whitelaw (1992).
3 5
Pacific Northwest (Westside)
The temperate coniferous forest represented by the H.J. Andrews Experimental Forest inOregon covers most of Oregon and Washington west of the Cascades, with extensions intoNorthern California and British Columbia. The lower-elevation forests are dominated byDouglas-fir, western hemlock, and western red cedar. The upper-elevation forests containnoble fir, Pacific silver fir, Douglas-& and western hemlock. The lower; and middle-elevation forests in this area are among the tallest and most productive in the world
The primary regional economic centers for the Pacific Northwest are the Seattle-Tacomaand Portland-Vancouver metropolitan complexes; the primary centers for NorthernCalifornia are the Bay Area metropolitan complex, and the Sacramento area. Vancouver,.British Columbia, serves as the primary regional economic center for the Canadian portionof the forest. Although the boundaries of each region are blurred by a high level ofinterregional and international economic intercourse, it is reasonable to conclude thePacific Northwest region consists primarily of the states of Washington, Oregon, Idaho,’and western Montana, and that the Northern California region consists primarily of thenorthern half of California and Nevada.
If one wants to determine if a management decision for this forest will alter discernibly theoutlook for economic activity and welfare in the region, one fist must consider it in thecontext of at least one of these large subnational regions. Only if the decision is suf&5entlymomentous to affect one or both of these regional economies, can one conclude that thedecision will alter the overall competitiveness of the region’s residents relative to theremainder of the national and global economies. If the decision is too insignificant to havesuch an effect, then its economic consequences will manifest themselves primarily withinthe region, i.e.,’ they will be subregional or local in nature. To examine the decisionssubregional effects, one should,examine subregions centered on smaller metropolitanareas. Those most relevant to this forest are from north to south, Bellingham, Washington;Salem, Eugene-Sprin&eld, and Medford, Oregon; and Redding and Santa Rosa, California.
Note that this is the only one of the six case studies where the forest surrounds the majormetropolitan center (Seattle-Tacoma and Portland-Vancouver complexes) that is the coreof the subnational regional economy.
Table 4.1 illustrates the competing demands for the resources of this forest. The primary bcommercial demand (Type 1) is the industrial production of timber. Competing commercialdemands (Type 2) exist insofar as timber displaces other commercial uses of forestresources, receives subsidies, and imposes negative externalities on others. Notabledisplacement occurs when logging (and other factors) has an adverse effect on the supplyof salmon and related species available for commercial fishing (Meehan 1991). Importantsubsidies occur when logging on federal lands ,fails to cover the full costs and receipts fromlogging are diverted to underwrite the industry’s direct and indirect costs (Alkire 1994;Gorte 1994; Wilderness Society 1997). Important negative externalities arise when timberproduction increases stream sedimentation (Jones and Grant 1996) and degradesmunicipal-industrial water supplies.
36

Table 4.1: The Six Case Studies-Overview of the Competing Demands
Primary Example of Example ofCommercial Intrinsic-Value
Demand Examples of Competing Commercial DemandsQu;;$;;;ife
Demand(Type 1) (Type 2) VYw 3) (Type 4)
’Case-Study Forest (LTER Site) DisplacedProducts Subsidies Externalities
Pacific Northwest Westside Timber Commercial Local Stream Recreational At-Risk Species(H.J. Andrews) Fishing Expenditure of Sediment Fishing (Northern
Federal Timber Spotted Owl)Receipts
Southern AppalachianHighlands (Coweeta)
Timber ResidentialDevelopment
Below-Cost StreamFederal Timber SedimentSales
Recreational At-Risk SpeciesFishing (Red Wolf)
New England NorthernHardwoods (Hubbard Brook)
Southwest (Sevilieta)Highland
Riparian Bosque ’
T i m b e r Residential Unemployment Stream Rural Lifestyle ‘-. At-Risk SpeciesDevelopment insurance Sediment Near Cities (Lynx,Air-Pollution Wolverine,Treatment Panther, Pine‘. Marten)
Timber Outdoor Below-Cost Stream Associations At-Risk Speciesrecreation Federal Timber Sediment with Pueblo (Mexican
Sales Cultural History Spotted Owl)
irrigated Municipal- Federal Water Stream Aesthetics of At-Risk SpeciesAgriculture Industrial Water Projects Dewatering Streams in a (Rio Grande
;’ ! Desert Silvery Minnow)Environment
Upper Midwest (North Timber Residential Below-Cost Degradation of Rural Lifestyle At-Risk SpeciesTemperate Lakes) Development Federal Timber Visual Near Cities (Gray Wolf)
Sales Aestheticsnterior Alaska (Bonanza Creek) - - - - Subsistence Subsistence
Hunting &Fishing
Huntingi &Fishing
I l .
37
The demands (Type 3) stemming Tom this forest’s contributions to the quality of life of theregion’s residents are widely recognized. Although much of the evidence regarding theeconomic importance of these contributions is anecdotal, some survey research confIrmsthat a sizable segment of migrants to the region are attracted by its natural-resourceamenities and they are willing to accept a reduction in income to ‘be closer to them (OregonBusiness Council 1993; Oregon Employment Division 1993). The controversy over thenorthern spotted owl, other at-risk species, and old-growth forests amply illustrates thedemands (Type 4) associated with the intrinsic value of some forest resources.
Southern Appalachian Highlands
The Southern Appalachian Highlands include parts of the Appalachian Mountains andShenandoah Valley extending southward from the Potomac River to northern Georgia andthe northeastern corner of Alabama. The Coweeta Hydrologic Laboratory is located nearthe southern end of the Southern Appalachias. The area’s 24.9 million acres of easterndeciduous forest are known for their high species diversity: more species of trees arenative to Southern Appalachia than to any of the other northern temperate regions in theworld. In the northernmost part of the region, chestnut oak and select oak speciesdominate, but Virginia pine, chestnut oak, non-select red oaks, yellow-poplar, and shortleafpine become more prevalent as one moves south. In eastern Tennessee the forests arepredominately non-select white and red oaks, Virginia pine, and yellow-poplar. This speciesdiversity complicates the timber markets of the region greatly because a stand may containan array of forest products with widely varying market values (Southern Appalachian Manand the Biosphere 1996).
Atlanta is the primary metropolitan center for the economic region associated with theSouthern Appalachians, especially the southern portion. Even though it is located outsidethe forest area, Atlanta dominates most economic activity occurring in the forest. Movingnorth through the forest, the forest-economy relationship feels the influence of othermetropolitan centers, including Charlotte and the Research Triangle cities of NorthCarolina; Knoxville, Tennessee; Louisville, Kentucky; Richmond, Virginia; and Baltimore,Maryland-Washington, D.C. Indeed, centers farther Geld are ‘not irrelevant to somemanagement issues-in the forest, given the many transportation corridors through theforest and high level.@ visitation from throughout the eastern states (Smoky MountainHost of North Carolina 1995; Southern Appalachian Man and the Biosphere 1996).
For our purposes, we identify industrial timber production as the primary commercialdemand (Type 1) of forest resources (see Table 4.1). Competing commercial demands Crepe2) exist insofar as the timber industry displaces residential development and othercommercial uses of forest resources, receives subsidies, such as below-cost federal timbersales, and imposes negative externalities, such as increased stream sedimentation, onothers. The forest’s cool climate relative to other areas further south, scenic views, andrecreational opportunities make it a recreational oasis for many residents of the easternseaboard. These amenities are the target of residential demand (Type 2) attractingimmigrants, particularly retirees, and encouraging the development of second homes.Expansion of Atlanta’s urban fringe has reached the southern edge of the forest. Surveysof residents of Southern Appalachia con&m that forest resources and the accompanyingscenic vistas, wildlife habitat, and recreational opportunities add to area’s quality of life
38
(Type 3) for many residents (Southern Appalachian Man and the Biosphere 1996). Theforest’s biodiversity is the focus of considerable demand for protection of intrinsic valuesUYw 4).
New England Northern Hardwoods
The eastern deciduous forest of New England, represented by the Hubbard BrookExperimental Forest, covers more than 10 million acres, including small portions of Maine,Massachusetts, and Connecticut, and much of the forested areas of New Hampshire andVermont. American beech, yellow birch, and sugar maple predominate, occurring eithersingly or in combination. Bed maple, white ash, eastern hemlock, paper birch, quaking andbig tooth aspen, eastern white pine, red spruce, and northern red oak make up most of theremaining species (Hornbeck and Leak 1992). . . . -. _ -
Boston is the primary economic center related to this forest. Other, smaller metropolitancenters relevant to management decisions in this forest include the smaller metropolitanareas in Massachusetts; Manchester and Nashua, New Hampshire; Portland, Maine; andBurlington, Vermont.
Industrial timber production is the primary extractive or development demand (Type 1) forforest resources (see Table 4.1). A major competing commercial demand (Type 2) for theforest’s resources is residential development. The forests of New England currently areexperiencing a period of land use change associated with increased residential use of theresources as evidenced by a decrease in the average size of forest land ownership unit andan increase in the number of owners of small acreage (Brooks et al. 1992). Anothercompeting commercial demand (Type 2) for the forest’s resources comes primarily fromoutside the vicinity. The forest receives a large amount of airborne pollution generated byfactories, electricity generators, and automobiles associated with cities generaBy to theeast. Industrial timber production can deplete the forest’s ability to assimilate this pollution.Whole-tree clearcutting and acidic precipitation, for example, has been found to depletecalcium from New England’s northern forests and have been cited as a potentialcontributing factor to red spruce mortality at higher elevations (Pierce et aL 1993). OtherType 2 demands competing with timber are subsidies to unemployment-insurance costs fortimber workers-(Meyer and Rosenbaum 1996), and negative externalities associated withincreased sediment levels in streams. The forest long has.attracted famihes to live in ornear it and, whenever timber production reduces the demand (Type 3) for these amenities,there is competition for the forest’s resources. The demand to protect the intrinsic value(Type 4) of numerous at-risk species, including the lynx, wolverine, and panther dependenton forest habitat also competes with timber for forest resources.
c
Southwest ~
The forests of the Southwest that are represented by the Sevilleta National wildhfe Refugeoccur in New Mexico, southern Nevada, and Arizona. At high elevations, spruce-firsubalpine forests dominate, transitioning into valleys of pinon pine-juniper woodlands and
39 I
mixed conifer forests. In riparian zones, most notably along the Rio Grande, cottonwood-willow bosque forests dominate.
At the most fundamental level, the economic region relevant to this forest is huge, andembraces three major metropolitan centers: Los Angeles, Denver, and Dallas. Smallereconomic regions relevant to forest-management decisions are centered on Phoenix andTucson, Arizona; Las Vegas, Nevada; Albuquerque, Las Cruces, and Santa Fe, New Mexico;and El Paso, Texas.
Table 4.1 illustrates the competing demands for the two different southwestern forests.For the high-elevation forest, the dominant commercial demand (Type 1) is the timberindustry’s demand for wood fiber, but, for the riparian forest, the dominant demand isagriculture’s demand for irrigation water. Both types of activities can displace competingdemands (Type 2) for municipal-industrial water, by diminishing the quality, quantity, orboth. Both of the Type 1 demands receive federal subsidies: timber through below-cost. . . . . . . . . . . . ,._.. i.. _. . . . . . . .timber sales and agriculture through subsidized dams and other ‘federal water projects. The
. . . .._........ :..
externalities associated with timber are similar to those described for the other sites. Thoseassociated with irrigated agriculture include removal of water from streams and increasedsalinization of runoff returned to streams. The area’s forests and streams are associatedwith some of the region’s most attractive residential areas (Qpe 3 demand), given thatmuch of the remainder of the region is desert As elsewhere, extractive and developmentdemands for forest resources must compete with the demands to protect the intrinsic valueof at-risk species, such as the Mexican spotted owl and the Rio Grande silvery minnow,dependent on forest habitat.
Upper Midwest .
Temperate lakes and mixed coniferous-deciduous forests characterize the forests ofNorthern Michigan, Wisconsin and Minnesota that are represented by the NorthTemperate Lakes LTER station in Wisconsin. Sugar maple, yellow birch and hemlockdominate, interspersed with extensive stands of white and red pine. Numerous peat bogssupport black spruce, tamarach, and white cedar.
The regional economy associated with these forests is linked to the great cities of the FUpper Midwest.%Chicago has long exerted a strong economic influence over these forests,serving as the primary market and transshipment point for lumber from Michigan andWisconsin throughout the last few decades of the 19th Century (Cronon 1991). It’sinfluence continues, although it is filtered through or siphoned off by other largemetropolitan centers: Milwaukee, Detroit, and Minneapolis.
The competing demands for the resources of these forests, shown in Table 4.1, are similarto those in New England and the southern Appalachians. Timber is the dominant .commercial use of the forest (Type 1) and, as elsewhere, it displace other commercial uses,receives subsidies, and imposes environmental externalities on others Crepe 2).displacement often involves residential development, including second homes, Subsidiesinclude below-cost timber sales from the national forests. Given the absence of major riversystems, the major water-related externality fcom logging is not streamborne sediment,
40

but changes in the visual character of landscapes important for recreation. The forestshave important consumer amenities (Type 3) and intrinsic values (Type 4).
Interior Alaska
The taiga forests of Interior Alaska, bounded on the south by the Alaska Range and on thenorth by the Brooks Range, are part of a circumpolar band of boreal forests. These forestsare the subject of the Bonanza Creek Experimental Forest. Black spruce, larch, quakingaspen, white spruce, paper birch and balsam poplar predominate. These forests are uniquefor their association with an environment characterized by drastic seasonal fluctuations inlength of day, and temperature, as well as by a short growing season, consistently low soiltemperatures, low precipitation, and the occurrence of permafrost.
The economy of Alaska is not sufficiently well developed to constitute a major subnationalregional economy. Instead, it is part of the hinterland for the Seattle-Tacoma metropolitanarea. Any examination of the regional effect of a change in forest-management policyshould be viewed in terms of its effects on this metropolitan center. Subregional effectsshould be viewed in terms of effects on Anchorage and Fairbanks.
There is little commercial use of this forest currently. It is clear, however, that any futuremajor commercial use would encounter competing demands similar to those seenelsewhere. The forest was extensively logged in the past. Future logging is not foreseeablein the absence of major subsidization. Here, more than elsewhere, competition would comefrom subsistence hunting and fishing. The opportunity for subsistence hunting and fishingseems also to have considerable intrinsic value apart from its consumptive value.
c
--
4 1
.
V. ASSESSING THE DEMANDS FOR FOREST RESOURCES: THETIMBER INDUSTRY
In this chapter and the next, we summarize readily available data describing the majorcharacteristics of the competing demands for forest resources. Here, we focus on demandfor timber, the most widespread of the extractive or development demands we have labeledType 1 demand in Chapter II (see Figure 2.2). We first briefly examine data on forest landand timberland in the six states relevant to the LTER sites. We next examine data ontimber production and then turn to indicators of prices, jobs, and incomes associated withtimber-related products. In the next chapter we report data on the demands, which wehave labeled Types 2-4, competing with the timber industry for forest resources.
The story of the competing demands for forest resources in the six case study areas is adifficult one to tell with readily available data. Although there are mountains of data on thetimber industry, almost all of it is aggregated nationwide or according to the politicalboundaries of individual states or agglomerations of states-aggregations that fail to reflectthe spatial dimensions of either the six forest ecosystems or the related regionaleconomies. Nonetheless,- the data reveal some messages important for those making oranalyzing forest-management policy. These include:
l The timber industry’s demand for forest resources is substantial nationwide and in allbut the Interior Alaska case study. Rising prices indicate the increasing strength of thisdemand.
l In some important ways, however, this demand is noticeably less powerful in producingjobs and incomes than in the past. Converting a given unit of forest resources to timberis likely to generate less of an economic impact-measured primarily in jobs and
’incomes-than in the past. Fewer rural communities and households will be heavilydependent on timber for their prosperity.
A. ForestLapd and Timberland Resources-_ .\c
At the national level, about 66 percent, or 490 million acres, of all forest land is classed astimberlanb-forest land capable of producing more than 20 cubic feet per acre per year andnot withdrawn from timber production. The majority of timberland in the U.S., about 70percent, is located in the East (Powell et al. 1993). Over 90 percent of the forest land in theeastern states of New Hampshire and North Carolina is classified as timberland (Table 5.1).Wisconsin also has an extremely high percentage of its forest land, about 96 percent,classified as timberland In contrast, Alaska, with more acres of forest land than the otherfive states combined, has only 12 percent of its forest land classified as timberland. Oregon,second only to Alaska of the six states depicted in Table 5.1 in the amount of forest land,classifies three-quarters of its forest land as timberland. About one-third of New Mexico’sforest land is deemed capable of producing more than 20 cubic feet per acre year and is notwithdrawn from timber production.
42
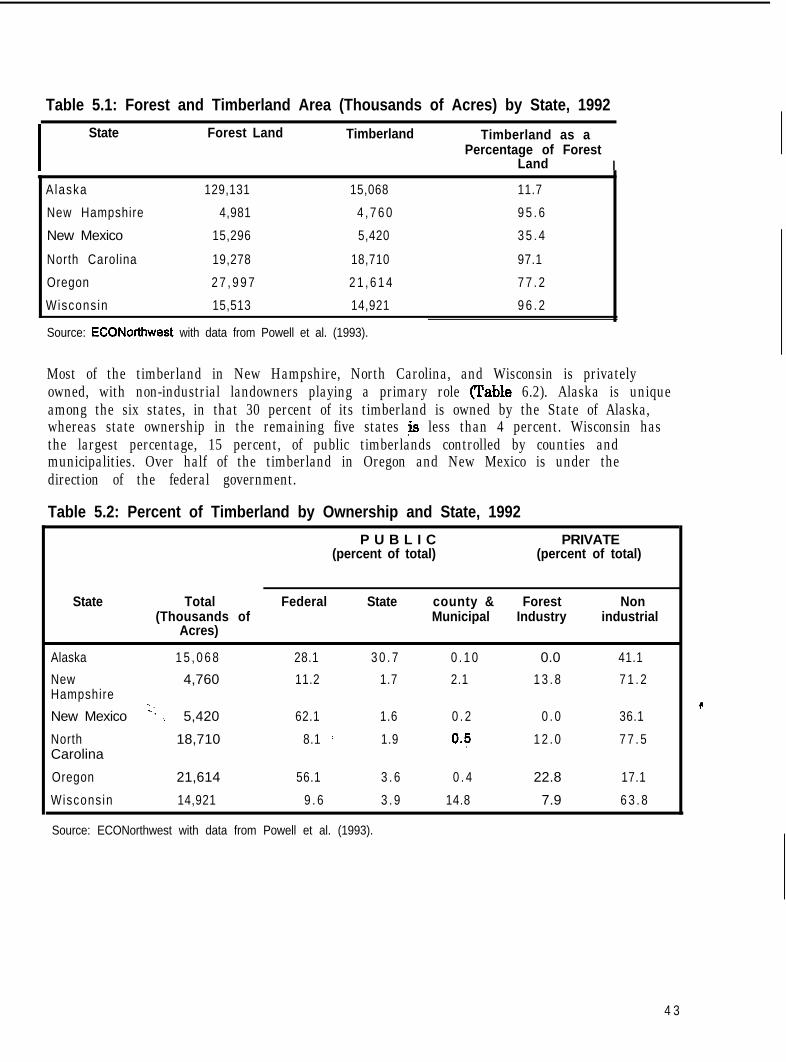
Table 5.1: Forest and Timberland Area (Thousands of Acres) by State, 1992
I State Forest Land Timberland Timberland as aPercentage of Forest
Land I
Alaska 129,131 15,068 11.7
New Hampshire 4,981 4 , 7 6 0 9 5 . 6
New Mexico 15,296 5,420 3 5 . 4
North Carolina 19,278 18,710 97.1
Oregon 2 7 , 9 9 7 2 1 , 6 1 4 7 7 . 2
Wiscons in 15,513 14,921 9 6 . 2
Source: ECONorthwest with data from Powell et al. (1993).
Most of the timberland in New Hampshire, North Carolina, and Wisconsin is privatelyowned, with non-industrial landowners playing a primary role Fable 6.2). Alaska is uniqueamong the six states, in that 30 percent of its timberland is owned by the State of Alaska,whereas state ownership in the remaining five states js less than 4 percent. Wisconsin hasthe largest percentage, 15 percent, of public timberlands controlled by counties andmunicipalities. Over half of the timberland in Oregon and New Mexico is under thedirection of the federal government.
Table 5.2: Percent of Timberland by Ownership and State, 1992
P U B L I C PRIVATE(percent of total) (percent of total)
State Total Federal State(Thousands of
Acres)
Alaska 1 5 , 0 6 8 28.1 3 0 . 7
New 4,760 11.2 1.7Hampshire
New Mexico -‘I ‘-. 5,420 62.1 1.6
North 18,710 8.1 ( 1.9Carolina
Oregon 21,614 56.1 3 . 6
Wiscons in 14,921 9 . 6 3 . 9
Source: ECONorthwest with data from Powell et al. (1993).
county & Forest NonMunicipal Industry industrial
0 . 1 0 0.0 41.1
2.1 1 3 . 8 7 1 . 2
0 . 2 0 . 0 36.1
0.5 1 2 . 0 7 7 . 5
0 . 4 22.8 17.1
14.8 7.9 6 3 . 8
c
4 3
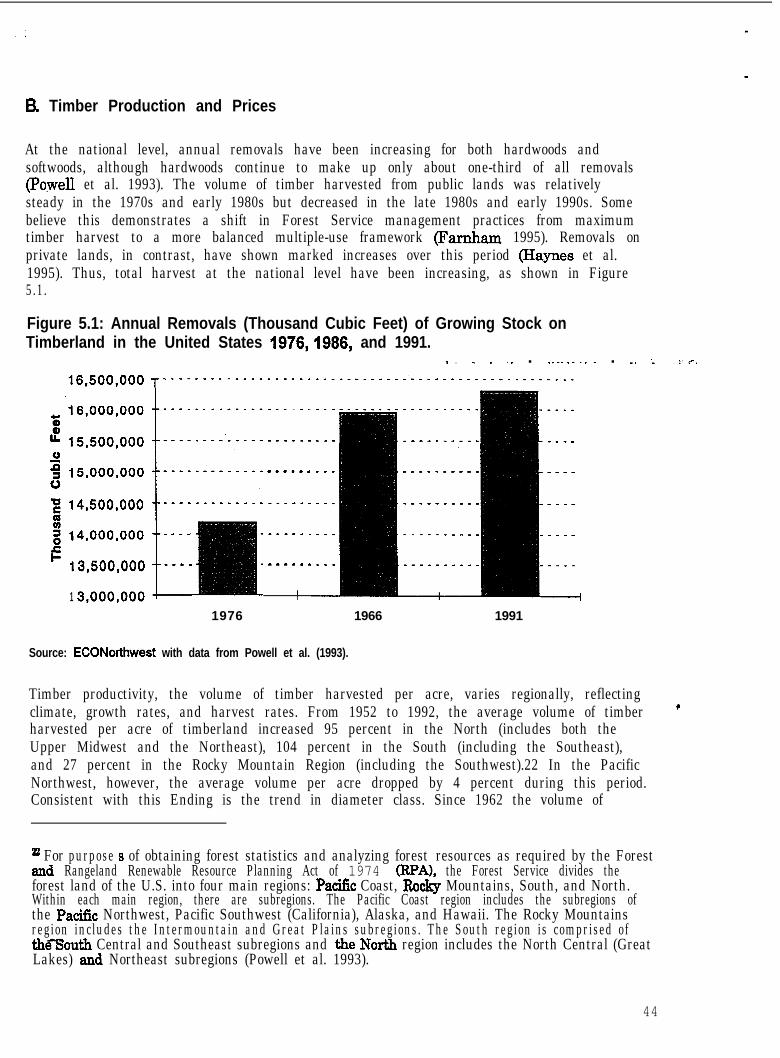
B. Timber Production and Prices
At the national level, annual removals have been increasing for both hardwoods andsoftwoods, although hardwoods continue to make up only about one-third of all removals(Pswell et al. 1993). The volume of timber harvested from public lands was relativelysteady in the 1970s and early 1980s but decreased in the late 1980s and early 1990s. Somebelieve this demonstrates a shift in Forest Service management practices from maximumtimber harvest to a more balanced multiple-use framework (Farnham 1995). Removals onprivate lands, in contrast, have shown marked increases over this period (Haynes et al.1995). Thus, total harvest at the national level have been increasing, as shown in Figure5.1.
Figure 5.1: Annual Removals (Thousand Cubic Feet) of Growing Stock onTimberland in the United States 1976,1986, and 1991.
8. _ _ ._ . ____._._. . -. 1. .‘_‘-_
1
6,000,OOO
5,500,000
5,000,000
4,500,000
4,000,000
3,500,000
~3,000,000
_ - - _
----
----
/
---_
----
_--_
---_-_
-_--_-
-_----
----_-
I8
1976 1966 1991
Source: ECONorthwest with data from Powell et al. (1993).
Timber productivity, the volume of timber harvested per acre, varies regionally, reflectingclimate, growth rates, and harvest rates. From 1952 to 1992, the average volume of timber ’harvested per acre of timberland increased 95 percent in the North (includes both theUpper Midwest and the Northeast), 104 percent in the South (including the Southeast),and 27 percent in the Rocky Mountain Region (including the Southwest).22 In the PacificNorthwest, however, the average volume per acre dropped by 4 percent during this period.Consistent with this Ending is the trend in diameter class. Since 1962 the volume of
22 For purpose s of obtaining forest statistics and analyzing forest resources as required by the Forest ’and Rangeland Renewable Resource Planning Act of 1974 @PA), the Forest Service divides theforest land of the U.S. into four main regions: Pacific Coast, Rocky Mountains, South, and North.Within each main region, there are subregions. The Pacific Coast region includes the subregions ofthe Pacific Northwest, Pacific Southwest (California), Alaska, and Hawaii. The Rocky Mountainsregion includes the Intermountain and Great Plains subregions. The South region is comprised ofthesouth Central and Southeast subregions and the North region includes the North Central (GreatLakes) and Northeast subregions (Powell et al. 1993).
44
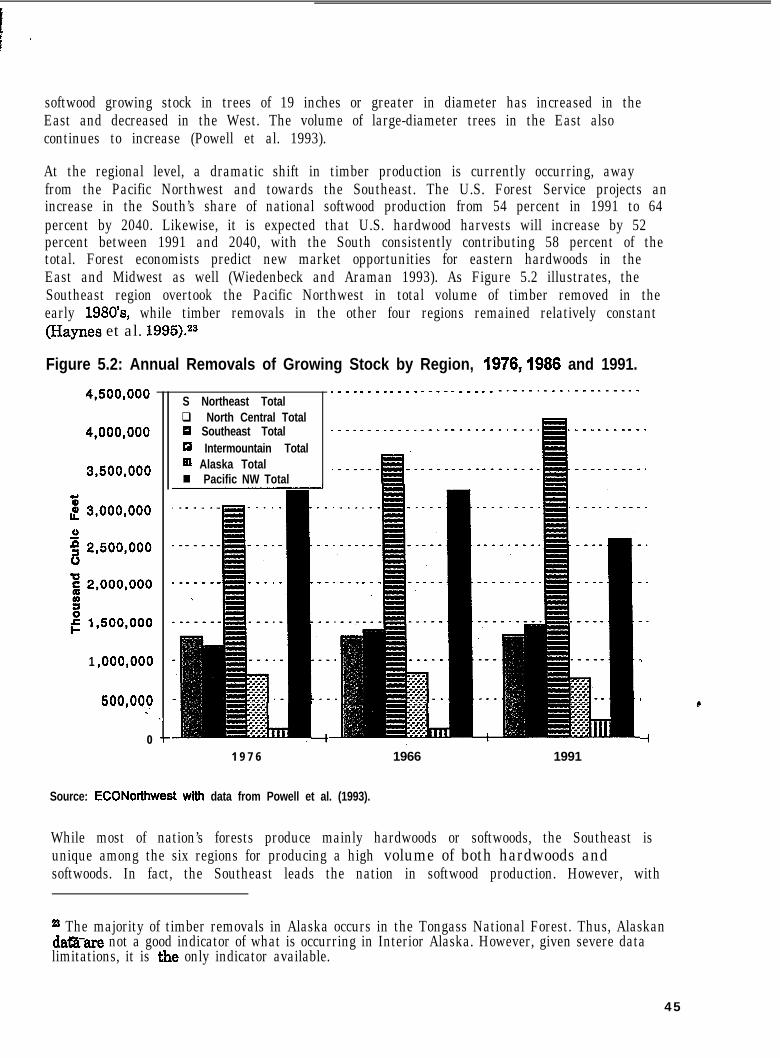
softwood growing stock in trees of 19 inches or greater in diameter has increased in theEast and decreased in the West. The volume of large-diameter trees in the East alsocontinues to increase (Powell et al. 1993).
At the regional level, a dramatic shift in timber production is currently occurring, awayfrom the Pacific Northwest and towards the Southeast. The U.S. Forest Service projects anincrease in the South’s share of national softwood production from 54 percent in 1991 to 64percent by 2040. Likewise, it is expected that U.S. hardwood harvests will increase by 52percent between 1991 and 2040, with the South consistently contributing 58 percent of thetotal. Forest economists predict new market opportunities for eastern hardwoods in theEast and Midwest as well (Wiedenbeck and Araman 1993). As Figure 5.2 illustrates, theSoutheast region overtook the Pacific Northwest in total volume of timber removed in theearly 1980’s, while timber removals in the other four regions remained relatively constant(Haynes et al. 1995).25
Figure 5.2: Annual Removals of Growing Stock by Region, 1976,1986 and 1991.
4,500,000
4,000,000
3,500,000
j 3,000,000
s2 2,500,OOOCJ
1 ,ooo,ooo
500,000m’
0
‘.
-I-
S Northeast Totalq North Central Total61 Southeast Total13 Intermountain Totalt6 Alaska Totaln Pacific NW Total
4
.--_-_-_--- -----------
.
.
-I
1 9 7 6 1966 1991
Source: ECONorthwest with data from Powell et al. (1993).
While most of nation’s forests produce mainly hardwoods or softwoods, the Southeast isunique among the six regions for producing a high volume of both hardwoods andsoftwoods. In fact, the Southeast leads the nation in softwood production. However, with
ss The majority of timber removals in Alaska occurs in the Tongass National Forest. Thus, Alaskandata-are not a good indicator of what is occurring in Interior Alaska. However, given severe datalimitations, it is the only indicator available.
45

.
timber removals above net annual growth over large areas, and inventories decreasingsince the late 1980’s, it’s not clear how long the region will be able to continue to log at thisrate (Raiser 1993; U.S. Department of Agriculture 1988). The Pacific Northwest region, thehistorical leader in softwood production, lost this distinction in the late 1980’s, afterignoring warnings appearing in the early 1970’s about unsustainable harvest rates (Beuteret al. 1976). Removals in the North Central region have increased over time but not asrapidly as in the Southeast. Notably, the Northeast region has produced a steady stream ofhardwoods for the last 15 years. In New Hampshire, timber growth is nearly doubleremovals (Ganser et al. 1990).
Since the type of wood harvested, softwood or hardwood, determines to a large extent thewood product produced, the six regions differ substantially in terms of their productdistribution, as illustrated in Figure 5.3. About 40 percent of all timber harvested in theNortheast and the Upper Midwest is used for fuelwood with another 30 percent in sawlogsand pulpwood each, and only a marginal amount being used. for veneer or other products.,.In contrast, almost three out of every 4 logs are used for sawlog production in theIntermountain region which contains the Southwest. The Southeast is almost evenly splitbetween sawlog and pulpwood production, mirroring its harvest of softwood andhardwoods. In the Pacific Northwest and Alaska, 45 and 35 percent, respectively, of timberproduction is used for sawlogs with approximately 15 percent going to pulpwoodproduction. The category “other”, which accounts for nearly half of Alaska’s timberproduction, accounts mostly for timber exports. (We remind the reader that the data forAlaska reflect primarily the southeastern portion of the state, distant from the BonanzaCreek LTER site.)
The value of timber in the different regions reflects the quality, costs, and supply of timberavailable. The U.S. Forest Service projects a rise in sawtimber prices over the next 25 yearsin all regions, but most notably in the Pacific Northwest and South, as adjustments aremade to timber supply limitations. By 2015, however, the Forest Service expects prices tobe generally stable in most regions. In the South, stumpage prices have traditionally laggedbehind the rest of the nation. The price differential is projected to gradually disappearduring the 1990s as Southern output replaces that of the Pacific Northwest. In pulpwood,short-term prices are expected to decline as a result of the impact of recycling on thedemand for fiber. By 2010, however, prices are expected to begin to rise more rapidly asrecycling ratesstabilize (Haynes et al. 1995).24-.
c
u Sepere data limitations prevent a more thorough discussion of price trends at the state level. For agood explanation see Lutz et al. (1992).
4 6
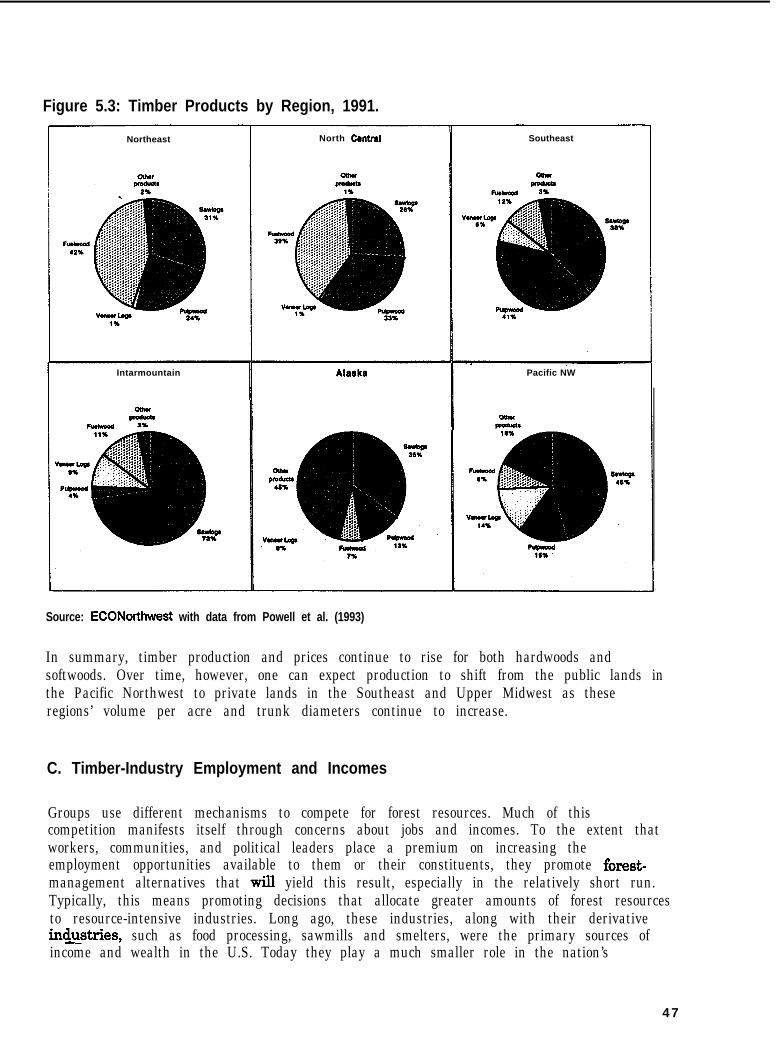
Figure 5.3: Timber Products by Region, 1991.
Northeast
Intarmountain
North Cantral
Alaska
Southeast
Pacific NW
Source: ECONorthwest with data from Powell et al. (1993)
In summary, timber production and prices continue to rise for both hardwoods andsoftwoods. Over time, however, one can expect production to shift from the public lands inthe Pacific Northwest to private lands in the Southeast and Upper Midwest as theseregions’ volume per acre and trunk diameters continue to increase.
C. Timber-Industry Employment and Incomes
Groups use different mechanisms to compete for forest resources. Much of thiscompetition manifests itself through concerns about jobs and incomes. To the extent thatworkers, communities, and political leaders place a premium on increasing theemployment opportunities available to them or their constituents, they promote forest-management alternatives that wiIl yield this result, especially in the relatively short run.Typically, this means promoting decisions that allocate greater amounts of forest resourcesto resource-intensive industries. Long ago, these industries, along with their derivativeindLstries, such as food processing, sawmills and smelters, were the primary sources ofincome and wealth in the U.S. Today they play a much smaller role in the nation’s
47
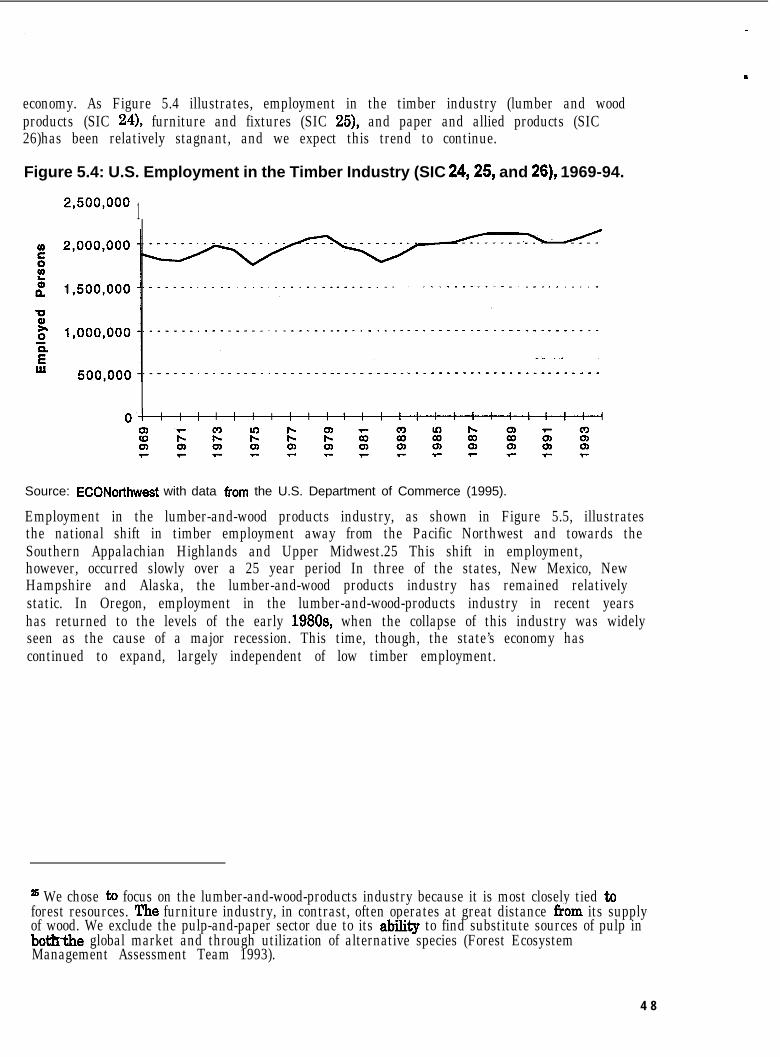
economy. As Figure 5.4 illustrates, employment in the timber industry (lumber and woodproducts (SIC 24), furniture and fixtures (SIC 25), and paper and allied products (SIC26)has been relatively stagnant, and we expect this trend to continue.
Figure 5.4: U.S. Employment in the Timber Industry (SIC 24,25, and 26), 1969-94.
2,500,OOO 1
Source: ECONorthwest with data From the U.S. Department of Commerce (1995).
Employment in the lumber-and-wood products industry, as shown in Figure 5.5, illustratesthe national shift in timber employment away from the Pacific Northwest and towards theSouthern Appalachian Highlands and Upper Midwest.25 This shift in employment,however, occurred slowly over a 25 year period In three of the states, New Mexico, NewHampshire and Alaska, the lumber-and-wood products industry has remained relativelystatic. In Oregon, employment in the lumber-and-wood-products industry in recent yearshas returned to the levels of the early 198Os, when the collapse of this industry was widelyseen as the cause of a major recession. This time, though, the state’s economy hascontinued to expand, largely independent of low timber employment.
zs We chose ID focus on the lumber-and-wood-products industry because it is most closely tied toforest resources. The furniture industry, in contrast, often operates at great distance from its supplyof wood. We exclude the pulp-and-paper sector due to its ability to find substitute sources of pulp inbot&the global market and through utilization of alternative species (Forest EcosystemManagement Assessment Team 1993).
4 8

Figure 5.5: Employment in the Lumber-and-Wood Products Industry (SIC 24), 1969-95.
90,000
80,000
E7 0 , 0 0 0
zi 6 0 , 0 0 0tP 5 0 , 0 0 0
-0g 4 0 , 0 0 00
=i5 3 0 , 0 0 0
2 0 . 0 0 0
-. _ --C-Alaska--f-North Carolina i
_ _ ,*Wisconsin I_. _ _ _ _ _ _ _ _ _ _ - _ _ . . _ - - - - _ _ _ _ -. _ _ _ _ _ _ _ _ _ _ _ _ - _ - _ _+I+ New Mexico
10,000
0
Source: ECONorthwest with data from the U.S. Department of Commerce (1995).
In Chapter III, we discuss the economic and social factors, including the adoption of labor-saying technological advances, a decline in the influence of labor unions, and a decline inreal wages, underlying the decline in resource-related industries as a source of jobs andincomes in the U.S. economy. Figure 5.6 illustrates the declining ability of the timberindustry to generate jobs and incomes for communities throughout the nation. Thenumber of jobs per thousand cubic feet of timber harvest has been declining for the last 20years.
In the foreseeable future, these trends will not reverse and, thus, the resource-relatedindustries will not become major sources of new jobs and higher incomes. Economicforecasters do not expect jobs or wages in the resource-extraction and manufacturingsectors to increases significantly (Franklin 1993; Oregon Department of Fish and Wildlifeand Washington Department of Fish and Wildlife 1996). Labor economists in Oregon notethese realities:
Where in 1979 it took 4.5 workers to process 1 million board feet of product in Northwestmills, by 1987 it took only 2.7 workers. More recent figures for ‘high tech’ mills show thenumber down to only 1.5 workers needed for the same production. Even if @reductionlevels could be held constant, fewer workers would be needed to produce the sameoutput (Oregon Employment Division: Research et al. 1993 p. 13).
There is some evidence that the displacement of labor through the integration ofcomputers and other high-technology into the timber industry also is occurring in otherregions, including the Southeast (West and Sinclair 1991).
49
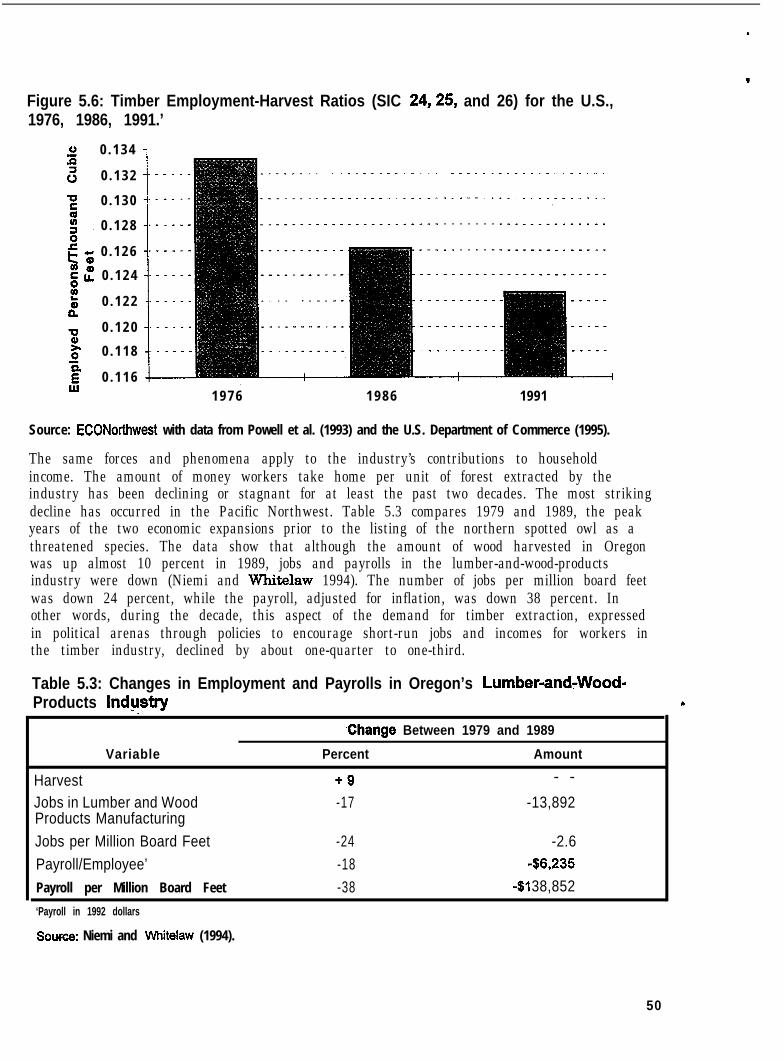
Figure 5.6: Timber Employment-Harvest Ratios (SIC 24,25, and 26) for the U.S.,1976, 1986, 1991.’
0 . 1 3 4
0 . 1 3 2
0 . 1 3 0
0 . 1 2 8
0 . 1 2 6
0 . 1 2 4
0 . 1 2 2
0 . 1 2 0
0 . 1 1 8
0 . 1 1 61 9 7 6 1 9 8 6 1991
Source: ECONorthwest with data from Powell et al. (1993) and the U.S. Department of Commerce (1995).
The same forces and phenomena apply to the industry’s contributions to householdincome. The amount of money workers take home per unit of forest extracted by theindustry has been declining or stagnant for at least the past two decades. The most strikingdecline has occurred in the Pacific Northwest. Table 5.3 compares 1979 and 1989, the peakyears of the two economic expansions prior to the listing of the northern spotted owl as athreatened species. The data show that although the amount of wood harvested in Oregonwas up almost 10 percent in 1989, jobs and payrolls in the lumber-and-wood-productsindustry were down (Niemi and Whitelaw 1994). The number of jobs per million board feetwas down 24 percent, while the payroll, adjusted for inflation, was down 38 percent. Inother words, during the decade, this aspect of the demand for timber extraction, expressedin political arenas through policies to encourage short-run jobs and incomes for workers inthe timber industry, declined by about one-quarter to one-third.
Table 5.3: Changes in Employment and Payrolls in Oregon’s Lumber-and7Wood-Products Industry
,Change Between 1979 and 1989
Variable Percent Amount
Harvest +9 - -
Jobs in Lumber and Wood -17 -13,892Products ManufacturingJobs per Million Board Feet -24 -2.6Payroll/Employee’ -18 -$6,235Payroll per Million Board Feet -38 -$I 38,852‘Payroll in 1992 dollars
Soufca: Niemi and whitelaw (1994).
50
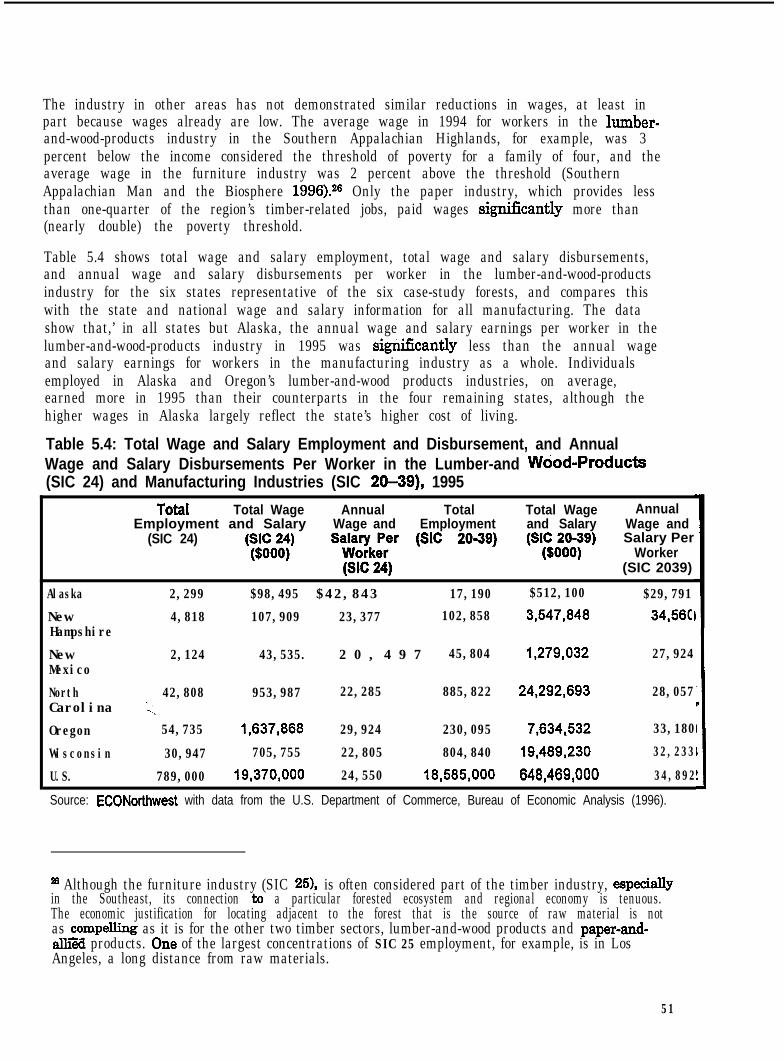
The industry in other areas has not demonstrated similar reductions in wages, at least inpart because wages already are low. The average wage in 1994 for workers in the lumber-and-wood-products industry in the Southern Appalachian Highlands, for example, was 3percent below the income considered the threshold of poverty for a family of four, and theaverage wage in the furniture industry was 2 percent above the threshold (SouthernAppalachian Man and the Biosphere 1996).26 Only the paper industry, which provides lessthan one-quarter of the region’s timber-related jobs, paid wages signiscantly more than(nearly double) the poverty threshold.
Table 5.4 shows total wage and salary employment, total wage and salary disbursements,and annual wage and salary disbursements per worker in the lumber-and-wood-productsindustry for the six states representative of the six case-study forests, and compares thiswith the state and national wage and salary information for all manufacturing. The datashow that,’ in all states but Alaska, the annual wage and salary earnings per worker in thelumber-and-wood-products industry in 1995 was signiscantly less than the annual wageand salary earnings for workers in the manufacturing industry as a whole. Individualsemployed in Alaska and Oregon’s lumber-and-wood products industries, on average,earned more in 1995 than their counterparts in the four remaining states, although thehigher wages in Alaska largely reflect the state’s higher cost of living.
Table 5.4: Total Wage and Salary Employment and Disbursement, and AnnualWage and Salary Disbursements Per Worker in the Lumber-and Wood-Products(SIC 24) and Manufacturing Industries (SIC 20-39), 1995
Total Total Wage Annual Total Total Wage AnnualEmployment and Salary Wage and Employment and Salary Wage and
(SIC 24)‘gotiy
Sa$oyk;;r (SIC 20-3?) w=&w Salary PerWorker
(ScC24) (SIC 2039)
Alaska 2,299 $98,495 $42,843 17,190 $512,100 $29,791
New 4,818 107,909 23,377 102,858 3,547,848 34,58CHampshire
New 2,124 43,535. 2 0 , 4 9 7 45,804 1,279,032 27,924Mexico
North 42,808 953,987 22,285 885,822 24,292,893 28,057Carolina k.
Oregon 54,735 1,837,888 29,924 230,095 7,834,532 33,180
Wisconsin 30,947 705,755 22,805 804,840 19,489,230 32,233
U.S. 789,000 19,370,000 24,550 18,585,OOO 848,489,OOO 34,892
Source: ECONorthwest with data from the U.S. Department of Commerce, Bureau of Economic Analysis (1996).
% Although the furniture industry (SIC 251, is often considered part of the timber industry, especiallyin the Southeast, its connection tc a particular forested ecosystem and regional economy is tenuous.The economic justification for locating adjacent to the forest that is the source of raw material is notas compelling as it is for the other two timber sectors, lumber-and-wood products and paper-and-alEa products. One of the largest concentrations of SIC 25 employment, for example, is in LosAngeles, a long distance from raw materials.
51
P
The low wages in those sectors of the timber industry other than the manufacture of paperand allied products have important implications for households and communities. For thepast century, forest-management agencies-the Forest Service and Bureau of LandManagement, along with numerous state and local counterpartS-have held that theallocation of forest resources to the timber industry could be manipulated to produceprosperous and stable communities (Bobbins 1989). Research from different regions,however, casts serious doubts on this premise. Looking at Western Washington during the198Os, Cook (1995) found that areas where the timber industry was a larger percentage oftotal employment tended to exhibit rising poverty, slower growth in employment andincomes, and increasing family instability. Kusel and Fortmann (1991) found thatsocioeconomic well-being in forest-dependent communities is most closely related to the.diversity of the human capital in the community, the diversity of uses of the adjacentforest, and the diversity of control (ownership) over nearby resources. Those communitieswith the narrowest ties to the forest had the lowest well-being. These findings aregenerally confirmed by others. Overdevest and Green (1995), for example, find thatalthough counties with well-capitalized pulp and paper plants generally exhibit bettereconomic indicators, the same cannot be said about those linked more closely to forest-management itself and to the primary processing of timber.
The central message here is that the timber industry has made, and will continue to make,important contributions to the economic well-being of many American workers, families,and communities, but it will not be as important as it was in the past. In terms of theeconomic variables-jobs and incomes-immediately important to most households, thetimber industry will yield fewer benefits per unit of forest it consumes. Arguments thatallocating forest resources to timber production is needed to sustain prosperous and stablecommunities increasingly will be seen as having less substance than in the past.
D. Timber’s Role in the Overall Economy
Several additional indicators con&m that timber’s importance within the greater economyis diminishing over time. This is true at both the national and regional levels, even wheretimber harvest and employment are increasing. Evidence below suggests that a giantdecoupling of .tbe economy from its natural resource base has occurred in the last 25 years.No longer areharvest rates driving regional economies in any of the states we examine.This is true of the traditional timber state of Oregon, as well as those, such as NorthCarolina and Wisconsin, where timber production is likely to grow.
5 2
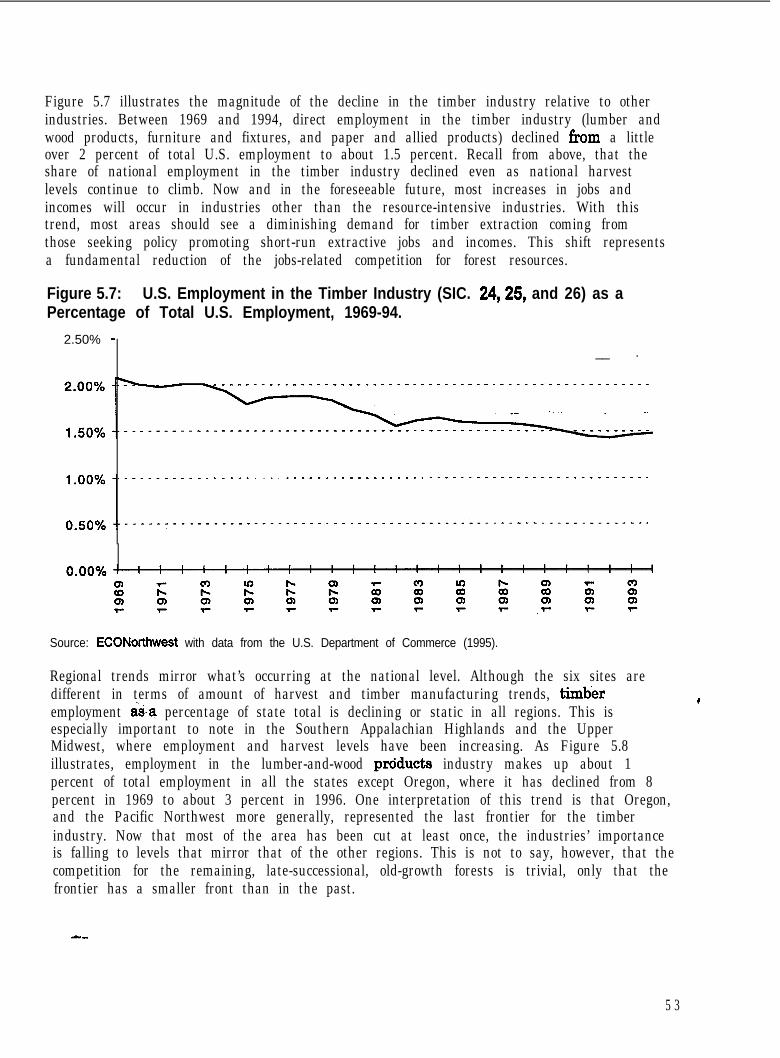
Figure 5.7 illustrates the magnitude of the decline in the timber industry relative to otherindustries. Between 1969 and 1994, direct employment in the timber industry (lumber andwood products, furniture and fixtures, and paper and allied products) declined 61om a littleover 2 percent of total U.S. employment to about 1.5 percent. Recall from above, that theshare of national employment in the timber industry declined even as national harvestlevels continue to climb. Now and in the foreseeable future, most increases in jobs andincomes will occur in industries other than the resource-intensive industries. With thistrend, most areas should see a diminishing demand for timber extraction coming fromthose seeking policy promoting short-run extractive jobs and incomes. This shift representsa fundamental reduction of the jobs-related competition for forest resources.
Figure 5.7: U.S. Employment in the Timber Industry (SIC. 24,25, and 26) as aPercentage of Total U.S. Employment, 1969-94.
2.50% -__ .
Source: ECONorthwest with data from the U.S. Department of Commerce (1995).
Regional trends mirror what’s occurring at the national level. Although the six sites aredifferent in terms of amount of harvest and timber manufacturing trends, timberemployment &a percentage of state total is declining or static in all regions. This is
c
especially important to note in the Southern Appalachian Highlands and the UpperMidwest, where employment and harvest levels have been increasing. As Figure 5.8illustrates, employment in the lumber-and-wood prdducts industry makes up about 1percent of total employment in all the states except Oregon, where it has declined from 8percent in 1969 to about 3 percent in 1996. One interpretation of this trend is that Oregon,and the Pacific Northwest more generally, represented the last frontier for the timberindustry. Now that most of the area has been cut at least once, the industries’ importanceis falling to levels that mirror that of the other regions. This is not to say, however, that thecompetition for the remaining, late-successional, old-growth forests is trivial, only that thefrontier has a smaller front than in the past.
5 3

Figure 5.8: Employment in Lumber-and-Wood Products Industry (SIC 24) as aPercentage of Total State Employment, 1969-95.
-t- North Carolina
4% .___________________-------------------------------------13% .-______________.______.____ --Ke_.._--~.~..,..__..~~_.___________________
2% _-.-_---.. ____.____.._______.-__.-----_~--.________.___.-
1 %
I . . , . . , , .
Source: ECONorthwest with data from the U.S. Department of Commerce (1995).
Another way of examining the importance of the timber industry relative to the rest of theeconomy, is to look at the portion of the gross state product (GSP) derived from timberindustry activity. As Figure 5.9 illustrates, despite the increase in timber harvest occurringin the Southern Appalachian Highlands and Upper Midwest, the percentage of total GSP .derived from the lumber-and-wood products industry is static.
Figure 5.9: GSP from the Lumber-and-Wood Products Industry as a Percentage “ofTotal GSP in Respective States, 1977-94.
-+-Alaska _-+-Alaska _+ New Hampshire+ New Hampshire-i- New Mexico-i- New Mexico
, ~.~(yyo -_ _ _ - - - - _ _ -, ~.~(yyo -- - _ - - - - _ _ - _ _ _ _ - - - _ _ _ _ - - _ _ _ _ _ _ - _ _ - - - _ _ _ _ _ _ _ - - - _ - - _ _- _ _ _ - - - _ _ _ _ - - _ _ - _ _ - - _ _ - - - _ _ _ - - - - - - - - - - - _
c-@-Wisconsin - ’8.00%
6.00%
4.J(yyo _-______-_-________-------------------------------------------------
t
2.00% _________-___--_-___-------------- _--------------
0.00%
Source: ECONorthwest with data from the. U.S. Department of Commerce (1995).
54
The only state, Oregon, in which a significant amount of GSP was once derived fiorn thelumber-and-wood products industry, experienced more than a 50 percent reduction in theimportance of timber to the state’s economy over period 1977-94.
E Summary
In Chapter III we discuss the different ways people express their demand for forestresources and combine them into three types of variables: value, impact, and equity. In thischapter we summarize value and impact data regarding the timber industry’s demand forforest resources. The data indicate that the timber-related demand generally is increasing,i.e., the relative prices of timber products are rising. The regional markets for timber areclosely linked nationally, and even globally, however, so that forest-management decisionsaffecting one regional market are moderated by the response nationally and globally.There are some important regional differences, most notably the essentially zero value oftimber in Interior Alaska, which primarily reflects the high cost of extracting timber andexporting it to world markets.
Although economists typically look at value to gauge the strength of a given type ofdemand and recommend using values to allocate forest resources-a~ong’~rrrpe~~g’ ‘--. ‘.demands, the American public and political structure often take a different approach. Theyseek to allocate forest resources to generate jobs and incomes, especially in the short run.The data on jobs and incomes indicate that this aspect of the pressure to convert forestresources to timber products is generally stagnant or declining. In some regions, notablythe Pacific Northwest, the jobs and incomes per unit of forest consumed by the timberindustry have declined markedly over the past two decades and further declines areanticipated. In other regions, timber-related jobs and incomes have been more stable, inabsolute terms, but have remained a small percentage of total jobs and incomes relative tothe remainder of the economy.
We now repeat a message from Chapter III. In all regions, allocating a unit of forestresources-measured in acres, million board feet, or other units-to a resource-intensiveindustry in the future probably will generate fewer jobs and smaller incomes than in thepast. Communities seeking to develop new jobs generally will have to look to industriesother than resource-related industries. Communities that have depended heavily onresource-related industries generally should expect economic stagnation or contraction inthe future if they continue to depend on these industries. Furthermore, communitieswhere the timber industry constitutes a major segment of the local economy often exhibithigh levels of poverty and other indicators of social stress. In public opinion, lawsuits, andadministrative proceedings, where the competition for forest resources is taking place,these changes undoubtedly weaken the arguments of those supporting allocation of forestresources to timber production. In other words, this component of the timber industry’sdemand for forest resources weakens.
In the next chapter, we examine the strength of those elements of demand that arecompeting with the timber industry for forest resources.
55
c
.
VLASSESSING THE DEMANDS FOR FOREST RESOURCES:DEMANDS COMPETING WITH THE TIMBER INDUSTRY
In this chapter we examine the major sources of demand for forest resources that arecompeting with the demand &om the timber industry. We look first at competingcommercial demand (Type 2). As we discuss in Chapter II, this type of demand has threecomponents: direct displacement of other commercial activity, subsidies, and externalities.Here, we discuss only subsidies and externalities, having given examples of displacedcommercial activity in Table 4.1. We then examine indicators of the demand for forest-related consumer amenities that may affect the locational decisions of household (Type 3).We conclude with a discussion of some of the demand for protecting the intrinsic valueassociated with each of the six case-study forests (Type 4). . ‘. *
A. Subsidies to the Timber Industry.
The most obvious subsidy to the forest industry occurs through the public timber saleprogram. U.S. taxpayers subsidize the timber industry by allowing it to obtain timber fromnational forests across the US and pay less than the costs the Forest Service incurs toadminister the timber-sale program (Council of Economic Advisers 1994; Greenberg 1997;Wilderness Society 1997). There is no single accounting scheme for measuring the extentof the subsidy, but the alternative approaches, combined, demonstrate that the subsidy issubstantial
One approach, the so-called cash-flow approach, compares the amount taxpayers spend onthe timber-sale program with the amount the program returns to the Treasury. Thisapproach measures the direct impacts of the timber-sale .program on the Treasury andtaxpayers. Since results may vary from year-to-year, it works best when applied over amultiple-year period. It also is limited if, in the course of implementing the timber-saleprogram, the Forest Service makes long-term investments. In such cases, the cash-flowanalysis will show these as costs but not show the corresponding, subsequent return on cthe investment..,
To address at least some of the limitations of the cash-flow approach, the Forest Servicedeveloped the Timber Sale Program Information Reporting System (TSPIRS). It attemptsto estimate the annual profits or losses for each national forests in a manner consistentwith common accounting practices for private landowners. Although many critics arguethat it incorrectly excludes many costs of the timber-sale program, 27 an analysis by theCongressional Research Service (Gorte 1994) concluded that u in general, TSPIRSadequately measures the profitability of the annual timber ‘program for each nationalforest. Figure 6.1 shows the results from the TSPIRS for the period 1989-93. The datashow that, by the Forest Service’s own accounting, taxpayers subsidized the timber-sale
n &, for example, The WiIderness Society (1994).
56
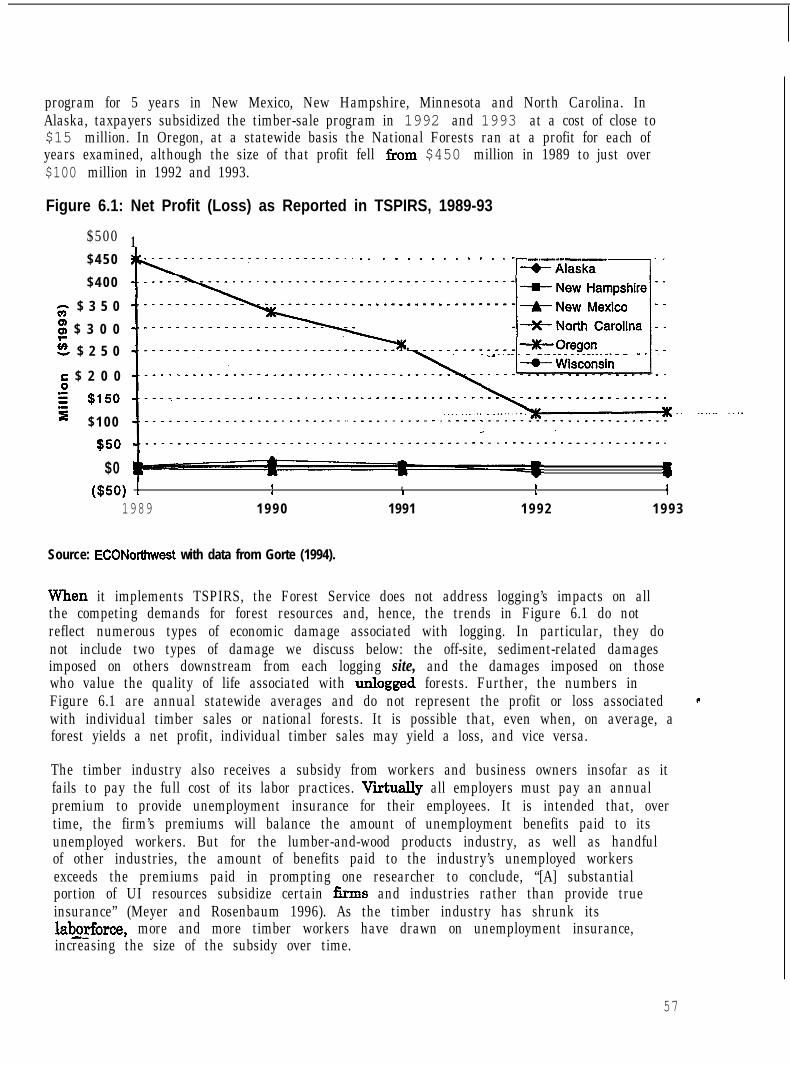
program for 5 years in New Mexico, New Hampshire, Minnesota and North Carolina. InAlaska, taxpayers subsidized the timber-sale program in 1992 and 1993 at a cost of close to$15 million. In Oregon, at a statewide basis the National Forests ran at a profit for each ofyears examined, although the size of that profit fell firom $450 million in 1989 to just over$100 million in 1992 and 1993.
Figure 6.1: Net Profit (Loss) as Reported in TSPIRS, 1989-93
$500$ 4 5 0
$ 4 0 0
; $ 3 5 0
s $ 3 0 0
5 $ 2 5 0
g $ 2 0 0
i $150$ 1 0 0
1-1. _ _ - - _ _ _ _ - - - _ _ -.------
__---_----we-------
.
$50 t------------------------------------------------------------------~*
$0 i($50) !
I , I8 I I I1989 1 9 9 0 1991 1 9 9 2 1 9 9 3
Source: ECONorthwest with data from Gorte (1994).
When it implements TSPIRS, the Forest Service does not address logging’s impacts on allthe competing demands for forest resources and, hence, the trends in Figure 6.1 do notreflect numerous types of economic damage associated with logging. In particular, they donot include two types of damage we discuss below: the off-site, sediment-related damagesimposed on others downstream from each logging site, and the damages imposed on thosewho value the quality of life associated with unlogged forests. Further, the numbers inFigure 6.1 are annual statewide averages and do not represent the profit or loss associatedwith individual timber sales or national forests. It is possible that, even when, on average, aforest yields a net profit, individual timber sales may yield a loss, and vice versa.
The timber industry also receives a subsidy from workers and business owners insofar as itfails to pay the full cost of its labor practices. Viiually all employers must pay an annualpremium to provide unemployment insurance for their employees. It is intended that, overtime, the firm’s premiums will balance the amount of unemployment benefits paid to itsunemployed workers. But for the lumber-and-wood products industry, as well as handfulof other industries, the amount of benefits paid to the industry’s unemployed workersexceeds the premiums paid in prompting one researcher to conclude, “[A] substantialportion of UI resources subsidize certain Erms and industries rather than provide trueinsurance” (Meyer and Rosenbaum 1996). As the timber industry has shrunk itslab_o_rforce, more and more timber workers have drawn on unemployment insurance,increasing the size of the subsidy over time.
c
57
On the surface, subsidies are inherently neither good nor bad, insofar as they reflectdecisions by legislatures to employ this public-policy mechanism to achieve particularobjectives. From this perspective, subsidies are nothing more than the cost society incurs toobtain the target benefits. It is not uncommon to see the linkages between subsidies andthese benefits erode, however, as the social and economic conditions that prompted thesubsidy change over time. Even when the linkage is tight, subsidies distort the use offorest resources by giving those who benefit from them an additional incentive to use theresources, while imposing costs on those who provide subsidies. Pressure, political orotherwise, to reduce the subsidies constitutes, in effect, a competing demand for those . *resources that would not be logged, but for the subsidies. This demand should be takeninto account if one is to assess the full competition for forest resources and the fulleconomic consequences of forest-management decisions.
B. Negative Externalities of Timber Production
Environmental externalities occur when industrial timber-production activities alter aforest resource and inadvertently impose increases in costs on taxpayers, households, andfirms in other industries. Figure 6.2 identifies seven categories of environmentalexternalities that might arise from timber production. Most of them stem from alterationsin streams that occur when logging and related activities, especially road-building, increasethe level of sediment, raise water temperatures, increase streamflows during someperiods, and alter riparian vegetation or the hydrologic structure of stream channels. Foran introduction to these issues, see Brown and Binkley (1994), Meehan (1991), and Reid(1993).
..’
To facilitate the investigation of externalities associated with timber production, we focuson sediment. Not all effects of sediment production are considered negative, and somepositive effects, such as importing soil and soil nutrients to the area where the sediment isdeposited, can be especially important. Nonetheless, most of the attention has been givento the negative effects shown in Figure 6.2. There is a long history of investigations into,and often heated debates about, the effects of timber production on sediment, and aboutthe effects of sediment on the ecosystem. Surprisingly, however, there is virtually noliterature that answers the question, If timber production increases sedimentation and ifthe increased sedimentation has specific ecological effects, what are the economicconsequences? Indeed, there are only a few efforts toaddress comprehensively theeconomic consequences of sediment from other sources. Ribaudo (1989) traces theeconomic consequences of sediment from agricultural production in the U.S., and Pimentelet al. (1995) look at the worldwide economic costs of sediment from all causes. Our searchof the literature found nothing similar focusing on timber production and other forest-management activities.
5 8

Figure 6.2: Possible Externalities from Timber Production
Timber Production
Recreational Fishing. Firms may forgo earnings if* timber production degrades fish habitat and reduces
fish populations.
t-i
Commercial Fishing. Firms may,forgo earnings ift imber production degrades fish habitat and reduces
pobulations of commercial fish. I
Sediment Removal. Taxpayers may pay to dredge-9 channels and treat municipal water if timber
production introduces sediment to public waters.
’Risk of Flooding. Property owners may incur extra risk
if t imber production increases runoff and createssediment that reduces stream-channel capacity.
’Water-Quality Reduction. Industries that use water as
an input to their products or for cooling may incurcosts if timber production reduces water quality.
Ecosystem Damage. Taxpayers may pay the costs of-) habitat reduction and litigation if timber production
causes ecosystem damage.
Tourism. Firms may forgo earnings if timber+ production diminishes the value and supply of
recreational opportunities.
Quality of Life. Individuals may experience a c-. - _ + decrease in their quality of life if timber production
degrades comsumption amenities.
Source: ECONorthwest.
Some sedimentation occurs in forest streams in the absence of timber production, with thepropensity for sedimentation varying among forests and among sites within a particularforest. In general, the highest sedimentation levels occur in the Southern Rockies, and thelowest occur in New England (see Table 6.1). In the following paragraphs we brieflysummarize the backdrop for future efforts to examine the economic importance ofsediment-related externalities of timber production in the case-study areas.
--
59
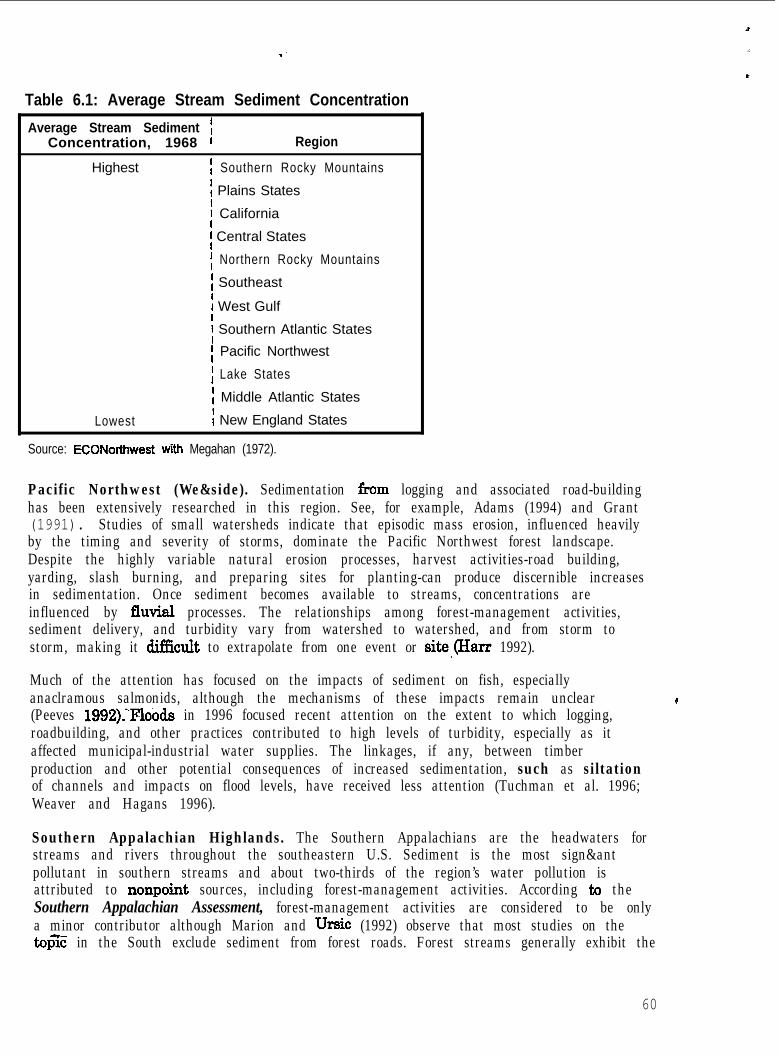
Table 6.1: Average Stream Sediment Concentration
Average Stream Sediment fConcentration, 1968 1 Region
Highest : Southern Rocky Mountains
: Plains States
I California
i Central States
t Northern Rocky Mountains
I Southeast
! West Gulf
i Southern Atlantic States
i Pacific Northwest
I Lake States
: Middle Atlantic States
Lowest I New England States
Source: ECONorthwest with Megahan (1972).
Pacific Northwest (We&side). Sedimentation from logging and associated road-buildinghas been extensively researched in this region. See, for example, Adams (1994) and Grant(1991). Studies of small watersheds indicate that episodic mass erosion, influenced heavilyby the timing and severity of storms, dominate the Pacific Northwest forest landscape.Despite the highly variable natural erosion processes, harvest activities-road building,yarding, slash burning, and preparing sites for planting-can produce discernible increasesin sedimentation. Once sediment becomes available to streams, concentrations areinfluenced by fluvial processes. The relationships among forest-management activities,sediment delivery, and turbidity vary from watershed to watershed, and from storm tostorm, making it diEcult to extrapolate from one event or site,(Harr 1992).
Much of the attention has focused on the impacts of sediment on fish, especiallyanaclramous salmonids, although the mechanisms of these impacts remain unclear b(Peeves 1992).‘Plobds in 1996 focused recent attention on the extent to which logging,roadbuilding, and other practices contributed to high levels of turbidity, especially as itaffected municipal-industrial water supplies. The linkages, if any, between timberproduction and other potential consequences of increased sedimentation, such as siltationof channels and impacts on flood levels, have received less attention (Tuchman et al. 1996;Weaver and Hagans 1996).
Southern Appalachian Highlands. The Southern Appalachians are the headwaters forstreams and rivers throughout the southeastern U.S. Sediment is the most sign&antpollutant in southern streams and about two-thirds of the region’s water pollution isattributed to nonpoint sources, including forest-management activities. According to theSouthern Appalachian Assessment, forest-management activities are considered to be onlya minor contributor although Marion and Ursic (1992) observe that most studies on theto$ in the South exclude sediment from forest roads. Forest streams generally exhibit the
60

region’s lowest concentrations of nonpoint source pollutants and meet sediment-relatedwater quality standards (Neary et al. 1992). These characteristics may change, however, astimber production in the region increases in response to recent and predicted priceincreases.
Neary et al. (1992) report that studies on federal lands in the South found considerablevariability in forest-management practices across physiographic subregions. Humanactivities raised sediment yields between 5 and 500 percent above natural levels. Inmountainous areas of the South, forest-management activities account for 2-10 percent ofthe human-induced sediment, and the selection of logging and site-preparation techniquescan have important influence on sediment levels. Erosion from all sources in the steepportions of the Blue Ridge Mountains is 50-60 times levels in the flat forests of the AtlanticCoastal Plain. The proximity of streams to gravel or low-quality roads makes roads a majorcontributor of sediment, but the extent to which timber production is responsible for theseroads in not certain (Southern Appalachian Man and the Biosphere 1996). There is littleresearch linking sedimentation from forest-management activities to downstream costs.
New England Northern Hardwood Forest. This region’s forest soils are not prone toerosion (Martin and Hornbeck 1992). Therefore, substantial increases in turbidity and soilerosion after clearcutting are relatively rare and “with proper precautions can be controlledduring and after harvest” (Hornbeck et al. 1987 p. 5). Research instead has focused on theeffectiveness of riparian zones to decrease changes in water temperature from the loss of
,forest canopy and changes in volume of streamflow (Hornbeck and Leak 1992; Pierce et al.1993).
Southwest. In their summary of the sediment-related literature on the Southwest,DeBano and Baker (1992) observe that the linkages between’land management andstream sediment are affected by more than a century of livestock grazing, clearing of trees,industrial logging, wildfires, all of which have affected large landscapes, and smalleractivities, such as the development of low-standard roads. Together, these activities haveremoved riparian and upland vegetation, compacted soils, increased surface runoff, andincreased the erosive power of the streams. Especially important are the biological andphysical modifications of riparian zones. Wetlands cover less than 1 percent of Arizona andNew Mexico, and represent about 66 percent of the wetlands that existed 200 years ago(Fretwell et al. 1996). Most of the wetland losses have occurred in the bosque forests along Flarger rivers. Higher elevation areas have fared better, although they have been affectedby recent logging and grazing.
Increased sedimentation has several important economic consequences in this region. Inthe Rio Grande Basin, for example, sediment carried from steeper elevations and deliveredto the flatter, Middle Rio Grande Valley near Albuquerque, raised the river bed and led toincreased flooding. Diking, controlling flows with dams, and related efforts to control theflooding have detached the river from the cottonwood forest that depend on periodicflooding (Crawford et al. 1996). Continued sedimentation fills in reservoirs, diminishingtheir ability to control future floods and hold water for municipal and agricultural use. TheBureau of Reclamation and other agencies incur extensive costs to remove sediment fromchannels and from behind dams and other structures. Meanwhile, soil loss from erodedlands can lead to reduced long-term soil productivity and impaired water quality (Finch andT&&r 1995).
61
Upper Midwest. Research in this region has focused more on human impacts on aquatic,especially lacustrine, ecosystems and less on the sediment-related impacts of forestmanagement. Forestry practices in the areas, however, have been shown to alter aquaticprocesses through the removal of coarse woody debris and the change in chemicalprocesses in deforested areas. Findings from research on streams in this region generallycorrespond to those from other regions (Edwards 1992).
Interior Alaska. Because this region is relatively inaccessible, it contains essentially noindustrial timber production. However, research done on boreal forests elsewheredemonstrate that logging can generate significant amounts of sedimentation, seriouslythreatening associated stream ecosystems (Garman and Moring 1991). Looking atsedimentation generated by placer mining, Scannell (1992) reports that the effects oninvertebrate populations can persist more than 90 km downstream. If sediment loads werehigh enough, arctic grayling abandoned a stream entirely. With less extreme loads,population levels dropped as the fish experienced loss of habitat, restricted prey, decreasedsight-feeding ability, and mortality. Studies have not revealed how long it will take forstreams no longer subjected to sediment inputs to flush embedded sediments or toreestablish side channels in channelized waterways.
C. Consumption Amenities May Affect Locational Decisions of Households
Different attributes of each region’s natural amenities can attract workers, retirees, andothers seeking proximity to recreational opportunities and other forest amenities. In theprocess, the amenities act as a second paycheck that increases the overall economic well-being of those who value them and live nearby. As we explain in Chapter II, the associateddemand for amenities does not manifest itself directly in the markets for forest resources,themselves, but in housing and labor markets. The amenities that can be affected byindustrial timber production include:
.
l The visual aesthetics ‘of riparian areas. In general, the more natural the appearance ofthese areas, the greater their aesthetic value. Timber production can reduce theamenity values of these areas by altering their natural appearance.
l The visualaesthetics of some upland areas that otherwise would experience timber c
harvests. I’lmber production can reduce the amenity values of these areas by alteringtheir natural appearance.
l The aesthetics and water-related recreational opportunities associated with streamswhose water quality is affected by timber-production activities, especially thoseactivities that introduce stream sediment.
62.
l The aesthetics and water-related recreational opportunities associated with thequantity and timing of water runoff. Timber production can alter seasonal stream flow
patterns, with more runoff as peak flow in the spring, when recreational demandtypically is lower, and less as base flow during the summer, when demand typically ishigher.
l The visual aesthetics and recreational opportunities associated with increasedpopulations of wildlife related to riparian areas.
Across the nation, these amenities exert an influence on the location, structure, and rateof economic growth. One of the ways this influence occurs is through the so-called people-first-then-jobs mechanism, in which households move to (or stay in) an area because theywant to live there, triggering the development of businesses seeking to take advantage ofthe household’s labor supply and consumptive demand. Insofar as conventional timberproduction affects the supply of amenities important to households’ locational decisions,they will have ripple-effects throughout the area’s local and region& economies. In manyregions of the U.S. an important element of quality of life is access to the area’s natural-resource amenities. By attracting workers, the amenities hold down wages in the localregional economy, creating a comparative advantage for local Erms relative to those inregions without wage-suppressing amenities, and spurring faster local economic growththan otherwise would occur.
Numerous studies have confirmed this idea by measuring the effects of amenities, such asaverage winter and summer temperatures, on incomes and housing (Bloomquist andothers 1988, Knapp and Graves 1989, Roback 1982). Research on the value of forestamenities, however, is scarce (Cushing 1987), although recent efforts have examined theproximity to some general amenities, such as federal lands (Gabriel et al. 1996) andwilderness (Rudzitis and Johansen 1991). As Table 6.2 illustrates, both the range of valuesand variables used to approximate the quality of life factor that pulls individuals,households, and firms to each of the six regions are quite varied Thus, one is left with astrong theoretical foundation for expecting that society expresses this aspect of thecompetition for forest amenities through labor and land markets, but the empirical recordfor quantifying this demand, especially for specific forest-amenity resources is seriouslyincomplete.
Workers are not.,the only ones to value natural amenities when making locationaldecisions. Retirees and recreationists are flocking to areas that provide a uniquecombination of climate, beauty, and culture. Communities that offer natural amenities areable to attract tourists, seasonal-home owners, and retirees, whose expenditures supportthe service economy. In particular, researchers are noting that one of the differencesbetween nonmetropolitan communities that are thriving economically and those that arenot is a connection to natural amenities (Billings and Tickameyer 1993; Drabenstott andSmith 1996; Sears et al. 1992). The presence of retirees and their non-labor income isespecially valuable since they stay longer in the community adjacent to the amenities,purchasing goods and service (Stewart .and Stynes 1994).
c
6 3
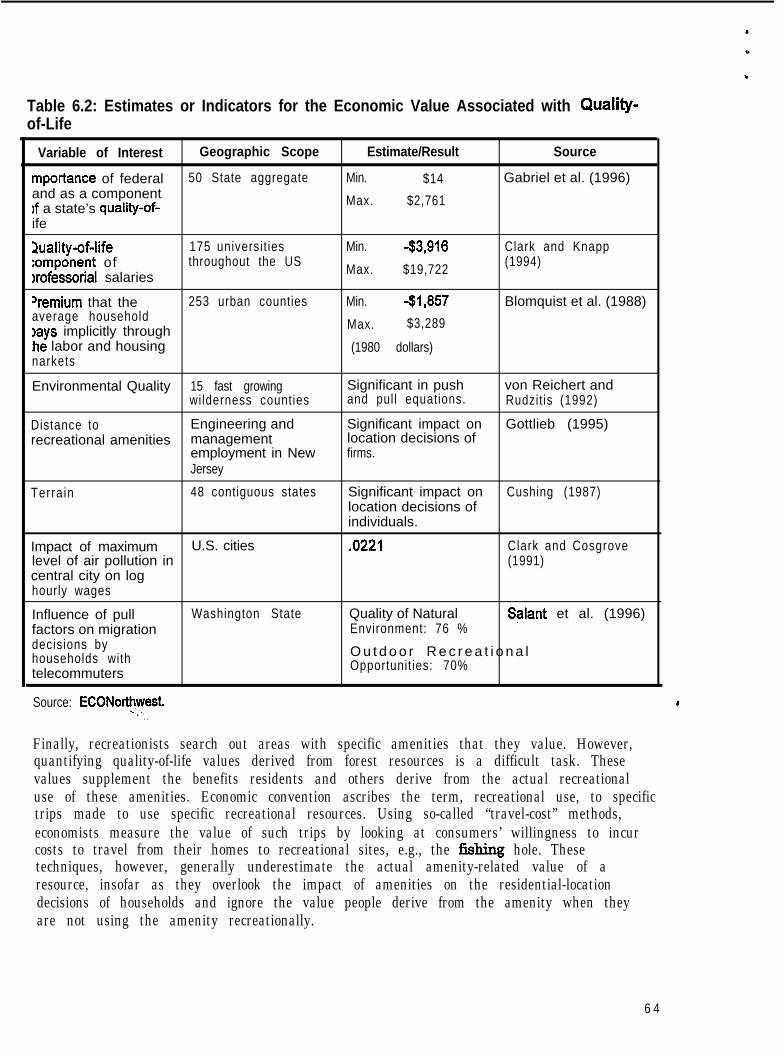
Table 6.2: Estimates or Indicators for the Economic Value Associated with Quality-of-Life
Variable of Interest Geographic Scope Estimate/Result Source
mportance of federal 50 State aggregate Min. $14 Gabriel et al. (1996)and as a componentIf a state’s quaiity-of- Max. $2,761
ife
luality-of-life:omponent of)rofessorial salaries
175 universit iesthroughout the US
Min.
Max.
-$3,916
$19,722
Clark and Knapp(1994)
+emium that the 253 urban counties Min. -$1,857 Blomquist et al. (1988)average household)ays implicitly through Max. $3,289
:he labor and housing (1980 dollars)narkets
Environmental Quality 15 fast growing Significant in push von Reichert andwilderness counties and pull equations. Rudzitis (1992)
Distance torecreational amenities
Engineering and Significant impact on Gottlieb (1995)management location decisions ofemployment in New firms.Jersey
Terrain 48 contiguous states Significant impact on Cushing (1987)location decisions ofindividuals.
Impact of maximum U.S. cities .0221 Clark and Cosgrovelevel of air pollution in (1991)central city on loghourly wages
Influence of pull Washington State Quality of Natural Salant et al. (1996)factors on migration Environment: 76 %decisions byhouseholds with O u t d o o r R e c r e a t i o n a l
telecommuters Opportunit ies: 70%
Source: ECONor$west.. .
C
Finally, recreationists search out areas with specific amenities that they value. However,quantifying quality-of-life values derived from forest resources is a difficult task. Thesevalues supplement the benefits residents and others derive from the actual recreationaluse of these amenities. Economic convention ascribes the term, recreational use, to specifictrips made to use specific recreational resources. Using so-called “travel-cost” methods,economists measure the value of such trips by looking at consumers’ willingness to incurcosts to travel from their homes to recreational sites, e.g., the Csbing hole. Thesetechniques, however, generally underestimate the actual amenity-related value of aresource, insofar as they overlook the impact of amenities on the residential-locationdecisions of households and ignore the value people derive from the amenity when theyare not using the amenity recreationally.
6 4
Implicitly, travel-cost models assume that people decide where to live and workindependent of the recreational resource. If one angler travels from her home in Miami tofish for trout on a river in western North Carolina, these techniques would conclude thatshe places a greater value on the trout than another angler who travels from his home inKnoxville because she incurs greater travel costs. Furthermore, they would conclude thata third angler, who has purchased a house on the river and fishes off the back porch,places very little value on the trout because .he incurs essentially no travel costs to gofishing.
This reasoning overlooks the possibility that the third angler places the greatest value ontrout and has based his residential-location decision on a desire to live next to the river. Italso overlooks the possibility that the second angler based his residential-location, decisionon a desire to live near the trout and other considerations and, on balance chose to live inKnoxville rather than on the river, in Miami, or anyplace else.
_......... ._.Recreation-value studies are similarly flawed. These studies often overlook the economicvalue people place on forest amenities in contexts other than recreational trips. One maybe just as willing to pay to see clean, bubbling streams rather than desiccated; dirty ones, orforested vistas rather that clearcuts while on a business or shopping trip or while sitting inthe backyard.28
While these methodology questions impair the ability to compare the size of the “secondpaycheck” of the different study sites, a few indicators do exist. Greenwood et al. (1991)examine the patterns of migration across the sfty states and attempt to determine therelative strengths of two primary motives workers and households have for moving: toearn a higher wage (adjusted for differences among the states in the costs of living); and tohave access to the particular amenities of the individual states. Based on migrationpatterns for 1971 to 1987, the authors find that the amenity-related differentials for the sixstudy states varies, as illustrated in Table 6.3. Workers in Oregon, New Mexico and NewHampshire would not relocate elsewhere in the U.S. unless they received an increase inwages around 16 percent, while in North Carolina workers would only require a 6 percentwage increase. Wisconsin workers would move for the same salary. Reflecting the highd&amenities associated with arctic living, Alaskan workers would accept a pay decrease of6 percent to move elsewhere. ‘.
Evidence suggests that retirees also find these six regions attractive. According to the U.S.Department of Agriculture (1995), there are a number of retirement-destination counties,defined as counties experiencing 16 percent or more in-migration of people age 60 andolder in the 1980’s, in each of the 6 regions including Alaska.
za Although economists commonly would focus their valuative efforts on one’s willingness to pay to seethese amenities, an alternative perspective would look at one’s willingness to accept compensation tofors-them. For a discussion of when to choose one perspective over the other, see Shogren and others(1994).
65
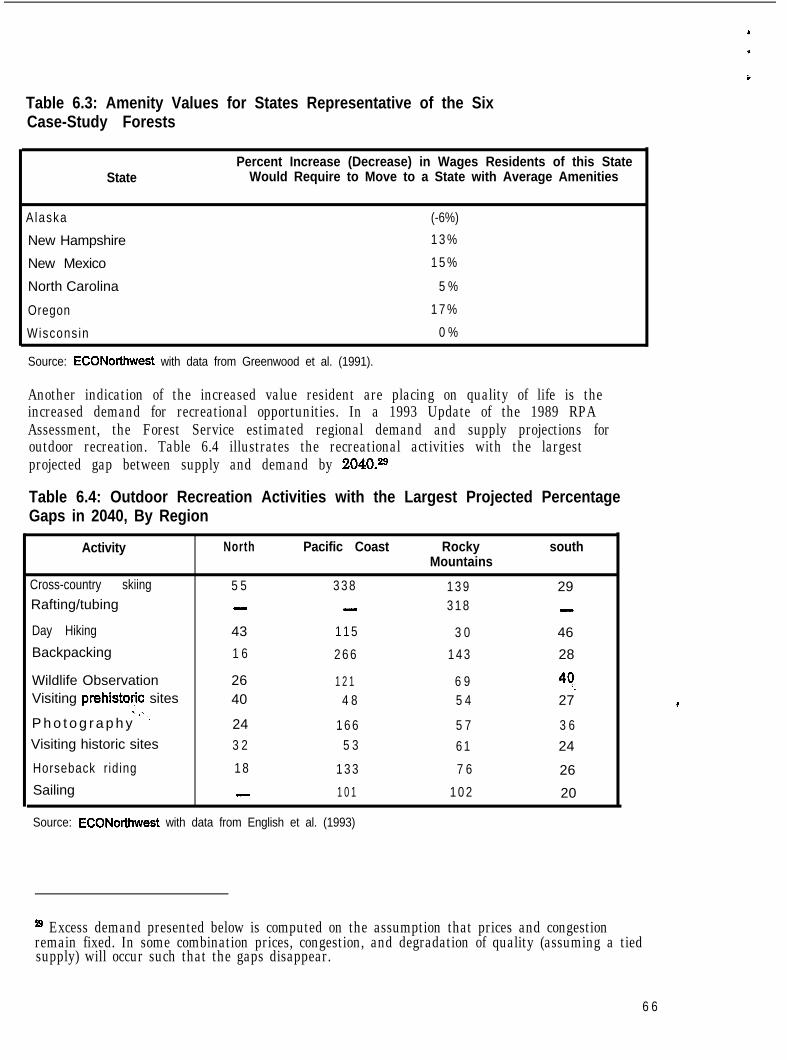
Table 6.3: Amenity Values for States Representative of the SixCase-Study Forests
Percent Increase (Decrease) in Wages Residents of this StateState Would Require to Move to a State with Average Amenities
Alaska (-6%)
New Hampshire 1 3 %
New Mexico 1 5 %
North Carolina 5 %
Oregon 1 7 %
Wiscons in 0 %
Source: ECONorthwest with data from Greenwood et al. (1991).
Another indication of the increased value resident are placing on quality of life is theincreased demand for recreational opportunities. In a 1993 Update of the 1989 RPAAssessment, the Forest Service estimated regional demand and supply projections foroutdoor recreation. Table 6.4 illustrates the recreational activities with the largestprojected gap between supply and demand by 2040.29
Table 6.4: Outdoor Recreation Activities with the Largest Projected PercentageGaps in 2040, By Region
Activity North Pacific Coast Rocky southMountains
Cross-country skiing 5 5 3 3 8 1 3 9 29Rafting/tubing - - 3 1 8 -
Day Hiking 43 1 1 5 3 0 46Backpacking 1 6 2 6 6 1 4 3 28
Wildlife Observation 26 1 2 1 6 9 49Visiting prehistorjc sites 40 4 8 5 4 27
- .,P h o t o g r a p h y X 24 1 6 6 5 7 3 6Visiting historic sites 3 2 5 3 6 1 24
Horseback r iding 1 8 1 3 3 7 6 26Sailing - 1 0 1 1 0 2 20
Source: ECONorthwest with data from English et al. (1993)
c
?g Excess demand presented below is computed on the assumption that prices and congestionremain fixed. In some combination prices, congestion, and degradation of quality (assuming a tiedsupply) will occur such that the gaps disappear.
6 6
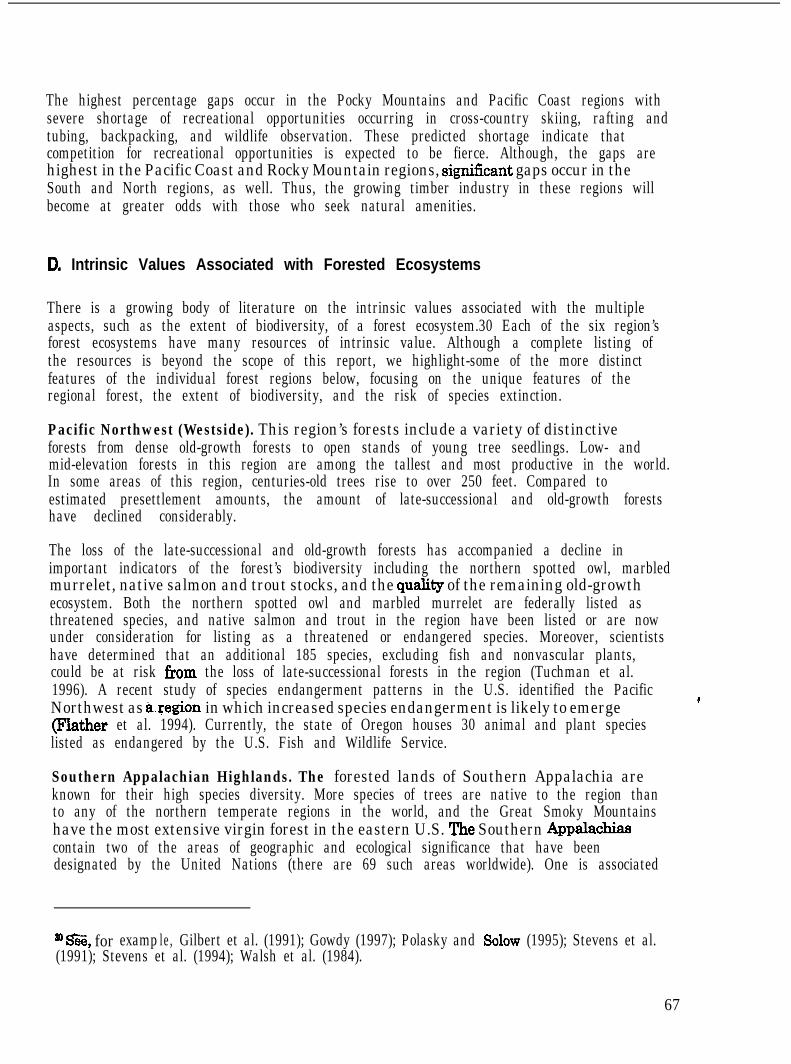
The highest percentage gaps occur in the Pocky Mountains and Pacific Coast regions withsevere shortage of recreational opportunities occurring in cross-country skiing, rafting andtubing, backpacking, and wildlife observation. These predicted shortage indicate thatcompetition for recreational opportunities is expected to be fierce. Although, the gaps arehighest in the Pacific Coast and Rocky Mountain regions, sign&ant gaps occur in theSouth and North regions, as well. Thus, the growing timber industry in these regions willbecome at greater odds with those who seek natural amenities.
D. Intrinsic Values Associated with Forested Ecosystems
There is a growing body of literature on the intrinsic values associated with the multipleaspects, such as the extent of biodiversity, of a forest ecosystem.30 Each of the six region’sforest ecosystems have many resources of intrinsic value. Although a complete listing ofthe resources is beyond the scope of this report, we highlight-some of the more distinctfeatures of the individual forest regions below, focusing on the unique features of theregional forest, the extent of biodiversity, and the risk of species extinction.
Pacific Northwest (Westside). This region’s forests include a variety of distinctiveforests from dense old-growth forests to open stands of young tree seedlings. Low- andmid-elevation forests in this region are among the tallest and most productive in the world.In some areas of this region, centuries-old trees rise to over 250 feet. Compared toestimated presettlement amounts, the amount of late-successional and old-growth forestshave declined considerably.
The loss of the late-successional and old-growth forests has accompanied a decline inimportant indicators of the forest’s biodiversity including the northern spotted owl, marbledmurrelet, native salmon and trout stocks, and the quality of the remaining old-growthecosystem. Both the northern spotted owl and marbled murrelet are federally listed asthreatened species, and native salmon and trout in the region have been listed or are nowunder consideration for listing as a threatened or endangered species. Moreover, scientistshave determined that an additional 185 species, excluding fish and nonvascular plants,could be at risk from the loss of late-successional forests in the region (Tuchman et al.1996). A recent study of species endangerment patterns in the U.S. identified the PacificNorthwest as aregion’ in which increased species endangerment is likely to emerge ’(Flather et al. 1994). Currently, the state of Oregon houses 30 animal and plant specieslisted as endangered by the U.S. Fish and Wildlife Service.
Southern Appalachian Highlands. The forested lands of Southern Appalachia areknown for their high species diversity. More species of trees are native to the region thanto any of the northern temperate regions in the world, and the Great Smoky Mountainshave the most extensive virgin forest in the eastern U.S. The Southern Appalachiascontain two of the areas of geographic and ecological significance that have beendesignated by the United Nations (there are 69 such areas worldwide). One is associated
30 ES, for examp le, Gilbert et al. (1991); Gowdy (1997); Polasky and Solow (1995); Stevens et al.(1991); Stevens et al. (1994); Walsh et al. (1984).
67
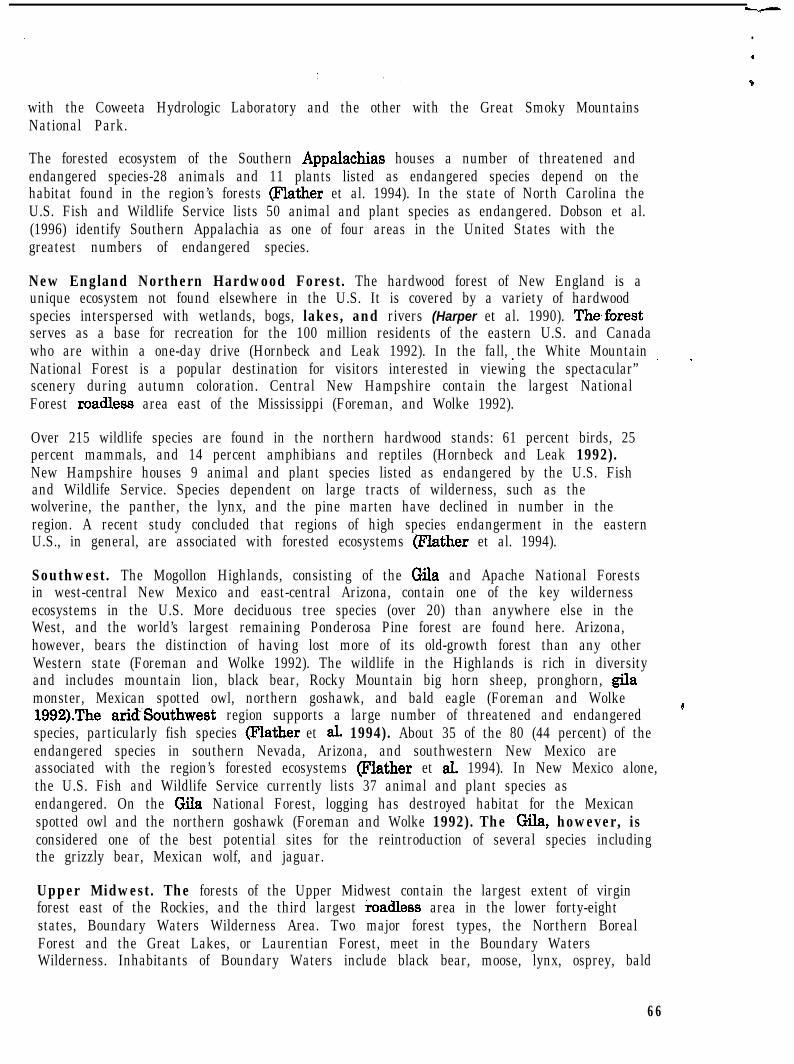
I l
�
with the Coweeta Hydrologic Laboratory and the other with the Great Smoky MountainsNational Park.
The forested ecosystem of the Southern Appalachias houses a number of threatened andendangered species-28 animals and 11 plants listed as endangered species depend on thehabitat found in the region’s forests (Flather et al. 1994). In the state of North Carolina theU.S. Fish and Wildlife Service lists 50 animal and plant species as endangered. Dobson et al.(1996) identify Southern Appalachia as one of four areas in the United States with thegreatest numbers of endangered species.
New England Northern Hardwood Forest. The hardwood forest of New England is aunique ecosystem not found elsewhere in the U.S. It is covered by a variety of hardwoodspecies interspersed with wetlands, bogs, lakes, and rivers (Harper et al. 1990). The,forestserves as a base for recreation for the 100 million residents of the eastern U.S. and Canadawho are within a one-day drive (Hornbeck and Leak 1992). In the fall, the White Mountain.National Forest is a popular destination for visitors interested in viewing the spectacular” ’ -scenery during autumn coloration. Central New Hampshire contain the largest NationalForest roadless area east of the Mississippi (Foreman, and Wolke 1992).
Over 215 wildlife species are found in the northern hardwood stands: 61 percent birds, 25percent mammals, and 14 percent amphibians and reptiles (Hornbeck and Leak 1992).New Hampshire houses 9 animal and plant species listed as endangered by the U.S. Fishand Wildlife Service. Species dependent on large tracts of wilderness, such as thewolverine, the panther, the lynx, and the pine marten have declined in number in theregion. A recent study concluded that regions of high species endangerment in the easternU.S., in general, are associated with forested ecosystems @lather et al. 1994).
Southwest. The Mogollon Highlands, consisting of the Gila and Apache National Forestsin west-central New Mexico and east-central Arizona, contain one of the key wildernessecosystems in the U.S. More deciduous tree species (over 20) than anywhere else in theWest, and the world’s largest remaining Ponderosa Pine forest are found here. Arizona,however, bears the distinction of having lost more of its old-growth forest than any otherWestern state (Foreman and Wolke 1992). The wildlife in the Highlands is rich in diversityand includes mountain lion, black bear, Rocky Mountain big horn sheep, pronghorn, gilamonster, Mexican spotted owl, northern goshawk, and bald eagle (Foreman and Wolke1992).The aridSouthwest region supports a large number of threatened and endangered ’species, particularly fish species @lather et al. 1994). About 35 of the 80 (44 percent) of theendangered species in southern Nevada, Arizona, and southwestern New Mexico areassociated with the region’s forested ecosystems (Flather et aL 1994). In New Mexico alone,the U.S. Fish and Wildlife Service currently lists 37 animal and plant species asendangered. On the Gila National Forest, logging has destroyed habitat for the Mexicanspotted owl and the northern goshawk (Foreman and Wolke 1992). The Gila, however, isconsidered one of the best potential sites for the reintroduction of several species includingthe grizzly bear, Mexican wolf, and jaguar.
Upper Midwest. The forests of the Upper Midwest contain the largest extent of virginforest east of the Rockies, and the third largest roadless area in the lower forty-eightstates, Boundary Waters Wilderness Area. Two major forest types, the Northern BorealForest and the Great Lakes, or Laurentian Forest, meet in the Boundary WatersWilderness. Inhabitants of Boundary Waters include black bear, moose, lynx, osprey, bald
66
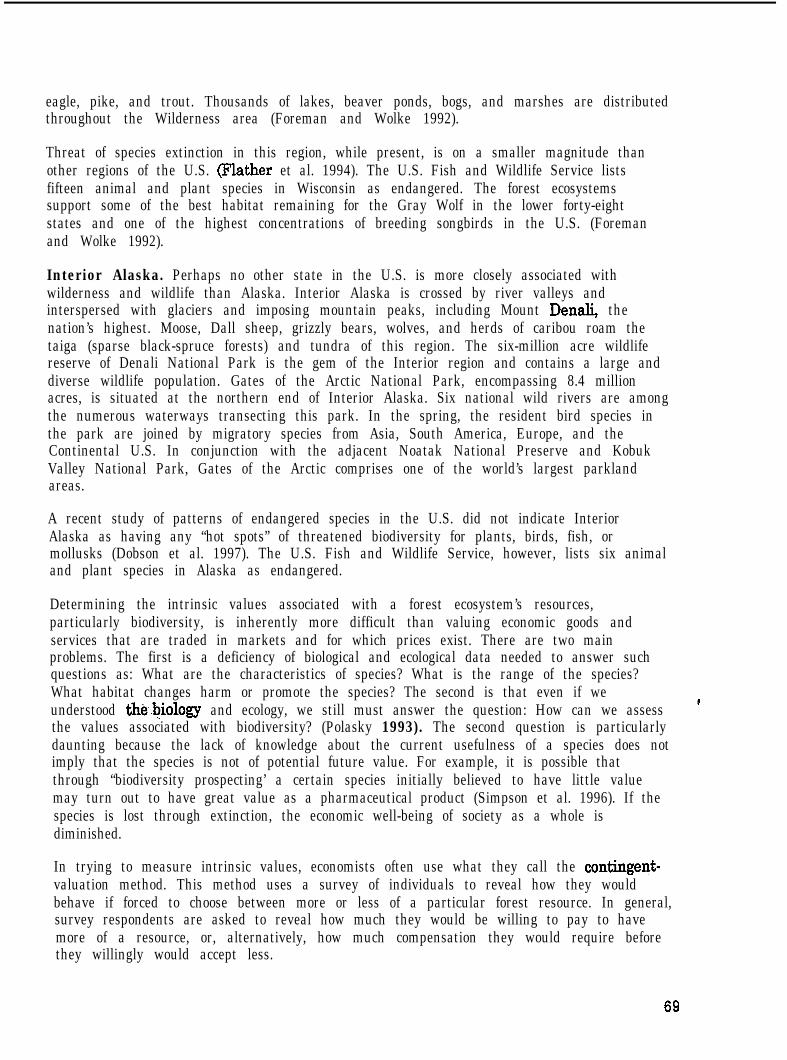
eagle, pike, and trout. Thousands of lakes, beaver ponds, bogs, and marshes are distributedthroughout the Wilderness area (Foreman and Wolke 1992).
Threat of species extinction in this region, while present, is on a smaller magnitude thanother regions of the U.S. (Flather et al. 1994). The U.S. Fish and Wildlife Service listsfifteen animal and plant species in Wisconsin as endangered. The forest ecosystemssupport some of the best habitat remaining for the Gray Wolf in the lower forty-eightstates and one of the highest concentrations of breeding songbirds in the U.S. (Foremanand Wolke 1992).
Interior Alaska. Perhaps no other state in the U.S. is more closely associated withwilderness and wildlife than Alaska. Interior Alaska is crossed by river valleys andinterspersed with glaciers and imposing mountain peaks, including Mount De&i, thenation’s highest. Moose, Dall sheep, grizzly bears, wolves, and herds of caribou roam thetaiga (sparse black-spruce forests) and tundra of this region. The six-million acre wildlifereserve of Denali National Park is the gem of the Interior region and contains a large anddiverse wildlife population. Gates of the Arctic National Park, encompassing 8.4 millionacres, is situated at the northern end of Interior Alaska. Six national wild rivers are amongthe numerous waterways transecting this park. In the spring, the resident bird species inthe park are joined by migratory species from Asia, South America, Europe, and theContinental U.S. In conjunction with the adjacent Noatak National Preserve and KobukValley National Park, Gates of the Arctic comprises one of the world’s largest parklandareas.
A recent study of patterns of endangered species in the U.S. did not indicate InteriorAlaska as having any “hot spots” of threatened biodiversity for plants, birds, fish, ormollusks (Dobson et al. 1997). The U.S. Fish and Wildlife Service, however, lists six animaland plant species in Alaska as endangered.
Determining the intrinsic values associated with a forest ecosystem’s resources,particularly biodiversity, is inherently more difficult than valuing economic goods andservices that are traded in markets and for which prices exist. There are two mainproblems. The first is a deficiency of biological and ecological data needed to answer suchquestions as: What are the characteristics of species? What is the range of the species?What habitat changes harm or promote the species? The second is that even if weunderstood thebiology and ecology, we still must answer the question: How can we assessthe values associated with biodiversity? (Polasky 1993). The second question is particularlydaunting because the lack of knowledge about the current usefulness of a species does notimply that the species is not of potential future value. For example, it is possible thatthrough “biodiversity prospecting’ a certain species initially believed to have little valuemay turn out to have great value as a pharmaceutical product (Simpson et al. 1996). If thespecies is lost through extinction, the economic well-being of society as a whole isdiminished.
In trying to measure intrinsic values, economists often use what they call the contingent-valuation method. This method uses a survey of individuals to reveal how they wouldbehave if forced to choose between more or less of a particular forest resource. In general,survey respondents are asked to reveal how much they would be willing to pay to havemore of a resource, or, alternatively, how much compensation they would require beforethey willingly would accept less.
c
69

.
cThere is considerable controversy among economists regarding the accuracy and efficacyof contingent-valuation studies. Skeptics of the method question the extent to whichrespondents’ hypothetical expressions of the amount of money they would be willing to payor accept for a resource are consistent with the amount they would pay or accept ifconfronted with an equivalent, actual situation. Advocates of contingent valuation respondthat there is no alternative to measuring intrinsic values in monetary terms and areworking to demonstrate that the techniques are both theoretically and empirically sound.
Although the economic values associated with the six regions’ forest ecosystems andbiodiversity are difficult to measure, they are, nonetheless, important and deserveconsideration in any decision involving the management of the forests. If we are to makegood decisions about how to best use our forests, we need to have an idea about how mucha forest ecosystem or preservation of species is worth. Whenever agencies, officials, or thepublic at large face decisions involving trade-offs between potentially conflicting uses ofland and forest resources, they need to acknowledge the existence of the intrinsic valuesassociated with the ecosystem and incorporate them into their decision-making process.
.

VII. CONCLUSIONS
In this chapter we summarize our findings and make recommendations for related futureresearch.
A. Findings
Prior to this study, our experience in the Pacific Northwest led us to conclude that commonapproaches for assessing the economic consequences of forest-management decisionsaimed toward accomplishing environmental objectives were seriously incomplete insofar asthey focused on the short-run economic costs to extractive and development activities andoverlooked a wide array of other, generally mitigating, consequences. A full accounting ofthe consequences must take into account the decision’s effects on: (1) other commercialactivities; (2) subsidies; (3) externalities; (4) consumption amenities that affect household-location decisions; and (5) the desire to protect the intrinsic values of the forest. Further,one must examine how the economy will adjust to the decision in the short, medium, andlong runs. To weigh the different consequences, one must look at the value of the goodsand services derived from the forest with and without the decision, the impacts on jobs,incomes, and related variables, and perceptions of the fairness, or equity.
There are any number of possible ways to organize the analysis of these concerns. Theframework we have developed is useful because it is both technically rigorous andgenerally understandable by resource managers, political leaders, news reporters, and thegeneral public.
We applied the framework to six case-study forests. It works well. This reinforces theconclusion that the ecosystem-economy relationship is complex in all these areas, i.e.,forests are important to the economy for far more reasons than just the extraction ordevelopment of resources. To understand the economic consequences of forest-management decisions in each of the six case-study forests, and especially decisionsaffecting major..extractive or development activities, one must look at all the competing cdemands. Using industrial timber production as the major indicator of extractive-development use, these findings apply where this use is declining (Pacific Northwest),growing (Southern Appalachians), or not yet existent (Interior Alaska). Our examinationof the riparian bosque forest in the southwest indicates that the framework also applies toextractive use of water for irrigated agriculture and, by extension, other extractive ordevelopment activities.
There are wide disparities in data and analytical techniques for analyzing the differentsources of demand for forest resources. Extensive data exist for some extractive-development industries, such as timber and some irrigated agriculture, but not for others,especially land development. Natural-resource economists have focused intensively for thepast two decades on developing and applying analytical techniques, such as the contingent-vaation method, for estimating the value of the demand for protecting intrinsic values,such as those associated with endangered species.
71
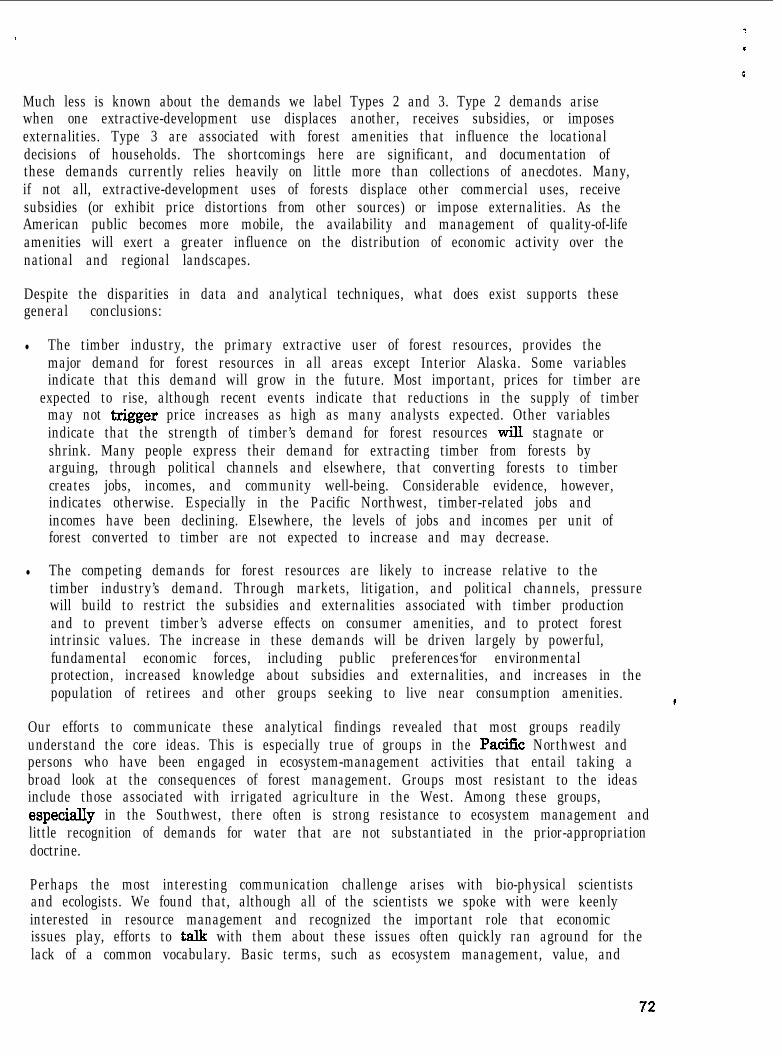
4
I
E
i
Much less is known about the demands we label Types 2 and 3. Type 2 demands arisewhen one extractive-development use displaces another, receives subsidies, or imposesexternalities. Type 3 are associated with forest amenities that influence the locationaldecisions of households. The shortcomings here are significant, and documentation ofthese demands currently relies heavily on little more than collections of anecdotes. Many,if not all, extractive-development uses of forests displace other commercial uses, receivesubsidies (or exhibit price distortions from other sources) or impose externalities. As theAmerican public becomes more mobile, the availability and management of quality-of-lifeamenities will exert a greater influence on the distribution of economic activity over thenational and regional landscapes.
Despite the disparities in data and analytical techniques, what does exist supports thesegeneral conclusions:
l The timber industry, the primary extractive user of forest resources, provides themajor demand for forest resources in all areas except Interior Alaska. Some variablesindicate that this demand will grow in the future. Most important, prices for timber are
expected to rise, although recent events indicate that reductions in the supply of timbermay not trigger price increases as high as many analysts expected. Other variablesindicate that the strength of timber’s demand for forest resources wil.l stagnate orshrink. Many people express their demand for extracting timber from forests byarguing, through political channels and elsewhere, that converting forests to timbercreates jobs, incomes, and community well-being. Considerable evidence, however,indicates otherwise. Especially in the Pacific Northwest, timber-related jobs andincomes have been declining. Elsewhere, the levels of jobs and incomes per unit offorest converted to timber are not expected to increase and may decrease.
l The competing demands for forest resources are likely to increase relative to thetimber industry’s demand. Through markets, litigation, and political channels, pressurewill build to restrict the subsidies and externalities associated with timber productionand to prevent timber’s adverse effects on consumer amenities, and to protect forestintrinsic values. The increase in these demands will be driven largely by powerful,fundamental economic forces, including public preferences‘for environmentalprotection, increased knowledge about subsidies and externalities, and increases in thepopulation of retirees and other groups seeking to live near consumption amenities.
Our efforts to communicate these analytical findings revealed that most groups readilyunderstand the core ideas. This is especially true of groups in the Pacific Northwest andpersons who have been engaged in ecosystem-management activities that entail taking abroad look at the consequences of forest management. Groups most resistant to the ideasinclude those associated with irrigated agriculture in the West. Among these groups,especially in the Southwest, there often is strong resistance to ecosystem management andlittle recognition of demands for water that are not substantiated in the prior-appropriationdoctrine.
Perhaps the most interesting communication challenge arises with bio-physical scientistsand ecologists. We found that, although all of the scientists we spoke with were keenlyinterested in resource management and recognized the important role that economicissues play, efforts to talk with them about these issues often quickly ran aground for thelack of a common vocabulary. Basic terms, such as ecosystem management, value, and
c
72

efficiency, can mean different things to economists and ecologists. With the development ofcommon understanding about these and other terms, we found that our analyticalframework, especially Figures 2.1 (lens diagram) and 2.2 (competing-detiands diagram)were useful tools for exploring opportunities for making the concepts of multidisciplinaryresearch more meaningful.
B. Recommendations
We make four general recommendations-three substantive and one communicative-forfuture research regarding the relationship between forested ecosystems and the nation’seconomic system.
_Clarify Subsidies and Externalities of Major Forest Uses
I .
As we explain above, we believe that the starting point for better understanding therelationship between forests and economies is to describe the competing demands forforest resources and to trace the effects of forest-management decisions on thesedemands. Our examination of the six case-study forests confirmed, however, that there isa wide disparity in the data and analytical techniques related to the different types ofdemand making it easier to trace a decision’s effects on some of the demands than onothers. We, and others, strongly suspect that these disparities influence the outcomes offorest-management decisions.
Some of the most important data and analytical gaps are associated with (1) the subsidiesto different major forest uses, especially extractive and development activities; and (2) theexternalities of these uses. Outside some of our own initial work in the Pacific Northwestassociated with decisions to protect at-risk species, we found no comprehensive assessmentof the subsidies and externalities associated with timber production, grazing, mining, andforest development. The absence applies both in the aggregate and to specific forest-useevents. Historically, most natural-resource economists focused on measuring the value,jobs, etc. associated with the production of timber and other forest-based commodities.Over the past two decades, there has been a greater emphasis on measuring less-tangible eattributes, such ‘as the demand for recreation and the existence value of particular speciesor habitats. In both instances, economists have largely overlooked the fact that the currentpattern of forest uses is riddled with subsidies, externalities, and other major pricedistortions. Given the failure to provide them with a better explanation of thesecomponents of the full costs of current forest uses, the public generally has no option thanto weigh forest-management alternatives in simplistic terms, such as comparing jobsversus owls.
We specifically recommend that NSF sponsor research to determine the full costs of timberproduction, irrigated agriculture, recreational development, and urban developmentassociated with one or more of the LTER sites. Why the LTER sites and not elsewhere? Tothe extent that economists have examined the full costs of extractive industries or landdeveJopment, they have focused solely on the ir&astructure costs: police, sewer, water,
73
schools, etc. They have not examined the ecosystem-related costs. The LTER sites offer thebest opportunities for looking at both.
Clarify the Demand for Quality-of-Life Amenities
Across America, people are seeking to improve their quality of life and moving to areaswith a high-quality natural environment. We identify this phenomenon as a major type ofdemand (Type 3) for forest resources. Although the fundamental theoretical conceptsunderlying this type of demand have been worked out, the actual mechanics are poorlyunderstood. It is easy to conclude that clearcutting scenic forested hillsides will diminishthe region’s attractiveness for some households, but impossible to say by how much.
Further, it is easy to conclude that, eventually, the demand for particular forest amenitieswill lead to overcongestion of those amenities, but impossible to say when or by how much.The problem is especially acute where a state or community further encourages congestionby-subsidizing the infrastructure costs of the households and firms that initially come to aplace because of its natural-resource amenities.
We speciiically recommend that NSF sponsor research to clarify (a) what forest amenitiesindividually or collectively can influence household-location decisions; (b) the strength ofthe influence; (c) the economic and ecological consequences of different levels ofcongestion; and (d) the potential effects of alternative resource-management strategies.We recommend that this research be conducted through the LTER program to takeadvantage of ecologists’ expertise regarding the nature of the amenities, the consequencesof congestion, and the consequences of management strategies.
Clarify the Competing Demands for Water from Forested Ecosystems
We describe above the limited literature on the economics of water fcom forestedecosystems. No forest-manager or member of the public can currently determine the
. economic consequences of forest-management decisions that affect the amount,> timing, orquality of water produced by forested watersheds. This is despite the fact that forests are ,the source of f;esh water in much of the country, and the demand for fresh water isgrowing.
We recommend that NSF sponsor research to clarify the water-related costs and benefitsassociated with major forest-management activities. This recommendation overlaps withthe previous two. We believe, however, that issues associated with water are sufficientlyimportant that NSF focus on them.
Facilitate Better Communication Among Forest Ecologists and Economists
By definition, gaining a better understanding of the ecosystem-economy relationshiprequires marrying the analytical insights of ecological and economic disciplines. The starkreality, though, is that it often is extremely difficult to bring about this marriage. If NSF is
74
to promote integrated, multidisciplinary research through its LTER program, it must domore than sponsor many research projects, each individually focusing on one discipline,but collectively covering many, and hope that the researchers, somehow, will connect in ameaningful way. We recommend that NSF also sponsor dialogue among ecologists andeconomists to increase the likelihood that they will identity opportunities for coordinatingtheir efforts. Such a dialogue currently is minimal, at best, at each of the LTER sites weexamined, and nonexistent across the sites.
Specifically, we recommend that NSF sponsor a program of conferences on ecological-economic issues. These conferences should especially focus on summarizing the ecologicaland economic knowledge regarding the three topics we discuss above: (1) subsidies andexternalities of major forest uses; (2) quality-of-life amenities; and (3) forest water. Incoordination with these conferences, we recommend that NSF also sponsormultidisciplinary research on these topics, so that the research proposals are informed bythe results of the first round of conferences and, in time, the research provides the gristfor future conferences.
Finally, we observe that, although our findings and recommendations stem from researchof forested ecosystems and their affiliated economies, we believe they apply equally well toother ecosystems and their relationships with local, regional, and national economies.
c
75
.
V
VIII. REFERENCES
Adams, P.W. and J.O. Ringer. 1994. The Effects of Timber Harvesting & Forest Roads onWater Quantity & Quality in the Pacific Northwest: Summary & AnnotatedBibliography. Oregon State University, Forest Engineering Dept. April 29.
Alkire, C. 1994. Financial Losses from Logging on National Forests, FY 1993. TheWilderness Society. November.
Arrow, K., R. Solow, E. Learner, P. Portney, P. Radner, and H. Schuman. 1993. “Report ofthe NOAA Panel on Contingent Valuation.” FederaE Register 58 (10): 4601-4614.
Baskin, Y. 1997. The Work of Nature: How the Diversity of Life Sustains Us. Washington,DC.: Island Press.
Baumol, W.J. and W.E. Oates. 1988. The Theory of Environmental Policy, 2nd Edition.New York: Cambridge University Press.
Beeson, P.E. 1991. “Amenities and RegionaI Differences in Returns to WorkerCharacteristics.” Journal of Urban Economics 30: 224-241.
Berger, M.C. and G.C. Blomquist. 1992. “Mobility and Destination in Migration Decisions:The Roles of Earnings, Quality of Life, and Housing Prices.” Journal of HousingEconomics 2: 37-59.
Bernton, H. 1996. “Survey Ties Some Slides to Roads, Clear-Cuts.” Portland, OR: TheOregonian, February 24. Page Al, A9.
Bernton, H. 1997. “Lumber Market Reaches New Equilibrium.” Portland: Oregonian,September 8. Page El.
Beuter, J.H. 1995. Legacy and Promise: Oregon‘s Forests and Wood Products Industry.Oregon--Business Council and Oregon Forest Resources Institute. January. c: . .
Beuter, J.H., R.N. Johnson, and H.L. Scheurman. 1976. Timber for Oregon’s Tomorrow:An Analysis of Reasonably Possible Occurrences. Oregon State University, Schoolof Forestry. Research Bulletin 19. January.
Billings, D. and A. Tickameyer. 1993. “Uneven Development in Appalachia.” In ForgottenPlaces: Uneven Development in Rural America. Edited by T.A. Lyson and W.W.Falk. Lawrence, Kansas: University Press of Kansas. Pgs. 7-29.
Black, A. and J. Smillie. 1988. A Comparison of Non-Renewable Natural Resource Taxationin Colorado, Montana, North Dakota and Wyoming. Western Organization ofResource Councils. December.
Blomquist, G.C., M.C. Berger, and J.P. Hoehn. 1988. “New Estimates of Quality of Life inUrban Areas.” American Economic Review 78 (1): 89-107.
7 6

Bound, J. and G. Johnson. 1992. “Changes in the Structure of Wages in the 1980’s: AnEvaluation of Alternative Explanations.” The American Economic Review 82 (3):371-392.
Bound, J. and G. Johnson. 1995. “What Are the Causes of Rising Wage Inequality in theUnited States.” Economic Policy Review, Federal Reserve Bank of New York 1 (1): 9-17.
Brady, P. 1995. Interregional Compensating DifleGentials and Incentives to Migrate: AStudy of Locational Decisions by Young Adults. University of Wisconsin-Madison,Department of Economics. November 8.
Brauer, DA. and S. Hickok. 1995. “Explaining the Growing Inequality in Wages AcrossSkill Levels.” Federal Reserve Bank of New York Economic Policy Review 1 (1): 61-75.
Brooks, R.T., T.S. Frieswyk, D.M. Griffith, E. Cooter, and L. Smith. 1992. !Z’he NewEngland Forest: Baseline for New England Forest Health Monitoring. U.S.Department of Agriculture, Forest Service, Northeastern Forest ExperimentStation. Resource Bulletin. NE-124.
Brown, R.J. 1994. “Do Locational Amenities Equalize Utility Across States?” The Journal ofEconomics XX (1): 25-30.
Brown, T.C. and D. BinkIey. 1994. Effect of Management on Water Quality in NorthAmerican Forests. U.S. Department of Agriculture, Forest Service, Rocky MountainForest and Range Experiment Station. General Technical Report. RM-248. June.
Browne, L.E. 1984. “How Different Are Regional Wages? A Second Look.” New EnglandEconomic Review (March/April): 40-47.
Cicchetti, C.J. and L.L. Wilde. 1992. “Uniqueness, Irreversibility, and the Theory of NonuseValues.” American Journal of Agricultural Economics December: 1121-1125.
Clark, D.E. and J.C. Cosgrove. 1991. “Amenities Versus Labor Market Opportunities:Choosing the Optimal Distance to Move.” Journal of Regional Science 31(3): 311-328. .-.
Clark, D.E. and T.A. Knapp. 1994. The Hedonic Price Structure of Faculty Compensation atU.S. Colleges and Universities. June.
Cook, AK. 1995. “Increasing Poverty in Timber-Dependent Areas in Western Washington.”Society and Natural Resources 8: 97-109.
Council of Economic Advisers. 1994. Chapter 6: Economic Report of the President 1997.Washington, DC: U.S. Government Printing Office.
Courant, P.N., E. Niemi, and E.W. WhiteIaw. 1997a. “An Analytic Qpology for Examiningthe Economic Effects of Ecosystem Management.” June 1997 Submission to
- - Natural Resources Journal .
7 7

Courant, P-N., E. Niemi, and W.E Whitelaw. 199713. An Analytic Tjpology for Examiningthe Economic Effects of Ecosystem Management. University of Michigan, School ofPublic Policy. Working Paper #407.http://WWW.spp.umich.edu/spp/papers/courant/index.html.
Courant, P.N., E. Niemi, and W.E. Whitelaw. 1997c. “The Economic Consequences ofIntegrating Conservation and Economic Development.” T/Vorlz In Progress .
Courant, P.N., E. Niemi, and W.E. Whitelaw. 1997d. “New Economic Perspectives ofEcosystem Management: A Critique of Recent Efforts.” May 1997 Submission toEnvironmental Management .
Coursey, D.L., J.L. Hovis, and W.D. Schulze. 1987. ??he Disparity Between WiRingness toAccept and Wilhngness to Pay Measures of Value.” Quarterly Journal of Economics: 679-678.
Crawford, C.S., L.M. EIIis, and M.C. Jr MoIIes. 1996. ‘The Middle Rio Grande Bosque: AnI. Endangered Ecosystem.” New Mexico Journal of Science 36: 276-299.
Cronon. 1991. Nature’s Metropolis: Chicago and the Great West. New York: Norton &Company.
Cushing, B. J. 1987. “Location-Specific Amenities, Topography, and Population Migration.”Annals of Regional Science 21(2): 74-86.
Daily, G.C. 1997. Nature’s Services: Societal Dependence on Natural Ecosystem.Washington, DC.: Island Press.
DeBano, L.F. and M.B. Baker. 1992. “Land and Riparian Area Interactions with Sedimentin the Southwest.” Presented at Technical Workshop on Sediments in CorvaRis,Oregon. Terrene Institute.
Dobson, A.P., J.P. Rodriguez, W.M. Roberts, and D.S. WiIcove. ,1997. “GeographicDistribution of Endangered Species in the United States.” Science 276 (January):660-663. : >
cDrabenstott, M; .and T.R. Smith. 1996. The Changing Econorky of the Rural Heartland.
Federal Reserve Bank of Kansas City. April 1996.
Eberle, W.D. and F.G. Hayden. 1991. “Critique of Contingent Valuation and Travel CostMethods for Valuing Natural Resources and Ecosystems.” Journal of EconomicIssues XXV (Septembers): 649-683.
Eck, A. 1993. “Job-Related Education and Training: Their Impact on Earnings.” USDepartment of Labor Monthly Labor Review October: 21-38.
ECONorthwest. 1996a. The Potential Economic Consequences of Designating CriticalHabitat for the Marbled Murrelet: Final Report. US Fish and Wildlife Service,Portland Field Office. May.A-
7 8
ECONorthwest. 1996b. The Potential Economic Consequences of Designating CriticalHabitat for the Rio Grande Silvery Minnow: Draft Report. U.S. Fish and WildhfeService, New Mexico Ecological Services Field Office. February.
ECONorthwest. 1997. Water Management Study: Upper Rio Grande River Basin, FinalReport. prepared for Western Water Policy Review Advisory Commission. June.
Edwards, C.J. 1992. “A Review of Aquatic Impact Associated with Turbidity.” Presented atTechnical Workshop on Sediments in CorvaRis, Oregon. Terrene Institute.
Ehrenberg, R.G. and R.S. Smith. 1994. Modern Labor Economics: Theory and PublicPolicy, Fifth Edition. HarperCollins.
English, D.B.K. and J.C. Bergstrom. 1994. “The Conceptual Links between Recreation SiteDevelopment and Regional Economic Impacts.” Journal of Regional Science 34 (4):599-611.
English, D.B.K., C.J. Betz, J.M. Young, J.C. Bergstrom, and H.K. Cordell. 1993. RegionalDemand and Supply Projections for Outdoor Recreation. U.S. Forest Service,Rocky Mountain Forest and Range Experiment Station. General Technical ReportRM-230. August.
Environmental Working Group. 1995. Faking Takings: Farm Subsidies and PrivateProperty in Perspective. Environmental Working Group. EWG PolicyMemorandum. February.
Farber, H.S. 1996. The Changing Face of Job Loss in the United States, 1981-1993.National Bureau of Economic Research. Working Paper 6596. May.
Farnham, T.J. 1995. “Forest Service Budget Requests and Appropriations: What doAnalyses of Trends Reveal?” Policy Studies, Journal 23 (2): 263-267.
Field, B.C. 1997. Environmental Economics, Second Edition. San Francisco: McGraw-HillCompany, Inc.
Figho, D.N. 1996. A Suggestion for an Amenity-Constant Inter-City Cost of LivingAdjustment. Department of Economics, University of Oregon. February.
Finch, D.M. and J.A. Tainter. 1996. “Introduction: Ecosystem Research in a HumanContext.” In Ecology, Diversity, and Sustainability of the Middle Rio GrandeBasin. Edited by D.M. Finch and J.A. Tainter. Fort Collins: U.S. Department ofAgriculture, Forest Service, Rocky Mountain Forest and Range Experiment Station.Pgs. l-11.
Flather, C.H., LA. Joyce, and CA. Bloomgarden. 1994. Species Endangerment Patterns inthe United States. U.S. Department of Agriculture, Forest Service. RM-241.January.
Foreman, D. and H. WoIke. 1992. The Big Outside: A Descriptive Inventory of the Big- - Wilderness Areas of the United States. New York: Harmony Books.
79

Forest Ecosystem Management Assessment Team. 1993. Forest Ecosystem Management:An Ecological, Economic, and Social Assessment. Forest Service, Fish and WildlifeService, National Marine Fisheries Service, National Park Service, Bureau of LandManagement, and Environmental Protection Agency. 794-478. July.
Franklin, J.C. 1993. “Industry Output and Employment, the American work force: 1992-2005.” Monthly Labor Review : 41-57.
Freeman, A.M., III. 1993. The Measurement of Environmental and Resource Values:Theory and Methods. Washington, D.C.: Resources for the Future.
Fretwell, J.D., J.S. Williams, and P.J. Redman, eds. 1996. National Water Summary onWetland Resources. Vol. Water- Supply Paper 2425. National Water SummarySeries. U.S. Geological Survey.
Gabriel, S.A., J.P. Mattey, and W.L. Wascher. 1996. Compensating Differentials andEvolution of the Quality-of-Life Among the U.S. States. Federal Reserve Bank of.*San Francisco. June.
Ganser, D.A., T.W. Birch, S.L. Arner, and S.J. Zarnoch. 1990. “Cutting Disturbance on NewEngland Timberlands.” Northern Journal of Applied Forestry 7 (3): 118-120.
Garman, G.C. and J.R. Moring. 1991. “Initial Effects of Deforestation on PhysicalCharacteristics of a Boreal River.” Hydrobiologia 209: 29-37.
Giber& A., R. Glass, and T. More. 1991. “Valuation of Eastern Wilderness: ExtramarketMeasures of Support.” Presented at The Economic Value of Wilderness in Jackson,WY. U.S. Department of Agriculture, Forest Service, Southeastern ForestExperiment Station.
, Goodstein, E.S. 1995. Economics and the Environment. Englewood Cliffs, NJ: Prentice
Gorte, R.W. 1992. Economic Impacts of Protecting Spotted Owls: A Compariso? andAnalysis of Existing Studies. Congressional Research Service. 92-922 ENR.December.. .
Gorte, R.W. 1994. Below-Cost Timber Sales: Overview. Congressional Research Service,Library of Congress. CRS Report for Congress. 96-15 ENR. December 20.
Gottheb, P.D. 1994. “Amenity-Oriented Firm Location.” Dissertation.
GottIieb, P.D. 1995. “Residential Amenities, Firm Location and Economic Development.”UrbanStudies 32(g): 1413-1436.
Gowdy, J.M. 1997. “rhe Value of Biodiversity: Markets, Society, and Ecosystems.” LandEconomics 73: 25-41.
8 0
Grant, G.E. and A.L. Wolff. 1991. “Long-Term Patterns of Sediment Transport AfterTimber Harvest, Western Cascade Mountains, Oregon, USA.” Presented atSediment and Stream Water Quality in a Changing Environment: Trends andExplanation in Vienna. IAHS. 203.
Greber, B.J. 1993. “Impacts of Technological Change on Employment in the TimberIndustries of the Pacific Northwest.” Western Journal of Applied Forestry 8 (1): 34-37.
Greenberg, J. 1997. Forests Service Contributing Heavily to Corporate Welfare Problem.The Wilderness Society. February 11.
Gregory, R., S. Lichtenstein, T.C. Brown, G.L. Peterson, and P. Slavic. 1995. “How PreciseAre Monetary Representations of Environmental Improvements?” Land Economics71(4): 46273.
Hansen, A.J., S.L. Garman, J.F. Weigand, D.L. Urban, W.C. McComb, and M.G. Raphael..w 1995. “Alternative Silvicultural Regimes in the Pa&c Northwest: Simulations of
Ecological and Economic Effects.” Ecological Applications 5 (3): 635-664.
Harper, S.C., L.L. Falk, and E.W. Rankin. 1990. The Northern Forest Lands Study of NewEngland and New York: A Report to Congress of the United States on the RecentChanges in Landownership and Land Use in the Northern Forest of Maine, NewHampshire, New York, and Vermont. U.S. Department of Agriculture, ForestService. April.
Harr, R.D. 1992. “Overview of Sediment Research on Forestland in the Pacific Northwest.”Presented at Technical Workshop on Sediments in Corvallis, Oregon. TerreneInstitute. *I
Haynes, R.W., D.M. Adams, and J.R. Mills. 1996. The 1993 RPA Timber Assessment Update,USDA Forest Service. General Technical Report RM-269. March.
Haynes, R.W. and A.L. Horne. 1997. “Chapter 6: Economic Assessment of the Basin.” In AnAssessment of Ecosystem Components in the Interior Columbia Basin and Portionsof the K&math and Great Basins, Volume IV. Edited by T.M. Quigley and S.J. CArbelbide. General Technical Report PNW-GTR-405. Portland, OR: U.S.Department of Agriculture, Forest Service, Pa&c Northwest Research Station.June. Pgs. 1715-1869.
Heberlein, T.A. 1994. “Social Trends and Forest Dependent Communities: SomeReflections on the Pacific Northwest.” Presented at Annual Meeting of the RuralSociological Society in Portland, Oregon. Department of Rural Sociology, Universityof Wisconsin-Madison.
Herzog, H.W. and AM. Schlottmann. 1995. “Worker Displacement and Job-Search: ARegional Analysis of StructuralImpediments to Reemployment.” Journal ofRegional Science Vol. 35 (NO.‘4): pp. 553-577.
- -
81

Hornbeck, J.W and W.B. Leak. 1992. Ecology and Management of Northern HardwoodForests in New England. Northeastern Forest Experiment Station, Forest Service,U.S. Department of Agriculture. General Technical Report. NE-159. July.
Hornbeck, J.W., C.W. Martin, R.S. Pierce, F.H. Bormann, G.E. Likens, and J.S. Eaton.1987. The Northern Hardwood Forest Ecosystem: Ten Years of Recovery FromClearcutting. Northeastern Forest Experiment Station/Forest Service. NE-RP-596.February.
Humphrey, C.R. 1994. “Introduction: Natural Resource-Dependent Communities andPersistent Rural Poverty in the U.S.-Part II.” Society and Natural Resources 7: 2Ol-203.
Humphrey., C.R. 1994. “Introduction: Natural Resource-Dependent Communities andPersistent Rural Poverty in the U.S.-Part III.” Society and Natural Resources 7: 411-413.
&, R.E. 1996. ‘The Nature of Employment Growth, 1989-95.” U.S. Department of LaborMonthly Labor Review June: 29-36.
Iverson, D.C. and R.M. AI&on. 1993. “Ecosystem-Based Forestry Requires A BroaderEconomic Focus.” Journal of Sustainable Forestry l(2).
Jacobson, L.S., R.J. LaLonde, and D.G. Sullivan. 1993. “Earnings Losses of DisplacedWorkers.” The American Economic Review 83 (4): 685-709.
Johnson, K.P. 1995. “Redefinition of the BEA Economic Areas.” Survey of CurrentBusiness 75 (2): 75-81.
1Jones, J.A. and G.E. Grant. 1996. “Peak Flow Responses to Clearcutting and Roads in
SmaIl and Large Basins, Western Cascades, Oregon.” Water Resources Research 32(4): 959-974.
Juhn, C. and K.M. Murphy. 1995. “Inequality in Labor Market Outcomes: Contrasting the1980s and Earlier Decades.” Economic Policy Review, Federal Reserve Bank of NewYork 1 c.1): 26-32.
Raiser, H.F. 1993. Forests and Timber Supplies in the 21st Century: Outlook ‘94. U.S.Department of Agriculture, Forest Service. December 1.
Kasa, K. 1994. “International Trade and U.S. Labor Market Trends.” Federal Reserve Bankof San Francisco Weekly Letter 94-40.
Ring, D.M. and C.C. BohIen. 1994. Making Sense of Wetland Restoration Costs. Office ofPolicy Analysis, U.S. Environmental Protection Agency, and the U.S. Department ofEnergy. January.
.
c
Knapp, T.A. and P.E. Graves. 1989. “On the Role of Amenities in Models of Migration andRegional Development.” Journal of Regional Science 29 (1): 71-87.A-
82 .

Knight, R.L. and S.F. Bates. 1995. A New Century for Natural Resources Management.Washington, D.C.: Island Press.
Kusel, J and L. Fortmann. 1991. Well-Being in Forest-Dependent Communities: Volume 1.California Department of Forestry and Fire Protection. September.
Kutscher, R.E. 1993. “Historical Trends, 1950-92, and Current Uncertainties.” U.S.Department of Labor Monthly Labor Review 116 (November): 3-10.
Lawrence, R.Z. and M. Slaughter. 1993. “International Trade and American Wages in the1980s: Giant Sucking Sound or Small Hiccup?” Brookings Papers on EconomicActivity .
tippke, B. and R.S. Conway. 1994. Economic Impact of Alternative Forest Practice Rules toProtect Northern Spotted Owl Sites. Wildlife Committee of the Washington ForestPractices Board. August.
Lutz, J., T.E. Howard, and P.E. Sendak. 1992. “Stumpage Price Reporting in the NorthernUnited States.” Northern Journal of Applied Forestry 9 (2): 69-73.
Marion, D.A. and S.J. Ursic. 1992. “Sediment Production in Forests of the Coastal Plain,Piedmont, and Interior Highlands.” Presented at Technical Workshop on Sedimentsin Corval.l.is, Oregon. Terrene Institute.
Martin, C.W. and J.W. Hornbeck. 1992. “Erosion, Sediment, and Turbidity in New EnglandForests.” Presented at Technical Workshop on Sediments in Corvalhs, Oregon.Terrene Institute.
Mathur, V.K. 1993. “The Role of Amenities in a General Equilibrium Model of RegionalMigration and Growth.” Southern Economic Journal S9 (3 January): 394409.
Meehan, W.R., ed. 1991. Influences of Forest and Rangeland Management on SalmonidFishes and !l’heir Habitats. American Fisheries Society Special Publication 19.
Megahan, W.F. and W.J. Kidd. 1972. “Effects of Logging and Logging Roads on Erosion andSediment Deposition from Steep Terrain.” Journal of Forestry 70 (3): 136-141. c
Mendelsohn, R., W.D. Nordhaus, and D. Shaw. 1994. ‘The Impact of Global Warming onAgriculture: A Ricardian Analysis.” !l’he American Economic Review 84 (4): 753-771.
Meyer, B.D. and D.T. Rosenbaum. 1996. Repeat Use of Unemployment Insurance. NationalBureau of Economic Research, Inc. NBER Working Paper Series. Working Paper6423. January.
Mishel, L. and P.B. Voos, eds. 1992. Unions and Economic Competitiveness. Armonk, NYand London: Sharpe.
0
Mooney, HA. and P.R. Ehrlich. 1997. “Ecosystem Services: A Fragmentary History.” InNature’s Services: Societal Dependence on Natural Ecosystems. Edited by G.C.
- Daily. Washington, D.C.: Island Press. Pgs. 11-19.
8 3
Mueser, P.R. and P.E. Graves. 1995. “Examining the Role of Economic Opportunity andAmenities in Explaining Population Redistribution.” Journal of Urban Economics 3’7(2): 176-200.
Myers, D. 1987. “Internal Monitoring of Quality of Life for Economic Development.”Economic Development Quarterly 1 (3): 268-278.
National Research Council, Committee on Restoration of Aquatic Systems. 1992.Restoration of Aquatic Ecosystems: Science, Technology, and Public Policy.Washington, D.C.: National Academy Press.
Nauth, 2. 1992. Z?he Great Louisiana Tax Giveaway. Louisiana Coalition for Tax Justice,Louisiana Coalition, Inc.
Neary, D.G., N.B. Comerford, and L.W. Swift. 1992. “Land and Riparian Interactions withSediment in the Southern United States.” Presented at Technical Workshop on
. . Sediments in CorvaIIis, Oregon. Terrene Institute.
Niemi, E. and E. Whitelaw. 1994. ‘The Potential Social and Economic Impacts of Long-Rotation Timber Management.” Presented at High Quality Forestry Workshop: TheIdea of Long Rotations in Silver Fails State Park, Oregon. College of ForestResources AR-lo, University of Washington.
Niemi, E. and E. Whitelaw. 1997. Assessing Economic !&ao!eoffs in Forest Management.U.S. Department of Agriculture, Forest Service, Pa&c Northwest ResearchStation. General Technical Report. PNW-GTR-403. August.
O’Toole, R. 1988. Reforming the Forest Service. Washington, D.C.: Island Press.
Offutt, S. and R. Shoemaker. 1990. “Agricultural Land, Technology, and Farm Policy.”Journal of Agricultural Economics 41(l).
Oliver, C., D. Adams, T. Bonnicksen, J. Bowyer, F. Cubbage, N. Sampson, S. SchIarbaum,R. Whaley, and H. Wiant. 1997. Summary= Report on Forest Health of the UnitedStates. U.S. House of Representatives, Committee on Resources, Forest HealthScience’Panel. c
Oregon Business Council. 1993. Oregon Vulues and Beliefs: Summary. May.
Oregon Department of Fish and WiIdIife and Washington Department of Fish and Wildlife. G’1995. Status Report: Columbia River Fish Runs and Fisheries, 1938-94. August.
Oregon Employment Department. Various Years. Oregon Covered Employment &Payrolls.
Oregon Employment Division. 1993. Oregon In-Migration Survey.
84

Oregon Employment Division: Research, Tax and Analysis Sections, Oregon State Board ofEducation: Office of Community College Services, and Oregon EconomicDevelopment Department: Job Training Partnership Administration. 1993. OregonDislocated Worker Program: Report to the Workforce Quality Council and the 67th
. Legislative Assembly. Oregon Department of Human Resources. January.
Overdevest, C. and G.P. Green. 1995. “Forest Dependence and Community Well-Being: ASegmented Market Approach.” Society and Natural Resources 8: 111-131.
Pearson, T.A. 1997. U.S. Territory 1997. U.S. Bancorp.
Perry, DA. and M.P. Amaranthus. 1997. “Disturbance, Recovery, and Stability.” In Creatinga Forestry for the Zlst Century: The Science of Ecosystem Management. Edited byK.A. Kohm and J.F. Franklin. Washington, D.C.: Island Press. Pgs. 31-66.
Pierce, R-S., J.W. Hornbeck, C.W. Martin, L.M. Tritton, C.T. Smith, C.A. Federer, and H.W.Yawney. 1993. Whole-tree Clearcutting in New England: Manager’s Guide to
,... Impacts on Soils, Streams, and Regeneration. U.S. Department of Agriculture,Forest Service. NE-172 January, 1993.
Pimentel, D., C. Harvey, P. Resosudarmo, K. Sinclair, D. Kurz, M. McNair, S. Crist, L.Shpritz, L. Fitton, R. Saffouri, and R. Blair. 1995. “Environmental and EconomicCosts of Soil Erosion and Conservation Benefits.” Science 267 (February 24): 1117-1122.
Polasky, S. 1993. Valuing Biodiuersity and Ecosystems. Presented to the Forest ProductsResearch Conference, Madison, WI. September 27-29.
Polasky, S. and AR. Solow. 1995. “On the Value of a Collection of Species.” Journal ofEnvironmental Economics and Management 29: 298-303.
Postel, S. and S. Carpenter. 1997. “Freshwater Ecosystem Services.” In Nature’s Services:Societal Dependence on Natural Ecosystems. Edited by G.C. Daily. Washington,D.C.: Island Press. Pgs. 195-214.
Powell, D.S., J.L. Faulkner, D.R. Darr, 2. Zhu, and D.W. ,MacCleery. 1993. Forest Resources cof the &ited States, 1992. U.S. Department of Agriculture, Forest Service. GeneralTechnical Report. RM-234. September.
Power, T.M. 1996a. Lost Landscapes and Failed Economies: The Search for a Value ofPlace. Washington, DC: Island Press.
Power, T.M. et al. 199613. Economic Well-Being and Environmental Protection in thePacific Northwest. 2
Quigley, T-M., R.W. Haynes, and R.T. Graham. 1996. Integrated Scientific Assessment forEcosystem Management in the Interior Columbia Basin and Portions of the Klamathand Great Basins. U.S. Department of Agriculture, Forest Service, PacificNorthwest Research Station. PNW-GTR-382. September. \
-
85

..
5
Reeves. 1992. “Sediment and Aquatic Organisms in the Pacific Northwest: the Need forNew Perspectives.” Presented at Technical Workshop on Sediments in CorvaIIis,Oregon. Terrene Institute.
Reid, L.M. 1993. Research and Cumulative Watershed Effects. U.S. Department ofAgriculture, Forest Service, Pacific Southwest Research Station. General TechnicalReport. PSW-GTR-141.
Ribaudo, M.C. 1989. Water Quality Benefits from the Conservation Reserve Program. U.S.Department of Agriculture, Economic Research Service. Agricultural EconomicReport. 606. February. ;
Richardson, H.W. 1985. “Input-Output and Economic Base Multipliers: Looking Backwardand Forward.” Journal of Regional Science 25 (4): 607-661.
Roback, J. 1982. “Wages, Rents, and Quality of Life.” Journal of Political Economy 90 (6):1257-1278..k I ’
Roback, J. 1988. “Wages, Rents, and Amenities: Differences Among Workers and Regions.”Economic Inquiry 26: 23-41.
Robbins, W.G. 1989. “Lumber Production and Community Stability: A View from the PacificNorthwest.” In Community Stability in Forest-Based Economies. Edited by D.C. LeMaster and J.H. Beuter. Portland, Oregon: Timber Press. Pgs. 12-22.
Rosen, S. 1979. “Wage-Based Indexes of Urban Quality of Life.” In Current Issues in UrbanEconomics. Edited by-Peter Mieszkowski and MahIon Straszheim. BaItimore andLondon: John Hopkins Press. Pgs. 74-103.
Rudzitis, G. and H. Johansen. 1991. “How Important is Wilderness? Results from a UnitedStates Survey.” Environmental Management 15 (2): 227-233.
Ruhm, C.J. 1991. “Are Workers Permanently Scarred by Job Displacements?” AmericanEconomic Review March: 319-324.
Salant, P., L.RE.Carley, and D.A. DiIhnan. 1996. Estimating the Contribution of Lone Eagles +to Metro and Nonmetro In-Migration. Social 8z Economic Sciences Research Center,Washington State University. Technical report. #96-19. June.
Scannell; P.W. 1992. “Effects of Increased Sedimentation on Fresh Waters of Interior. Alaska.” Presented at Technical Workshop on Sediments in CorvaIIis, Oregon.
Terrene Institute.
SchaIIau, C. 1994. The Contribution of the Forest Products Industry to Rural Economies ofthe Southern Appalachian Region. Forest Resources Group, American Forest &Paper Association. Technical Bulletin No. 94-4. June 22.
Schamberger, M.L., J.J. Charbonneau, M.J. Hay, and R.L. Johnson. 1992. EconomicAnalysis of Critical Habitat Designation Effects for the Northern Spotted Owl. U.S.
- - Fish and WiIdIife Service. 619~548/41381. January.
8 6
Sears, D.W., J.M. Redman, L.D. Kusmin, and M.S. Killian. 1992. Growth and Stability ofRural Economies in the 1980s: Differences Among Counties. U.S. Department ofAgricuIture, Economic Research Service, Agriculture and Rural Economy Division.December.
Shabman, L. and K. Stephenson. 1996. “Searching for the Correct Benefit Estimate:Empirical Evidence for an Alternative Perspective.” Land Economics 72 (4): 433-449,
Sherwood-Call, C. 1994. The 1980s Divergence in Per Capita Personal Incomes: What DoesIt Tell Us? Federal Reserve Bank of San Francisco. August 15.
Simpson, R.D., R.A. Sedjo, and J.W. Reid 1996. “valuing Biodiversity for Use inPharmaceutical Research.” Journul of Political Economy 104 (1): 163-183.
Smith, P.M. and C.D. West. 1994. “The Globalization Of Furniture Industries/Markets.”Journal Of Global Marketing 7 (3): 103-131.
..-Smoky Mountain Host of North Carolina. 1996. Smoky Mountain visitor center survey,
1991-1993 [Brochure]. Smoky Mountain Host of North Carolina.
Southern Appalachian Man and the Biosphere. 1996. The Southern AppalachianAssessment: Social/ Cultural/Economic Technical Report. Southern AppalachianMan and the Biosphere Cooperative. July.
Stevens, T.H., J. Echeverria, R.J. Glass, T. Hager, and TA More. 1991. “Measuring theExistence Value of WiIdIife: What do CVM Estimates Really Show?” LandEconomics 67 (4): 390-400. .
Stevens, T.H., T.A. More, and R.J. Glass. 1994. “Public Attitudes About Coyotes in NewEngland.” Society and Natural Resources 7: 67-66.
.
Stewart, S.I. and D.J. Stynes. 1994. “Toward a Dynamic Model of Complex TourismChoices: The Seasonal Home Location Decision.” In Economic Psychology of Traveland Tourism. Edited by J.C. Crotts and W.F. van Raaij. Binghamton, New York.Haworth Press, Inc. Pgs. pp. 69-88.
Swanson, F. 1997. Personal communication. Ecosystem Team Leader, Pacific Northweste
Research Station, U.S. Forest Service. 17 June 1997.
Tietenberg, T. 1996. Environmental and Natural Resource Economics, Third Edition. NewYork: HarperCoIIins.
Tuchman, E.T., K.P. Connaughton, L.E. Freedman, and C.B. Moriwaki. 1996. me .Northwest Forest Plan: A Report to the President and Congress. U.S. Department ofAgriculture, Forest Service, Pacific Northwest Research Station. December.
U.S. Department of Agriculture. 1988. The South’s Fourth Forest: Alternatives for theFuture. U.S. Department of AgricuIture, Forest Service. Forest Resource Report. 24.June.A-
a7
i
U.S. Department of Agriculture. 1996. Status of the Interior Columbia Basin: Summary ofScientific Findings. U.S. Department of Agriculture, Forest Service, PacificNorthwest Research Station. General Technical Report. PNW-GTR-385.November.
U.S. Department of Agriculture, Economic Research Service. 1995. Understanding RuralAmerica. Agricuhure Information Bulletin No. 710. February.
U.S. Department of Agriculture, Forest Service. 1994. Record of Decision for Amendmentsto Forest Service and Bureau of Land Management Planning Documents Within theRange of the Northern Spotted Owl: Standards and Guidelines for Management ofHabitat for Late-Successional and Old-Growth Forest Related Species Within theRange of the Northern Spotted Owl. April.
U.S. Department of Agriculture, Forest Service and Bureau of Land Management U.S.Department of the Interior. 1994. Final Supplemental Environmental Impact
.- Statement on Management of Habitat for Late-Successional and Old-Growth ForestRelated Species Within the Range of the Northern Spotted Owl. Volume 1.February.
U.S. Department of Commerce and Bureau of the Census. 1995. Statistical Abstract of theUnited States: 1995, 116th Edition. Washington, DC: U.S. Government PrintingOffice.
U.S. Department of Commerce, Bureau of Economic AnaIysis. 1996. SPI State PersonalIncome 1969-95 (on CD-ROM). U.S. Department of Commerce, Economics andStatistics Administration, Bureau of Economic Analysis, Regional EconomicMeasurement Division. October. .
U.S. House of Representatives. 1994. Taking from the Taxpayer: Public Subsidies forNatural Resource Development. Subcommittee on Oversight and Investigations ofthe Committee on Natural Resources. Majority Staff Report. August.
von Reichert, C. and G. Rudzitis. 1992. “MuItinomiaI Logistical Models Explaining IncomeChanges of Migrants to High-Amenity Counties.” The Review of Regional Studies22 (1): 26.42. c
Walsh, R.G., LB. Loomis, and R.A. GiRman. 1964. “Valuing Option, Existence, and BequestDemands for WiIderness.“‘Lund Economics 60 (1): 14-29.
Weaver, W. and D.K. Hagans. 1996. Aerial Reconnaissance Evaluation of 1996 StormEffects on Upland Mountainous Watersheds of Oregon and Southern Washington:Witdland response to the February 1996 storm and flood in the Oregon andWizshington Cascades and Oregon Coast Range Mountains. prepared for The PacificRivers Council by Paciiic Watershed Associates. May.
West, C.D. and S.A. Sinclair. 1991. “technological Assessment Of the Wood HouseholdFurniture Industry.” Forest Products Journal 41(4): 11-18.
WI%elaw, E. 1992. “Oregon’s Real Economy.” Old Oregon 72 (2): 30-33.
88
Whitelaw, W.E. and E.G. Niemi. 1989. ‘The Greening of the Economy.” Old Oregon 68 (3):26-27.
Wiedenbeck, J.K. and P.A. Araman. 1993. “Possible Demands for Eastern HardwoodsResulting from Harvest Restrictions in the Pacific Northwest.” Forest ProductsJOUF7ld 43 (lo): 51-57.
Wilderness Society. 1994. Financial Losses from Logging on National Forests: FY 1993.November.
Wilderness Society. 1997. Financial Losses from Logging on National Forests, FY 1995:Preliminary Summary. The Wilderness Society. January.
89