The Economy Report. - Sveriges Kommuner och...
20
The Economy Report. ON SWEDISH MUNICIPAL AND COUNTY COUNCIL FINANCES – MAY 2010
Transcript of The Economy Report. - Sveriges Kommuner och...
The Economy Report.ON SWEDISH MUNICIPAL AND COUNTY COUNCIL FINANCES – MAY 2010

Information concerning the content of the report:Annika Wallenskog tel +46 8 452 7746Bo Legerius tel +46 8 452 77 34
Swedish Association of Local Authorities and RegionsDepartment of Economy and Governance, Section for Economic AnalysisSE-118 82 Stockholm | Visitors Hornsgatan 20
Phone +46 8 452 70 00 | Fax +46 8 452 70 50
www.skl.se
© Sveriges Kommuner och Landsting1st edition, July 2010
Graphic form & production Elisabet JonssonTranslation Ian MacArthur, Elisabet JonssonCover illustration Jan Olsson Form & Illustration ABPrinters KLF Digitalttryck, StockholmFonts Chronicle and WhitneyPaper Xerox Colotech 120 gr
ISBN 978-91-7164-564-7
(Swedish edition: 978-91-7164-545-6, ISSN: 1653-0853)

The Economy Report. May 2010 On Swedish Municipal and County Council Finances 1
Foreword
The Economy Report illustrates the financial situation and conditions ofcounty councils and municipalities and the development of the Swedish eco-nomy over the next few years. It is published twice yearly by the Swedish As-sociation of Local Authorities and Regions (salar).
The calculations in this issue look forward to 2015. The temporary cyclicalsupport from central government provides a breathing space for municipali-ties and county councils in 2010, but from 2011 the situation is troubling. Thepositive net income of sek 3.5 billion that we forecast for 2011 means thatservices cannot develop in pace with demography. For the years after 2011 wepresent a calculation of how net income will develop if services increase inline with the historical trend. The report also presents an alternative calcula-tion of how much government grant central government can afford to givemunicipalities and county councils.
This abridged version of the report has been written by staff at the salarSection for Economic Analysis. The people who have participated in the workand can reply to questions are given on the inside cover page. Other salarstaff have also contributed facts and valuable comments. The Summary (sup-plemented with some tables and diagrams from the main report) and the An-nex are published here as a separate English document. The translation is byIan MacArthur, following slight revisions by Elisabet Jonsson. We are verygrateful to the municipalities and county councils that have contributed ba-sic data to our report!
Stockholm, May 2010
Annika WallenskogSection for Economic Analysis

Contents
3 The Chief Economist’s Conclusions3 Continued recovery but a long way to normal conditions6 Positive surprise on the labour market6 Weak growth of the tax base7 How much grant can central government afford to give the sector?8 Net income good in 2010, poorer in 2011
9 Lessons for the future
11 Annex
2 The Economy Report. May 2010 On Swedish Municipal and County Council Finances
The Chief Economist’s conclusionsThe local government sector’s revenue has been significantly af-fected by the economic crisis. The positive net income for 2009and 2010 is mainly due to restraint, temporary factors and addi-tional cyclical support from central government. The situation isbleaker ahead of 2011. In our forecast for 2011 we nevertheless ex-pert a surplus of more than sek 3 billion, but the effort requiredto get there will be tough. Costs must be lower than required bythe pressure from demography. But in recent years the sectorhas demonstrated its ability to maintain financial balance whilesafeguarding services. We therefore expect it to also rise to thischallenge.
However, in the longer term costs will be forced up by the pressure from de-mography, rising demand and high ambitions. So far volume has risen by 1 percent per year over and above what can be explained by demography. We ex-pect this development to continue, so municipalities and county councils willhave difficulty restraining cost growth over an extended period.1 This meansthat there is a risk that net income will deteriorate gradually unless revenueincreases in the future.
Continued recovery but a long way to go to normal conditionsThe free fall in the global economy slowed down in mid-2009. Since last sum-mer there has been a gradual recovery in global trade, for example, which suf-fered a dramatic fall in connection with the collapse of the financial marketsin autumn 2008. However, historical experience suggests that a recovery af-
The Economy Report. May 2010 On Swedish Municipal and County Council Finances 3
1. This is described, along with the development of needs and resources up until 2035, in the report”Framtidens utmaning” (The challenge of the future) published by the Swedish Association of Local Au -thorities and Regions in April this year.
ter a deep financial crisis is long and halting since far from all the financial“messes” have had time to rise to the surface. The recent tumult about Greekpublic finances and other indebted countries is a telling example, indicatingthat major problems remain. Even though Greece is a small economy of littledirect importance for the Swedish economy, via foreign trade for example, theeffects of any collapse of Greek public finances still risk having serious con-sequences for Sweden. Not least, there would be a risk of considerable harmto the global financial system, from which it is inevitable that Sweden will alsosuffer. A ‘Greek infection’ spreading to other vulnerable countries, especiallyaround the Mediterranean, would make matters worse.
However, we expect the world economy to continue its gradual improve-ment, which is essential if Sweden’s export-dependent economy, is to pick upspeed. After a fall in export-weighted gdp of 3.4 per cent in 2009 we now ex-pect growth of 1.8 per cent this year and 2.4 per cent in 2011. For Sweden, whi-ch suffered much more than the average in 2009 with a gdp fall of as much as4.9 per cent, we now expect the economy to perform a bit better than our tra-ding partners and grow by 2.5 per cent this year and 3.2 per cent in 2011.
So far, however, Swedish industry is making relatively slow progress, eventhough Swedish export companies were favoured during the crisis by a very
4 The Economy Report. May 2010 On Swedish Municipal and County Council Finances
The Chief Economist’s Conclusions
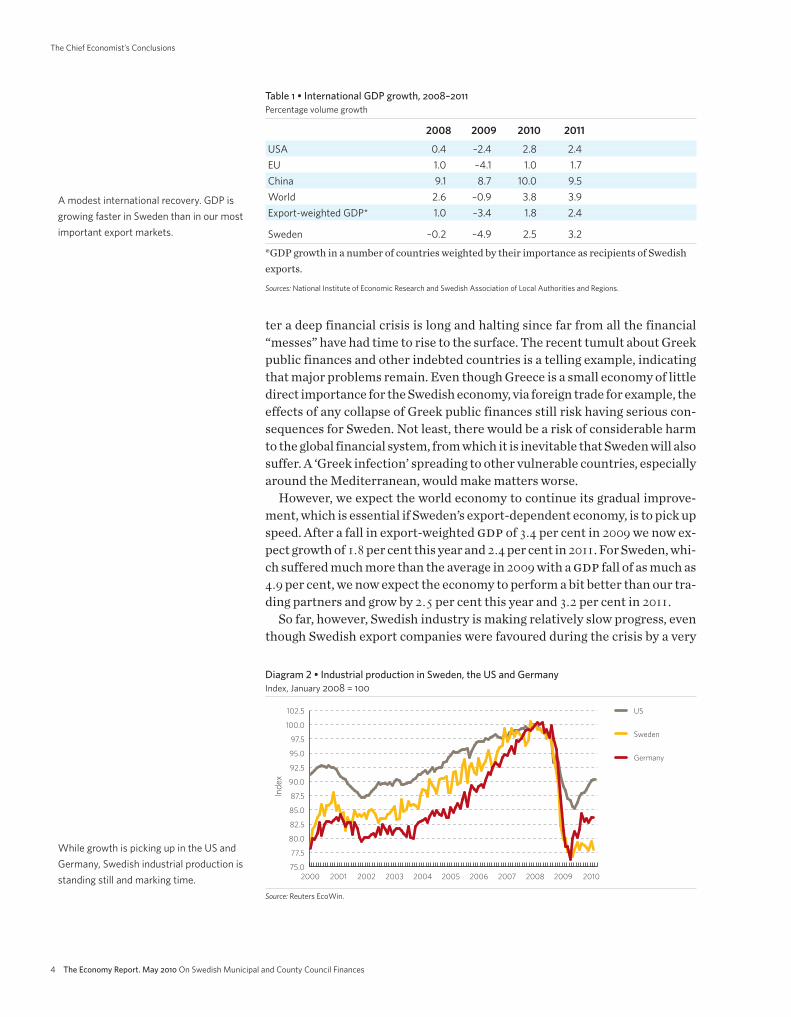
Table 1 • International GDP growth, 2008–2011
Percentage volume growth
2008 2009 2010 2011
USA 0.4 –2.4 2.8 2.4EU 1.0 –4.1 1.0 1.7China 9.1 8.7 10.0 9.5World 2.6 –0.9 3.8 3.9Export-weighted GDP* 1.0 –3.4 1.8 2.4
Sweden –0.2 –4.9 2.5 3.2
*GDP growth in a number of countries weighted by their importance as recipients of Swedishexports.
Sources: National Institute of Economic Research and Swedish Association of Local Authorities and Regions.
A modest international recovery. GDP isgrowing faster in Sweden than in our mostimportant export markets.
Diagram 2 • Industrial production in Sweden, the US and GermanyIndex, January 2008 = 100
75.0
77.5
80.0
82.5
85.0
87.5
90.0
92.5
95.0
97.5
100.0
102.5 US
Sweden
Germany
20102009200820072006200520042003200220012000
Inde
x
While growth is picking up in the US andGermany, Swedish industrial production isstanding still and marking time.
Source: Reuters EcoWin.
weak krona. The main reason is probably the composition of Swedish exports,in terms of both products and geography. To a great extent, Swedish compa-nies manufacture input goods and investment goods mainly destined for aEurope that is growing slowly. The decline in the global automotive industrydoes not improve matters! In contrast the emerging economies in Asia and el-sewhere, which have built up speed, account for a relatively small share ofSwedish exports (diagram 2).
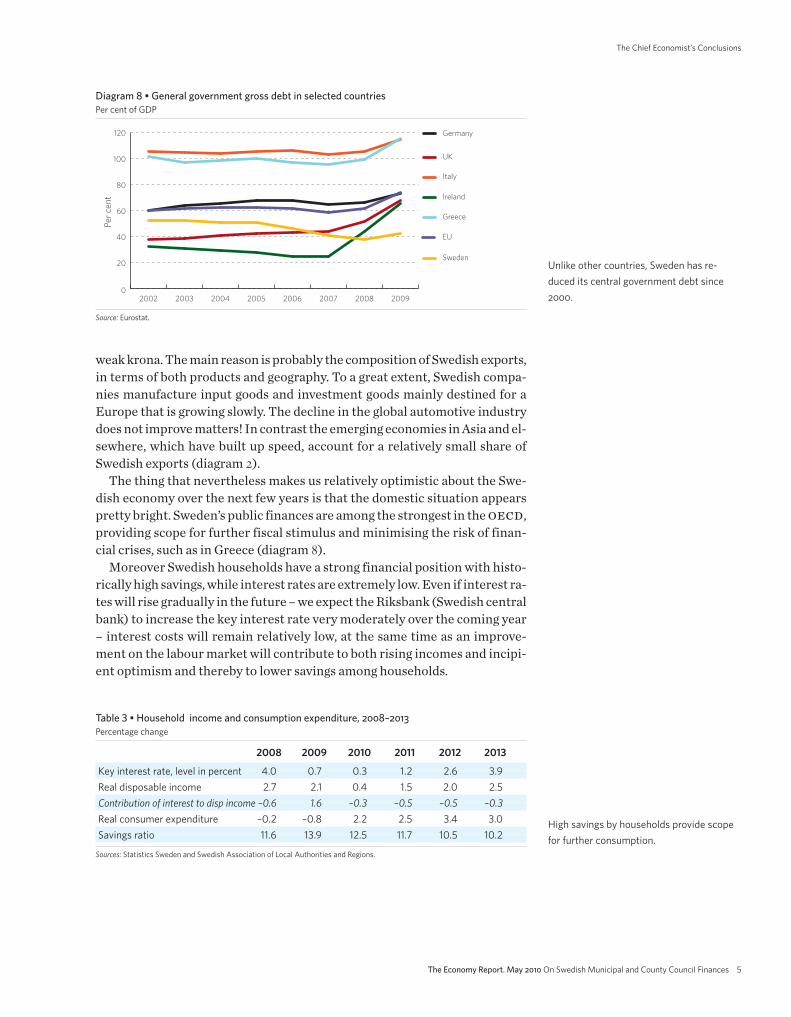
The thing that nevertheless makes us relatively optimistic about the Swe-dish economy over the next few years is that the domestic situation appearspretty bright. Sweden’s public finances are among the strongest in the oecd,providing scope for further fiscal stimulus and minimising the risk of finan-cial crises, such as in Greece (diagram 8).
Moreover Swedish households have a strong financial position with histo-rically high savings, while interest rates are extremely low. Even if interest ra-tes will rise gradually in the future – we expect the Riksbank (Swedish centralbank) to increase the key interest rate very moderately over the coming year– interest costs will remain relatively low, at the same time as an improve-ment on the labour market will contribute to both rising incomes and incipi-ent optimism and thereby to lower savings among households.
The Economy Report. May 2010 On Swedish Municipal and County Council Finances 5
The Chief Economist’s Conclusions
Diagram 8 • General government gross debt in selected countriesPer cent of GDP
0
20
40
60
80
100
120 Germany
UK
Italy
Ireland
Greece
EU
Sweden
20092008200720062005200420032002
Per c
ent
Unlike other countries, Sweden has re -duced its central government debt since2000.
Source: Eurostat.
Table 3 • Household income and consumption expenditure, 2008–2013
Percentage change
2008 2009 2010 2011 2012 2013
Key interest rate, level in percent 4.0 0.7 0.3 1.2 2.6 3.9Real disposable income 2.7 2.1 0.4 1.5 2.0 2.5Contribution of interest to disp income –0.6 1.6 –0.3 –0.5 –0.5 –0.3Real consumer expenditure –0.2 –0.8 2.2 2.5 3.4 3.0Savings ratio 11.6 13.9 12.5 11.7 10.5 10.2
Sources: Statistics Sweden and Swedish Association of Local Authorities and Regions.
High savings by households provide scopefor further consumption.

Positive surprise on the labour market
One thing that can be said to have been a positive surprise in the crisis in re-cent years is that the labour market has not been weakened quite as dramati-cally as feared by most observers. It is certainly true that more than 100 000jobs have disappeared and unemployment has risen to more than 9 per cent,but it “should have” been much worse in view of the collapse of production.Given the historical pattern, hours worked in the economy ”should have” fal-len by almost 5 per cent in 2009, compared with the outcome of around 2.5 percent.
However the caution shown by companies about reducing their labour for-ce during the crisis probably means that the rise in employment in the futu-re will be limited, despite decent economic growth. Companies have plenty offree resources and can increase production without increasing capacity. Wenow expect unemployment to only fall slowly and to stay above what we viewas a normal level for as long as until 2015. With regard to hours worked, whi-ch is the single most important factor for the tax base in the local governmentsector, our forecast is a fall of 0.5 per cent in 2010 and a corresponding incre-ase in 2011. At the same time, we expect hourly wages in the economy to riseby an average of 2.3 per cent both this year and next year.
Weak growth of the tax baseEven though the economy is now an upturn, we must not, however, expect agolden age for the Swedish local government sector. On account of the weakrecovery on the labour market and moderate pay increases, we only expectweak growth of the tax base, 1.4 per cent 2 in 2010. In 2011 the tax base risesby 2.4 per cent. In real terms, i.e. taking account of the development of pricesand costs, we expect the tax base to fall by 0.3 per cent this year and to thenshow very moderate growth, 0.7 per cent, in 2011. Not until 2012 and thereaf-ter do we expect more ‘normal’ growth of the tax base, as the labour marketand wage increases gather pace.
In fact, the sector’s revenue is also affected by factors other than the labourmarket, especially economic policy but also other aspects. Developments in2009 are a good example of this. Instead of a small deficit, as forecast by the
6 The Economy Report. May 2010 On Swedish Municipal and County Council Finances
The Chief Economist’s Conclusions
2. The increase is 2.0 per cent if the increase in the basic income tax allowance for pensioners is excluded;the sector will receive compensation for this via its central government grants.
Table 4 • Key indicators for the labour market, 2009–2013
Percentage change
2009 2010 2011 2012 2013
Labour force participation* 80,2 80,5 80,8 81,3 81,8Employment –2,3 –0,4 0,4 1,4 1,3Unemployment** 8,4 9,3 9,4 8,6 7,8Hours worked*** –2,6 –0,5 0,5 1,3 1,3Hourly wage 3,1 2,3 2,3 3,0 3,5Payroll 0,5 1,8 2,8 4,3 4,8CPI –0,3 1,0 1,6 2,6 2,8CPIX 1,5 1,7 0,9 1,2 1,5
*Per cent of population. **Per cent of the labour force ***Adjusted for calendar effects.
Sources: Statistics Sweden and Swedish Association of Local Authorities and Region.
The recovery in the economy means thatemployment and labour force participa-tion are rising while unemployment is fal-ling. The improvement on the labour mar-ket will in turn result in higher price andwage inflation.
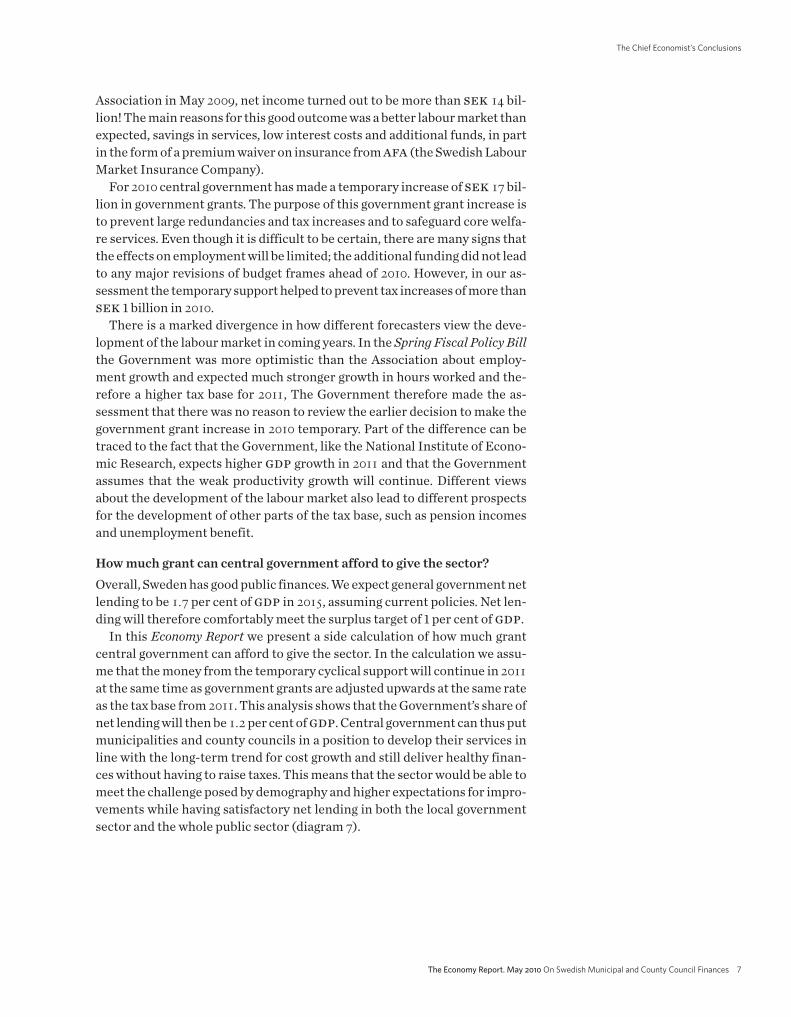
Association in May 2009, net income turned out to be more than sek 14 bil-lion! The main reasons for this good outcome was a better labour market thanexpected, savings in services, low interest costs and additional funds, in partin the form of a premium waiver on insurance from afa (the Swedish LabourMarket Insurance Company).
For 2010 central government has made a temporary increase of sek 17 bil-lion in government grants. The purpose of this government grant increase isto prevent large redundancies and tax increases and to safeguard core welfa-re services. Even though it is difficult to be certain, there are many signs thatthe effects on employment will be limited; the additional funding did not leadto any major revisions of budget frames ahead of 2010. However, in our as-sessment the temporary support helped to prevent tax increases of more thansek 1 billion in 2010.
There is a marked divergence in how different forecasters view the deve-lopment of the labour market in coming years. In the Spring Fiscal Policy Billthe Government was more optimistic than the Association about employ-ment growth and expected much stronger growth in hours worked and the-refore a higher tax base for 2011, The Government therefore made the as-sessment that there was no reason to review the earlier decision to make thegovernment grant increase in 2010 temporary. Part of the difference can betraced to the fact that the Government, like the National Institute of Econo-mic Research, expects higher gdp growth in 2011 and that the Governmentassumes that the weak productivity growth will continue. Different viewsabout the development of the labour market also lead to different prospectsfor the development of other parts of the tax base, such as pension incomesand unemployment benefit.
How much grant can central government afford to give the sector?Overall, Sweden has good public finances. We expect general government netlending to be 1.7 per cent of gdp in 2015, assuming current policies. Net len-ding will therefore comfortably meet the surplus target of 1 per cent of gdp.
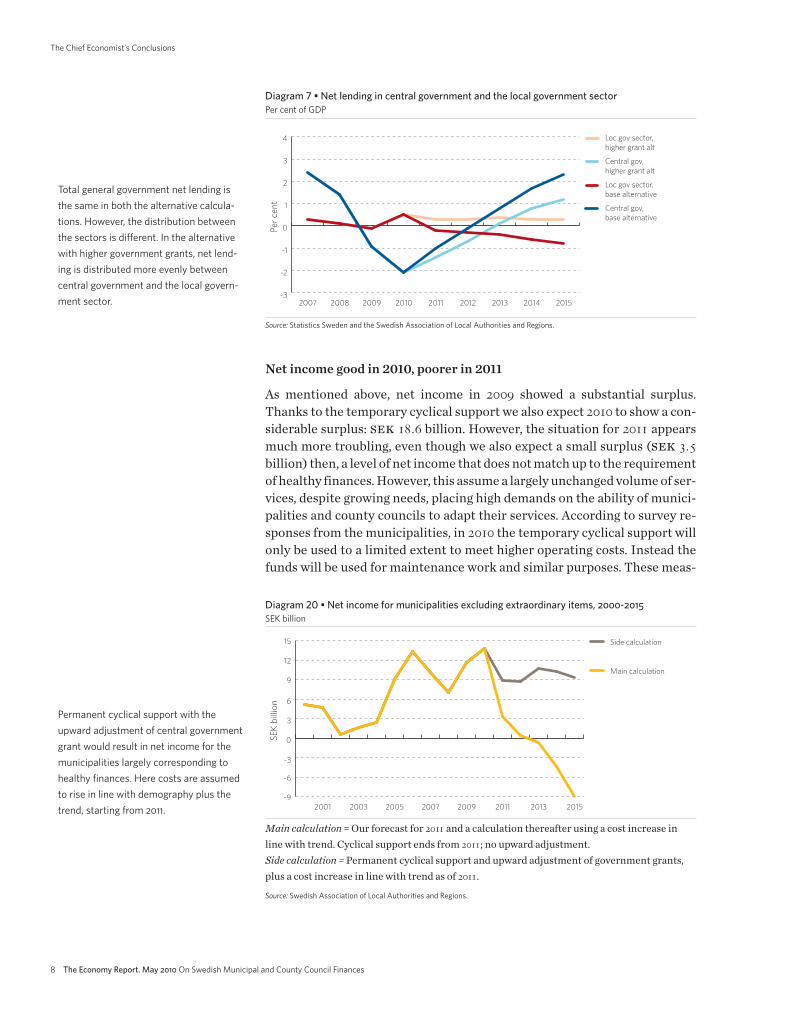
In this Economy Report we present a side calculation of how much grantcentral government can afford to give the sector. In the calculation we assu-me that the money from the temporary cyclical support will continue in 2011at the same time as government grants are adjusted upwards at the same rateas the tax base from 2011. This analysis shows that the Government’s share ofnet lending will then be 1.2 per cent of gdp. Central government can thus putmunicipalities and county councils in a position to develop their services inline with the long-term trend for cost growth and still deliver healthy finan-ces without having to raise taxes. This means that the sector would be able tomeet the challenge posed by demography and higher expectations for impro-vements while having satisfactory net lending in both the local governmentsector and the whole public sector (diagram 7).
The Economy Report. May 2010 On Swedish Municipal and County Council Finances 7
The Chief Economist’s Conclusions
Net income good in 2010, poorer in 2011
As mentioned above, net income in 2009 showed a substantial surplus.Thanks to the temporary cyclical support we also expect 2010 to show a con-siderable surplus: sek 18.6 billion. However, the situation for 2011 appearsmuch more troubling, even though we also expect a small surplus (sek 3.5billion) then, a level of net income that does not match up to the requirementof healthy finances. However, this assume a largely unchanged volume of ser-vices, despite growing needs, placing high demands on the ability of munici-palities and county councils to adapt their services. According to survey re-sponses from the municipalities, in 2010 the temporary cyclical support willonly be used to a limited extent to meet higher operating costs. Instead thefunds will be used for maintenance work and similar purposes. These meas -
8 The Economy Report. May 2010 On Swedish Municipal and County Council Finances
The Chief Economist’s Conclusions
Diagram 7 • Net lending in central government and the local government sectorPer cent of GDP
-3
-2
-1
0
1
2
3
4 Loc gov sector,higher grant alt
Central gov,higher grant alt
Loc gov sector,base alternative
Central gov, base alternative
201520142013201220112010200920082007
Per c
ent
Total general government net lending isthe same in both the alternative calcula-tions. However, the distribution betweenthe sectors is different. In the alternativewith higher government grants, net lend -ing is distributed more evenly betweencentral government and the local govern-ment sector.
Source: Statistics Sweden and the Swedish Association of Local Authorities and Regions.
Diagram 20 • Net income for municipalities excluding extraordinary items, 2000-2015
SEK billion
-9
-6
-3
0
3
6
9
12
15 Side calculation
Main calculation
20152013201120092007200520032001
SEK
bill
ion
Permanent cyclical support with theupward adjustment of central governmentgrant would result in net income for themunicipalities largely corresponding tohealthy finances. Here costs are assumedto rise in line with demography plus thetrend, starting from 2011.
Main calculation = Our forecast for 2011 and a calculation thereafter using a cost increase inline with trend. Cyclical support ends from 2011; no upward adjustment.Side calculation = Permanent cyclical support and upward adjustment of government grants,plus a cost increase in line with trend as of 2011.
Source: Swedish Association of Local Authorities and Regions.

ures do not raise the long-term level of municipal costs but can contribute tohigher private sector employment, Our assessment is that the volume of costswill increase by 1.3 (1.2) per cent for municipalities (county councils) in 2010but only 0.1 (0.4) per cent in 2011.3
Lessons for the futureSo what can we learn from developments in recent years? • It has become clearer than ever how exposed the Swedish economy is to
international fluctuations. Sweden, including the local government sec-tor, is a little bark boat on the wide economic ocean and has small possibi-lities of deviating from global cyclical patterns.
• However Sweden does not wholly lack muscles to soften the impacts of asharp global downturn by using economic policy – if we keep our house inorder!
• Economic forecasting is difficult! Every crisis has its own logic and dyna-mic, making the course of every crisis unique. Forecasters have few otheroptions than to look to the historical experience. This means that there isa great risk of low accuracy in their forecasts, especially in connectionwith major disturbances of the global economy.
The Economy Report. May 2010 On Swedish Municipal and County Council Finances 9
The Chief Economist’s Conclusions
3. For municipalities the increase is 1.0 per cent for 2010 and 0.0 per cent for 2011 if financial support (social assistance) is excluded.
Diagram 25 •Net income for county councils, 2000-2015
SEK billion
-20
-15
-10
-5
0
5 Side calculation
Main calculation
20152013201120092007200520032001
SEK
bill
ion
Permanent cyclical support with theupward adjustment of government grantswould result in better net income for thecounty councils. However, it still falls un-der zero in 2014. Here costs are assumedto rise in line with demography plus thetrend, starting from 2011.
Main calculation = Our forecast for 2011 and a calculation thereafter using a cost increase inline with trend. Cyclical support ends from 2011; no upward adjustment.Side calculation = Permanent cyclical support and upward adjustment of government grants,plus a cost increase in line with trend as of 2011.
Source: Swedish Association of Local Authorities and Regions..

10 The Economy Report. May 2010 On Swedish Municipal and County Council Finances
The Chief Economist’s Conclusions
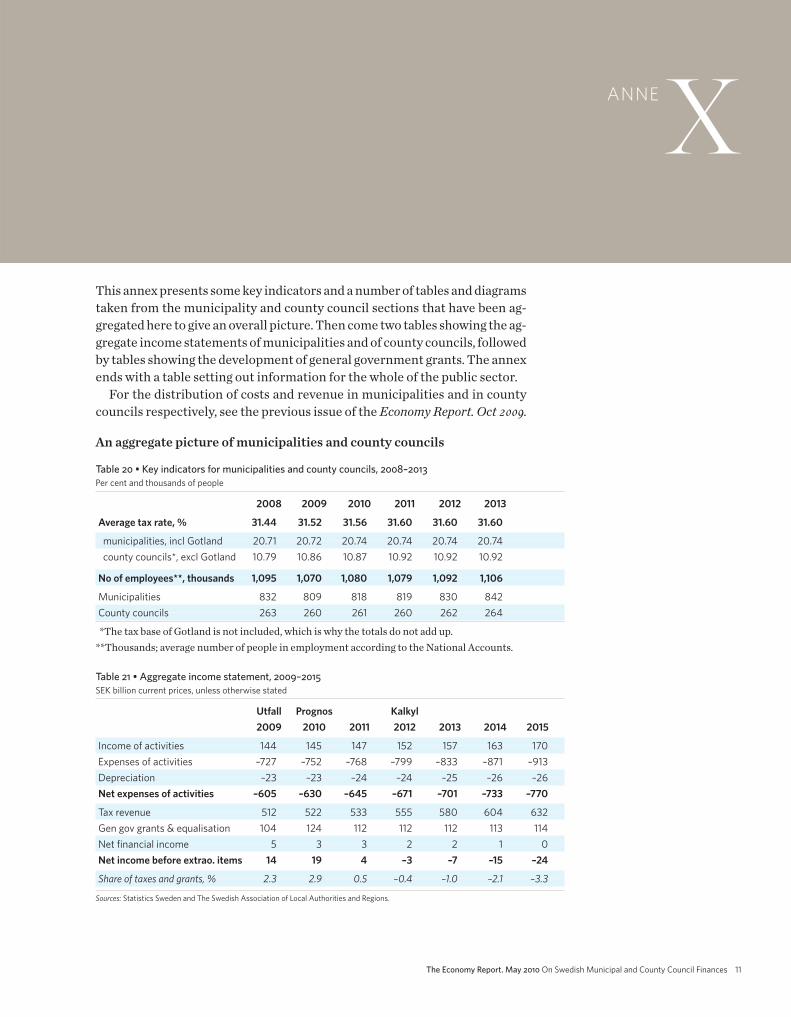
This annex presents some key indicators and a number of tables and diagramstaken from the municipality and county council sections that have been ag-gregated here to give an overall picture. Then come two tables showing the ag-gregate income statements of municipalities and of county councils, followedby tables showing the development of general government grants. The annexends with a table setting out information for the whole of the public sector.
For the distribution of costs and revenue in municipalities and in countycouncils respectively, see the previous issue of the Economy Report. Oct 2009.
An aggregate picture of municipalities and county councils
The Economy Report. May 2010 On Swedish Municipal and County Council Finances 11
ANNEX
Table 20 • Key indicators for municipalities and county councils, 2008–2013
Per cent and thousands of people
2008 2009 2010 2011 2012 2013
Average tax rate, % 31.44 31.52 31.56 31.60 31.60 31.60
municipalities, incl Gotland 20.71 20.72 20.74 20.74 20.74 20.74county councils*, excl Gotland 10.79 10.86 10.87 10.92 10.92 10.92
No of employees**, thousands 1,095 1,070 1,080 1,079 1,092 1,106
Municipalities 832 809 818 819 830 842County councils 263 260 261 260 262 264
*The tax base of Gotland is not included, which is why the totals do not add up. **Thousands; average number of people in employment according to the National Accounts.
Table 21 • Aggregate income statement, 2009–2015
SEK billion current prices, unless otherwise stated
Utfall Prognos Kalkyl2009 2010 2011 2012 2013 2014 2015
Income of activities 144 145 147 152 157 163 170Expenses of activities –727 –752 –768 –799 –833 –871 –913Depreciation –23 –23 –24 –24 –25 –26 –26Net expenses of activities –605 –630 –645 –671 –701 –733 –770
Tax revenue 512 522 533 555 580 604 632Gen gov grants & equalisation 104 124 112 112 112 113 114Net financial income 5 3 3 2 2 1 0Net income before extrao. items 14 19 4 –3 –7 –15 –24
Share of taxes and grants, % 2.3 2.9 0.5 –0.4 –1.0 –2.1 –3.3
Sources: Statistics Sweden and The Swedish Association of Local Authorities and Regions.

12 The Economy Report. May 2010 On Swedish Municipal and County Council Finances
Annex
Diagram 27 • Cost growth in municipalities and county councils broken down by volume and price Per cent
Per c
ent
0
1
2
3
4
5
6 Price
Volume
20132012201120102009200820072006200520042003
Forecast Calculation
Source: The Swedish Association of Local Authorities and Regions.
Diagram 26 • Municipal and county council net income before extraordinary itemsPercentage of taxes and transfers
Per c
ent
-6
-5
-4
-3
-2
-1
0
1
2
3
4 County councils
Municipalities
20152013201120092007200520032001
Forecast Calculation
Source: The Swedish Association of Local Authorities and Regions.

The Economy Report. May 2010 On Swedish Municipal and County Council Finances 13
Annex
Table 22 • Income statement for the municipalities, 2009–2015
SEK billion
Outcome Forecast Calculation2009 2010 2011 2012 2013 2014 2015
Income of activities 110 110 111 114 118 123 128Expenses of activties –485 –502 –513 –532 –554 –579 –607Depreciation –16 –16 –16 –17 –17 –18 –18Net expenses of activities –391 –408 –418 –435 –453 –473 –497
Tax revenue 336 343 350 364 380 397 415Gen gov grants and equalisation 61 76 69 68 69 69 70Net financial income 5 3 3 3 3 3 3Net income before extrao. items 12 14 3 0 –1 –4 –9
Share of taxes and grants, % 2.9 3.3 0.8 0.1 –0.1 –0.9 –1.8
Table 23 • Income statement for the county councils, 2009–2015
SEK billion
Outcome Forecast Calculation2009 2010 2011 2012 2013 2014 2015
Income of activities 36 38 38 40 41 43 44Expenses of activties –244 –253 –258 –269 –282 –295 –310Depreciation –7 –7 –7 –7 –8 –8 –8Net expenses of activities –214 –222 –227 –237 –248 –260 –273
Tax revenue 176 179 183 191 199 208 217Gen gov grants and equalisation 41 48 44 44 44 44 44Net financial income 0 0 0 –1 –1 –2 –3Net income before extrao. items 3 5 0 –3 –6 –11 –15
Share of taxes and grants, % 1.3 2.1 0.1 –1.4 –2.6 –4.2 –5.9
Source: The Swedish Association of Local Authorities and Regions.
Annex
14 The Economy Report. May 2010 On Swedish Municipal and County Council Finances
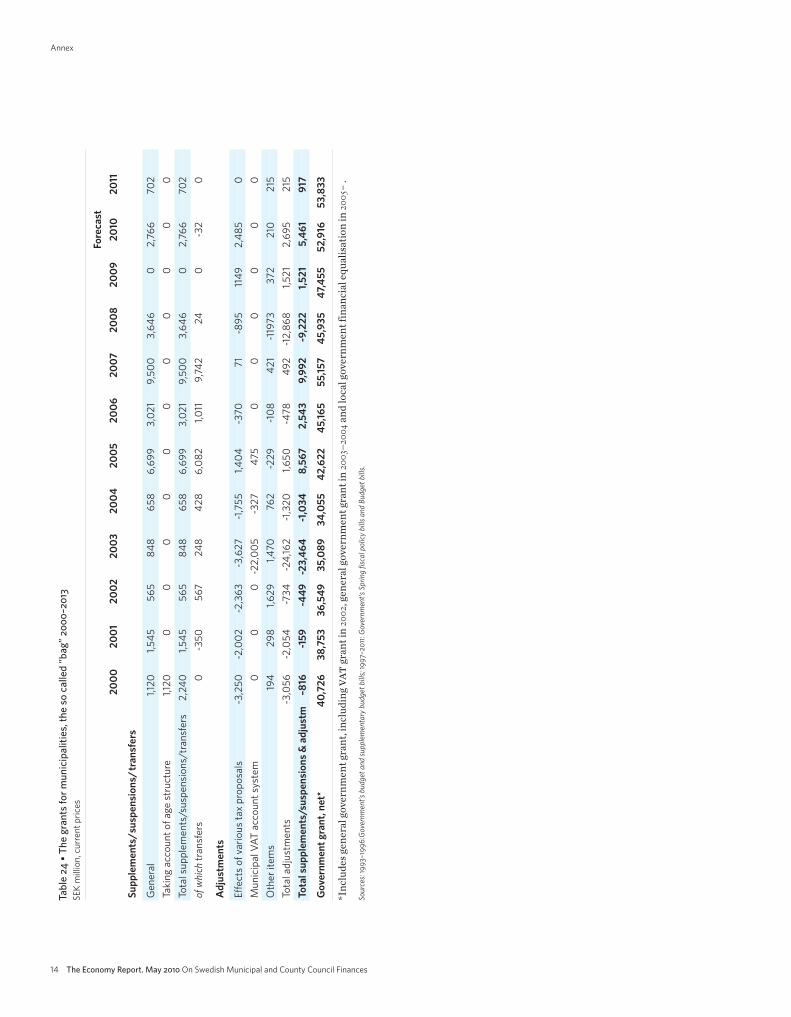
Tabl
e 2
4• T
he g
rant
s fo
r mun
icip
aliti
es, t
he s
o ca
lled
”bag
” 20
00
–2
013
SEK
mill
ion,
cur
rent
pric
es
Fore
cast
2000
2001
2002
2003
2004
2005
2006
2007
2008
2009
2010
2011
Supp
lem
ents
/sus
pens
ions
/tra
nsfe
rs
Gen
eral
1,120
1,545
565
848
658
6,69
93,
021
9,50
03,
646
02,
766
702
Taki
ng a
ccou
nt o
f age
str
uctu
re1,1
200
00
00
00
00
00
Tota
l sup
plem
ents
/sus
pens
ions
/tra
nsfe
rs2,
240
1,545
565
848
658
6,69
93,
021
9,50
03,
646
02,
766
702
of w
hich
tran
sfer
s0
-350
567
248
428
6,08
21,0
119,
742
240
-32
0
Adj
ustm
ents
Effe
cts
of v
ario
us ta
x pr
opos
als
-3,2
50-2
,002
-2,3
63-3
,627
-1,7
551,4
04-3
7071
-895
1149
2,48
50
Mun
icip
al V
AT a
ccou
nt s
yste
m0
00
-22,
005
-327
475
00
00
00
Oth
er it
ems
194
298
1,629
1,470
762
-229
-108
421
-119
7337
221
021
5To
tal a
djus
tmen
ts-3
,056
-2,0
54-7
34-2
4,16
2-1
,320
1,650
-478
492
-12,
868
1,521
2,69
521
5To
tal s
uppl
emen
ts/s
uspe
nsio
ns &
adj
ustm
–816
-159
-449
-23,
464
-1,0
348,
567
2,54
39,
992
-9,2
221,5
215,
461
917
Gov
ernm
ent g
rant
, net
*40
,726
38,7
5336
,549
35,0
8934
,055
42,6
2245
,165
55,15
745
,935
47,4
5552
,916
53,8
33
*Inc
lude
s gen
eral
gov
ernm
ent g
rant
, inc
ludi
ng v
atgr
ant i
n 20
02, g
ener
al g
over
nmen
t gra
nt in
2003
–200
4an
d lo
cal g
over
nmen
t fin
anci
al e
qual
isat
ion
in 20
05–
.
Sour
ces:
19
93
–19
96
:Gov
ernm
ent’s
bud
get a
nd su
pple
men
tary
bud
get b
ills;
19
97
–2
011:G
over
nmen
t’s S
prin
g fis
cal p
olicy
bill
s and
Bud
get b
ills.

Appendix
The Economy Report. May 2010 On Swedish Municipal and County Council Finances 15
Tabl
e 2
5• T
he g
rant
s fo
r cou
nty
coun
cils
, the
so
calle
d ”b
ag”
20
00
–2
013
SEK
mill
ion,
cur
rent
pric
es
Fore
cast
2000
2001
2002
2003
2004
2005
2006
2007
2008
2009
2010
2011
Supp
lem
ents
/sus
pens
ions
/tra
nsfe
rs
Gen
eral
1,660
1,355
1,043
1,342
867
3,91
457
82,
683
1,229
01,2
0030
0To
tal s
uppl
emen
ts/s
uspe
nsio
ns/t
rans
fers
1,660
1,355
1,043
1,342
867
3,91
457
82,
683
1,229
01,2
0030
0of
whi
ch tr
ansf
ers
00
1,048
–58
197
2,53
113
2,13
3–2
00
00
Adj
ustm
ents
Effe
cts
of v
ario
us ta
x pr
opos
als
–1,5
50–9
64–1
,137
–1,7
44–8
4667
6–1
900
–442
753
1,298
0M
unic
ipal
VAT
acc
ount
sys
tem
00
0–9
,355
–1,0
4067
20
00
00
0O
ther
item
s50
0–1
,413
4946
5–1
740
1211
90
190
Tota
l adj
ustm
ents
–1,5
00–9
64–2
,550
–11,0
50–1
,421
1,174
–190
12–3
2375
31,3
170
Tota
l sup
plem
ents
/sus
pens
ions
& a
djus
tm16
039
1–1
,507
–9,7
08–5
545,
088
388
2,69
590
675
32,
517
300
Gov
ernm
ent g
rant
, net
*11
,325
10,9
248,
495
8,10
77,
486
12,5
7412
,962
15,6
5716
,563
17,3
1619
,833
20,13
3
*Inc
lude
s gen
eral
gov
ernm
ent g
rant
, inc
ludi
ng v
atgr
ant i
n 20
02, g
ener
al g
over
nmen
t gra
nt in
2003
–200
4an
d lo
cal g
over
nmen
t fin
anci
al e
qual
isat
ion
in 20
05–
.
Sour
ces:
19
93
–19
96
:Gov
ernm
ent’s
bud
get a
nd su
pple
men
tary
bud
get b
ills;
19
97
–2
011:G
over
nmen
t’s S
prin
g fis
cal p
olicy
bill
s and
Bud
get b
ills.

16 The Economy Report. May 2010 On Swedish Municipal and County Council Finances
Annex
The following table provides supporting information for the section ”How muchgrant can central government afford to give the sector?”.
Table 26 • Consolidated public sectorSEK billion
2009 2010 2011 2012 2013 2014 2015
Income 1,612 1,653 1,704 1,785 1,873 1,964 2,056
per cent of GDP 52.7 52.1 51.4 51.2 51.0 50.7 50.6Taxes and contributions 1,438 1,478 1,519 1,588 1,666 1,747 1,831per cent of GDP 47.0 46.6 45.8 45.6 45.4 45.1 45.0Direct taxes 519 538 552 578 609 638 668Product & production taxes 579 574 590 618 647 678 711Social security contributions 339 366 376 392 411 431 452
Other income 175 175 186 196 206 217 225
Expenditure 1,637 1,694 1,727 1,782 1,845 1,910 1,986
per cent of GDP 53.5 53.4 52.1 51.1 50.2 49.3 48.8Consumption 858 889 907 936 973 1,014 1,060Investments 107 111 112 111 111 114 117Transfers 636 647 655 670 689 708 736Old-age pensions 217 221 221 231 249 260 274Other transfers to households 319 327 330 331 328 331 341Business sector & abroad 99 100 103 107 112 116 121
Interest expenditure 36 47 54 65 73 75 73
Ned lending –25 –41 –23 3 27 54 70
per cent of GDP –0.8 –1.3 –0.7 0.1 0.7 1.4 1.7GDP, current prices 3,057 3,173 3,314 3,485 3,673 3,872 4,067
Sources: Statistics Sweden, National Institute of Economic Research and Swedish Association of Local Authorities and Regions.

The Economy Report. May 2010
On Swedish Municipal and County council finances
is a series published twice yearly by the Swedish Association ofLocal Authorities and Regions (salar). In it we deal with the pre-sent economic situ ation and developments in municipalities andcounty councils. The calculations in this issue extend to 2015.
The local government sector will report a good level of net inco-me for 2010. Next year tax base growth will not compensate forthe withdrawal of the temporary cyclical support from centralgovernment. This will weaken the financial situation of the sec-tor, although positive net income is also foreseen for 2011. Howe-ver, the calculations presented in the report suggest that it will bemore difficult for municipalities and county councils to balancetheir budgets in the future.
The report can be downloaded at www.skl.se/publikationer.
ISBN 978-91-7164-564-7
Mail SE-118 82 StockholmVisitors Hornsgatan 20
Phone +46-8-452 70 00
www.skl.se