The Economics of System Loss - bigd.bracu.ac.bd PAPERS/35.-Wahid-Abdallah... · Abstract This paper...
27
The Economics of System Loss BRAC Instute of Governance and Development BRAC University Wahid Abdallah Hendrik Wolff BIGD Working Paper No. 35 June 2016
Transcript of The Economics of System Loss - bigd.bracu.ac.bd PAPERS/35.-Wahid-Abdallah... · Abstract This paper...

The Economics of System Loss
BRAC Institute of Governance and DevelopmentBRAC University
Wahid AbdallahHendrik Wolff
BIGD Working PaperNo. 35 June 2016

The Economics of System Loss
Wahid AbdallahHendrik Wolff
BRAC Institute of Governance and DevelopmentBRAC University

BRAC Institute of Governance and Development (BIGD)BRAC University, Dhaka
BIGD Working Paper SeriesNo. 35, June, 2016
The Economics of System Loss ByWahid Abdallah, BRAC UniversityHendrik Wolff, University of Washington
© 2016 BIGD, BRAC University
Cover: Md. Parvej
Published by
BRAC Institute of Governance and Development (BIGD)BRAC University
SK Centre (Basement, 3rd - 7th & 9th Floor), GP, JA-4, TB Gate Mohakhali, Dhaka 1212, Bangladesh
Tel : (+88 02) 5881 0306, 5881 0326, 5881 0320, 883 5303Fax : (+88 02) 883 2542Email : [email protected]: bigd.bracu.ac.bd
The views expressed in this paper are those of the authors and do not necessarily reflect the views of BRAC Institute of Governance and Development (BIGD), BRAC University. This volume is a product of the BIGD, BRAC University. The findings, interpretations and conclusions presented in this document do not necessarily reflect the views of BRAC University authorities.
All rights reserved. This book or any portion thereof may not be reproduced or used in any manner whatsoever without the expressed written permission of the publisher except for the use of brief quotations in a book review.
Terms of use
Disclaimer
BDT 50USD 5

Table of Contents
Abstract iv
Acknowledgement v
1. Introduction 1
2. Institutional Background 3
3. Data 6
4. Descriptive Statistics 7
5. The Empirical Framework 11
6. The Empirical Results 12
7. Conclusion 18
Bibliography 19
iii
AbstractThis paper deals with the problem of electricity theft. In developing countries, individuals and firms illegally underpay their electricity bills in various ways. This results in large amounts of unbilled electricity, and causes significant revenue losses to the electricity distribution utilities and hence, presents a case of compliance similar to tax evasion. We argue however that electricity theft, unlike tax evasion, is easier to measure, as it is captured in what is called system loss, defined as unbilled electricity as a percentage of the electricity supplied. Whereas this measure always contains some technical loss due to transmission and distribution channels, a large part of it also contains the stolen amount, since it remains unbilled. We look at changes in system loss in Indian electricity supplying authorities for different states between 2003 and 2012 in response to a stricter legal environment. We expect that electricity theft should respond to these changes, whereas the technical loss should be nonresponsive. We use the recent provisions for stronger law enforcement institutions stipulated under the Electricity Act 2003 in India to test this hypothesis. The disparity in the timing of adoption of the Act of different states allows us to design a quasi-experiment. We also consider electricity prices to draw a similar analysis corresponding to the effect of tax on tax evasion. We find that adoption of the Act and thereby the creation of a stronger legal institution reduces system loss whereas increases in price, like increases in tax, increases system loss.
Key Words: Electricity Theft, Compliance, Legal Institutions, Electricity Tariffs, Illegal Behavior, Evasion
JEL Classification: D73, H26, H42, K42
iv

Acknowledgement
The paper was initiated as one of the chapters for PhD dissertation of Wahid Abdallah at University of Washington. We thank Fahad Khalil for his valuable suggestions, comments and support. We also thank Jacques Lawarree, Lan Shi and Sajjad Zohir as well as participants of 7th Australasia Public Choice Conference 2014 at Monash University, Melbourne, Australia, and International Conference on Political Economy, Accountability and Governance, Dhaka and Brownbag seminar at BRAC University for helpful comments. We also thank Research Assistants Nahiyan Faisal Azad, Niaz Farhan Haque and Sakib Rahman for their research support.
v

I. Introduction
Electricity in developing countries is often subject to theft, creating significant revenue losses in the power distribution utilities. Consumers use various illicit ways to underpay electricity bills less than what they actually consume.1 A big percentage of supplied electricity is thus unpaid for, even though considerable resources continue to be used to supply that electricity and the power distribution utilities face significant revenue losses. For example, the then-Prime Minister of India Mr. Atal Behari Vajpayee in his 2002 Independence Day Speech said that the national theft of electricity is estimated to cost about four billion dollars a year. In the same year, Transparency International, India found the power sector to be the third most corrupt sector in the country. Smith (2004) reports that the Pakistani Army in 1999 had found about 100,993 instances of power theft, had collected about Rs 2.4 billion (US$ 28.66 million) in fines and penalties and had made about 1188 arrests in this regard. Whereas it is an important case to study in its own right, it also has interesting resemblance to tax evasion, where there are similar legal institutions (e.g., fines for evasion) to ensure compliance.
It may however be easier to measure electricity theft, thanks to some technical factors pertaining to the power sector. Generally, power utilities record the amount of electricity that they send as input through a distribution line or location as well as the amount of electricity that they can bill on that line or location. Some electricity is always lost during transmission and distribution and power utilities often report it by calculating the amount of electricity that is unbilled as a percentage of electricity input. This is known as the System Loss or Transmission and Distribution (T&D) Loss. However, the electricity that is subject to theft is also unbilled and therefore captured in this system loss data.
In this paper, we analyse changes in the system loss resulting from strengthening of law enforcement institutions in India. The Ministry of Power in India passed a new Electricity Act in 2003, replacing the older India Electricity Act, 1910. The new Act defines electricity theft more explicitly with clearer specifications of what activities are considered theft, includes more rational and probably stringent penalties andmakes provisions for the setting up of fast-track special courts to facilitate the processing of the punishments, if required. We believe that this should not affect the technical component of system loss, but can possibly increase compliance in consumer behavior and result in lower ‘nontechnical’ system loss. Overall then, we can expect a lower system loss caused by the Act.
Electricity theft is an interesting case in hand also due to its close resemblance to the problem of tax evasion In the case of tax evasion, individuals and firms are required to report their income (income tax, corporate tax, etc.) or expenditure (sales tax, customs duties etc.). The Tax Authority then prepares the tax payable to the authority which the tax payer agrees to pay. The tax payer however has an incentive to underreport income/expenditure for which they can pay less and evade taxes. In case of electricity theft, the consumers are required to pay electricity according to their consumption. However, they also have incentives to underpay and often manage to underreport electricity consumption. In addition, authorities in both cases need to rely on rigorous monitoring and stringent enforcement mechanisms to ensure compliance with tax or electricity laws. It is however often difficult to measure tax evasion since the actual income or expenditure is difficult to ascertain. Electricity in this regard is an interesting case as the degree of theft can be captured with relative ease.
1BIGD Working Paper Series No. 35
See Smith (2004) for details on how this theft occurs. Roughly, there are three ways that this occurs: i) by tampering the meter, ii) by making illegal hook ups and/or ii) by arranging a lower-than-consumed reading of the meter in alliance with the meter reader.
1

A major advantage of studying this in India stems from the fact that it allows us to design a quasi-experiment. After the Ministry of Power passed the Act in 2003, different states responded to it differently by endorsing the Act in different years. Hence, we can analyse changes in the system loss in a power utility before and after the enactment of the Act with a large number of power utilities maintaining their status quo over the same period. In other words, we can control for unobservable components of both the utility and the year.
For the purpose of our study, we use the data included in the reports on the performances of power utilities published by Power Finance Corporation Limited, the nodal agency for a number of power sector programs of the Ministry of Power, India. The data contains the after-transmission input and billing data at the Power Utility level which can be used to calculate the Distributional System Loss. In other words, the system loss data does not contain Transmission related system loss and is therefore much cleaner than other administrative records of system loss data. The data ranges between the years 2003-04 and 2011-12, during which most of the states adopted the policy.
We found an important result: the power utilities experienced a lower system loss after ratification of the Act by their respective State Electricity Regulatory Commissions (SERCs). This result is robust to inclusion of other related reforms that started in late 1990s, namely, corporatisation and decentralisation of distribution entities. We are also able to control for a number of additional factors that may influence the technical component of the system loss over time. After controlling for all these factors, the most conservative estimate of this effect is at least 4.05%.
In addition to the effect of stronger legal institutions, we investigated the effect of electricity prices on electricity theft. This is similar to tax evasion literature where impact of taxes is often examined on tax evasion. Whereas it is difficult to measure tax evasion, the availability of data on system loss makes it possible to probe a potentially similar relationship between the electricity price and electricity theft. In line with tax evasion literature, we find that increases in electricity prices increases system loss and thus, electricity theft.
We contribute to the empirical literature on illegal and non-compliance behavior. Whereas electricity theft is recognized as a major problem, rigorous econometric studies are surprisingly absent in the literature. Smith (2004) provides a detailed account drawing from a number of studies and reports and presents a cross-country descriptive analysis linking system loss to various governance indicators. Wamukoniya (2003) makes a descriptive analysis of effects of reform efforts on system loss. Nagayama (2010) examines the effect of a number of reform efforts on system loss using cross-country panel data.2 He however didn’t link system loss to electricity theft. The papers and reports that discuss the problem of electricity theft and system loss at the country level are Boullie, Dubrovsky and Maurer (2001) on Chile, Rudnick and Raineri (1997) on Argentina, Alam et al. (2004) on Bangladesh and Dubash and Rajan (2001), Kumar (2004), Ranganathan (2005), Katyar (2005), Dash (2006) and Sahoo (2007) on India. None however, analyses the effect of the stronger legal institutions on electricity theft or system loss. More important, all the studies except Nagayama (2010) shied away from an econometric analysis with a clear empirical strategy.
The Economics of System Loss2
The reforms considered are i. Introduction of Foreign Independent Power Providers. ii. Privatization of electricity entities. iii. Unbundling (of generation, transmission and distribution) of electricity sector. iv. Introduction of retail competition. v. Establishment of independent regulator. and vi. Introduction of wholesale electric power spot market.
2

Our paper closely resembles the tax evasion literature in spirit due to the similarity of the problem. We therefore draw parallels to the empirical literature on tax evasion here. Most empirical work within this literature emphasizes tax structures and law enforcement. To analyse the effect of law enforcement, most papers consider monitoring efforts (See, for example, Kahn, Silva and Zilliak (2001), Mishra, Subramanian and Topalova (2008) and Yang (2008a) for auditing by public agencies and Yang (2008b) for inspection by private agencies). A few papers analyse the role of verifiability of tax evasion (see Marion and Muehlegger (2008) in the context of diesel tax and Mishra, Subramanian and Topalova (2008) in the context of international trade). We however consider improvements in legal institutions through providing clearer definitions of theft, establishing more stringent punishments and smoothening legal procedures through the provision of special courts which haven’t been considered in the tax evasion literature so far.
The effect of legal institutions has been empirically investigated in the economics of crime field in varied contexts and is well established. For example, Bar-Ilan and Sacerdote (2004) show that increases in fines reduces traffic light violations. Levitt and Miles (2007) and Levitt and Miles (2008) make excellent surveys on this literature and show that increased punishment and improved law enforcement institutions decreases criminal activities. Our paper lends support to this finding.
The paper is organised as follows. Section II gives an Institutional Background, Section III discusses the data, Section IV provides some basic descriptive statistics and illustrates our results graphically, Section V presents the empirical framework, Section VI provides the empirical results and a discussion on robustness checks against potential endogeneity issues and Section VII concludes.
II. Institutional Background
India is the second largest country by population and the seventh largest country by geographical area in the world. The country is divided in to 29 states and 6 union territories. Figure 1 shows an administrative map of India with geographical locations of different states.
India started reforming its electricity sector in the 1990s. Until the mid-1990s, state level power sectors were completely governed by the State Electricity Boards (SEBs); SEBs were responsible for regulations, much of the generation and transmission and all of the distribution. In 1998, India passed the Regulatory Commission Act under which each state was required to delegate the regulatory functions to independent Electricity Regulatory Commissions (ERCs). Many states were also unbundled into three entities in line with their functionalities: Generation, Transmission and Distribution. Some states went a step further by corporatizing these entities. In addition, a number of states decentralised the distribution system by assigning different geographical regions within a state to different state-owned power corporations. The year of corporatisation and the number of entities decentralised to at different states is given in Table 1.
3BIGD Working Paper Series No. 35

4 The Economics of System Loss
Figure 1: Map of India

Table 1: Various reforms in Indian states
Adoption of the New Punishment Regime
Corporatisation of the electricity authority
5BIGD Working Paper Series No. 35
Table 1 also represents the year when each state’s Regulatory Commissions passed the new theft rule under the Electricity Act. It is important to note that each state enacted the theft rule at different years which will allow us to run the quasi-experiment. In some states, corporatisation, decentralisation and/or the new theft rule endorsement occurred in the same year.
The Electricity Act 2003 replaced the India Electricity Act 1910 set up during the British Era.The new Act has a wide variety of regulations, including on generation, transmission and distribution. It also introduces some new theft rules with a number of features that can be expected to bring greater compliance and less theft among consumers in the electricity sector.

The salient changes in the theft rule are presented in Table 2. There are at least three rules that are of interest. First, the new theft rule establishes fines for theft in line with the amount of theft committed. The previous rule had a fixed payment to be set by the power utilities and disagreements with consumers would be settled in court. Second, there are now provisions for special courts which will ensure speedy trials for theft related cases. Third, the definition of electricity now includes a wide array of specific activities. The definition under the previous Act was broad and did not include specific activities.
Table 2: Comparison of theft rules between the India Electricity Act 1910 and Electricity Act 2003
We use the system loss data published by Power Finance Corporation Limited (PFCL), the nodal agency to the Ministry of Power, India to operationalize a number of programs. PFCL published reports on the performances of power sector utilities since 2003, which compile three-year financial and other performance data of the utilities. We used the four installments that came out so far containing data between 2003-04 and 2011-12.
There are two advantages of using this dataset over the others. First, it does not contain the transmission losses. PFCL collects data from power distribution utilities of the amount of electricity that is sent as input after the electricity is transmitted to the utility. The only technical loss that the system loss data containsis the technical loss due to distribution. This data is therefore cleaner than the usual system loss data published by Central Electricity Authority of Ministry of Power, India which includes transmission loss too. Second, PFCL’s publication contains data at utility level as opposed to state level. This allows for more observation at cross-section level as some states have more than one electricity-supplying authority. The data published by Central Electricity Authority contains only state level data.
III. Data
6 The Economics of System Loss
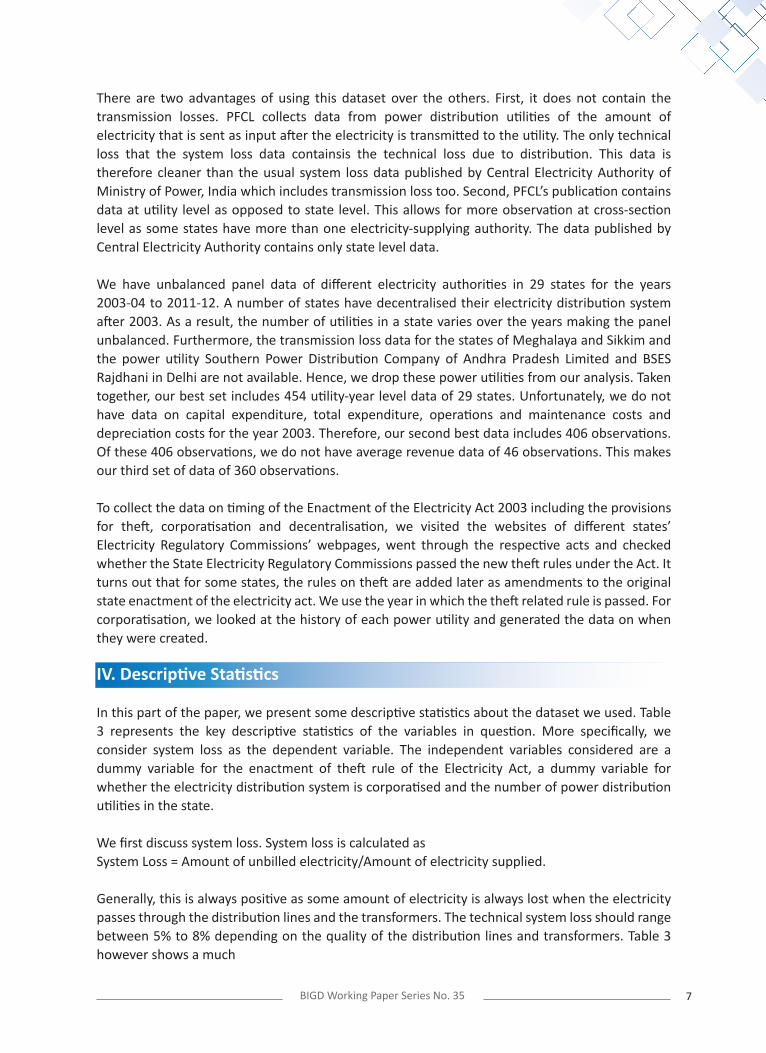
There are two advantages of using this dataset over the others. First, it does not contain the transmission losses. PFCL collects data from power distribution utilities of the amount of electricity that is sent as input after the electricity is transmitted to the utility. The only technical loss that the system loss data containsis the technical loss due to distribution. This data is therefore cleaner than the usual system loss data published by Central Electricity Authority of Ministry of Power, India which includes transmission loss too. Second, PFCL’s publication contains data at utility level as opposed to state level. This allows for more observation at cross-section level as some states have more than one electricity-supplying authority. The data published by Central Electricity Authority contains only state level data.
We have unbalanced panel data of different electricity authorities in 29 states for the years 2003-04 to 2011-12. A number of states have decentralised their electricity distribution system after 2003. As a result, the number of utilities in a state varies over the years making the panel unbalanced. Furthermore, the transmission loss data for the states of Meghalaya and Sikkim and the power utility Southern Power Distribution Company of Andhra Pradesh Limited and BSES Rajdhani in Delhi are not available. Hence, we drop these power utilities from our analysis. Taken together, our best set includes 454 utility-year level data of 29 states. Unfortunately, we do not have data on capital expenditure, total expenditure, operations and maintenance costs and depreciation costs for the year 2003. Therefore, our second best data includes 406 observations. Of these 406 observations, we do not have average revenue data of 46 observations. This makes our third set of data of 360 observations.
To collect the data on timing of the Enactment of the Electricity Act 2003 including the provisions for theft, corporatisation and decentralisation, we visited the websites of different states’ Electricity Regulatory Commissions’ webpages, went through the respective acts and checked whether the State Electricity Regulatory Commissions passed the new theft rules under the Act. It turns out that for some states, the rules on theft are added later as amendments to the original state enactment of the electricity act. We use the year in which the theft related rule is passed. For corporatisation, we looked at the history of each power utility and generated the data on when they were created.
IV. Descriptive Statistics
In this part of the paper, we present some descriptive statistics about the dataset we used. Table 3 represents the key descriptive statistics of the variables in question. More specifically, we consider system loss as the dependent variable. The independent variables considered are a dummy variable for the enactment of theft rule of the Electricity Act, a dummy variable for whether the electricity distribution system is corporatised and the number of power distribution utilities in the state.
We first discuss system loss. System loss is calculated as System Loss = Amount of unbilled electricity/Amount of electricity supplied.
Generally, this is always positive as some amount of electricity is always lost when the electricity passes through the distribution lines and the transformers. The technical system loss should range between 5% to 8% depending on the quality of the distribution lines and transformers. Table 3 however shows a much
7BIGD Working Paper Series No. 35

larger mean for system loss across the authorities in India. It turns out that this is about 28.7% with standard error 11.8%. The mean system loss with the new theft rule effective is 26%. The mean system loss without it is 34%.The national system loss is computed as a weighted average, with the weights being the amount of electricity supplied by each authority as a percentage of national electricity supply. The national system loss, computed this way, is 27.3% over all the years under study.
Table 3: Descriptive Statistics
8 The Economics of System Loss

For a deeper analysis, we also consider the electricity price measures for different consumer categories using the same formula for each consumer category. As expected, the prices varies considerably across consumer types, with agricultural users paying the least and non-domestic and commercial users paying the most.
In order to identify a price effect, we need to see whether it varies enough across time. Figure 2 depicts time trends for the price at each consumer category. It shows mostly increasing time trends for all prices except a decrease in the non-domestic price in 2009.
Figure 2: Time Trends for Electricity Price Measures for different consumer category and aggregate price
Table 3 also presents summary statistics regarding the Electricity Reforms. The percentage of utility-years that are subject to the new theft rule under the Electricity Act is 49% with standard error .501. The percentage utility-year that is corporatised is 62.5%, which is higher than the percentage of authorities subject to the Act since the corporatisation process started before the Act. The average number of utility-year in a state is 2.6 with standard error 1.56.
It is difficult to come up with one single measure for the price of electricity. It is common throughout the world, including India, to charge different electricity prices to different consumer categories. Furthermore, electricity prices typically vary in terms of peak and off peak hours, rural and urban sectors as well as levels of electricity usage at individual consumer levels. We therefore proxy average electricity price by average revenue (per kwh) for each state using the formula:
9BIGD Working Paper Series No. 35
Figure 3 depicts our primary result where we present a Lowess Smoother of different utilities’ experiences three years before and three years after enactment of the rule. Whereas system loss and all other variables are measured throughout the fiscal year, the year variable is defined as the first year of the fiscal year (Hence, the 2003-04 is considered as 2003 and so on). The Electricity In the graph, system loss is represented in the y axis and the period variable is presented in the x axis. The period variable is 0 in the year the Act is enacted. Since the Act could be passed any

Note: Treatment year is 0. The transitional effect is captured between the year -1 and 0. Since the intervention can come at any time of the year, the transitional effect is understated. Only the states having three years of pre- and post-data are considered.
10 The Economics of System Loss
month during the year the graph therefore exhibits the distribution of system loss two years before and four years (including zero) after the Act is enacted, as well as a trend line around the distribution.
The graph in Figure 3 shows that power utilities experience a slight upward trend in system loss in the two years before the Act is enacted. After the Act is passed, we see a downward trend in the system loss (starting in year 0 being the first year of the Act).
Figure 3 considers only the power utilities that experience the endorsement of the Act. As Table 1 shows, a number of states and therefore, the respective power utilities in those states, didn’t experience the change in the Act by 2008 and were omitted in Figure 3. It is possible that these power authorities may experience a similar downward trend in system loss irrespective of the Act. We can therefore look at a similar Lowess Smoother of these states over time.
Figure 3: System Loss trends with three years before and three years after the Act is enacted
Figure 4 illustrates the distribution of system loss and the time trend that is similar to Figure 3, but considers only the power utilities that didn’t experience the change in the Act. The graph shows an upward trend in system loss over time for the period under consideration.

Figure 4: Lowess Smoother for States that either enacted after 2008 or didn’t enact at all
V. The Empirical Framework
There are two factors that we consider. First, there are two sets of reform efforts: i) The enactment of the new theft rule under Electricity Act 2003 and ii) The corporatisation and decentralisation of the distribution system. Second, we look at the effect of electricity prices.
System loss and the Electricity ActIn this section, we present an econometric analysis of the effect of the Electricity Act on system loss. Whereas Figures 1 & 2 do exhibit downward trends in system loss after enactment of the Act at the power utility level, and an upward trend for all other states, it is possible that this could be the result of other reforms that are stated in the previous section. In this section, we would like to control for those major reforms, namely, Corporatisation and Decentralisation.
We estimate the effect of the Act on system loss with the following panel data regression:
Where Yijt is the system loss of utility i in state j in year t, αj represents state level time-invariant fixed effects and βt represents year fixed effects. The parameter of interest is γ, the coefficient of Ajt, which equals 1 when state j enacted the Act in year t and the years onwards. Among other factors, X1jt represents the set of electricity prices in state j in year t whereas X2jt includes the policy-related control variables, namely a dummy variable representing whether the distribution authority is corporatised and a variable representing the number of units the distribution system decentralised to. Finally, Zijt represents other potential factors in utility i in state j in year t that may influence the technical components of system loss of utility i in state j in year t. These factors are capital expenditure, operations and maintenance cost, depreciation cost and total expenditure in utility i in state j in year t. ϵijt represents unobservable components in system losses at utility-state-year level.
11BIGD Working Paper Series No. 35
12 The Economics of System Loss
VI. The Empirical Results
We consider two factors influencing the system loss. We first consider the effect of stronger legal institutions put forth by the Electricity Act 2003. We then discuss the effect of electricity prices on system loss.
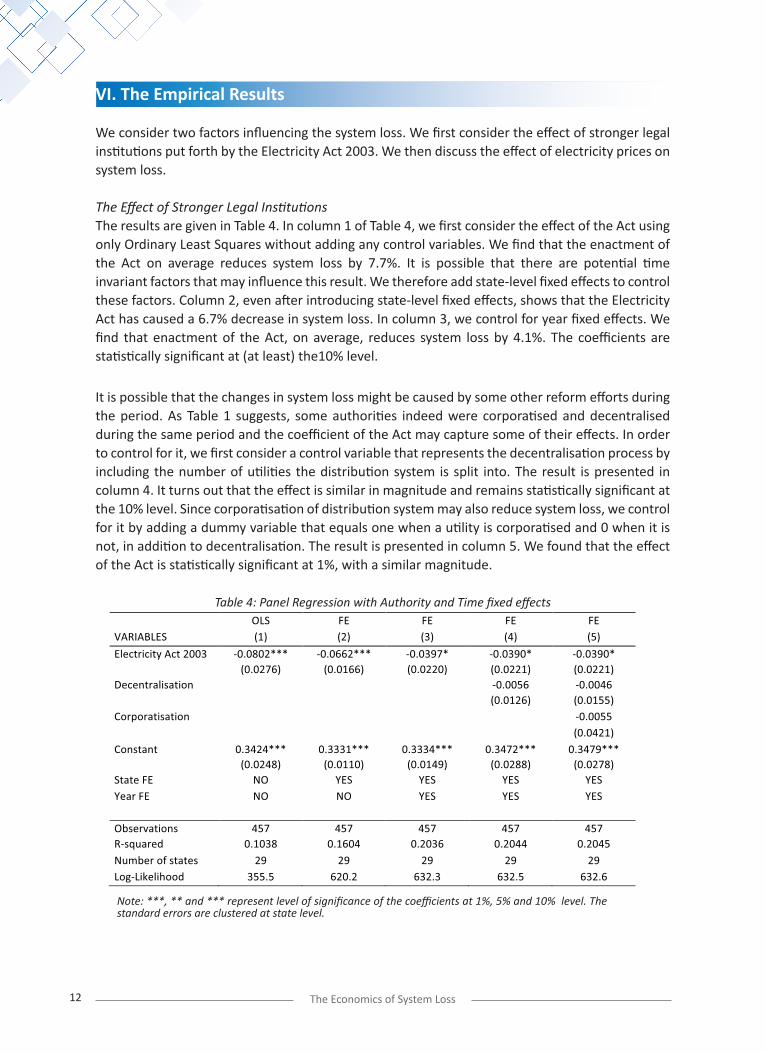
The Effect of Stronger Legal InstitutionsThe results are given in Table 4. In column 1 of Table 4, we first consider the effect of the Act using only Ordinary Least Squares without adding any control variables. We find that the enactment of the Act on average reduces system loss by 7.7%. It is possible that there are potential time invariant factors that may influence this result. We therefore add state-level fixed effects to control these factors. Column 2, even after introducing state-level fixed effects, shows that the Electricity Act has caused a 6.7% decrease in system loss. In column 3, we control for year fixed effects. We find that enactment of the Act, on average, reduces system loss by 4.1%. The coefficients are statistically significant at (at least) the10% level.
It is possible that the changes in system loss might be caused by some other reform efforts during the period. As Table 1 suggests, some authorities indeed were corporatised and decentralised during the same period and the coefficient of the Act may capture some of their effects. In order to control for it, we first consider a control variable that represents the decentralisation process by including the number of utilities the distribution system is split into. The result is presented in column 4. It turns out that the effect is similar in magnitude and remains statistically significant at the 10% level. Since corporatisation of distribution system may also reduce system loss, we control for it by adding a dummy variable that equals one when a utility is corporatised and 0 when it is not, in addition to decentralisation. The result is presented in column 5. We found that the effect of the Act is statistically significant at 1%, with a similar magnitude.
Table 4: Panel Regression with Authority and Time fixed effects
Note: ***, ** and *** represent level of significance of the coefficients at 1%, 5% and 10% level. The standard errors are clustered at state level.

In Table 4, we have not considered factors that may influence the technical system loss. It is possible that along with the institutional reforms, other investments were undertaken to reduce the technical system loss. Even though it is very difficult to reduce technical system loss significantly, the coefficients in Table 4 may capture some of it. In order to control for it, we looked at two strings of variables. First, any regular efforts to reduce the system loss should be reflected on the operations and maintenance cost as well as the depreciation cost. We therefore add it as a separate control to variable. Since larger states should have larger such costs, we additionally control for total expenditure. Second, part of such efforts should be captured in capital expenditures, especially if there are investments to reduce technical system loss. We therefore additionally control for capital expenditure. Also, note that electricity authorities with higher system loss may also have higher expenditures, since they may have to spend more on operations, maintenance and depreciation due to poor technical systems, and they may also make larger investments captured in higher capital expenditure, indicating positive relationships.
The results are presented in Table 5. As it indicates, the number of observations are fewer since, unfortunately, we do not have the 2003 data for these control variables. We therefore had to use observations since 2004. Since this may create a selection bias, we therefore rerun specification 2 of Table 4 as the benchmark specification without 2003 data and then add the control factors that may potentially affect the technical component of the system loss.
We first present the benchmark result in column 1 and we add other technical and reform factors in latter specifications. We first observe, as column 1 indicates, that after rerunning the specification 2 of Table 4 without 2003 data, there is a marginal drop in the magnitude of the effect of Electricity Act to 6.6% from 6.7%. However, the magnitude remains statistically significant at the 1% level. Now we add the technical factors as further controls, namely, the operations and maintenance costs, depreciation costs and capital expenditures of each utility as well as total expenditure to capture the size of the utility authority. The results are presented in column 2. We find that the effect is 5.5% and it is statistically significant at the 1% level.
Following Table 4, we additionally control for the decentralisation efforts and corporatisation of electricity utility authorities by adding year fixed effects. The results are presented in Tables 3, 4 and 5. We observe that the effect of the Electricity Act is around 4.2% and is statistically significant at the 5% level. The important observation here is that after adding the technical control factors, the coefficient for the Electricity Act has both gone up slightly in magnitude and also become statistically significant at a lower level (5%) than that (10%) in Table 4.
Effect of Electricity PricesFor electricity prices, we consider the average revenue per Kwh for four consumer types: domestic, non-domestic, industry and agriculture. We consider all the prices at the same time. Since prices function the same way as taxes, according to the tax evasion literature, we should observe an increase in system loss as price increases.
The results are presented in Table 6. In column 1, we consider only the prices and state-fixed effects. Contrary to our hypothesis, it turns out that the price coefficient for non-domestic users is negative and statistically significant at the 1% level, whereas the coefficient of prices for the other categories are not significant. This however could be the result of not controlling for the effect of the Electricity Act 2003.
13BIGD Working Paper Series No. 35

Typically, prices are adjusted upwards over time and, as the Electricity Act 2003 gets in to effect increasingly over time (resulting in lower system loss), the effect in column 1 may be picking up the effect of the Electricity Act. We therefore first control for time fixed effects and then additionally control for the Act. The results are presented in columns 2 and 3. We find that a 1 Rupee increase in the price for industrial users increases the system loss, with the effect ranging between 2.7% to almost 3%, and is statistically significant at the 5% level. The coefficients of other prices are however not statistically significant.
Table 5: Effect of Stronger Legal Institutions stipulated by Electricity Act 2003 while controlling for technical system loss
Note: ***, ** and *** represent level of significance of the coefficients at 1%, 5% and 10% level.The standard errors are clustered at state level. Specifications 2 – 5 has control variables Capital Expenditures, Operations and Maintenance Cost, Depreciation Cost and Total Expenditure.
It is possible that the technical component of the system loss may also be changing (say, increasing) as discussed above. We therefore control for the set of factors that might potentially influence any changes in the technical system loss, namely, capital expenditure (controlling for total expenditure), operations and maintenance costs and the cost of depreciation. The result is presented in column 4 of Table 6. The coefficient of price for industrial users goes down somewhat to 2.6%, while remaining statistically significant at the 5% level, with other prices still not statistically significant. In columns 5 and 6, we additionally control for the decentralisation and corporatisation efforts, as they might still have an impact that is captured in the industrial price. We find that controlling for decentralisation and corporatisation does not have any impact on the significance of the coefficient of industrial electricity prices, with a magnitude hovering around 2.5% - 2.6%.
The system loss seems to be excessively sensitive to prices: a 1 Rupee (.016 US$) increases system loss by at least 2.5%. This becomes slightly sensible when we consider the average price. As the descriptive statistics section shows, the average electricity price of industrial users is about 4.32 Rupees, a 1 Rupee increase implies a 23% increase in electricity price for industrial users. Given that, the price effect seems not so excessive.
14 The Economics of System Loss
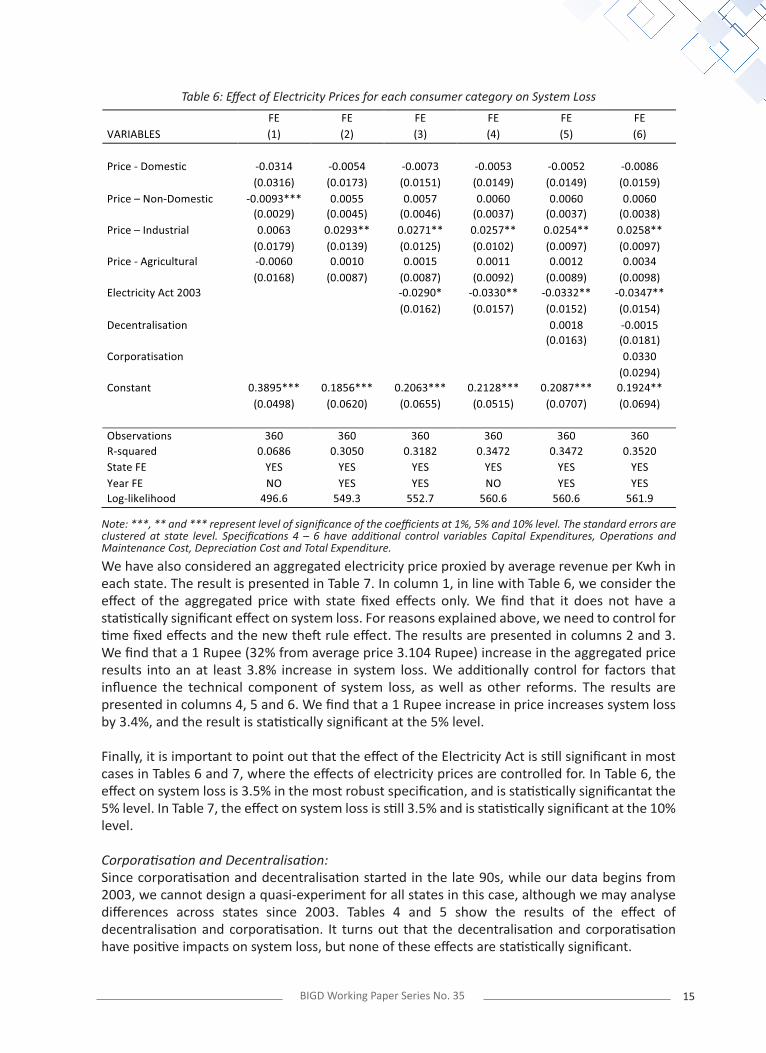
Table 6: Effect of Electricity Prices for each consumer category on System Loss
We have also considered an aggregated electricity price proxied by average revenue per Kwh in each state. The result is presented in Table 7. In column 1, in line with Table 6, we consider the effect of the aggregated price with state fixed effects only. We find that it does not have a statistically significant effect on system loss. For reasons explained above, we need to control for time fixed effects and the new theft rule effect. The results are presented in columns 2 and 3. We find that a 1 Rupee (32% from average price 3.104 Rupee) increase in the aggregated price results into an at least 3.8% increase in system loss. We additionally control for factors that influence the technical component of system loss, as well as other reforms. The results are presented in columns 4, 5 and 6. We find that a 1 Rupee increase in price increases system loss by 3.4%, and the result is statistically significant at the 5% level.
Finally, it is important to point out that the effect of the Electricity Act is still significant in most cases in Tables 6 and 7, where the effects of electricity prices are controlled for. In Table 6, the effect on system loss is 3.5% in the most robust specification, and is statistically significantat the 5% level. In Table 7, the effect on system loss is still 3.5% and is statistically significant at the 10% level.
Corporatisation and Decentralisation:Since corporatisation and decentralisation started in the late 90s, while our data begins from 2003, we cannot design a quasi-experiment for all states in this case, although we may analyse differences across states since 2003. Tables 4 and 5 show the results of the effect of decentralisation and corporatisation. It turns out that the decentralisation and corporatisation have positive impacts on system loss, but none of these effects are statistically significant.
Note: ***, ** and *** represent level of significance of the coefficients at 1%, 5% and 10% level. The standard errors are clustered at state level. Specifications 4 – 6 have additional control variables Capital Expenditures, Operations and Maintenance Cost, Depreciation Cost and Total Expenditure.
15BIGD Working Paper Series No. 35
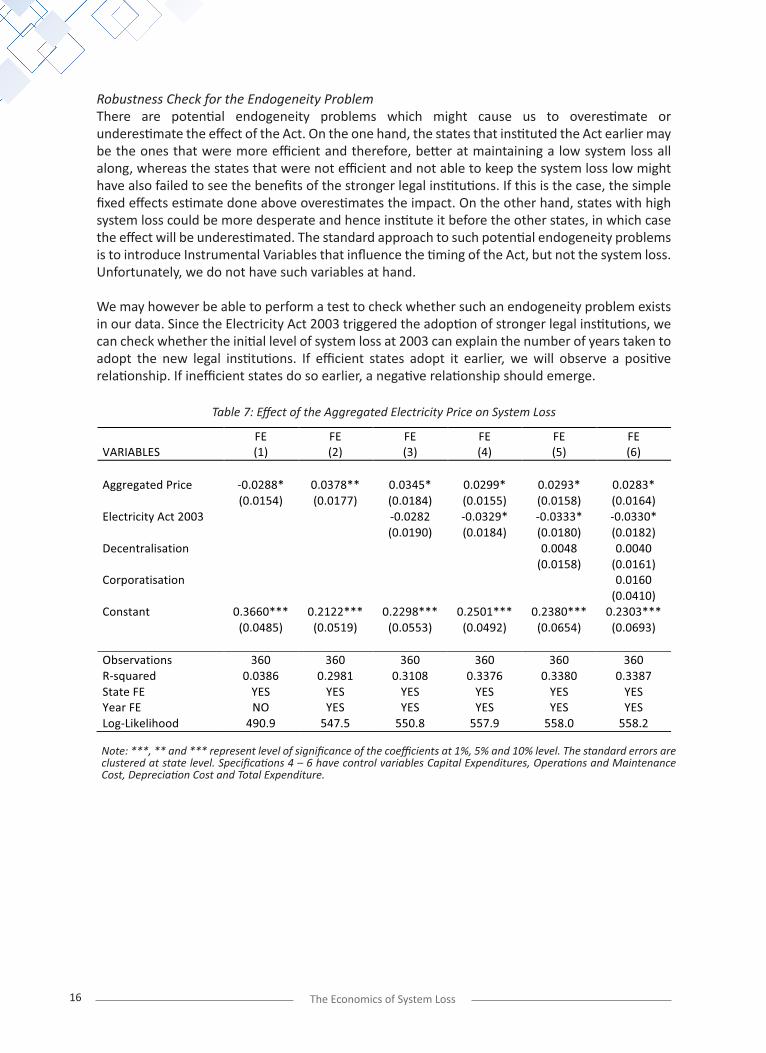
Robustness Check for the Endogeneity ProblemThere are potential endogeneity problems which might cause us to overestimate or underestimate the effect of the Act. On the one hand, the states that instituted the Act earlier may be the ones that were more efficient and therefore, better at maintaining a low system loss all along, whereas the states that were not efficient and not able to keep the system loss low might have also failed to see the benefits of the stronger legal institutions. If this is the case, the simple fixed effects estimate done above overestimates the impact. On the other hand, states with high system loss could be more desperate and hence institute it before the other states, in which case the effect will be underestimated. The standard approach to such potential endogeneity problems is to introduce Instrumental Variables that influence the timing of the Act, but not the system loss. Unfortunately, we do not have such variables at hand.
We may however be able to perform a test to check whether such an endogeneity problem exists in our data. Since the Electricity Act 2003 triggered the adoption of stronger legal institutions, we can check whether the initial level of system loss at 2003 can explain the number of years taken to adopt the new legal institutions. If efficient states adopt it earlier, we will observe a positive relationship. If inefficient states do so earlier, a negative relationship should emerge.
Table 7: Effect of the Aggregated Electricity Price on System Loss
Note: ***, ** and *** represent level of significance of the coefficients at 1%, 5% and 10% level. The standard errors are clustered at state level. Specifications 4 – 6 have control variables Capital Expenditures, Operations and Maintenance Cost, Depreciation Cost and Total Expenditure.
16 The Economics of System Loss

Table 8: Testing whether initial system loss affect number of years to adopt the new legal institution
More specifically, we regressed the initial system loss levels of 2003 on the number of years taken to adopt the legal institutions. The results are presented in Table 8. In column 1, we apply simple OLS and find that the coefficient is not statistically significant. In column 2, we use cluster-robust standard errors which increase the standard errors and reduce the p-value. Finally, since the number of years is a count data, we apply a negative binomial method. We still find initial system loss to be not statistically significant. This therefore provides suggestive evidence that an endogeneity problem might not be present in our data.
In addition, we also conducted a placebo test. The placebo test considers the same treatment years as the original Act except the treatment year 2007 on the original Act is replaced by 2006. The results are presented in table 9. It turns out that the placebo treatment is not statistically significant in most specifications.
Note: ***, ** and *** represent level of significance of the coefficients at 1%, 5% and 10% level. The standard errors are clustered at state level. Specifications 2 – 3 and 5 – 6 control for amount of electricity supplied and Percentage of bills that are collected by the corresponding utility. Specifications 3 and 6 in addition control for decentralisation (number of electricity supplying utilities in the state) and whether a utility is corporatised or not.
17BIGD Working Paper Series No. 35

Table 9: Placebo Test for Electricity Act
Note: ***, ** and *** represent level of significance of the coefficients at 1%, 5% and 10% level. The standard errors are clustered at state level. The Placebo Act has same treatment years at the original Act except the treatment year 2007 on the original Act is replaced by 2006. Specifications 1, 2, 3 and 4 are the exact same specification as that of the last specification of table 5, 6, 7 and 8 respectively except the Electricity Act dummy is replaced by the placebo dummy. Hence, Specifications 2, 3 and 4 have control variables Capital Expenditures, Operations and Maintenance Cost, Depreciation Cost and Total Expenditure.
18 The Economics of System Loss
VII. Conclusion
In this paper, we analysed the effect of India’s Electricity Act 2003 on system loss. We argued that a significant proportion of electricity is lost due to electricity theft, which is reflected in higher than expected system loss. India’s recent Electricity Act introduced new theft rules that include stricter punishments, provisions for speedier-trials through special courts and clearer definitions for theft. We expect that all these should cause lower electricity theft, which in turn should be reflected in lower system loss. We found that there is indeed a steady downward trend in system loss after the enactment of the bill. This result is robust to utility level fixed effects and year fixed effects. Our result suggests that it is extremely important to ensure strong legal institutions to combat illegal behavior and corruption.We have also looked at the effect of electricity prices on electricity theft. We have found that increases in the price increases system loss, suggesting that the price increase resulted in greater electricity theft. This finding is consistent with the tax evasion literature where increasing taxes results in greater tax evasion.
Bibliography
Alam et al, Power sector reform in Bangladesh: Electricity distribution system, Energy, Volume 29, Issue 11, September 2004, pp 1773-1783.
Bar-Ilan, Avner and Bruce Sacerdote, 2004. The Response of Criminals and Non-criminals to Fines. Journal of Law and Economics. Vol. 47(2), pages 1 – 17.
Bikash Chandra Dash, 2006. Governance of Power Sector. Economic and Political Weekly. VOL 41 No. 03.
Di-Tella, Rafael and Ernesto Schargrodsky. 2003. The Role of Wages and Auditing during a Crackdown on Corruption in the City of Buenos Aires. Journal of Law & Economics, vol. 46(1), pp 269-92.
Fisman, Raymond and Shang-Jin Wei, 2004. Tax Rate and Tax Evasion: Evidence from “Missing Imports” from China.Journal of Political Economy. Vol 112, No 2, pp 471 – 496.
Fisman, Raymond and Edward Miguel, 2007. Corruption, Norms and Legal Enforcement: Evidence from Diplomatic Parking Tickets. Journal of Political Economy. Vol 115, No 6, pp 1012 – 1048.
Kahn, Charles M, Emilson C. D. Silva and James P. Zilliak. 2001. Performance Based Wages in Tax Collection: The Brazilian Tax Collection Reform and Its Effects. Economic Journal. Volume 111, Issue 468, pp 188 – 205.
Katyar, Sudhir Kumar. 2005. Political Economy of electricity Theft in Rural Areas: A case Study from Rajsthan. Economic and Political Weekly, Vol. 40, No 7, pp 644 – 648.
Kumar, Surinder, 2004. Electricity Theft: Empowering People and Reforming Power Sector. Institute for Development and Communication. Manohar Publishers & Distributors. New Delhi, India.
Levitt, Steven D. and Thomas J. Miles, 2007. Empirical Study of Criminal Punishment. The Handbook of Law and Economics, Vol. 1. Eds. Mitchell Polinsky and Steven Shavell. Elsevier.
Levitt, Steven D. and Thomas J. Miles, 2008. Economic Analyses of Deterrence (Empirical). The New Palgrave Dictionary of Economics. Second Edition. Eds. Steven N. Durlauf and Lawrence E. Blume. Palgrave Macmillan.
Mishra,Prachi, Arvind Subramanian and PetiaTopalova. 2008. Policies, Enforcement and Customs Evasion: Evidence from India. Journal of Public Economics. Vol 92, pp 1907 – 1925.
Marion, Justin and Erich Muehlegger, 2008. Measuring Illegal Activity and the effects of Regulatory Innovation: Tax Evasion and the Dyeing of Untaxed Diesel. Journal of Political Economy. Vol 116, No 6, pp 633 – 666.
19BIGD Working Paper Series No. 35

Olken, Benjamin. 2007. “Monitoring Corruption: Evidence from a Field Experiment in Indonesia.”,Journal of Political Economy, 115(2): 200 – 249.
Power Finance Corporation Limited. Report on the Performance of State Power Utilities for the years 2003-04 to 2005-06.
Power Finance Corporation Limited. Report on the Performance of State Power Utilities for the years 2006-07 to 2008-09.
Ranganathan, V. 2005. Determining T&D Losses in India: Their Impact on Distribution Privatisation and Regulation. Economic and Political Weekly.Vol. 40, No. 7, pp. 657-668.
Rudnick, Hugh V. and Ricardo B. Raineri. Chilean Distribution Tariffs: Incentive Regulation. In Rafael Charun, Felipe Morande and Ricardo Raineri edited (De)Regulation and Competition: the Electric Industry in Chile. Georgetown University Press, 1997, Washington DC.
Sahoo, Niranjan, 2007. The Politics of Power Sector Reform in India. Observer Research Foundation. Pentagon Press, New Delhi, India.
Smith, Thomas B., 2004. Electricity theft: A Comparative Analysis. Energy Policy. Vol. 32: pp 2067 – 2076.
Different States’ Electricity Regulatory Commissions Websites.
Wamukonya, Njeri, 2003. Power Sector Reform in Developing Countries: Mismatched Agendas. Energy Policy. Vol. 31: pp 1273 – 1289.
Nagayama, Hiroaki, 2010. Impacts on Investments and Transmission/Distribution Loss through Power Sector Reforms. Energy Policy. Vol. 38: pp 3453 – 3467.
Yang, Dean, 2008a. Integrity for Hire: An Analysis of Widespread Customs Reform. Journal of Law and Economics, Vol. 51, No. 1, pp 25 – 57.
Yang, Dean, 2008b. Can Enforcement Backfire? Crime Displacement in the Context of Customs Reform in Philippines. Review of Economics and Statistics. Vol. 90, No 1, pp 1 – 14.
20 The Economics of System Loss

BRAC Institute of Governance and Development (BIGD)BRAC UniversitySK Centre (Basement, 3rd - 7th & 9th Floor), GP, JA-4, TB Gate Mohakhali, Dhaka 1212, Bangladesh
facebook.com/BIGDBRACUniversity twitter.com/BIGD_BRACU BIGD, BRAC Universityhttp://bigd.bracu.ac.bd
BRAC Institute of Governance and Development (BIGD), BRAC University is a centre of policy and academic excellence. BIGD is devoted to research on a range of governance and development concerns, as well as the nexus between the two. BIGD’s research is aimed at contributing to public policy as well as supporting its academic and training programs. It does not limit knowledge creation to being an end itself but rather to advance the pursuit of a just and prosperous society. It also plays an advocacy role to give voice to contemporary governance, political and economic issues. As an institute of BRAC University, BIGD works closely with the university motivated by its motto: ‘inspiring excellence’. BIGD also has the unique advantage of being associated with BRAC, the world’s largest NGO through its work. It is inspired by BRAC’s values in shaping its institutional work and professional standards.