The economics of Rumpelstiltskin - HFFAhffa.info/files/speculationandprices.pdf · The economics of...
21
1 The economics of Rumpelstiltskin Why speculation is not a prime cause of high and volatile international agricultural commodity prices: An economic analysis of the 2007-08 price spike. Harald von Witzke and Steffen Noleppa Abstract: The two international agricultural commodity price spikes since the turn of the millennium have triggered a controversial public debate about the role speculators play in generating these price spikes. In this paper, we analyze the determinants of the 2007-08 price spike and quantify the impact of a number of supply and demand side variables on monthly prices of wheat, corn and soybeans. The results of our analysis suggest that the price spike of 2007-08 can largely be explained by changes in supply and demand determining variables, leaving little room for unexplained price changes that might be attributed to speculation. The by far most important variables which contributed to the price spike of 2007-08 are the price of oil and transportation cost as measured by the freight rates. Other variables with significant impact on the price spike were the US Dollar exchange rate and export restrictions imposed by some countries in wheat. The growth in bioenergy production during this period had only a negligible effect on the price of wheat and a somewhat more pronounced effect on the corn and soybean market. Production shortfalls in some parts of the world contributed to the price spike in soybeans. However, significant production growth in wheat and corn acted to reduce the price spikes in these markets.
Transcript of The economics of Rumpelstiltskin - HFFAhffa.info/files/speculationandprices.pdf · The economics of...
1
The economics of Rumpelstiltskin
Why speculation is not a prime cause of high and volatile international
agricultural commodity prices: An economic analysis of
the 2007-08 price spike.
Harald von Witzke and Steffen Noleppa
Abstract:
The two international agricultural commodity price spikes since the turn of the millennium
have triggered a controversial public debate about the role speculators play in generating these
price spikes. In this paper, we analyze the determinants of the 2007-08 price spike and
quantify the impact of a number of supply and demand side variables on monthly prices of
wheat, corn and soybeans. The results of our analysis suggest that the price spike of 2007-08
can largely be explained by changes in supply and demand determining variables, leaving
little room for unexplained price changes that might be attributed to speculation.
The by far most important variables which contributed to the price spike of 2007-08 are the
price of oil and transportation cost as measured by the freight rates. Other variables with
significant impact on the price spike were the US Dollar exchange rate and export restrictions
imposed by some countries in wheat. The growth in bioenergy production during this period
had only a negligible effect on the price of wheat and a somewhat more pronounced effect on
the corn and soybean market. Production shortfalls in some parts of the world contributed to
the price spike in soybeans. However, significant production growth in wheat and corn acted
to reduce the price spikes in these markets.

2
1. Introduction
International agricultural commodity markets are in the process of undergoing fundamental
changes. The more than a century old trend of declining agricultural commodity prices has
come to an end. The turn of the millennium also marks a mega-trend reversal in international
agricultural markets. Since the turn of the millennium agricultural commodity prices have
tended to increase – albeit with large fluctuations as in the past. Economic analyses suggest
that real agricultural commodity prices will be much higher in the future than in the past (e. g.
von Witzke et al., 2008; 2009; OECD-FAO, 2008; USDA, 2006; 2011).
At the same time it is argued that agricultural price volatility in international markets have
increased. While the prices of many agricultural commodities were at or near record lows
around the turn of the millennium, prices began to rise significantly in 2007-08. In 2009,
prices went down to low levels again, only to start yet another rally in 2010 which has lasted
until now (Fall 2011). Some of the variables which have dominated the public debate about
the causes of the recent price spikes include the growth in bioenergy production, climate
change, as well as energy price and policy. Another main cause for an overall higher price
level and high price volatility, pointed out in the media and by all too many policy makers has
been speculators. In fact, it has been argued by some that national or international market
regulation is the way to go in order to avoid high and volatile international agricultural
commodity prices.
In this paper, we will analyze the determinants of the 2007-08 international agricultural price
spike and quantify the effects of supply- and demand-side variables on observed commodity
prices. In the remainder of this paper, we will, first, take a look at agricultural commodity
markets and how they have performed over time in order to determine if price volatility has
increased. Second, we will discuss the potential contribution of demand- and supply-side
variables to the price spike in 2007-08. Third, we will debate the role of speculation may or
may not have played in explaining these price peaks. Finally, we will quantify the impact of
the variables discussed here to explaining the price spikes. In particular, we will demonstrate
that speculation has had a very limited effect. Much like Rumpelstiltskin falsely believed that
the miller’s daughter could turn straw into gold in the Grimm brothers’ fairytale, policy
makers are not likely to successfully outsmart the fundamental market forces of supply and
demand through government regulation. In fact, we will demonstrate that it actually has been
policy decisions that have significantly contributed to the price spike of 2007-08.

3
2. Agricultural price fluctuations: The evidence
Time-series of prices observed in the real world reflect a combination of short-, mid-, and
long-run variations in supply and/or demand determining variables. More specifically, there
may be short-term random shocks such as detrimental weather, animal or plant diseases or
macroeconomic shocks. In addition, many agricultural commodity markets display
characteristic seasonal price variation (e. g. Petersen and Tomek, 2005; Roach, 2010). Mid-
run price fluctuations may be the result of changes in the expectations about market
performance coupled with lagged adjustments of market participants to market changes. The
classical example in this regard is the hog-cycle (Hanau, 1928; Haas and Ezekiel, 1926).
Long-term variables affect prices over the long haul. One example is the Agricultural
Treadmill which characterized world agriculture from around 1870 to the turn of the
millennium. That was the time during which world agriculture produced ever more food for
ever more humans at ever declining prices.
One characteristic of agricultural commodity prices is that they may be correlated across
crops (e. g. Tangermann, 2011). The reason for this is that crops may be substitutes in
production as they compete for the same acreage and/or that they may also be substitutes in
consumption.
Agricultural commodity prices tend to be rather volatile for a number of reasons. First,
production depends on whether, plant and animal diseases. Second, both supply and demand
are inelastic with regard to the price – at least in the short-run. Third, supply reaction to
changing prices may take up to one vegetation period – and sometimes even longer.
This is true if there is little storage available or if storage cost is high. Many commodities,
including grains and oilseeds can be stored for at least a year at moderate cost. As long as
there is enough storage space available, the effects of short-term fluctuations in supply or
demand on prices are cushioned through increasing or declining stocks (e. g. Abbott et al.,
2009; Balcomb, 2009; FAO, 2009; OECD, 2008; Williams and Wright, 1991).
As Wright (2011) correctly noted, price fluctuations on agricultural commodity markets are
characterized by a remarkable asymmetry. There are limited fluctuations around the long-term
price trend with occasional sharp spikes, but no steep troughs. This is exemplified for wheat
in Figure 1.

4
Figure 1: Price of wheat, 1950-2010 (US$ per bushel; deflated by US CPI)
Source: USDA; quoted in Wright (2011).
Figure 2: Storage and price response to supply shocks
Source: Adapted from Wright (2011)
Wright (2011) has proposed a straightforward explanation for this phenomenon which can be
nicely illustrated graphically for a storable commodity (Figure 2). The market demand (Dm)
is the horizontal sum of two components; namely, the demand for current consumption (Dc)
and the demand for storage (Ds = Dm – Dc). The current demand is fairly inelastic while the
demand for storage is elastic. As long as stocks are sufficiently large, shifts in supply (e. g.
P Dc
Dm
S4 S3 S2
S1
Q
5
from S1 to S2) do not have a major impact on price (P). However, when stocks are low, a
decline in production would have a significant impact on price (such as a shift from S3 to S4.
This tends to happen when stocks approach the minimum levels necessary for a smooth and
efficient operation of the value chain.
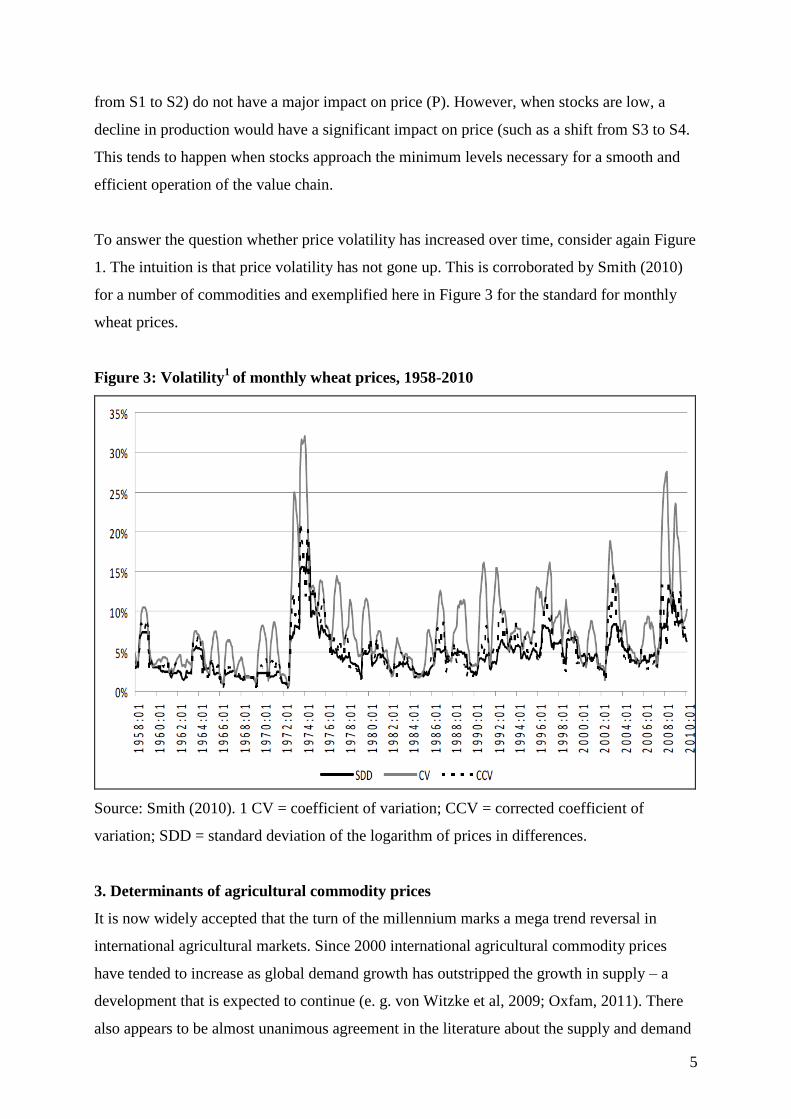
To answer the question whether price volatility has increased over time, consider again Figure
1. The intuition is that price volatility has not gone up. This is corroborated by Smith (2010)
for a number of commodities and exemplified here in Figure 3 for the standard for monthly
wheat prices.
Figure 3: Volatility1
of monthly wheat prices, 1958-2010
Source: Smith (2010). 1 CV = coefficient of variation; CCV = corrected coefficient of
variation; SDD = standard deviation of the logarithm of prices in differences.
3. Determinants of agricultural commodity prices
It is now widely accepted that the turn of the millennium marks a mega trend reversal in
international agricultural markets. Since 2000 international agricultural commodity prices
have tended to increase as global demand growth has outstripped the growth in supply – a
development that is expected to continue (e. g. von Witzke et al, 2009; Oxfam, 2011). There
also appears to be almost unanimous agreement in the literature about the supply and demand

6
determining variables which matter. However, there continues to be considerable
disagreement about the quantitative impacts these variables may have had on the two price
spikes of the new millennium.
3.1 Demand side determinants
3.1.1 Population growth
In the long-run, demand is expected to continue to grow at a rapid pace for two reasons. One
reason is a continued rapid population growth in developing and newly industrializing
countries. Most recent population projections suggest that a scenario of 10 billion humans by
2050 may be as likely as one of 9 billion (United Nations, 2011). However, these are long-
term changes and do not have any major impact on short- and mid-run changes in the global
demand for food and agriculture.
3.1.2 Economic growth
Another reason is economic growth, as it affects the consumption of food. The long-term
economic growth in developing and newly industrializing countries is generally considered a
major driving force in the global demand for food and agricultural non-food commodities.
This follows immediately from Engel’s Law, which stipulates that the income elasticity of
demand is fairly high at low income levels and that it declines with increasing per capita
income. Hence, economic growth will increase food consumption more in low income than in
high income countries. The same is true for short-term fluctuations in economic activities. A
global economic downturn, such as the one triggered by the US housing crisis in 2009
potentially could have affected significantly the demand for food. The decline in consumption
would have been more pronounced in poor than in rich countries. However, the global
economic crisis of 2009 affected the rich countries more than the poor countries.
An economic downturn would have contributed to lower rather than higher prices. Therefore,
economic growth is not likely to have contributed significantly to the price spike.
3.1.3 Bioenergy production
The rapid growth of bioenergy production is frequently considered to be a major cause of the
recent price spikes in international commodity markets (e.g. Tyner et al., 2009; FAO, 2009;
Carter et al., 2008; Mitchell, 2008; Hochman, 2008; OECD, 2008). The argument is that the
production of bioenergy crops diverts land and other resources away from food production,

7
thus reducing the quantity of food crops and causing higher food prices. This argument holds
in principle; however, it applies equally to all non-food crops grown on land that could
potentially be used for the production of food crops such as cotton, rubber, flowers or
ornamental plants.
In 2007, three countries produced about 85 percent of all bioenergy (USA: 43 percent; Brazil:
27 percent; European Union: 15 percent; (Coyle, 2007)). As Figure 4 shows, this has not
changed much since then. In the 2006-08 period, the USA, Brazil and the EU accounted for
about 80 percent of global bioethanol production while the EU, the USA, Argentina and
Brazil produced 80 percent of all biodiesel.
Figure 4: Global production of biofuels (million liters; 2008-2010 average).
4.1 Bioethanol
Country Production (percent)
USA 46.8
EU-27 6.2
Brazil 25.1
Rest of the world 21.9
World total 100.0
4.2 Biodiesel
Country Production (percent)
USA 9.4
EU-27 52.2
Brazil 8.8
Argentina 9.0
Rest of the world 21.6
World total 100.0
Source: Adapted from OECD- FAO (2011)
In the past ten years, the production of bioenergy crops has expanded by about two percent of
the world’s cropland. This suggests that the effect of bioenergy on the overall level of
agricultural commodities has been limited. Von Witzke (2011) estimates that the growth in
bioengergy production has contributed to an overall price increase of about 7 per cent since

8
the turn of the millennium, all other things being equal. As the growth in bioenergy
production has been fairly continuous, it is not likely that bioenergy has contributed much to
the commodity price spike. This conclusion is shared by other authors as well (e. g. Baffes
and Haniotis, 2010)
3.1.4 Food safety and food scares
Food safety concerns can significantly affect short-term demand for affected food items as
well, as happened during the BSE crisis in Europe around the turn of the millennium. Other
examples include the elevated dioxin content of eggs and EHEC contamination in organically
produced sprouts in Germany in 2011. Much like in the case of the global economic downturn
of 2009, food safety scares tend to have only moderate and more short-term effects on
demand. In essence, they may contribute to price reductions rather than higher prices.
3.2. Supply side determinants
For the next few decades the growth in supply in global food and agriculture is not likely to
keep pace with the growth in demand. There are a number of variables which matter in this
regard. They are discussed below.
3.2.1 Weather and climate change
Agricultural commodity markets are sometimes also referred to as weather markets, as
weather tends to fluctuate considerably over time. Favourable weather in major growing
regions may result in a bumper crop, while bad weather has the opposite effect. Plant diseases
or pathogens may amplify decline in yields caused by detrimental weather conditions. As
discussed above, high or low yields tend to have an impact on short-term price fluctuations.
The effect of fluctuations in yields may be limited when there are ample stocks around the
globe. However, the price reaction to low production may be high when global stocks are low.
In seven of the eight years preceding the price hike of 2007-08 global consumption had
exceeded production. Global stocks were down. In fact, global stocks were near or below the
levels of the price spike of the 1970s (e. g. Tangermann, 2011). Prices did not respond to this
by much until droughts in Australia, Russia, Ukraine, and other South East European
countries led to poor grain crops there (e. g. Trostle, 2008; OECD-FAO, 2008). In addition,
flooding in Burma reduced rice production (USDA/FAS, 2008). Therefore, one might

9
reasonably expect that detrimental weather conditions together with low global stocks may
have had a significant impact on the price peak in 2007-08.
However, the empirical evidence does not support this view for grains and oilseeds (Figure 5).
In 2006/07 global grain production (without rice) was only a fraction of one percent below the
2005/06 level. In 2007/08 global production was close to the historic high of 2004/05.
Likewise, world rice production went up from 642 million metric tons in 2006 to 650 million
metric tons in 2007 and 661 million metric tons in 2008 (IRRI, 2011). In oilseeds, production
exceeded historic levels in 2006/07 and then declined by only about four percent to return to
the pre-spike production level in 2007/08 and 2008/09. Therefore, low crop yields in some
parts of the world are not likely to have contributed much to the price spike in 2007-08. To
the contrary, in grains, including rice, record high world production has actually helped to
reduce the price increase.
Figure 5: Global grain and oilseed production 2000/01 – 2009/10 (million mt)
Crop year Grains1 Oilseeds
2000/01 1842 317
2001/02 1876 327
2002/03 1821 332
2003/04 1862 338
2004/05 2046 383
2005/06 2019 394
2006/07 2005 408
2007/08 2121 392
2008/09 2241 396
2009/102 2228 441
Source: Toepfer International, Marktbericht, var. vols.
1 Including milled rice;
2 Preliminary.
3.2.2 Increasing scarcity of agricultural land and water
There appears to be widespread consensus in the literature that the availability of land suitable
for farming acts to constrain the growth in global supply. The most productive land is being
farmed already. In many parts of the world there are no major land reserves remaining that
could be used for farming. Where such reserves exist, they often consist of ecologically

10
sensitive areas such as tropical rainforests or prairies which either are protected or should not
be used for farming for environmental reasons. Existing estimates of potential agricultural
land expansion are in the range of about 0.2 to 0.5 percent annually (von Witzke, 2008; FAO,
2008; Hofreither, 2005; IFPRI, 2005). In the past 50 years, 80 percent of global production
growth was the result of productivity growth and only 20 percent were accounted for by
expanding the acreage. In the future the world must rely even more on productivity growth
(von Witzke, 2010).
Another aspect is that the land that will go into production with continued high agricultural
commodity prices will tend to be less productive than the land that was farmed already when
prices were low, such as around the turn of the millennium. It is, therefore, reasonable to
expect that land will increasingly become a constraint to expanding agricultural production in
the longer term. However, this is a rather continuous process and is not likely to have had
much of an impact on the price spike of 2007-08.
The argument with regard to water is analogous. Only about 2.5 percent of all water is not
salty. About two thirds of that is locked up in the polar caps and in glaciers. Agriculture
presently draws about 70 percent of all fresh water annually (United Nations, 2006). Global
production has to double in the first half of the 21st century. Therefore, water is increasingly
becoming a constraint to expanding agricultural production. However, this is not an
explanation of short term price increases. Rather water scarcity contributes to a long term
slow-down of production growth. Therefore, its contribution to the 2007-08 agricultural
commodity price spike is very limited.
3.2.3 The price of energy
Agriculture is a fairly energy intensive industry. Energy is needed for many purposes such as
to fuel agricultural machinery, to dry grain or in the production of inputs such as nitrogen
fertilizer. Therefore, it is commonly presumed that the price of energy has some impact on the
prices of agricultural commodities (e. g. Heady and Fan 2010; Abbott et al, 2009; Foresight,
2008). Baffes (2007) eatimates that the pass-through of the oil price into the prices of
agricultural commodities is 17 percent while Mitchell (2008) suggests that this number is in
the range of 15 to 20 percent.

11
Von Witzke et al. (2009) have demonstrated that the price of energy has become one of the
most important supply-side determinants of agricultural commodity prices. And, indeed, the
period of high commodity prices in 2007-08 coincided with high energy prices. In the first
three months of 2007 the price of oil averaged slightly below $ 60 per barrel. The price went
up fairly steadily and peaked at more than $ 130 per barrel in July 2008. Subsequently, the
price of oil declined and hovered in the range of $ 40 to 75 until it started to go up again
towards the end of 2010. In March 2011, the price of oil again surpassed the $ 100 mark
(Appendix 2). Therefore, the price of energy most likely has had a significant impact on the
most recent price peaks. The fact that the price of energy has become a major determinant of
international agricultural commodity prices acts to amplify agricultural commodity price
volatility, as the price of energy tends to be rather volatile.
3.2.4 Freight rates and global economic activities
A significant portion of grains, oilseeds and other commodities is traded internationally. For
instance, in corn the portion in total production that is traded internationally was around 61
percent in 2010 (e. g. Toepfer International, 2008). This implies that the cost of transportation
affects the price of agricultural commodities (e. g. Kilian, 2009). A commonly used proxy for
the transportation cost is the freight rate. Two variables that have a major impact on freight
rates are the price of energy and the availability of shipping space. Indeed, the increase in
freight rates coincided with the price peak in 2007-08 (Appendix, table y). Thus, the cost of
transportation likely contributed to the price spike as well.
3.2.5 Exchange rates and inflation
Goods traded internationally are usually denominated in US$. This is true for agricultural
commodities as well. Therefore, the US$ exchange rate may be expected to have an impact on
the international prices of agricultural commodities as well (Gilbert, 2008; Awokuse, 2005;
Schuh, 1974). Tyner et al. (2008) and Abbott et al. (2009) argue that the US$ exchange rate
has been one of the main drivers of international agricultural commodity prices. FAO (2009)
notes, that a portion of the price increase observed in international markets was due to the
depreciation of the US$. Therefore, it may be expected that the US$ exchange rate; i. e., the
depreciation of the US$ in 2007-08 has contributed to the price spike.
Agricultural commodities may be used as a store of value. Therefore the demand for such
inflation shelters increases with increasing (expected) inflation (e. g. Attie and Roache, 2009;

12
Roache, 2010). Exchange rates, in turn, are affected by inflation rate differences. FAO (2009),
therefore, argues that inflationary tendencies may have contributed to the price spike in 2007-
08.
3.2.6 Speculation
The debate about market price bubbles has a long history in economics. It includes events
from the Dutch tulipmania in the 17th
century (Thompson, 2007) to the US agricultural land
price spike and subsequent debt crisis in the 1980s (Harl, 1990) or the recent collapse of
housing market in the US.
Speculators are sometimes considered to contribute to international agricultural price
volatility as well. Speculators are active in futures markets. What is actually exchanged on
futures markets are expectations. When new information becomes available, expectations may
change and result in transactions in futures markets. The relationship with spot markets where
commodities are actually traded is rudimentary.
Speculators want to make money. They can make money only when they anticipate future
prices correctly. If they don’t, they lose money and are quickly driven out of the market.
Professional speculators with detailed market knowledge will collectively tend to anticipate
future prices correctly. Therefore, professional speculators are important for the markets’
price finding mechanism. Their market transactions should, in fact, reduce market price
distortions caused by less informed market participants.
Another aspect is that futures markets also serve as insurance against short-term price
volatility for all market participants in food and agriculture. They can serve that function only
if there are speculators who are willing to carry that risk.
Yet another aspect is that at present the real interest rate is very low. Institutional investors are
said to have discovered the agricultural commodities futures for a lack of alternative
investment opportunities. When large investment funds go in or out of the relatively narrow
agricultural futures markets, they can certainly affect day to day fluctuations. For the reasons
mentioned above, the market mechanism will quickly respond to such technical reactions.
Therefore, it is unlikely that speculation has contributed much to the period of high prices in
2007-08. This is also supported by empirical evidence (Gilbert, 2010).

13
The view that price volatility is all about supply and demand and not caused by speculation is
shared by Wright (2011) and Tangermann (2011). “The recent history of grain markets
supports two conclusions. First, the price spikes of 2008 and more recently are not as unusual
as many discussions imply. Second, the balance between consumption, available supply, and
stocks seems to be as relevant for our understanding of these markets as it was decades ago”
(Wright, 2011). “Logic and common sense, then, suggest that it is unlikely that index funds,
and other financial investors have had much influence on prices prevailing on futures
exchanges for agricultural commodities” (Tangermann, 2011).
3.2.7 Trade restrictions
It is now well understood that insulating domestic prices from international price fluctuations
acts to amplify international price volatility (e. g. Crain and Lee, 1996). While politicians
have been quick to point their fingers at speculators when prices were high in 2007-08, it has
actually been political decisions which have reduced the availability of commodities in
international markets further when prices began to rise. China, India, Argentina, Russia,
Ukraine and other countries restricted the export of agricultural commodities in 2007-08. This
was done in an attempt to protect domestic consumers from the price increase. However, the
reduced exports contributed to even higher international prices and they deprived domestic
producers of the opportunity to respond to the high international prices with increasing
production. Figure 6 exemplifies this for wheat.
Figure 6: Quarterly exports of wheat from selected countries, 2006-2009
Source: Jones and Wiecinski (2010).
14
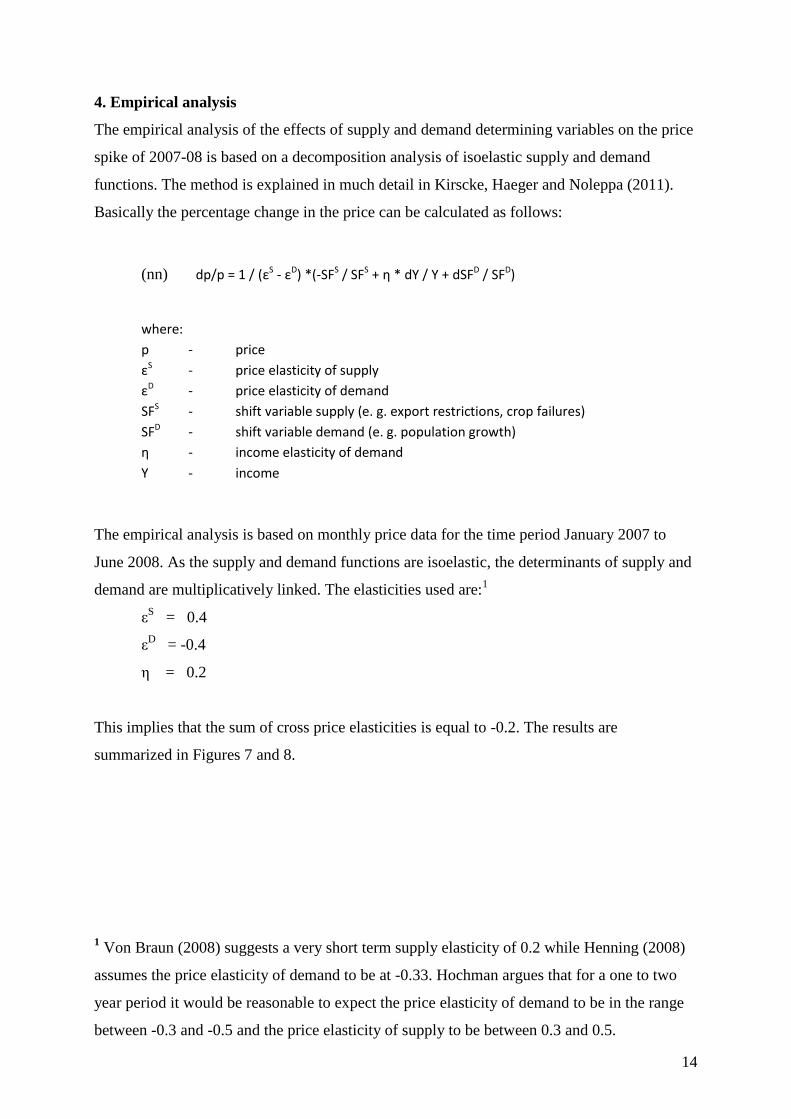
4. Empirical analysis
The empirical analysis of the effects of supply and demand determining variables on the price
spike of 2007-08 is based on a decomposition analysis of isoelastic supply and demand
functions. The method is explained in much detail in Kirscke, Haeger and Noleppa (2011).
Basically the percentage change in the price can be calculated as follows:
(nn) dp/p = 1 / (εS - εD) *(-SFS / SFS + η * dY / Y + dSFD / SFD)
where:
p - price
εS - price elasticity of supply
εD - price elasticity of demand
SFS - shift variable supply (e. g. export restrictions, crop failures)
SFD - shift variable demand (e. g. population growth)
η - income elasticity of demand
Y - income
The empirical analysis is based on monthly price data for the time period January 2007 to
June 2008. As the supply and demand functions are isoelastic, the determinants of supply and
demand are multiplicatively linked. The elasticities used are:1
εS
= 0.4
εD = -0.4
η = 0.2
This implies that the sum of cross price elasticities is equal to -0.2. The results are
summarized in Figures 7 and 8.
1 Von Braun (2008) suggests a very short term supply elasticity of 0.2 while Henning (2008)
assumes the price elasticity of demand to be at -0.33. Hochman argues that for a one to two
year period it would be reasonable to expect the price elasticity of demand to be in the range
between -0.3 and -0.5 and the price elasticity of supply to be between 0.3 and 0.5.

15
Figure 7: The agricultural commodity price spike of 2007-08 (January 2007 to June 2008)
Crop Wheat Corn Soybeans
Price in January 2007
(USD/mt)
127.66 172.02 130.77
Price in July 2008
(USD/mt)
226.94 299.14 282.36
Price change
(USD/mt)
99.28 127.12 151.59
Price change
(percent)
77.8 73.9 115.9
Source: Own calculations based on the data sources listed in Appendix 1.
Figure 8: Determinants of the price spike of 2007-08: Contribution of each variable to
the price spike in percent, ceteris paribus and in total (multiplicative)
Crop Wheat Corn Soybeans
Oil price change 29.3 29.3 21.9
Freight rate change 29.6 22.0 28.9
Population growth 2.3 2.3 2.3
Income growth 2.0 2.0 2.0
USD/SDR exchange
rate
7.6 7.6 7.6
Export restrictions 6.1 3.1 4.3
Production change -10.7 -14.2 11.0
Change in bioenergy
crop production
0.1 4.6 3.9
Total explained,
multiplicative
78.3 63.6 111.9
Total, observed. 77.8 73.9 115.9
Source: Own calculations based on the data listed in Appendix 1.
Figure 7 depicts the changes in prices during the price spike of 2007-08. Prices are monthly
and for the time period of January 2007 to June 2008. It was about mid-year of 2008 when
prices peaked. As can be seen, prices went up during the time period of analysis by about 78
percent in wheat, by around 74 percent in corn and by almost 116 percent in soybeans.

16
Figure 8 depicts the contribution of each variable to the price spike separately under the
assumption that all other variables did not change, and the aggregate effect of all variables on
the price. Notice that the use of isoelastic supply and demand functions implies a
multiplicative linkage between the single variables.
As becomes obvious, the single most important variables contributing to the price spike of
2007-08 are the price of oil and the freight rates. Notice that the price of energy is also one of
the determinants of the freight rates. As expected, the impact of population growth and
income growth was only minor. The devaluation of the US Dollar, however, contributed
significantly to the price spike, as did the export restrictions in wheat. The effects of export
restrictions in corn and soybeans were much smaller.
As discussed above, the effect of low yields in some countries actually had no negative effect
on overall global production. Soybeans are an exception. In wheat and corn the decline in
yields in some parts of the world was obviously more than compensated for higher production
in other parts of the world (Daynard and Daynard, 2011).
The effect of the growth in the production of crops for bioenergy had only a marginal effect
on the price of wheat. In corn and soybeans, the price effects were in the 4 to 4.5 percent
range.
The two last lines in table 8 depict the price increase explained by our analysis and the actual
price increase. As can be seen, the predicted price increases were very close to the observed
price increases in wheat and soybeans. In corn, our analysis underestimates the price increase
by about 10 percentage points.
5. Summary and conclusions
Our analysis suggests that there is no reason to assume that speculation has driven the price
spike of 2007-08. In fact, based on monthly data, it is possible to explain the price spike in
agricultural commodities in 2007-08 entirely by changes in key supply and demand
determining factors. The use of daily price data may have left a larger part of the price
fluctuation unexplained, as daily prices are affected by all kinds of technical reactions.

17
The somewhat surprising result is that the two by far most important variables that caused the
price spike in 2007-08 have been non-agricultural supply-side variables, namely
transportation cost, as measured by freight rates, and the price of energy. Other variables of
some importance have been export restrictions in wheat by some countries and the US Dollar
exchange rate. Poor crops in some parts of the world have been more than compensated for by
higher production of wheat and corn in other regions. Therefore, production changes have
reduced the price spike in wheat and corn while they added to it in soybeans.
References
Abbott, P.C.; Hurt, C.; Tyner, W.E. (2009): What’s driving food prices?: March 2009 update.
Oak Brook, IL: Farm Foundation.
Attie, A.P.; Roache, S.K. (2009): Inflation hedging for long-term investors. IMF Working
Paper WP/09/90. Washington, DC: IMF.
Awokuse, T.O. (2005): Impact of macroeconomic policies on agriculture. In: Agricultural and
Resource Economics Review 34, pp. 226-237.
Baffes J. (2007): Oil spills on other commodities. Policy Research Working Paper 4333,
Washington, DC: World Bank.
Baffes, J. and T. Haniotis (2010): Placing the 2006/08 Commodity Price Boom into
Perspective. Policy Research Working Paper 5371. Washington, DC: World Bank.
Bessembinder, H.; Seguin, P.J. (1993): Price volatility, trading volume, and market depth:
Evidence from future markets. In: Journal of financial and quantitative analysis 28, pp. 21-
39.
Bruinsma, J., ed. (2003): World Agriculture Towards 2015/2030. Rome: FAO.
Carter, C.; Rausser, G.; Smith, A. (2008): Assessment of the causes of the food price crisis.
Paper prepared for presentation at the Giannini Foundation, October 10, 2008. Berkeley,
CA: University of California.
Coyle, W. (2007): The Future of Biofuels: A Global Perspective. Amber Waves November
2007.
Crain, S.J.; Lee, J.H. (1996): Volatility in wheat spot and future markets, 1950-1993:
Government farm programs, seasonality, and causality. In: Journal of Finance 51, pp. 325-
343.
FAO (2009): The state of agricultural commodity markets: High food prices and the food
crises – experiences and lessons learned. Rome: FAO.
18
Foresight (2011): Foresight project on global food and farming futures: Synthesis report C10:
Volatility in food prices. London: The Government Office for Science.
Friedman, M. (1953): Essays in positive economics. Chicago, IL: Chicago University Press.
Gilbert, C.L. (2008): How to understand high food prices. Discussion Paper 23/2008. Trento:
Universita degli Studi di Trento.
Gilbert, C. L. (2010): How to Understand High Food Prices. Journal of Agricultural
Economics 62, pp.398-425.
Harl, N. (1990): The Farm Debt Crisis of the 1980s. Ames, IA: Iowa State University Press.
OECD-FAO (2008): Agricultural Outlook 2008-2017.
OECD-FAO (2011): Agricultural Outlook 2011-2020.
Haas, G. C.; Ezekiel, M. (1926): Factors affecting the Price of Hogs. Washington, DC: US
Department of Agriculture.
Hanau, A. (1928): Die Prognose der Schweinepreise. Vierteljahreshefte zur
Konjunkturforschung, Sonderheft 7, Berlin: Reimar Hobbing.
Headey, D.; Fan, S. (2010): Reflections on the global food crises: How did it happen? How
has it hurt? And how can we prevent the next one? Research Monograph 165. Washington,
DC: IFPRI.
Hochman, G. (2008): Biofuel policy and food prices. Paper prepared for presentation at the
2008 Joint Annual Meeting of the Geological Society of America, Soil Science Society of
America, American Society of Agronomy, Crop Science Society of America, and Gulf
Coast Association of Geological Societies in Houston, TX, October 7, 2008.
IMF (2008): Is inflation back? Commodity prices and inflation. In: IMF: World economic
outlook (Chapter 3), Washington, DC: IMF.
IRRI, Rice Statistics (2011): beta.irri.org/ solutions accessed August 14, 2011.
Jones, D.; Kwiecinski, A. (2010): Policy Responses in Emerging Economies to International
Agricultural Commodity Price Surges. OECD Food, Agriculture and Fisheries Working
Paper no. 34. Paris: OECD.
Kilian, L. (2009): Not all oil price shocks are alike: Disentangling demand and supply shocks
in the crude oil market. In: American Economic Review 99, pp. 1053-1069.
Mitchell, D. (2008): A note on rising food prices. Policy Research Working Paper #4682,
Washington, DC: World Bank.
OECD (2008): Rising agricultural prices: Causes, consequences and responses. Policy Brief
August 2008. Paris: OECD.

19
Peterson, H.H.; Tomek, W.G. (2005): How much of commodity price behavior can a rational
expectation storage model explain? In: Agricultural Economics 33, pp. 289-303.
Roache, S.K. (2010): What explains the rise in food price volatility? IMF Working Paper
WP/10/129. Washington, DC: IMF.
Smith, G. (2010): Is Agricultural Commodity Price Volatility Increasing? A Historical
Review. TAD/CA/APM/WP(2010)33/Final. Paris: OECD.
Schuh, G.E. (1974): The Exchange Rate and US Agriculture. In: American Journal of
Agricultural Economics 56, pp. 1-14.
Streeter, D.H.; Tomek, W.G. (1992): Variability in soybean future prices: An integrated
framework. In: Journal of Futures Markets 12, pp. 705-728.
Tangermann, S. (2011): Policy Solutions to Agricultural Market Volatility: A Synthesis.
ISSUE Paper 33, Geneva: International Centre for Trade and Sustainable Development.
Thompson, E. (2007): The Tulipmania: Fact or Artifact. Public Choice130, pp. 99-114.
Trostle, R. (2008): Global Agricultural Supply and Demand: Factors Contributing to the
Recent Increase in Food Commodity Prices. USDA/ERS, Report WRS 0801, May 2008,
revised July 2008.
Tyner, W.E.; Abbott, P.C., Hurt, C. (2008): What’s driving food prices? Oak Brook, IL: Farm
Foundation.
United Nations (2006): Coping with Water Scarcity. New York, NY: UN-Water.
United Nations (2011) World Population Prospects: The 2010 Revision. New York, NY:
United Nations.
USDA/FAS (2008): Commodity Intelligence Report. May 15, 2008.
von Witzke (2010): Towards the Third Green Revolution. Augsburg: Ölbaum.
von Witzke, H.; Noleppa, S; Schwarz, G. (2009): Global Agricultural Market Trends
Revisited: The Role of Energy Prices and Biofuel Production. Department of Agricultural
Economics, Humboldt University of Berlin, Working Paper 89/2009.
von Witzke, H. (2011): Stellungnahme zur öffentlichen Anhörung des Bundestagsausschusses
für Ernährung, Landwirtschaft und Verbraucherschutz zum Thema „Welternährung“.
Ausschussdrucksache 17(10)451-E 32.03.2011.
von Braun, J.; Torero, M. (2009): Implementing physical and virtual food reserves to protect
the poor and prevent market failure. Policy Brief 10, Washington, DC: IFPRI.
Weaver, R.D.; Natcher, W.C. (2000): Commodity price volatility under new market
orientations. MPRA Paper 9862. Munich: University Munich.

20
Williams, J.C.; Wright, B. (1991): Storage and commodity markets. Cambridge: Cambridge
University Press.
Wright, B.D. (2008): Speculators, storage and commodity price spikes. Paper prepared for
presentation at the Giannini Foundation, October 10, 2008. Berkeley, CA: University of
California.
Wright, B.D. (2011): The Economics of Grain Price Volatility. In: Applied Economic
Perspectives and Policy 33, pp.32-58.
Yang, J.; Haigh, M.S.; Leatham, D.J. (2001): Agricultural liberalization policy and
commodity price volatility: A GARCH application. In: Applied Economics Letters 8, pp.
593-598.
Appendix
A1: Data used in the empirical analysis:
– Period of analysis: January 2007 – June 2008.
– Price of wheat: No 1 hard red winter, FOB Gulf of Mexico, Source USDA, var. vols.
– Price of corn: No. 2 yellow, FOB Gulf of Mexico, Source: USDA, var. vols.
– Price of soybeans: No. 2 yellow, FOB Gulf of Mexico, Source: USDA var. vols.
– Global population growth during period of analysis: 1.8 percent, Source US Census
Bureau, 2011.
– Global income growth during period of analysis: 7.9 percent: Source: CIA Factbook,
2011.
– Increase in shipping rates during period of analysis: 54 USD/mt, Source HMG, 2010.
Shipping rates for grain increased by 43 USD/mt (US Gulf - EU; increase from 40 to
83 USD/mt) and by 60 USD/mt (US Gulf – Japan; increase from 60 to 120 USD/mt,
Source: FAO, 2008; HGCA, 2008). Price transmission elasticity for FOB prices = 0.7.
– US Dollar depreciation against the SDR during the period of analysis: 7.6 percent. The
USD exchange rate against the SDR went up from 1.509 to 1.622 USD/SDR.
– Oil price increase during the period of analysis: 146.3 percent from 53.40 USD/barrel
to 131.52 USD/barrel, Source: IMF, var. vols. Price transmission elasticities used in
this analysis: wheat: 0.2; corn: 0.20; soybeans: 0.15; source: DEFRA, 2010. Mitchell
(2008) uses price transmission elasticities in the range of 15 to 20 percent, while
Baffes assumes price transmission elasticities to average 17 percent. A lower price

21
transmission elasticity for soybeans than for grains is reasonable as the soy plant is a
legume.
– According to DEFRA (2010) about 20 countries have employed export restrictions of
some form for some commodities during the period of analysis. This analysis is based
on the following export restrictions:
Wheat: Kazakhstan, Ukraine, Russia, Argentina, India, Pakistan;
Corn: India, China, Argentina;
Soybeans: Argentina, Kazakhstan.
– During the time period analyzed here the demand for wheat for bioenergy increased
total wheat demand by 1.1 percent, for corn by 3.7 percent and for soybeans by 3.1
percent. This is equivalent to a growth in demand for bioenergy use of corn by 47
percent and of soybean oil by 40 percent.