
The economics of Heathrow expansion: Final report ... -...
111
CE Delft Solutions for environment, economy and technology Oude Delft 180 2611 HH Delft The Netherlands tel: +31 15 2 150 150 fax: +31 15 2 150 151 e-mail: [email protected] website: www.ce.nl KvK 27251086 The economics of Heathrow expansion Final report Report Delft, February 2008 Authors: Bart Boon Marc Davidson Jasper Faber Dagmar Nelissen Gerdien van de Vreede
Transcript of The economics of Heathrow expansion: Final report ... -...
CE Delft Solutions for environment, economy and
technology
Oude Delft 180
2611 HH Delft
The Netherlands
tel: +31 15 2150 150
fax: +31 15 2150 151
e-mail: [email protected]
website: www.ce.nl
KvK 27251086
CE DelftSolutions for
environment,
economy and
technology
Oude Delft 180
2611 HH Delft
The Netherlands
tel: +31 15 2 150 150
fax: +31 15 2 150 151
e-mail: [email protected]
website: www.ce.nl
KvK 27251086
The economics of Heathrow expansion
Final report
Report Delft, February 2008 Authors: Bart Boon
Marc Davidson Jasper Faber
Dagmar Nelissen Gerdien van de Vreede
Publication Data
Bibliographical data: Bart Boon, Marc Davidson, Jasper Faber, Dagmar Nelissen, Gerdien van de Vreede The economics of Heathrow expansion Delft, CE Delft, 2008 Aviation / Airports / Economy / Effects / Economic growth / Costs / Benefits / Demand / Welfare / Consumption / Competition / Charges / Economic factors / Analysis Publication number: 08.4504.07 CE-publications are available from www.ce.nl Commissioned by: HACAN ClearSkies in association with NoTRAG. We gratefully acknowledge the financial contribution of the Ashden Trust. Further information on this study can be obtained from the contact person Bart Boon. © copyright, CE Delft, Delft
CE Delft Solutions for environment, economy and technology
CE Delft is an independent research and consultancy organisation specialised in developing structural and
innovative solutions to environmental problems. CE Delfts solutions are characterised in being politically
feasible, technologically sound, economically prudent and socially equitable.
For the latest information on CE check out our website: www.ce.nl.
This report is printed on 100% recycled paper.

Contents
Executive summary 1
1 Introduction 5 1.1 Background 5 1.2 Aim of this study 5 1.3 Reader 5
2 Introduction 9
3 Direct, indirect and wider benefits of aviation 11 3.1 Demarcation of different impacts and benefits 11 3.2 Direct benefits 12 3.3 Indirect impacts and wider benefits 14 3.4 Conclusions 16
4 Quantitative assessments of the overall economic impact of airport development 17 4.1 Assumptions with regard to business passengers 17
4.1.1 Mixed-mode operation at Heathrow 18 4.1.2 Impact of a third runway at Heathrow 20 4.1.3 Diminishing returns to airport capacity 21
4.2 Implications at passenger level 22 4.3 Congestion costs 24 4.4 Other issues 25
4.4.1 Reliability of model used 25 4.4.2 Efficiency increases in the aviation sector 25 4.4.3 Presentation 26
4.5 Conclusions 26
5 Specific impacts and issues 29 5.1 Treatment of taxes and subsidies 29 5.2 Social impacts 30 5.3 Tourism 31 5.4 Trade, business efficiency and economic growth 32 5.5 Investment 33 5.6 Conclusions 34
6 Methodological issues 37 6.1 Survey results 37 6.2 Data treatment and assessment 38
6.2.1 Correlations and causal relations 38 6.2.2 Statistical significance 39 6.2.3 Data mining 39
6.3 Presentation of results 40 6.4 Conclusions on methodological issues 41
7 Conclusions on economic benefits 43
8 Demand management 49 8.1 Introduction 49 8.2 The welfare economics point of view 50
8.2.1 Theory 50 8.2.2 Policy 52 8.2.3 The case for demand management 53 8.2.4 Options for government intervention 54
8.3 Does unnecessary consumption exist? 57 8.3.1 Positional consumption 58 8.3.2 Habits 59
8.4 Demand management and economic benefits of expansion 59 8.5 Summary 60
9 Hub airports and regulators 65 9.1 Introduction 65 9.2 Analytical framework 66
9.2.1 Introduction 66 9.2.2 Demarcation 67 9.2.3 Competition for passengers 67 9.2.4 Competition of airports for airlines 70
9.3 Can regulators influence the competitive position of hubs? 72 9.3.1 Introduction 72 9.3.2 European regulation on airport charges 73 9.3.3 Can national regulators influence quality and
convenience factors? 74 9.3.4 Can regulators influence costs? 75 9.3.5 Noise regulator at the four major hub airports 76 9.3.6 Conclusions 77
9.4 Empirical indications of hub airport competition 78 9.4.1 Introduction 78 9.4.2 Destinations and passenger data 78 9.4.3 Transfer passenger data 80 9.4.4 Conclusion 81
9.5 Empirical indications of the use of airport charges in competition 81 9.5.1 Introduction 81 9.5.2 Data on airport charges 81 9.5.3 Governmental taxes 83 9.5.4 Conclusion 84
9.6 How is competition between hubs likely to develop? 85 9.6.1 Introduction 85 9.6.2 The historical development of transfer traffic 85 9.6.3 Forecasts of the development of long-haul air travel 86 9.6.4 Conclusion 87

9.7 Government attitudes to hub airport competition 87 9.7.1 Introduction 87 9.7.2 Perception of hub airport competition by public authorities 88 9.7.3 Conclusion 89
9.8 Conclusion 90
10 References 93
A Annex on statistical analysis 101

Executive summary
Background Air transport is an integral part of present-day society. Demand for flights is ever-rising, stretching airports to the limit. Nonetheless, expansion of runway capacity is often highly controversial. On the one hand there are the predicted economic benefits. Advocates of airport expansion argue that new runways would enable a significant number of additional flights, creating jobs and inducing all kinds of other positive economic effects. On the other hand, opponents emphasise that expansion would seriously affect the lives of people living in the area of the planned runway. They would have to either adjust themselves to a potentially severe increase in noise exposure, or move elsewhere. An increase in the number of flights would also be likely to affect local air quality and, more widely, would contribute to climate change. In order to assess the pros and cons of expanding runway capacity at Heathrow airport in particular, the UK Government has launched a public consultation. Against this background, HACAN Clear Skies has commissioned CE Delft to analyse several issues relating to the alleged benefits of and need for airport expansion, and the desirability of further European harmonisation of environmental legislation concerning aviation.
The benefits of airport expansion Part A of our report critically assesses a report by Oxford Economic Forecasting (OEF, 2006) on the wider economic impacts of aviation on the UK economy. The OEF report is significant. It is regularly quoted as a definitive study into the economic benefits of aviation, from UK Government policy, notably the 2006 Air Transport Progress Report, through to numerous press releases from aviation lobby groups. The OEF report discusses the contribution of aviation to the economy in terms of direct and indirect employment, its contribution to GDP, and how it supports tourism, trade, investment, growth sectors, business efficiency and economic growth. In particular, the overall economic impacts of extending runway capacity are presented for the Heathrow mixed-mode scenario, the Heathrow third-runway scenario and a scenario entailing the full implementation of the Government’s White Paper runway proposals. With regard to the methodology, outcomes and interpretation of the OEF study we have five main observations. First, a sector’s direct, indirect and induced employment levels and its contribution to GDP are not valid indicators of its importance to the economy, nor in the case of aviation can they be used to substantiate the argument in favour of expanding runway capacity. In the absence of structural unemployment, if the aviation sector were to offer less
4.504.1/The economics of Heathrow expansion February 2008
1

employment, people would find jobs in other sectors, albeit at possibly slightly lower wages. Similarly, if consumers were unable to spend money on aviation, they would spend it in another sector, potentially deriving a slightly lower consumer surplus, but nonetheless still giving rise to indirect and induced employment. Not accounting for these alternatives significantly overstates the sector’s importance. Second, in keeping with its brief, the OEF report discusses at length how aviation supports other parts of the economy. Many different indicators are presented, showing how aviation supports trade, investment, growth sectors, business efficiency and economic growth, but essentially they all relate to much the same process. Aviation opens up new markets, allowing producers to purchase inputs at lower costs and sell outputs on global markets, and so potentially enabling economies of scale in production processes. Hence the global economy becomes more efficient. The economy as a whole clearly benefits, but these benefits are not well expressed by the indicators presented. The ability of UK producers to sell goods on a wider market goes hand-in-hand with foreign producers selling their products on the UK market, in competition with local producers. Globalisation may or may not be beneficial for social welfare, but the benefits cannot be measured well by the amount of trade. Third and fourth, we note some peculiarities of OEF’s model and its underlying assumptions, and the implications of its results. A crucial input to OEF’s calculations is the number of additional business passengers that runway expansion will attract, because OEF assumes that only business passengers generate wider economic impacts. In estimating the impact of mixed-mode operation at Heathrow, OEF assumes that there will be, not 0.5 million additional business passengers in 2015 as forecast by the UK Department for Transport, but 3 million. We do not feel the OEF report provides a satisfactory justification for this assumption. The impact of additional flexibility offered to business passengers by additional services on existing routes should already be captured by the underlying demand included in DfT’s estimates. In addition, while it may be true that adding runway capacity will to some extent encourage business investment and allow businesses to operate more efficiently, these wider impacts themselves need to be demonstrated by the OEF model, rather than being assumed from the outset and rather arbitrarily quantified in terms of additional business passengers. The OEF model estimates that the full implementation of the White Paper runway proposals would deliver an economic impact of around £ 120 per additional passenger or about £ 400 per additional business passenger (again, on the assumption that only business passengers cause wider economic impacts). This compares with an estimate of an additional consumer surplus of ‘perhaps £ 30 per additional passenger’ which OEF derives from DfT estimates. OEF assesses its estimate as ‘consistent with plausible analysis from other perspectives about the additional value of a business trip by air’. However, the direct economic value of a business trip is already captured by the willingness of business passengers to pay, and hence by the consumer surplus estimate of £ 30 over all passengers.
4.504.1/The economics of Heathrow expansion February 2008 2

Assuming that this figure is of the right order of magnitude, OEF’s economic impact estimate implies that aviation has very significant positive external effects on the economy, and that these effects are even substantially larger than the value a business passenger (or their employer) derives from their trip. This seems an implausible implication. Fifth, OEF’s results are presented in a potentially misleading manner. Although this is not always stated explicitly, the estimates of economic impacts presented are often upper limits, and so illustrate the maximum possible economic impact rather than the most likely or plausible outcome. For example, the illustrated impacts of the third-runway scenario are based on the highest passenger forecast scenario produced by DfT. A second example relates to the interpretation of the estimated cost of congestion (in itself another upper limit). Only a part of this cost can be attributed to insufficient runway capacity - queues for security checks and delays due to bad weather or industrial action (either in the UK or elsewhere) will not be resolved by expanding capacity. For a full discussion of our conclusions concerning the OEF report, see part A.
The need for airport expansion In part B of the report, we discuss whether demand management may be a viable alternative to expanding runway capacity. From a social welfare perspective, it would be optimal to internalise external costs through a market instrument such as tradable emission rights or a differentiated aviation charge at the level of the external effects caused by aviation. In the absence of such instruments, there are a number of alternatives that could be considered, three of which are discussed in the report. First, the UK’s Air Passenger Duty (APD) could be increased and extended to transfer passengers. This might reduce the impetus for expansion of runway capacity; however, APD differentiates only very crudely on the basis of the environmental characteristics of flights, and so provides only a limited incentive for cleaner engines, higher load factors, larger aircraft and improved fuel efficiency. Nonetheless, it may be a valid short-term approach to reducing the impetus for airport expansion. A second form of demand management discussed is the withdrawal of landing slots for short-haul journeys for which viable alternatives exist. Generally, it may be assumed that the aviation market works sufficiently well that airlines will offer those flights for which passengers are willing to pay most, ie those with the highest social benefits. Given that despite the scarcity of slots at Heathrow airport short-haul flights are being offered, it can be assumed that at least some of these flights have a net social benefit. Consequently withdrawing short-haul landing slots may not be the most desirable option in this case. It may prevent some flights with a net negative impact on social welfare, but is likely also to prevent some flights with a net positive impact.
4.504.1/The economics of Heathrow expansion February 2008
3

A third option is to allocate destinations among London’s five airports, so as to remove duplicate services and increase load factors. This approach could impact substantially on the competitive market for air travel. Only if there is currently no free competition due to restricted airport capacities, and in the absence of market mechanisms for slot allocation, could this option potentially improve social welfare as a second-best solution. The conclusion is that each of these more interventionist options is less desirable than the introduction of market instruments, such as a differentiated environmental charge or tradable emission rights, that fully internalise the externalities of aviation. If such market instruments are judged unfeasible, the other options could be regarded as alternatives. More study would be required in order to judge whether any of these options would improve social welfare compared to the current situation.
The desirability of harmonised environmental legislation Part C of the report analyses the nature of competition between European hub airports, and considers the desirability of harmonised environmental legislation. We come to the conclusion that the competition between European hubs is mainly for transfer passengers. National governments are aware of this competition, and it is used as an argument in favour of expanding hub airports. Their reasoning is that, if their hub airport is not expanded, traffic will be lost to hubs in other European countries, reducing the quality of the network offered at the national hub, and so reducing national welfare and harming the economy. Following this line of reasoning, it is conceivable that national governments may impose less strict environmental regulations in order not to damage the competitive position of their hub airport. If this proved to be the case, one might argue that harmonisation of environmental legislation was required to prevent a ‘race to the bottom’. However, we come to the conclusion that even if less strict noise or air pollution standards were indeed imposed nationally, this would not be a justification for further European harmonisation. The existing literature indicates that the economic benefits of aviation fall to a large extent to the areas near airports. Similarly, the external effects of noise and air pollution are borne locally. Therefore, in a properly functioning democracy, the local or national government is best placed to weigh the benefits and costs of increased aviation activities. An exception must be made for externalities that manifest themselves globally, such as the emission of greenhouse gases and the additional impacts of aviation activities on the climate.
4.504.1/The economics of Heathrow expansion February 2008 4

1 Introduction
1.1 Background
There is currently a debate in the UK about the possible expansion of Heathrow and other airports as a response to growing demand for air travel. Alongside other options, the development of a third runway at Heathrow is being discussed. On the one hand, some researchers and stakeholders argue that the economic benefits of air transport are very significant and that expansion of Heathrow would substantially increase the industry’s contribution to the UK economy. According to these observers, failure to expand would result in business being lost to other airports in other countries. On the other hand, it is generally agreed that expansion would have negative effects on the environment. Local air pollution and noise exposure would be increased, as would UK aviation’s wider environmental impacts, particularly its contribution to climate change. It is the belief of HACAN ClearSkies that the benefits of expansion claimed by industry and government are doubtful and are likely to be overestimates. Furthermore, the issue of international competition mentioned above raises the question of whether environmental regulation of the air transport industry should not be harmonised internationally. In light of a previous CE Delft study into the economic benefits of air transport, HACAN has asked CE Delft to carry out an assessment of these issues.
1.2 Aim of this study
In this context, the objectives of this study are: • to assess the results of a 2006 report by Oxford Economic Forecasting (OEF)
on the economic impact of aviation1 on the UK economy; • to determine to what extent demand management may affect the economic
impetus for airport expansion; and • to determine the nature and level of competition between EU hub airports,
and to consider whether that level of competition suggests the desirability of harmonising environmental legislation for European airports.
1.3 Reader
The report is made up of three parts, which can to some extent be read independently. Part A consists of a review of the economic benefits of increasing the capacity of Heathrow airport, focusing on a critical assessment of the findings of the 2006 OEF study into the economic benefits of aviation.
1 OEF’s definition of ‘aviation’ for the purposes of its report is cited on p15. It excludes the aerospace (aircraft
manufacturing) industry but includes general aviation.
4.504.1/The economics of Heathrow expansion February 2008
5

Part B discusses the potential merits of several forms of demand management. It considers under what circumstances demand management may be a desirable policy alternative, and what the implications of demand management would be for the economic impetus towards increasing airport capacity. Part C then discusses the issue of competition between European hub airports. The alleged high level of international competition is sometimes put forward as an argument against the aviation sector being treated equally with other economic activities and transport modalities. The report considers the extent to which airports in different European countries do actually compete, and discusses the policy implications of this.
4.504.1/The economics of Heathrow expansion February 2008 6
4.504.1/The economics of Heathrow expansion February 2008
7
Part A
The economic benefits of increasing air traffic capacity at
London Heathrow Airport

4.504.1/The economics of Heathrow expansion February 2008 8 4.504.1/The economics of Heathrow expansion February 2008 8
2 Introduction
The main focus of this part of the study is an assessment of the findings of the 2006 report by Oxford Economic Forecasting (OEF) The Economic Contribution of the Aviation Industry in the UK (OEF 2006). It is a significant report. It is regularly quoted as a definitive study into the economic benefits of aviation, from UK Government policy, notably the 2006 Air Transport Progress Report, through to numerous press releases from aviation lobby groups. The report is an update of OEF’s 1999 study of the economic contribution of the aviation industry in the UK, and was commissioned by a range of organisations across the aviation industry, together with the UK Department for Transport (DfT) and VisitBritain. The OEF 1999 report was among the reports and studies assessed in a previous report by CE Delft (CE Delft 2005)2. The main objective of the 2006 OEF study was to provide information on the economic contribution of the aviation sector as a whole, in particular looking at its wider economic benefits. The report analyses the size and scope of the aviation industry itself, establishing the importance of aviation in terms of the industry’s contribution to GDP and employment, its productivity, the investments it makes, its profits, the taxes it pays, and its positive social impacts. A particular area of focus is the wider economic impacts - the so-called ‘catalytic’ impacts - of the aviation industry. These are characterised in terms of ‘the importance of the aviation industry in helping other sectors to operate more efficiently and to compete in the global economy, supporting growth across the UK economy as a whole’ (p9). The report discusses in turn how aviation supports tourism, trade, investments in the UK, growth sectors, business efficiency and economic growth. In addition, the report briefly discusses the potential additional contribution of aviation to the economy under certain scenarios that allow an expansion of runway capacity. Results on the economic impact of the following scenarios are presented: • mixed-mode operation3 at Heathrow airport; • a third runway at Heathrow; and • full implementation of the 2003 White Paper runway proposals4.
2 For comments on the OEF (1999) report, see also BHC (2000). 3 Under this scenario, the two existing runways at Heathrow airport would be used for both take-off and
landings rather than the alternation method currently in use. 4 These proposals from the UK Government’s 2003 aviation White Paper ‘The Future of Air Transport’
envisage one new runway coming into operation at Stansted by 2015, and a third runway at Heathrow by 2030, along with additional runway capacity at Birmingham and Edinburgh by the same date.
4.504.1/The economics of Heathrow expansion February 2008
9

In this part of the present report, we discuss the methodology and findings of the OEF report. Some of our comments relate to how OEF arrived at its results and conclusions, while others relate to how these results and conclusions may be interpreted. Chapter 3 begins by discussing qualitatively the direct, indirect and wider economic benefits of aviation as foreseen by OEF. In Chapter 4 we assess OEF’s quantitative estimates of the wider economic benefits, including the underlying passenger forecasts. Chapter 5 discusses several specific fiscal, economic and social impacts and issues, while Chapter 6 discusses some methodological considerations with regard to the OEF report. Chapter 7 concludes this part of the report.
4.504.1/The economics of Heathrow expansion February 2008 10

3 Direct, indirect and wider benefits of aviation
3.1 Demarcation of different impacts and benefits
The 2006 OEF report offers estimates of the direct contribution of the aviation industry to the UK’s GDP, the number of jobs that depend on the industry and its wider economic benefits. A wide range of indicators and effects is discussed, but it is not entirely clear to what extent these are distinct and cumulative, rather than being slightly different expressions of more or less the same. Chapter 2 of the report offers several quantitative indicators of the size and scope of the aviation sector. The next six chapters (Chapters 3 - 8) discuss how aviation supports tourism, trade, investment, growth sectors, connectivity, business efficiency and economic growth, and are more or less descriptive. Chapter 9 then goes on to quantify the ‘overall economic impact of airport development’. It explains that, in order to do this, OEF’s ‘UK Industry-Aviation model’ was deployed to estimate the ‘wider economic’ benefits of different scenarios of future airport development. This term is also used when presenting the outcomes of the model. From this it appears that the OEF report does not distinguish between the ‘wider economic impact’ and the ‘overall economic impact’, but regards them as synonymous5. It is therefore our understanding that Chapter 9 of the OEF report provides a quantification of the overall economic impact of aviation (being synonymous with the wider economic benefits in the OEF report). The impacts presented in Chapter 9 of the report are thus merely the final quantification of the impacts and effects discussed in Chapters 2 - 8, which are in themselves also to a large extent overlapping. Impacts on trade, investments, connectivity and growth sectors are inextricably intertwined. The use of separate indicators for these effects, as presented in Chapters 3 - 8, may be useful to provide a feeling of the size or importance of such relations, but the reader should keep in mind that these are merely different ways of describing more or less the same effect.
5 We do note that this understanding is somewhat contradicted by the fact that leisure passengers and their
impacts are included indicators of the direct impacts of aviation, while OEF notes on p74 that only business passengers are expected to generate wider benefits.
4.504.1/The economics of Heathrow expansion February 2008
11
3.2 Direct benefits
According to the OEF report (p11), the aviation industry generated £ 11.4 billion value added in 2004, of which £ 1.5 billion was generated by employees in ancillary businesses such as retail and catering concessions and airport hotels. The report notes that this figure for the sector as a whole made up 1.1% of the UK’s GDP for that year6. The total number of people directly employed in full-time equivalent terms was 186,000. There are a number of issues worth discussing in relation to these figures. First, the estimate of the value added generated by the aviation sector does not imply that £ 11.4 billion of gross value added would be lost if the aviation industry were to cease to exist. The figure provides an indication of the size of the sector, but not necessarily of its importance. To give a measure of this, the counterfactual scenario, or next best alternative, also needs to be taken into consideration. If there were less aviation, value added would be generated in other sectors instead. The same argument applies to the figures for (direct) employment. Employment may be used as an indicator for the size of a sector, but is much less valid as an indicator of the importance of a sector. Unless there is structural unemployment in a country, the people occupying the jobs within a sector will not become jobless if the sector ceases to exist. They will find jobs in other sectors, albeit possibly at somewhat lower wages7. This notion is acknowledged by the OEF report, but only in Annex A, which discusses the approach to the study:
But while the numbers of jobs generated are useful in assessing the contribution of an industry to a local area, or to the overall economy in the short run, in the long run the level of overall employment is not determined so much by the level of demand from particular industries as by the supply of workers looking for a job (…). So, in the long run, employment does not give a reliable indication of the contribution aviation makes to the UK economy (p89).
6 Note that the figure of 1.1% of GDP relates to the contribution of the aviation sector to GDP in terms of fixed
(2002) prices whereas the absolute figure of £ 11.4 billion is measured in current prices (see Table 2.1 of the OEF report). Making use of fixed 2002 prices, the gross value added of the industry amounts to £ 10.6 billion, as can also be found in the OEF report. It is unclear to us why the absolute contribution reported is in current prices, while the share reported is based on fixed prices.
7 It is true though, that the consumer surplus under the alternative is likely to be slightly lower, otherwise people and companies would not have elected to spend their money on aviation in the first place.
4.504.1/The economics of Heathrow expansion February 2008 12

The definition of the aviation industry used by OEF in the report makes it especially important to take account of the alternative or counterfactual world. The industry is defined as:
Activities that are directly dependent upon transporting people and goods by air to, from or within the UK. This covers airline and airport operations and includes scheduled and charter flights for passengers and freight, general aviation8, airport maintenance, air traffic control and regulation, and activities directly serving air passengers, such as check-in, baggage-handling, and on-site retailing and catering facilities. Not all of these activities necessarily take place at an airport - for example, some airlines have head office functions or ticketing centres at other locations (p11).
If a given number of people had not travelled by plane, it is true that they would not have used an airport’s on-site retailing and catering facilities. However, the money spent on these services would not have been forgone by the economy as a whole. For example, it can be expected that the people in question would still have had dinner and hence would have spent at least part of the money somewhere else, either at a supermarket or at a restaurant. Third, the benefits presented as direct include a broad range of activities. OEF’s Table 2.3 (p14), reproduced below as Table 1, reports that employees of airlines, airport operators, ground services and flying schools for commercial pilots numbered 94,000 in 2004, while another 92,000 people were in ‘other aviation-related employment’. The latter figure relates to air cargo handling, airport retailing, catering and hotels, and surface transport to airports. In fact, comparing the table’s figures for 1998 and 2004 one sees that the number of people working directly in air transport itself (using a narrow definition of the sector), has fallen by 9,000 full-time equivalents. Thus, had it not been for the growth in employment in activities such as catering and hotels as included in ‘other aviation-related employment’, the indicator for direct employment in the sector would have fallen over the period. However, it may be argued that not all activities related to catering, hotels and surface transport should be included under the heading of direct employment in the aviation sector.
8 Note that general aviation is included under this definition. It is not clear, however, to what extent it is also
included in the figures presented. In terms of OEF’s definition, one would expect it to be. However, DfT (2006, pp37-38) argues that the industry’s impact goes beyond the ‘around 200,000 jobs directly’ as estimated by OEF, noting the 11,000 people employed in jobs related to general aviation. It is unclear whether DfT has interpreted the OEF figures incorrectly, or whether the OEF figures are not entirely consistent with the definition given.
4.504.1/The economics of Heathrow expansion February 2008
13
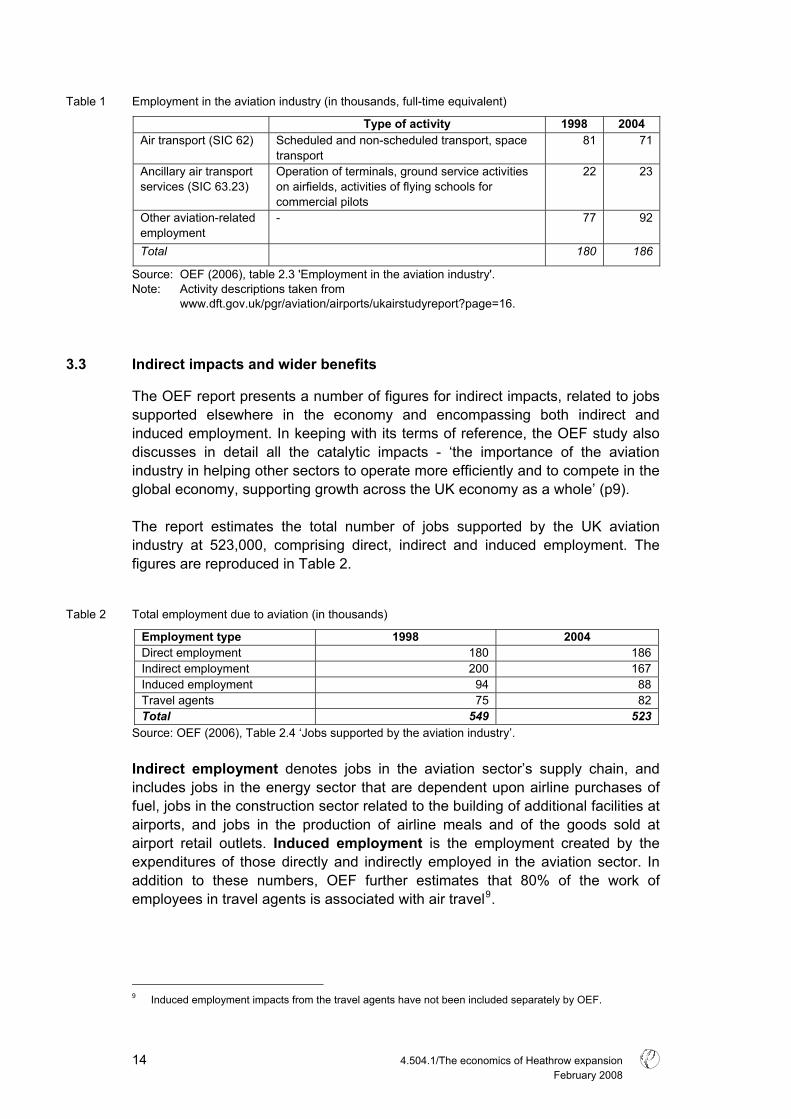
Table 1 Employment in the aviation industry (in thousands, full-time equivalent)
Type of activity 1998 2004 Air transport (SIC 62) Scheduled and non-scheduled transport, space
transport 81 71
Ancillary air transport services (SIC 63.23)
Operation of terminals, ground service activities on airfields, activities of flying schools for commercial pilots
22 23
Other aviation-related employment
- 77 92
Total 180 186
Source: OEF (2006), table 2.3 'Employment in the aviation industry'. Note: Activity descriptions taken from www.dft.gov.uk/pgr/aviation/airports/ukairstudyreport?page=16.
3.3 Indirect impacts and wider benefits
The OEF report presents a number of figures for indirect impacts, related to jobs supported elsewhere in the economy and encompassing both indirect and induced employment. In keeping with its terms of reference, the OEF study also discusses in detail all the catalytic impacts - ‘the importance of the aviation industry in helping other sectors to operate more efficiently and to compete in the global economy, supporting growth across the UK economy as a whole’ (p9). The report estimates the total number of jobs supported by the UK aviation industry at 523,000, comprising direct, indirect and induced employment. The figures are reproduced in Table 2.
Table 2 Total employment due to aviation (in thousands)
Employment type 1998 2004 Direct employment 180 186 Indirect employment 200 167 Induced employment 94 88 Travel agents 75 82 Total 549 523
Source: OEF (2006), Table 2.4 ‘Jobs supported by the aviation industry’. Indirect employment denotes jobs in the aviation sector’s supply chain, and includes jobs in the energy sector that are dependent upon airline purchases of fuel, jobs in the construction sector related to the building of additional facilities at airports, and jobs in the production of airline meals and of the goods sold at airport retail outlets. Induced employment is the employment created by the expenditures of those directly and indirectly employed in the aviation sector. In addition to these numbers, OEF further estimates that 80% of the work of employees in travel agents is associated with air travel9.
9 Induced employment impacts from the travel agents have not been included separately by OEF.
4.504.1/The economics of Heathrow expansion February 2008 14
In the previous section on direct benefits, we mentioned that it is important to take account of the alternative or counterfactual scenario when trying to indicate the importance of a sector. This factor may be even more important when considering a sector’s indirect and induced employment figures. If money currently spent on air travel were spent in alternative ways, it would still induce impacts in other sectors and thus contribute to employment and GDP. In general, the level and price of an economic activity or commodity depend on the demand for and supply of that activity or commodity. If the aviation sector’s fuel demand falls10, this will results in a decrease in the market price of fuel. If the market price for fuel decreases, other sectors will be tempted to purchase more. Consequently, the energy sector jobs supported by the aviation sector’s fuel demand will not be lost entirely, but will be supported by other sectors instead. A small proportion of these jobs may be lost, or alternatively wages may be lowered slightly. If jobs are lost in the energy sector, those made unemployed may find new jobs in another sector, albeit possibly at a slightly lower wage. In any case, not all of the aviation sector’s indirect employment would stand to be forgone if the sector ceased to exist, because the demand for some of the services concerned is not directly related to aviation. For example, irrespective of whether people fly, they need food. Hence, the quantity of food that is currently served aboard aircraft would still need to be produced if people did not fly. Similarly, it is plausible that if less use was made of air travel to arrive at holiday destinations, at least a proportion of the current travel agency workforce would be employed instead to sell overseas travel by ferry and rail, and trips within the UK11. Counterfactual scenarios are also important when interpreting the OEF report’s figures for induced employment. Since those directly or indirectly employed in the aviation sector would largely find employment elsewhere if the sector were to diminish in size, they would continue to induce further employment to a similar extent by spending their income from their new jobs. The aviation sector’s total level of direct, indirect and induced employment is presented by OEF as being equivalent to 2% of the UK’s total employment. However, employment figures that include indirect jobs cannot be meaningfully related to overall employment figures. If a similar calculation were performed for every sector of the economy, the sum of all the jobs identified across each sector would far exceed total employment, due to double counting of jobs, since every job can be considered as direct employment within one sector or another. Thus relating the number of jobs directly and indirectly dependent on a sector to the total number of jobs in the economy yields a distorted picture.
10 For example as the result of the introduction of more fuel-efficient aircraft, or due to an exogenous decrease
in passenger levels. 11 Since the travel agency employment is explicitly added to the other figures, we assume that it is not yet
included in the input-output tables applied to estimate the employment figures.
4.504.1/The economics of Heathrow expansion February 2008
15

3.4 Conclusions
The OEF report gives estimates of the direct, indirect, induced and wider economic benefits of aviation. However, it may not be entirely clear to the reader whether these impacts are additive or overlapping. Many of the indicators presented are different ways of expressing more or less the same impact. The report provides a range of figures for the aviation sector’s direct employment, indirect employment, induced employment and contribution to GDP. These indicators may, if measured and defined correctly, provide an indication of the size of the sector, but have much less value in determining its economic importance. The economic importance of the sector can only be determined by comparing the overall size of the economy with its assumed size in the absence of the sector. It is clear that the money currently spent on aviation would be spent in alternative ways in other sectors if there were no aviation sector. Thus it would continue to contribute directly to GDP and employment, as well as giving rise to indirect and induced employment. The same would hold for expenditure on aviation forgone as a result of a decision not to increase airport capacity. In addition, it should be noted that of OEF’s direct employment estimate of 186,000 full-time equivalents, 92,000 are said to be ‘aviation-related’. This includes employment related to air cargo handling, but also employment in airport hotels and retailing and in surface transport serving airports. It may be argued that some of the latter activities are not directly related to aviation. Finally, care should be taken when comparing figures on indirect and induced employment with overall employment in a country. Such a comparison is not very meaningful, since overall employment figures relate only to direct employment. If the direct, indirect and induced employment figures for all sectors in a country are added up, the result will be a figure much higher than the total employment in the country.
4.504.1/The economics of Heathrow expansion February 2008 16
4 Quantitative assessments of the overall economic impact of airport development
In Chapter 9 of the OEF report, the size of the overall (or wider12) economic impact of airport development is quantified. Significantly, it is admitted that:
Our results should be regarded primarily as illustrative of the possible wider economic benefits, since there is inevitably considerable uncertainty over some of the assumptions made - the model is particularly sensitive to assumptions about the scale of business use of aviation in the different scenarios (p69).
In this chapter we comment on Chapter 9 of the OEF report, and discuss in detail its assumptions with regard to the scale of business use, and the sensitivity of its estimates of economic impact to these assumptions.
4.1 Assumptions with regard to business passengers
According to the OEF report, business passengers induce much more wider economic benefits than leisure passengers. It argues that leisure passengers are unlikely to contribute significantly to additional trade or investment, increased productivity or future growth. For this reason, it concludes that any increase in the wider economic benefits of aviation as a result of increased airport capacity depends crucially on how many new business passengers may be expected (OEF 2006, p74). The report notes that its findings about the impact of airport development are sensitive to its assumptions about the scale of business use of air travel. These assumptions relate specifically to the proportion of business passengers among the additional number of passengers who would be carried as a result of airport expansion. OEF explains that these assumptions about additional business passengers are ‘the most important for the model results’ (p70), because they determine the impacts on business efficiency and productivity. Since this is such a crucial issue, we will discuss it at some length here. DfT has developed an Air Passenger Forecasting Model to produce forecasts of passenger levels under different airport capacity scenarios. The OEF report acknowledges the Air Passenger Forecasting Model, but diverges from the model’s assumptions about the level of increased business use resulting from additional capacity, as it explains:
(The DfT model) is based on fixed underlying demand, with actual passenger numbers being determined by a proportion of underlying demand being suppressed to match available capacity. Since business
12 These terms are used.
4.504.1/The economics of Heathrow expansion February 2008
17

passengers on average place a higher value on being able to travel when they want to, it is mainly other passengers who are displaced by the model. Since business passengers therefore account for a relatively small proportion of suppressed demand, the model tends to show a significantly smaller proportion of business passengers using additional runway capacity than the average business usage of existing capacity. This is logical in the context of fixed underlying demand, but does not always reflect airport or airline expectations of the uses of additional capacity. For our purposes, the assumption of fixed underlying demand seems unnecessarily restrictive. Creating additional capacity where it is wanted is likely to do more than just attract a share of suppressed demand. Underlying passenger demand is also likely to be higher - by encouraging business investment and allowing businesses to operate more efficiently, appropriate additions to air service capacity could, for example, enable the UK to get a larger share of overall European business activity and associated use of air services. We have therefore typically assumed for our scenario modelling that the business share of additional passengers lies somewhere between that generated by a fixed demand model like DfT’s and that which would result from assuming the same business share as for existing capacity (p70).
Rejecting the idea that underlying demand is fixed, the OEF report reasons that a targeted expansion of airport capacity may actually increase business demand. In estimating the impacts under the three different scenarios, the report enlarges upon how these assumptions on additional business passengers work out in practice, as discussed below. It should first be noted, however, that DfT’s forecasts for business passenger use of air travel have also been questioned by the Environmental Change Institute (ECI) of the University of Oxford, in a report which notes with regard to passenger forecasts for all UK airports that the DfT forecasts are based on the assumption that business travel will grow faster than leisure travel, whereas in the last ten years the opposite has been true (ECI, 2006; pp31-32).
4.1.1 Mixed-mode operation at Heathrow
The first of the scenarios considered by the OEF report, mixed-mode operation, is expected, ‘very approximately’, to allow for an additional 12 million passengers a year at Heathrow (p71). Estimates vary as to how many of these new passengers would be business passengers. On the one hand, the DfT model, as cited by OEF, suggests that of these 12 million additional passengers, in 2015, 0.5 million (or about 4.2%) will be business passengers. By 2030, this figure is expected to have risen to approximately 1.5 million (or about 12.5%). On the other hand, the OEF report notes that business travel is expected to make up nearly half of Heathrow’s passenger traffic in 2015, and somewhat more than half by 2030, under the assumption of maximum use of existing capacity. Relating these predictions to the additional capacity that mixed-mode operation
4.504.1/The economics of Heathrow expansion February 2008 18

would allow for, the report arrives at a figure of about 5.5 million additional business passengers in 2015 and 7 million by 2030 (p71). The report states:
BA have told us that as well as allowing some improvements to frequency on existing routes, mixed mode operations would allow more destinations to be served from Heathrow, including long haul destinations not currently served from anywhere in the UK which might otherwise be operated from continental hubs instead. These new routes would be expected to have a mixture of business and non-business use, while additional frequency on existing routes is likely to make them more attractive to business passengers by adding flexibility in scheduling (…). We have therefore analysed the potential wider economic impact of mixed mode operation on the assumption that it generates significant additional business traffic as well as non-business use. In practice we have averaged the two approaches discussed above of using fixed underlying demand results or using the business share of existing capacity use, leading to an assumption of 3 million additional business passengers by 2015, rising to 4.3 by 2030 (p71).
Table 3 shows the figures resulting from the two different approaches, and their average which OEF assumes as the basis of its forecasts.
Table 3 Impact of mixed-mode operation on passengers (in millions)
2015 2030 Additional passengers 12 12 Of which business passengers
DfT estimate 0.5 1.5 Similar share as in current use 5.5 7
OEF assumption 3 4.3 Source: Figures taken from OEF (2006). The quantitative effect on the predicted economic impact of OEF’s assumption regarding additional business use is substantial. For example, in 2015 the proportion of business passengers among the additional passengers is assumed by OEF to be six times higher (3 million versus 0.5 million) than the level shown by DfT’s estimate. All the arguments put forward by OEF against the DfT estimates are included in the excerpts quoted above. Taken as a whole, we do not feel that they are sufficient to demonstrate that OEF’s estimates are more plausible. The additional flexibility offered to business passengers by additional services on existing routes should already be captured by the underlying demand included in DfT’s estimates. In addition, while it may be true that adding runway capacity will to some extent encourage inward business investment and allow businesses to operate more efficiently, such impacts themselves need to be demonstrated by
4.504.1/The economics of Heathrow expansion February 2008
19
the OEF model, rather than being assumed from the outset and rather arbitrarily quantified in terms of additional business passengers. We have not been able to establish precisely the implications of the growth in business passengers assumed by OEF for its estimates of the economic impacts of mixed-mode operation, as measured in GDP terms. From the report, it can be understood that business passengers are seen as the main driving factor of wider economic impacts. Hence, it may be expected that if the predicted number of new business passengers is doubled, then the estimated wider economic impacts will also be approximately doubled. Given that for 2015, the number of additional business passengers may be only one-sixth of the number assumed by OEF, and for 2030 just over one-third as many, we can conclude that the OEF report may well overestimate the wider economic impacts of mixed-mode operation by a factor of 3 or more.
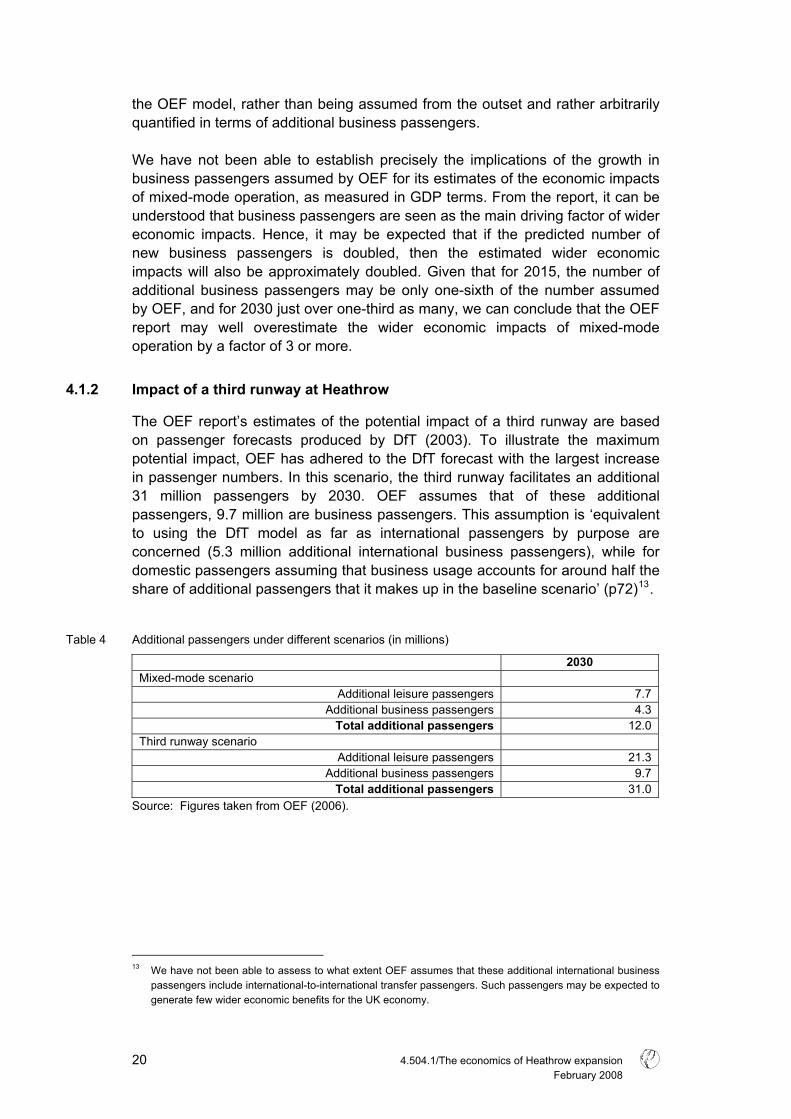
4.1.2 Impact of a third runway at Heathrow
The OEF report’s estimates of the potential impact of a third runway are based on passenger forecasts produced by DfT (2003). To illustrate the maximum potential impact, OEF has adhered to the DfT forecast with the largest increase in passenger numbers. In this scenario, the third runway facilitates an additional 31 million passengers by 2030. OEF assumes that of these additional passengers, 9.7 million are business passengers. This assumption is ‘equivalent to using the DfT model as far as international passengers by purpose are concerned (5.3 million additional international business passengers), while for domestic passengers assuming that business usage accounts for around half the share of additional passengers that it makes up in the baseline scenario’ (p72)13.
Table 4 Additional passengers under different scenarios (in millions)
2030 Mixed-mode scenario
Additional leisure passengers 7.7 Additional business passengers 4.3
Total additional passengers 12.0 Third runway scenario
Additional leisure passengers 21.3 Additional business passengers 9.7
Total additional passengers 31.0 Source: Figures taken from OEF (2006).
13 We have not been able to assess to what extent OEF assumes that these additional international business
passengers include international-to-international transfer passengers. Such passengers may be expected to generate few wider economic benefits for the UK economy.
4.504.1/The economics of Heathrow expansion February 2008 20
The third-runway forecast of 9.7 million additional business passengers appears high alongside the assumption for mixed-mode operation of 4.3 million additional business passengers, while the total number of additional passengers under this scenario was estimated to be 12 million. In our opinion, the difference of 5.4 million business passengers between the mixed-mode scenario and the third-runway scenario could only possibly be justified in terms of one or more of the following three effects. First, the 13.6 million additional leisure travellers under the third-runway scenario over and above those predicted under the mixed-mode scenario might bring about wider economic benefits and thereby incentivise more business travel. Second, there might be substantial latent or suppressed business demand under the mixed-mode scenario that could account for the additional growth in business passengers under the third runway scenario. Third, the flexibility of a third runway might allow for a very different network (more frequencies and more destinations served directly) which would reduce the generalised costs of air travel to such an extent that 5.4 million additional business passengers were attracted. In our opinion, none of these factors in itself could justify the difference of 5.4 million business passengers. Moreover, we believe that even a combination of these factors could not produce an effect of this order. First, leisure travellers do not induce substantial wider economic benefits, as noted by the OEF report (p74). Second, under the mixed-mode scenario there is substantial new capacity that is filled by leisure passengers. If there were significant latent demand among business passenger they would be able to outbid leisure passengers for these tickets. Third, while a wider network might bring some benefits that would attract additional passengers, we believe that this effect would not be of this order. We stress however that these three arguments are intuitive and that we have not carried out additional quantitative analyses to back them up. Finally, it should be noted that the wider economic impacts as calculated by OEF ‘illustrate what the range of impacts might be’. The reason is that OEF has carried out its calculations on the assumption of ‘an impact on passenger numbers on the same scale as the largest impact shown in the DfT projections for the various scenarios they modelled’ (p72).
4.1.3 Diminishing returns to airport capacity
The figures presented by OEF also illustrate the diminishing returns of increasing airport capacity. The predicted GDP impacts per additional (business) passenger are clearly higher under the mixed-mode scenario than under the third runway scenario or under a scenario involving full implementation of the White Paper proposals. Thus at each stage a bigger and bigger increase in passengers is needed to yield the same increase in GDP.
4.504.1/The economics of Heathrow expansion February 2008
21

Table 5 GDP impacts in 2030 under different scenarios
Additional passengers (in millions)
GDP (£bn, 2005 prices)
GDP per additional
passenger (£)
Mixed-mode scenario Leisure 7.7
Business 4.3 950 Total 12 4.1 340
Third runway scenario Leisure 21.3
Business 9.7 740 Total 31 7.2 230
Full implementation of White Paper proposals
Leisure 40.5 Business 17.5 770
Total 58 13.5 230 Source: Based on figures from OEF (2006). Note: For the numbers in the GDP per additional passenger column, total GDP impact has been
divided by either the number of additional business passengers, or the number of additional total passengers.
Note that diminishing marginal economic benefits are in line with what can be expected. Those who expect high economic benefits to result from their trips will have a high willingness to pay and will be able to outbid those who derive less economic advantage from flying. But increasing airport capacity will also allow those whose trips will deliver lower economic benefits to fly.
4.2 Implications at passenger level
In section 9.5 of the OEF report, the predicted wider economic impacts of expansion of airport capacity are related to the additional passenger numbers forecasted. For the scenario based on the full implementation of the White Paper runway proposals, the estimated impact on GDP is corrected for the assumed growth in GDP up to 2030 to enable comparisons with other per capita measures. It is thereby estimated that these proposals would imply a benefit of around £ 120 per additional passenger. Since OEF expects only business passengers to generate these benefits, it is more logical to present them in terms of wider economic benefits per additional business passenger (as OEF also does), which gives a figure of £ 400 per additional business passenger.
4.504.1/The economics of Heathrow expansion February 2008 22
The report then compares this number with a consumer surplus of ‘perhaps £ 30’ per additional passenger, which it derives from DfT’s estimates of economic benefits (DfT 2003)14. DfT has calculated the economic benefits by applying the ‘rule of half’ based on the average willingness to pay of additional passengers, assuming the demand curve is approximately linear over the relevant range. The measure of consumer surplus is of course not the same as the wider economic benefits as estimated by OEF. Nonetheless, in light of the £ 30 consumer surplus figure the OEF figure of wider economic benefit of £ 120 per additional passenger (or £ 400 per additional business passenger) appears remarkably high. The OEF report argues that companies would not be prepared to pay for employees to make trips, or to pay their salaries while on those trips, if they did not expect the trips to generate sufficient value for the company in some form or other. The report then goes on to discuss the potential size of such benefits for the employer. Yet even though this point may be valid, it is not in itself a sufficient explanation of the high predicted level of wider economic benefits as compared to the predicted consumer surplus (which is directly related to the consumer’s willingness to pay). Any benefits accruing to an employer from a business trip should be captured by the employer’s willingness to pay for the ticket, as accounted for in the measure of consumer surplus. As the figures OEF gives for wider economic benefits are much larger than the average consumer surplus figure of £ 30, they seem to imply that there are positive externalities to aviation that are much larger than the benefits to the consumers of air travel. This casts doubt on OEF’s claim that:
This sort of argument at least suggests that the wider economic benefit estimates from our model simulations are consistent with plausible analysis from other perspectives about the additional value of a business trip by air (p75).
14 We have not been able to locate the precise rationale for this figure of £ 30 in DfT (2003). However, given
OEF’s reference to this source, we do make one observation regarding the calculation of direct economic effects in it. In its Annex C, DfT describes in some detail the background of its estimates of the direct economic benefits of increased airport capacity and also provides estimates of these benefits under various scenarios. It is unclear to us why DfT has included additional air passenger duty (APD) payable to the Government from the use of additional airport capacity as a direct economic benefit. Generally, such taxes and charges paid for by nationals to their government are considered as transfers from one party to another, not affecting the national benefits. The government receives a higher income, but its citizens pay for this. These effects cancel out, and hence charges and taxes are generally excluded from the calculation of direct economic benefits (except in the case of payments from foreigners or to foreign governments). In the exemplary calculation provided by DfT, the income from APD accounts for over one-third of the direct benefits. Not including APD in the economic benefits would lower the cost/benefit ratio of a new runway at Stansted as calculated by DfT from 3.31 to 2.08 (see DfT (2003) pp78 - 79).
4.504.1/The economics of Heathrow expansion February 2008
23

Indeed, in our opinion wider economic benefits per additional passenger of the magnitude posited by OEF are implausible, since they would require there to be extensive positive externalities to aviation for which the consumers of aviation were not willing to pay.
4.3 Congestion costs
In Chapter 10 of the OEF report, the costs of congestion in UK aviation are discussed and quantified. The report refers (p78) to an internal analysis by British Airways (BA) that estimated the cost per minute of delay at £ 21.80 for 2002, which corresponds to £ 23.40 in 2005 prices. Based on this and the average delay per flight at airports, the total annual direct cost to all airlines of delays at Heathrow is estimated by OEF at £ 185 million in 2005 prices. Total direct costs for all airlines at all UK airports are estimated at £ 666 million in 2005 prices. While OEF considers that these estimates probably understate the true cost of congestion at airports, we believe them to constitute an upper limit, for four reasons. First of all, it is unlikely that BA’s cost per minute is representative of all airlines and all airports in the UK. BA has relatively large aircraft and relatively large crews compared to other airlines that do not fly intercontinental routes and that provide fewer on-board services15. Second, not all delays are caused by limited airport capacity. Delays may also be caused by passengers turning up too late or not at all (so requiring their luggage to be offloaded), by adverse weather conditions and by industrial action (even in other countries). £ 297 million of OEF’s estimate of the congestion costs for 2005 is attributed to delays at airports other than Heathrow, Gatwick, Manchester or Stansted. Were these costs due to limited capacity or might there have been other reasons? Third, these estimates are unlikely to represent net direct costs to airlines. OEF also notes (p78) that some delays may be built into airlines’ schedules as an expected part of their planning. This does not mean that they incur no expenditures related to the costs of built-in delays, but they are likely to have incorporated an allowance for the costs of such delays into their pricing strategy as well. So the costs of delays fall in part on the passengers. For these reasons, we expect the actual costs of congestion to airlines as a whole to be lower than estimated in the OEF report.
15 Nonetheless, using the BA figures may give a reasonable estimate of the order of magnitude of the costs of
congestion.
4.504.1/The economics of Heathrow expansion February 2008 24

The report also provides (p81) an estimate of the UK-wide costs of congestion to scheduled air passengers (£ 1,049 million for 2005) and points out that there are other, wider impacts of congestion. These wider impacts are said to relate to delays ‘eat(ing) into travellers’ social time, delaying holidays and leading to frustrated tourists finding themselves stuck at airports’ (p81). However, while tourists may indeed become frustrated with long delays at airports, OEF’s presentation of this as an additional impact ignores the fact that it is already accounted for in passengers’ valuation of time as used in the estimation of these costs. In addition, the reason for passengers finding themselves stuck at airports is unlikely to be congestion due to lack of airport capacity. In addition, the OEF report notes that congestion also entails indirect costs. ‘For a single airline these will include such things as the loss of future business that arises as a result of customer frustration with delays’ (p79). However, if one airline loses business for this reason, the lost business is likely to be picked up by other airlines (as OEF also concedes), and so will not pose a net cost to the sector as a whole.
4.4 Other issues
In this section we briefly discuss several issues that have not been addressed so far.
4.4.1 Reliability of model used
The OEF report notes that:
The model includes freight usage in tonnes as well, but for simplicity and in order to avoid presenting what might otherwise be an overstatement of effects, all scenarios assume that there is no appreciable impact on freight (p70).
The implications of the second part of this remark are not straightforward. Does it mean that the model overestimates impacts on passengers and to compensate freight has not been modelled? Although in the course of the present study we have not been able to assess the model used by OEF, it is unclear to us how a reliable model would lead to an overstatement of effects if both passenger and freight traffic were modelled correctly.
4.4.2 Efficiency increases in the aviation sector
Between 1998 and 2004, according to the OEF report, the number of passengers at UK airports increased by more than 30%. Nonetheless, the number of employees of airlines, airport operators, ground services and air traffic control centres is said to have fallen from 103,000 to 94,000 over the same period (p14). It is unclear whether OEF expects this efficiency increase to continue, and if so, how its model has accounted for this.
4.504.1/The economics of Heathrow expansion February 2008
25

4.4.3 Presentation
OEF’s figures for wider economic benefits indicate what the potential impact of the different scenarios could be, but are of limited value in that they only present the maximum possible benefits and do not provide estimates of the wider economic impacts under the most plausible assumptions. While the report does acknowledge this (p72), it does not become directly clear from a reading of the executive summary or the key points given at the start of Chapter 9. For example, the executive summary (p7) states: ‘A third runway at Heathrow would generate wider economic benefits estimated at £ 7 billion additional GDP a year in today’s prices by 2030.’ It is true that the summary acknowledges that there are uncertainties regarding the assumptions and that therefore this and other figures should be regarded primarily as illustrative, but it does not make clear that the estimate illustrates ‘what the range of impacts might be’ (p72).
4.5 Conclusions
Estimates of the wider economic impacts of airport expansion are particularly sensitive to underlying assumptions regarding the additional business passengers that will be attracted, as OEF acknowledges. This is especially significant, given that OEF’s business passenger growth assumptions deviate substantially from DfTs forecasts. In particular, OEF assumes that the mixed-mode scenario will lead to an increase in business passengers by 2015 six times as great as that estimated by DfT. Given the sensitivity of the prediction of wider benefits to this particular assumption, and the fact that OEF’s figure is so distinct from DfT’s expectations regarding future business use of aviation, it is unfortunate that OEF conducted no sensitivity runs. Together with the actual assumption made, the results of such analysis would have provided a much better illustration of the potential (range of) economic benefits. For the full implementation of the Government’s White Paper proposals, OEF has estimated wider economic benefits of the order of £ 400 per additional business passenger. OEF attempts to explain this rather large figure and the discrepancy between it and the estimate (based on DfT figures) of a £ 30 consumer surplus per additional passenger. In our opinion, however, the explanation provided by OEF is insufficient. In fact, it would be remarkable if air transport had such substantial external effects over and above the benefits that accrue to the users of air transport themselves and which are reflected in their willingness to pay. For example, the benefits that would accrue to a business passenger’s employer would be traceable in its willingness to pay, and hence not be part of the wider economic benefits but of the consumer surplus. Moreover, if the consumer surplus of business passengers really was of the order of £ 400 per passenger, it is unlikely that they would refrain from flying even if airport capacity were not expanded. Instead, their demand could be expected to price out leisure travellers from available flights, and airport expansion would consequently not be required to cater for business passenger demand.
4.504.1/The economics of Heathrow expansion February 2008 26

It should also be noted that the figures as presented by OEF are illustrative, ‘providing the range of potential impacts’ and are not best estimates based on the most likely future scenarios. The OEF report briefly describes the model that has been applied to estimate the wider economic impacts. Given the admission that impacts from additional air freight are not included to avoid what might otherwise be an overstatement of effects, more details of the model would have been welcome. In general, not modelling part of the market because this might lead to an overestimate of the economic impact is not an approach that inspires confidence either in the model applied or in the results that are obtained. OEF argues that its estimate of the cost of congestion to airlines at UK airports is likely to be an underestimate. We believe however that it is likely to be an overestimate, since BA’s costs per minute’s delay (on which the estimate is based) are likely to be higher than those of airlines with smaller aircraft and/or smaller flight crews, and since not all delays are due to airport congestion. Moreover, since a proportion of the costs incurred as a result of delays will be expected and will have been incorporated into airlines’ pricing strategies, these costs will in part be recovered and will not represent net costs to the airlines concerned.
4.504.1/The economics of Heathrow expansion February 2008
27

4.504.1/The economics of Heathrow expansion February 2008 28

5 Specific impacts and issues
In this section we discuss some of the specific indicators of potential wider economic benefit presented in the OEF report.
5.1 Treatment of taxes and subsidies
The aviation industry is of course liable to taxation, as are economic activities in other sectors in the UK. The OEF report presents in detail the contribution of the aviation sector to the UK’s public finances (pp19 - 20), listing income tax, national insurance contributions, corporate taxes and air passenger duties16. The total contribution to the Exchequer in 2004/05 is given as £ 3.55 billion. With the exception of air passenger duties, the counterfactual economic activity would also have been liable to the same tax measures and would thus have led to a similar contribution. Had passengers not spent their money on aviation, they would have spent it on something else. In that event, a large part of the money no longer contributed by the aviation sector would still have ended up at the Exchequer through income tax, national insurance contributions and corporate taxes. Nonetheless, the total tax revenue from the aviation sector does provide an indication of the sector’s size. To give a truer account of the impact of aviation on the national budget, the figures for taxes and charges paid by the aviation sector could have been set against the subsidies and other forms of government support that are paid to the sector, something that the OEF report does not attempt. In general, this support may include government expenditure on relocation programmes associated with noise exposure; on government personnel working in aviation-related jobs; on airport infrastructure and infrastructure supporting surface travel to and from airports; on research and development subsidies; on university research on aviation; and so on. The so-called hidden subsidy of not taxing aviation fuel could also have been quantified. Finally, given the fact that UK tourists spend more money overseas than foreign tourists spend in the UK (see also section 5.3), it might also have been appropriate to include the VAT forgone as a result of this imbalance. It should also be noted that the sector’s contribution to public finance is not a benefit additional to the earlier indicators presented by OEF, but is merely a different way of expressing the same effect. There is a direct relation between the number of employees in the aviation sector and the value added by it on the one hand, and the national insurance contributions, income and corporation tax that it pays on the other. Using different statistics to indicate the size and importance of the sector may be useful if there is no single indicator that can give an exact measure of its size and importance, but presenting the same information in a
16 It also shows, interestingly, that airport operating income from commercial activities surpasses that from
traffic-related activities.
4.504.1/The economics of Heathrow expansion February 2008
29

slightly different manner several times may mislead the reader into thinking that the overall impact of the sector is much greater than it really is.
5.2 Social impacts
The OEF report argues (p22) that the indicators it presents for employment, GDP, productivity, investment, tax contributions and balance of payment17 do not capture the full contribution of the aviation industry because, ‘like most industries, it also generates significant additional non-market benefits for its customers and because there are significant indirect welfare benefits to non-customers.’ Five examples are provided: 1 Cheap and frequent flights have brought overseas holidays and travel within
reach of most of the population. 2 The aviation industry plays an important role in maintaining contact between
UK residents and their friends and relatives elsewhere in the world. 3 The aviation industry has expanded the choices available to the consumer, by
helping to make available a wider range of products (e.g. foods) and culture. 4 Aviation facilitates immigrant labour. 5 The country’s excellent air transport links have helped the UK to win the bid
for the 2012 Olympics. While we do not contest these impacts in themselves, we do question, with the exception of the last example, whether these examples indeed substantiate additional non-market benefits. In general, the price consumers are willing to pay for economic goods is below the utility they expect to derive from those goods. The difference between the price paid and the utility derived is the consumer surplus. In this case, the economic good is air transport. The aviation sector is probably one of the sectors best able to prune away consumer surplus. Prices are differentiated to a high degree and there are many different ticket prices that apply to one single flight, dependent on the class in which one travels, the moment the ticket is purchased, the flexibility of changing the ticket etc. With regard to the examples listed above, passengers are willing to pay the ticket price asked precisely because air travel enables them to reach their holiday location or their relatives abroad. Similarly, freight shippers are willing to pay the tariffs charged because they know UK residents are willing to pay a particular price for the goods they import. These benefits are thus to a large extent captured by the value added of the aviation industry. The same holds for immigrant labour: immigrants are willing to pay their ticket price because of the salaries they expect to earn in the UK. However, this example is interesting in another way. If there is really a value to the UK in attracting immigrant labour, this can only be because of a shortage on the labour market - which would mean that there was no structural unemployment in the UK. 17 Not all have been discussed here.
4.504.1/The economics of Heathrow expansion February 2008 30
This would strengthen the argument that the number of jobs in the aviation industry is not a valid indicator of the importance of the sector. If some aviation employees were to lose their jobs, they would be able to find employment elsewhere.
5.3 Tourism
The OEF report discusses how aviation supports tourism. Three of the four key points presented in the report (p24) are as follows18: • The UK tourism industry directly contributes nearly 4% of GDP. • Spending by visitors who arrive by air is equivalent to 1.1% of GDP and
generates around 170,000 jobs in the UK. • Air services allow UK tourists to enjoy a wider range of overseas holidays
than would otherwise be accessible. Obviously, the 4% figure is not directly related to aviation, as it includes domestic tourism (as well as business trips and family visits which would not normally be perceived as tourism)19. Clearly, aviation affects tourism in two opposing ways. On the one hand, as the report notes, aviation brings in foreign tourists who spend money in the UK, which in turn creates jobs. The report goes on to detail the indirect and induced impacts of tourism and travel. However, the mirror image of this phenomenon is the money spent by UK tourists abroad that would otherwise to a large extent be spent in the UK itself20. The report notes that the ‘growth in UK air travel abroad has outstripped that in overseas visitors’ air travel to the UK’, increasing the gap between the spending of overseas visitors in the UK and UK visitors abroad, so that UK ‘tourism spending abroad is now more than twice foreign spending in the UK, with the difference equivalent to around 1.5% of GDP’ (p27). The report notes that reducing consumer choice to try to help ‘cure’ this trade deficit would be a strange prescription. While this observation may be correct, it appears somewhat besides the point. A more pertinent question would have been whether the contribution of tourism to the UK economy is a reason not to restrict airport capacity. ECI (2006, p46) concludes that an expansion in air travel cannot be justified on the grounds of the economic benefits of tourism. Moreover, OEF considers that rather than the current account deficit being a structural problem, ‘the increasing number of UK outbound tourists is a reflection of the combination of improving living standards, the reduction in the cost of
18 The fourth is that increased air transport capacity is likely to be needed if the Government is to achieve its
objective of the UK tourism industry growing by a third by 2010. 19 It is not clear why this is presented by OEF as one of the key points. Even if the 4% figure were directly
attributable to aviation, it would still not be a measure of how aviation supports the economy, but rather of how tourism supports the economy.
20 ECI (2006, p52) notes that in the six months after the terrorist attacks in 2001, people’s reluctance to fly meant that the money lost from overseas tourism was actually outweighed by an increase in domestic spending by UK residents.
4.504.1/The economics of Heathrow expansion February 2008
31

aviation travel and the expansion in the number of destinations served’ (p27). Even though these points are true enough in themselves, in our view they do not make the deficit any less of a structural problem. The note of caution already sounded with regard to the risk of double counting the figures for indirect and induced impacts and the detailed analysis further on in the OEF report can be illustrated most clearly by the section on tourism. Earlier in the report, the taxes and charges paid by the aviation sector to the Exchequer are detailed, as are the impacts in terms of money spent at airport hotels and retailing outlets. In the tourism section, however, it is specifically mentioned (p30) that each UK tourist travelling abroad contributes about £ 50 in taxes and that outbound tourists also spend at UK airports when travelling abroad.
5.4 Trade, business efficiency and economic growth
The OEF report focuses on the positive effects of aviation on other sectors, and discusses in separate chapters how air services support trade (Chapter 4) and how they support business efficiency and economic growth (Chapter 8). We discuss these impacts together because we feel they are so intertwined they cannot be clearly separated. The report discusses how aviation allows companies to serve markets outside the UK. Clearly, UK companies will benefit from trade and in particular from export trade. As Chapter 8 of the OEF report says:
Perhaps the most direct advantage which air transport brings to businesses (…) is that it allows them to serve a bigger market. Air transport means trade with distant markets is easier and cheaper, and the goods can be marketed on a global basis (p62).
However, these benefits to the UK economy of exports are mirrored to a large extent by the opportunities given to foreign companies exporting to the UK. Additional imports to the UK will replace UK-produced goods which would otherwise have been sold on the domestic market. UK companies’ exports are only one side of the equation determining the overall economic benefit of international trade to the UK. This situation is in part acknowledged by OEF:
While not necessarily viewed as positive by individual companies, increased competition is a significant benefit for consumers and economic performance more generally. It drives down prices and encourages improvements in the quality of goods as UK firms face increased pressure from foreign rivals (p62).
4.504.1/The economics of Heathrow expansion February 2008 32
Yet the notion that increased trade may have a downside for some firms is not mentioned in Chapter 4 on trade, which does however discuss the importance of aviation for imports and of imports for the economy, noting that:
It is not just consumers who benefit from the importing of cheaper products from elsewhere or the availability of a wider range of goods and services. The same applies to producers, who are able to operate more effectively if they can source inputs from a variety of places around the world according to where they are produced most efficiently (p38).
However welcome this flexibility may be to producers, it will also have a negative impact in that inputs imported from overseas will to a large extent replace UK-produced inputs. In the end, a wider market, lower transport costs, economies of scale and increased competition will provide benefits to society21 in the form of efficiency gains delivered through further specialisation, but the economic value of this will lie in efficiency gains and not in the quantity of imports and exports themselves. Precisely these issues are addressed in Chapter 8 of the OEF report. The enlarged market is said to spur innovation, ‘presumably because the costs of innovation can be spread across a greater number of potential sales’ (p62). In general, however, these efficiency gains are to a large extent22 expressed by the willingness to pay for air transport. It is unclear to what extent there are additional benefits over those that have been discussed earlier in the OEF report. Moreover, with ‘world trade persistently growing more rapidly than global GDP’ (p32), it may be argued that international trade shows diminishing marginal returns. Further growth of world trade may be expected to induce a further diminution in the rate of growth of GDP.
5.5 Investment
Chapter 5 of the OEF report discusses how aviation supports investment. Although it may be true that ‘aviation services’ play a role in investment decisions, it is not clear to what extent this impact is additional to, rather than part of, the wider economic impacts via facilitation of international trade and business efficiency that are noted elsewhere.
21 Provided there are no substantial negative externalities. 22 With the exception of the external knowledge spillovers that may occur.
4.504.1/The economics of Heathrow expansion February 2008
33
Airports can play a role in investment decisions. To a large extent this involves businesses locating near an airport, instead of elsewhere in the UK. The OEF report notes that:
Access to air services also influences companies’ decisions on where to invest within the UK. Indeed, this effect appears to be of even greater importance than the impact on the country in which firms choose to locate (p46).
The OEF report refers to the Healey and Baker European Cities Monitor, noting that London is already ranked ‘first out of 29 European cities for its ‘transport links with other cities and internationally’ as well as for ‘easy access to markets, customers and clients’, and continues to be rated the best city in which to locate a business today’ (p42). One may ask oneself what additional effects could be expected from adding further to the capacity of London’s airports.
5.6 Conclusions
In keeping with its terms of reference, OEF has reported extensively on all potential wider economic impacts aviation might bring about. These impacts are to a large extent intertwined and should not be interpreted as being additive. They are incorporated in the estimate of wider economic effects of aviation provided in Chapter 9 of the OEF report. We have a number of observations about the treatment of specific sectors and impacts. First of all, in the treatment of the taxes and charges paid by the sector, a comparison with a counterfactual scenario would have been welcome. Also, given that British outbound tourists spend more money overseas that foreign inbound tourists spend in the UK, a discussion of the VAT forgone as a result of this imbalance would have been appropriate. Finally, a fuller picture would have been given if the subsidies (including hidden subsidies) received by the sector had also been presented. The report argues that aviation has substantial wider social impacts on top of its direct impacts. However, we doubt whether the examples provided are indeed wider social impacts that would not be captured by the willingness to pay for a ticket, and would hence be considered as part of the consumer surplus. One of the examples presented by OEF relates to aviation facilitating immigrant labour. This argument runs counter to one of the main supposed benefits of aviation, in that if it is accepted that immigrant labour brings social benefits, this must imply that there is no situation of structural unemployment in the UK. The consequence of this is that the number of jobs created by aviation becomes irrelevant as a benefit. Some of the figures the report presents for the tourism sector are not directly related to the aviation sector. Also, while the report notes that aviation’s benefits include enabling UK citizens to holiday abroad, and bringing in income from foreigners visiting the UK, it makes little of the UK’s current account deficit (the
4.504.1/The economics of Heathrow expansion February 2008 34
fact that UK tourists spend more money overseas that foreign tourists spend in the UK), which it acknowledges but does not regard as a structural problem. We believe that the report should have concluded that income from tourism is not a reason to expand airport capacity. OEF discusses separately the impact of aviation on investments. However, it is hard to see how the presumed wider economic effects of investments could materialize outside of increases in trade, business efficiency and economic growth. The report emphasises that access to good air transport links is one of the factors that can guide the location of new investments; however, it should be noted that London is already ranked number one in Europe for ‘its transport links with other cities and internationally’ (p42). Moreover, the report acknowledges that access to air services is of greater importance to companies’ decisions on where to invest within the UK than to their decisions on whether to invest in the UK or in another country.
4.504.1/The economics of Heathrow expansion February 2008
35

4.504.1/The economics of Heathrow expansion February 2008 36
6 Methodological issues
6.1 Survey results
Some of the results presented in the OEF report are based on a survey sent out to 6,000 UK companies. In annex A of the report, however, it is made clear that only 165 companies replied to the questionnaire, a response rate of less than 3%. The report remarks that, although 3% is a low figure, ‘statisticians generally regard 50 responses as representing a reasonable sample on which to base analysis, regardless of the size of the population from which the sample is drawn’ (p87). A crucial part of this argument is that the sample must be drawn from the population, i.e. must be a random sample of the population. However, this was not the case with OEF’s survey, since it was the companies themselves who decided whether to reply to the questionnaire or not. There may be reason to expect some bias in the sample of companies who chose to respond, since, given the subject of the survey, companies with little or no dependence on air transport may have decided not to fill it out. Such companies would thus be underrepresented in the sample, and the importance of aviation to UK business could thereby be overestimated. OEF argues that since the characteristics of the companies responding offer a fair spread, there is no reason to suspect a bias, or to doubt that ‘a good cross-section of effects is covered by the survey’ (p87). However, respondents being ‘widely spread across both sectors and company sizes’ does not necessarily imply a spread in line with the actual population, and so we doubt that OEF’s sample can be safely concluded to be representative of UK companies as a whole. In addition to the possibility that OEF’s survey results are not representative of UK business, it has also been suggested by some researchers that surveys in general are not the best way to assess the importance of location factors, which were among the subjects investigated by OEF’s survey. For example, NYFER (2000, p84) remarks that ‘especially in terms of assessing the quantitative impact of a particular factor determining the location of a business, surveys and the factor cost approach have shortcomings’23. One problem is that the individuals who complete questionnaires on their companies’ behalf may not be completely informed about all the aspects covered by the survey. Given the broad range of the questions in OEF’s survey, it is quite possible that some responses may be less reliable for this reason.
23 Translation by CE Delft.
4.504.1/The economics of Heathrow expansion February 2008
37
Secondly, there is a psychological phenomenon know as the focusing effect: a cognitive bias that occurs when people ascribe too much influence to one aspect of a situation. Given the fact that the OEF survey was solely concerned with the effects of aviation, it is possible that respondents ascribed more influence to these effects than they would have done in a survey that also mentioned other factors that are important to a company. Finally, and most importantly, there is often a difference between stated and revealed preferences. Respondents may indicate that something is important to them, but show little evidence of it when making real-life decisions. Barkley and McNamara (1994) have indicated that the link between stated preferences and actual location of businesses is rather weak; analysing the same data, NYFER (2000) concludes that managers’ choice of location is barely better than random (they liken it to ‘throwing a dart’).
6.2 Data treatment and assessment
OEF carried out a number of statistical and econometric analyses and the report gives the outcomes of these. Our comments with regard to these analyses and how the results should be interpreted are grouped under several headings: 1 Correlations and causal relations. 2 Statistical significance. 3 Data mining.
6.2.1 Correlations and causal relations
There is an important difference between correlations and causal relations. A correlation between two variables does not imply that a change in one variable will cause changes in the other variable. It may well be that a correlation between two variables is caused by a third, underlying variable. For example, there will be a correlation between shoe sizes and reading skills among children, but it will be clear to anyone that there is no causal relationship. In general OEF appears to take care not to mix up correlations and causal relations. For example the report says that aviation ‘contributes’ to GDP, that increases in connectivity (relative to GDP) are ‘associated’ with an increase in the level of fixed investment in the long run, and so on. However, page 45 of the report states that there is econometric evidence ‘that air transport usage has an effect on the level of business investment’, which seems to imply a causal relation - although on the basis of the discussion in the report, we cannot determine whether this is indeed the case. It is somewhat ominous that this conclusion is based on OEF research that is stated to have ‘essentially involved looking for correlations between air transport usage and business investment’. Clearly, research into correlations cannot of itself determine the existence of causal relations.
4.504.1/The economics of Heathrow expansion February 2008 38

6.2.2 Statistical significance
For a result to be statistically significant means that there is a very small probability that the outcome has occurred by chance. The probability of a given outcome occurring by chance generally needs to be no more than 1 in 20 to say that the result is statistically significant. If a result is not statistically significant, it is generally not used to substantiate a conclusion. It should also be noted that the fact that an effect is significant in statistical terms does not necessarily mean that is a large effect: when using a large data set, a small effect can be statistically significant (i.e. unlikely to be due to chance), but that does not imply that it will be very influential in practice. Conversely, small data sets often do not contain sufficient information to infer statistically significant conclusions. For most of its analysis, the OEF report states whether results are statistically significant or not. On page 50, the correlation between sector growth and spending on air transport services per employee is discussed. The report states that ‘the relationship with sectors that have seen the most rapid growth over the past ten years is rather less clear than before, with a correlation coefficient of 0.17 compared with 0.35 in 1999’. On the basis of the data provided in Annex B of the OEF report, we were able to test the statistical significance of the estimated correlation coefficient of 0.17 (see Annex A of this report). We were also able to estimate the correlation coefficient based on a normal correlation instead of the rank correlation used by OEF. Rank correlations are generally used if variables are only available at the ordinal level (e.g. because they could not be measured on an interval scale) or in cases where there is reason to assume that the relationship between the variables is not linear. Since the data used are available on an interval scale and we see no reasons to assume substantial non-linearity, a normal correlation would appear to have been a more appropriate means of calculating the coefficient24. Our estimate for the normal coefficient was 0.07. In fact, we found that neither of the correlations was statistically significant.
6.2.3 Data mining
In econometric analysis, one should be very careful to avoid data mining, ie sifting through data to try and find a significant result. This approach is only defensible when controlling for the number of tests that is done. When performing a large number of tests without controlling for this, the chances are that in time one of the tests will turn up a significant result, even though this outcome may well be the result of chance. The more tests one does, the higher the likelihood of encountering an apparently significant result that is due to chance.
24 There may have been other good reasons to opt for a rank correlation outside our knowledge, but these
were not put forward in the OEF report.
4.504.1/The economics of Heathrow expansion February 2008
39
It is not clear from the report how OEF has controlled for this phenomenon. For example, Annex C mentions (p96) that ‘Having explored the impact of using the various weighting schemes, the spending per head weights (expressed relative to the all industry average) gave the most plausible results’. This kind of data exploration should generally be controlled for. Against this background, OEF’s results on connectivity and transport usage appear in a different light. The report states (p96) that the analysis indicates that there is a positive (and significant) relationship between business usage of air transport services and GDP, through sectoral productivity. In contrast, as the report notes, the analysis for the 1999 OEF report was not able to determine such a relationship. Meanwhile, whereas the 1999 report found a positive relationship between total transport services and trend productivity, the OEF 2006 report could find no statistically significant impact (see Chapter 8 and Annex C of the report). So what was significant in 1999 (the relationship between increases in total transport services and total factor or trend productivity) no longer is in 2006; whereas what was not significant in 1999 (the relationship between air transport usage and total factor productivity) is found to be significant using the 2006 methodology and data. It is in any case illogical that there should be a significant relationship between air transport usage and total factor productivity, without there being a significant relationship between total transport usage and factor productivity.
6.3 Presentation of results
Several further points are worth making with regard to the presentation of results in the OEF report. Of course, as with most subjects, different parties will choose to highlight different results. We do not wish to elaborate on this point too much, for it is up to the reader to extract a balanced view and make up his or her own mind on the results of the report. Nonetheless, some of the data presented in the OEF report would have led us towards opposite conclusions and we briefly mention some examples here.
Will new technologies take over air services? The results of OEF’s survey indicate that 90% of the companies that responded think that electronic communication channels such as video conferencing can be substituted for air travel either ‘to a large extent’ (44%) or ‘somewhat’ (47%)25. In our view this high figure is remarkable and should be taken seriously. However, OEF instead argues that it would be a mistake to conclude from these survey responses that air services will become less important to economic growth in the future.
25 The discrepancy in percentages result from rounding.
4.504.1/The economics of Heathrow expansion February 2008 40

Is the train a substitute for air travel? 22% of those who responded to the survey indicated that they did not regard train services as a substitute for air travel. OEF highlights this result as striking, whereas we would have taken the view that 78% of firms indicating that they did consider the train as at least something of an alternative to air travel was considerably more striking.
Benefits of a third runway at Heathrow Perhaps the most important of these presentation issues has already been mentioned in section 4.4.3. It relates to the statement on p72 of the report that the quantitative estimates of the wider economic benefits of a third runway at Heathrow are based on the largest of the DfT’s projected increases in passenger numbers, in order to illustrate what the full ‘range of impacts’ might be. This means that the figures given represent the upper limit of possible economic impacts, rather than the most likely outcome. This could have been stated more clearly in the presentation of the figures, so as to prevent wrongful interpretations of the results.
6.4 Conclusions on methodological issues
There are a number of methodological issues that are of importance when considering the OEF results. First of all, the results are based on a survey sent out to 6,000 companies and answered by 165 - a response rate of less than 3%. Moreover, it is not unlikely that the responses will be biased, companies that have an interest in good air services having been more likely to respond than others. Further, there are doubts as to whether surveys are the best way to collect information on the importance of location factors, as there is evidence that stated preferences differ substantially from revealed preferences on this issue. Second, we have some questions with regard to OEF’s treatment of data and presentation of outcomes of statistical tests. Correlations and causal relations may sometimes be confused, and tests of statistical significance have not always been included. Finally, in its presentation of the economic impacts, OEF could have made clearer that the figures it gives are indicative of the potential range of impacts, and do not represent a most plausible or best estimate.
4.504.1/The economics of Heathrow expansion February 2008
41

4.504.1/The economics of Heathrow expansion February 2008 42

7 Conclusions on economic benefits
This part of our report has critically assessed a 2006 report by Oxford Economic Forecasting on the wider economic impact of aviation on the UK economy. The OEF report discusses the contribution of aviation to the economy in terms of direct and indirect employment, its contribution to GDP, and how it supports tourism, trade, investment, growth sectors, business efficiency and economic growth. In particular, the overall economic impacts of extending runway capacity at Heathrow are presented for the mixed-mode scenario, the third runway scenario and the scenario of full implementation of the Government’s White Paper runway proposals. With regard to the methodology, outcomes and interpretation of the OEF study we have a number of conclusions.
Employment figures First, figures for a sector’s direct, indirect and induced employment and its contribution to GDP cannot be taken as valid indicators of that sector’s importance for the economy, nor in the case of aviation can they be used to substantiate a claim for expanding runway capacity. In the absence of structural unemployment, if the aviation sector were to offer less employment, people would find jobs in other sectors, albeit possibly at lower wages. Similarly, if people were not able to spend money on aviation, they would spend it in another sector, potentially deriving a slightly lower consumer surplus, but still leading to indirect and induced employment. Not accounting for these alternatives significantly overstates the aviation sector’s importance. For this reason, proper cost/benefit analyses generally quantify the benefits of expanding infrastructure by estimating the increased consumer surplus, which manifests itself predominantly in the time gains new infrastructure allows for. In addition, it should be noted that of OEF’s estimate of 186,000 people (full-time equivalent) directly employed in the sector, 92,000 are ‘aviation-related’. This includes employment related to air cargo handling, and also employment in airport hotels and retailing. It may be argued that the latter are not directly related to aviation. Finally, OEF’s comparisons between figures for indirect and induced employment and UK overall employment are potentially misleading. Such comparisons may not be very meaningful, since overall employment figures include only direct employment. If the direct, indirect and induced employment figures for all sectors in a country are added up, the result is a figure much higher than the total employment in the country.
4.504.1/The economics of Heathrow expansion February 2008
43

Wider economic impacts Following the terms under which its report was commissioned, OEF reports at length on how aviation supports other parts of the economy. Many different indicators of how aviation supports trade, investment, growth sectors, business efficiency and economic growth are presented, but essentially they all relate to much the same process. Aviation opens up new markets, allowing producers to purchase inputs at lower costs and sell outputs on global markets, and possibly enabling economies of scale in the production process. Hence, the global economy becomes more efficient. The economy as a whole clearly benefits, but these benefits are not well expressed by the indicators presented. The wider market on which UK goods can be sold goes hand in hand with an increase in foreign producers selling their products on the UK market, at the cost of locally produced goods and local producers. Irrespective of whether or not globalisation is beneficial for social welfare, its benefits cannot be measured well simply by reference to the level of trade.
The OEF model and underlying assumptions We note some peculiarities of OEF’s model and its underlying assumptions, and the implications of these results for the presumed impacts of expanding runway capacity. A crucial input to the calculations is the number of additional business passengers that runway expansion will attract, because only business passengers are assumed by OEF to generate wider economic impacts. In estimating the impact of mixed-mode operation at Heathrow, OEF assumes that there will be, not 0.5 million additional business passengers in 2015 as forecast by DfT (2003), but 3 million. We do not feel the OEF report provides a satisfactory justification for this assumption. The impact of additional flexibility offered to business passengers by additional services on existing routes should already be captured by the underlying demand included in DfT’s estimates. In addition, while it may be true that adding runway capacity will to some extent encourage inward business investment and allow businesses to operate more efficiently, these wider impacts themselves need to be demonstrated by the OEF model, rather than being assumed from the outset and rather arbitrarily quantified in terms of additional business passengers. The OEF model estimates that the full implementation of the Government’s White Paper runway proposals would deliver an economic impact of around £ 120 per additional passenger or about £ 400 per additional business passenger (since it assumes that only business passengers cause wider economic impacts). This compares to an estimate of a consumer surplus of ‘perhaps £ 30 per additional passenger’ (p74) derived by OEF from DfT estimates. OEF assesses its estimates of £ 120 and £ 400 as ‘consistent with plausible analysis from other perspectives about the additional value of a business trip by air’ (p75). However, the direct economic value of a business trip is already reflected in business passengers’ willingness to pay, and hence in the consumer surplus estimate of £ 30 over all passengers. Assuming that the latter figure is of the right order of magnitude, OEF’s economic impact estimate implies that aviation has very significant positive external effects on the economy, and that these effects are substantially larger even than the value a business passenger (or their employer) derives from their trip. This seems an implausible implication.
4.504.1/The economics of Heathrow expansion February 2008 44
It should also be noted that OEF assumed that all scenarios have no appreciable impact on freight transport, a position adopted ‘in order to avoid presenting what might otherwise be an overstatement of effects’. It is unclear to us how a reliable model would lead to an overstatement of effects if both passenger and freight impacts were modelled as they were expected to occur.
Methodology There are two methodological issues of relevance to the value of the OEF results. First, the results are based on a survey sent out to 6,000 companies and answered by only 165. This implies a response rate of less than 3%. It is not unlikely that the response will have been biased, with companies that have an interest in good air services being more likely to respond than others. Further, there are doubts as to whether surveys are the best way to collect information on the importance of location factors, as there is some evidence that stated preferences differ substantially from revealed preferences on this issue. Second, we have some questions with regard to OEF’s treatment of data and presentation of outcomes of statistical tests. Correlations and causal relations may sometimes be confused, and tests of statistical significance have not always been included.
Presentation Care needs to be taken when interpreting OEF’s results. Although this is not always stated explicitly, the estimates of economic impacts presented are often upper limits, so they indicate the maximum possible economic impact and not the most likely or plausible outcome. For example, the impacts of the third-runway scenario are based on DfT’s highest passenger forecast scenario. A second example relates to OEF’s estimate of the costs of congestion, in itself again an upper limit. It should be noted that only a part of these costs can be related to insufficient runway capacity, and that delays due to queues for security checks, bad weather or industrial action (either in the UK or elsewhere) will not be resolved by expanding capacity. In some instances, OEF presents only part of the full picture. For instance, its figures for taxes and charges paid by the sector would need to be set alongside figures for subsidies received and the size of current tax exemptions in order to give a truer indication of the economic importance of the sector.
4.504.1/The economics of Heathrow expansion February 2008
45

4.504.1/The economics of Heathrow expansion February 2008 46

4.504.1/The economics of Heathrow expansion February 2008
47
Part B
Demand management

4.504.1/The economics of Heathrow expansion February 2008 48 4.504.1/The economics of Heathrow expansion February 2008 48

8 Demand management
8.1 Introduction
One may ask whether demand management or other governmental intervention could reduce the need for expansion of Heathrow airport. The UK Government’s ambitious environmental aims appear to provide a clear impetus for demand management. ECI (2006) recently came to the conclusion that, given the Government’s commitment to reducing carbon dioxide emissions from UK activities by 60% between 1990 and 2050, it will need to explore a policy of managing demand for air travel, potentially including fiscal measures and a communication strategy. Equally, if there are currently circumstances that do not allow for efficient use of existing infrastructure, governmental intervention may be called for to improve efficiency and so reduce the need for expansion. In practice, demand management may be one of the ways the Government could facilitate more efficient use of the existing infrastructure. For example, a proportion of the flights to and from Heathrow are flights from relatively nearby regional airports. The Government could take action to encourage travellers to make such trips by train instead, freeing up capacity for flights for which no alternative exists. Generally, demand management refers to monetary and fiscal policies to influence the aggregate demand for goods or services in an economy. Here we consider the topic in a broader sense, discussing in particular the options of: • fiscal action; • the withdrawal of landing slots for short-distance journeys; and • an allocation of destinations among London’s five airports. A crucial question that needs to be addressed when discussing demand management is whether the benefits, in terms of negative environmental impacts that are prevented, would outweigh the costs in terms of additional economic activity and social welfare that would be forgone. A quantification of the benefits and costs of demand management goes beyond the scope of this report. However, we do discuss several aspects of demand management in qualitative terms. In section 8.2 we discuss the concept of welfare economics, from a theoretical perspective and a policy perspective. In 8.2.3 we discuss the pros and cons of government intervention and in 8.2.4 we focus specifically on the options mentioned above. In section 8.3 we discuss to what extent maximisation of consumer utility should always be the main objective, and whether positional consumption and habitual behaviour may be reasons to deviate from maximising consumer utility. Section 8.4 discusses whether, and if so, how, demand management may affect the benefits of expansion. Section 8.5 summarises.
4.504.1/The economics of Heathrow expansion February 2008
49
8.2 The welfare economics point of view
8.2.1 Theory
Economic activities may lead to negative environmental effects. Aviation, for example, leads to local air pollution and noise exposure, and contributes to climate change. In general, from a welfare economics perspective, economic transactions should be undertaken only if the benefits to society outweigh the costs to society. In everyday life the benefits to society of a transaction are often very much in line with the benefit of the transaction to the individuals undertaking it, and the costs to society are well in line with the market price of the product. Consider for example apples at the greengrocer’s. One will only purchase an apple if the utility one derives from the apple is higher than the price of the apple. Since the social benefits of the transaction are very much in line with the benefit one derives from eating the apple, and the costs to society are in line with the production costs on which the price is paid, following this simple rule will in this instance help to optimise social welfare. However, private costs and benefits are not always in line with social costs and benefits. In such situations, there are externalities involved. Externalities are costs or benefits to society that arise from the transaction, but do not befall the parties directly involved in the transaction. For example, as Stern (2007) points out (p.xviii), in the absence of climate policy, the damage resulting from the emission of greenhouse gases is a negative externality. Those who produce greenhouse gas emissions are bringing about climate change, and thereby imposing costs on the world and on future generations, but they do not face the full consequences of their actions themselves. In economic terms, this means that for some transactions that are undertaken, the benefits outweigh the private costs, but they do not outweigh the full social costs. From a social welfare perspective, it would be better if these transactions did not take place. This argument holds true in the case of aviation. If there were no environmental regulation, airlines would hardly have any financial incentive to reduce their environmental impacts, since the environmental impacts are not felt by the aviation sector itself. The benefits of aviation emission reduction are not specifically benefits either for the shareholders of the aviation sector or for the passengers or other customers of the sector. The environmental impacts of a single flight are too dispersed to affect the well-being of the passengers themselves. The negative externalities26, such as local air pollution, noise exposure and climate change, fall on local communities or on humanity and the planet as a whole. Thus aviation activities affect the well-being of others, but
26 At least in theory, there may also be positive externalities in the aviation sector. Taking a trip may ultimately
lead to an increase in the number of destinations on offer, or in the frequency of service. This would entail benefits for other travellers, which are not taken into account by the person deciding on the initial trip. This is an example of the so-called Möhring effect. In general, however, the market is often well able to internalise positive externalities and the negative externalities tend to pose a greater problem for social welfare.
4.504.1/The economics of Heathrow expansion February 2008 50

these effects are not taken account of in the decision as to whether to engage in the activity or not. Economists regard the existence of such external effects as a form of market failure. If there is market failure this justifies government intervention. What kind of intervention would be appropriate in this case? One option would be for the government to determine all measures of which the (social) benefits in terms of reduced environmental impacts outweighed the (social) costs, and prescribe them to the aviation sector. The problem with this approach, however, is that governments lack the capacity to handle the immense amount of information that would be required to reach such decisions. It would simply not be feasible, for example, for governments to determine for which passengers or flights the social benefits outweigh the costs and for which they do not, or to determine at what point it ‘pays’ to purchase or develop more efficient aircraft. According to welfare economics, markets are much better equipped to handle such vast amounts of information than governments or other social organisations. The reason is that in markets, each consumer and producer uses information about possibilities for welfare gains from his or her own point of view, resulting in the market using the information of all participants combined. And as Adam Smith argued, if people pursue their own welfare (while respecting other people’s rights to property and bodily integrity), the outcome is a maximum welfare for all combined27. Therefore, economists’ solution to the existence of externalities is to bring them within the markets - in other words that the government should internalise these effects. Generally, there are two approaches to doing this: the introduction of property rights of some kind (in line with the reasoning by Coase, 1960), such as tradable emission rights; and the setting of regulatory charges at the level of the external costs (in line with Pigou, 1932). If a price tag is attached to environmental impacts, then economically interested parties have an incentive to weigh up the direct financial cost of either continuing the impacts (e.g. carbon dioxide emissions) or incurring costs in order to reduce them. In the case of aviation, the economic parties (i.e. passengers, freight shippers, airlines, etc.) will decide for themselves whether their particular flight is economically advantageous, avoiding flights whose environmental impact, translated into financial terms, outweighs their financial advantage28. It should be noted that internalisation does not mean that all adverse environmental effects will be reduced to zero. In fact, it will generally not be optimal from a social welfare perspective to avoid all such impacts, i.e. in the case of aviation to aim at zero emissions and zero negative effects. This is because some possible measures to reduce emissions entail costs which would clearly outweigh the benefits. Zero emissions could often only be achieved at zero activity, and it is clear that this would not be an optimal situation. At least to
27 However, the welfare maximisation of markets does not tell us anything about the distribution of welfare! 28 The impact of tradable rights and regulatory charges is broadly the same. In both cases, the objective is to
achieve an optimal use of the environment by attaching a price to it. The only fundamental difference between the two instruments is that before tradable rights are introduced the environmental impact is well determined, but there is uncertainty about the price. In the case of regulatory charges, the situation is reversed: the price is well determined, but there is uncertainty about the environmental impact. See e.g. Weitzman (1974) and Pezzey (2003).
4.504.1/The economics of Heathrow expansion February 2008
51
some extent, the gains from present-day aviation outweigh its environmental impacts.
8.2.2 Policy
The idea of internalising external costs to increase social welfare is not new to the transport sector. A long-held aim of European transport policy is to maximise socio-economic welfare, as illustrated by the references given in this section. Most EU transport policy documents implicitly or explicitly mention internalisation of external costs – see for example: • European Commission, 1995, Towards fair and efficient pricing in transport -
policy options for internalising the external costs of transport in the European Union, Green Paper;
• European Commission, 1998, Fair payment for infrastructure use: a phase approach to a common transport infrastructure charging framework in the EU, White Paper; and
• European Commission, 2001, European transport policy for 2010: time to decide, White Paper.
The European Conference of Ministers of Transport also supports maximising social welfare by internalisation of external costs, and considers that the main aims of internalisation are: • economic efficiency; • sustainability; and • the promotion of fair competition between modes and countries. Similarly, the UK Government acknowledges pricing as one of the ways to improve the environmental performance of transport. According to the DfT website29, it aims to improve the environmental performance of transport by focusing on, among other things: • ‘shaping the future pattern of demand for transport, including through land-
use planning and appropriate pricing’; and • ‘tackling the environmental impacts of transport through pricing, regulation,
technology, consumer information and promoting efficient use of resources’ (emphasis added).
A particular line of research pursued by DfT has been into the use of economic instruments to take account of the environmental impacts of aviation. It has reported on estimates of aviation’s external costs and has discussed with stakeholders the possible role of economic instruments in encouraging the industry to recognise its contribution to climate change and local air and noise pollution.
29 www.dft.gov.uk/about/aimandobjectives, consulted 7 November 2007.
4.504.1/The economics of Heathrow expansion February 2008 52
8.2.3 The case for demand management
Fan and Odoni (2002) define aviation demand management measures as follows:
any set of administrative or economic measures - or combinations thereof - aimed at balancing demand in aircraft operations against airport capacities.
In normal circumstances, this involves balancing demand against a given or fixed capacity in order to reduce delay costs and externalities associated with airport congestion. However, if demand management is brought into action to reduce environmental impacts, the capacity of the airport is not necessarily to be regarded as fixed. The question then becomes whether demand management (or other government intervention) represents an effective and efficient tool for reducing unwanted environmental impacts. In the case of market internalisation, which can be considered as a form of demand management, the answer is clearly yes. Internalisation of external effects is desirable from a social welfare perspective, as has been widely acknowledged by policy-makers (see 8.2.2). It is the preferred means of government intervention to correct for market failure because it leaves it up to the market to decide which measures should be undertaken to reduce emissions. If emission rights are introduced and capped at the correct level, and are made tradable, only those measures will be taken that are cheaper than the market price of allowances. Similarly, if regulatory charges at the level of the external costs are introduced, only those measures will be taken whose costs are below the charge level. Consumers in turn will weigh their benefits against their private costs, which will now include the old ticket price with a surcharge at the level of the external social costs. As a result, only those trips will be taken whose benefits outweigh their total social costs. The next question to be answered is, if the route of internalisation is for some reason not feasible, should one then consider other means of demand management? More direct means of regulation are in principle less desirable. As discussed above, such an approach requires the Government to pick out of the wide palette of available measures those that are optimal from a cost/benefit perspective to reduce the environmental impact. That palette includes technical measures (such as retrofitting winglets), operational measures (e.g. increasing the average load factor), and volume measures (i.e. cancellation of flights). Each of these measures has its own cost/benefit ratio, in other words its own balance between its financial costs and the gains in reduced environmental pollution. From a welfare economics point of view, it is obviously best (i.e. will maximise social welfare) if only those measures are implemented of which the benefits outweigh the costs. However, measures will inevitably be imposed on the economic parties on the basis of less detailed information on costs and benefits than is available
4.504.1/The economics of Heathrow expansion February 2008
53
collectively to the parties themselves30. Moreover, more direct imposition of particular measures cannot generally incentivise the whole range of economically attractive options available to reduce the negative impacts. Such forms of demand management will thus always be a second-best solution. If external effects are internalised by market internalisation, i.e. through tradable rights or regulatory charges, the airport capacity required by aviation will be an outcome of the process instead of an input. However, if the government intervenes directly to regulate the number and location of aircraft operations, particularly if the capacity of airports is allowed to determine demand management, it is unlikely that the resulting incentives will coincide with the efficient regulatory environmental charges. First, if environmental impacts are optimally internalised, it is possible that either less or more capacity will be needed than presently available. Second, it is difficult to cancel by means of direct regulation just those flights which would be cancelled in the most efficient arrangement as a result of market internalisation. Direct regulation may discourage some ‘useful’ flights, while letting some marginal flights continue. Third, direct regulation of the number of flights does not offer an incentive for technical measures aimed at reducing emissions. Nonetheless, there may yet be reasons to regulate directly to manage demand in order to reduce the environmental impact of aviation. The rationale for other forms of demand management for environmental reasons if internalisation is not feasible is that, although such approaches may be inefficient in comparison to the preferred solutions of instruments which directly relate to the environmental impacts, the second-best solutions may still improve social welfare in comparison to business as usual. That means that if the preferred solutions are unfeasible, for example due to international agreements or incompatibility with other national priorities or rules, demand management by direct intervention may still turn out to be the best available option for welfare maximisation.
8.2.4 Options for government intervention
Below we discuss the arguments for and against government intervention to manage demand by means of three potential measures: 1 increasing air passenger duty (APD) and extending it to transfer passengers; 2 withdrawing landing slots for short-haul journeys (for example, of less than
500 km) where there are good railway connections; and 3 allocating destinations among London’s five airports.
30 In itself, the imposition of specific measures onto economic parties may have a detrimental impact on
welfare, even though those parties might have opted for the same measures if given the choice.
4.504.1/The economics of Heathrow expansion February 2008 54

Increasing air passenger duty and extending it to transfer passengers APD is an excise duty levied by the UK Government and collected from airlines by HM Revenue and Customs. It is levied on the carriage of passengers from a UK airport on an aircraft that has an authorised take-off weight of more than 10 tonnes or more than 20 seats for passengers, and airlines pass the cost on to passengers as an additional charge. As of 1 February 2007, APD was charged as follows: • economy-class flights in Europe, internal UK flights - £ 10; • business and first-class flights in Europe - £ 20; • economy-class long-haul flights - £ 40; and • business and first-class long-haul flights - £ 80. In the 2007 pre-budget report, it was announced that from 1 November 2008 the rules for APD would be amended to increase the charge on all-business-class flights. In addition the UK Government intends to change the basis of the APD from 1 November 2009. In the past, Treasury ministers have justified the introduction of APD as compensating for the fact that aviation fuel is not subject to excise duty or VAT, as a result of the challenges that would be faced in imposing such taxes in view of the exemptions created by the Chicago Convention. If APD were to be increased and extended to transfer passengers, this would most likely decrease demand, and so weaken the rationale for expansion of airport capacity31. However, in its current form it is a less than satisfactory instrument to address and reduce environmental impacts. After all, APD does not give airlines an incentive to increase their load factor or fuel efficiency, and although the present APD structure provides some incentive for passengers to fly shorter distances, this is a rather crude effect.
31 As an instrument, APD lies somewhere between the direct control of number of flights and environmental
regulation, since it is charged not on flight operations, but on passengers. Furthermore, extending APD to transfer passengers would have only a limited environmental effect, since the transfer passengers that were discouraged from flying via UK airports might opt for a different hub airport instead. However, other governments may also begin to levy similar charges on transfer passengers, which could increase the environmental effectiveness of the measure.
4.504.1/The economics of Heathrow expansion February 2008
55
Nevertheless, the Environmental Change Institute of the University of Oxford (ECI, 2006), expresses in a recent report the view that increasing APD probably offers the simplest and fastest way to reduce emissions from aviation, and could be implemented swiftly. The reason it gives (p83) is that: ‘Increasing APD does not require the renegotiation of treaties at either EU or international level. Nor is it subject to evasion through ‘tankering’. It could be increased at the Government’s discretion.’ In other words, although raising APD is not the first-choice solution to reducing environmental impacts, it may be the best short-term solution at hand.
Withdrawing landing slots for short-haul journeys (for example, of less than 500 km) where there are good railway connections The idea behind this option is that the net social benefit of short-haul journeys by air is likely to be either marginal or negative. On the one hand, the time gains of flying over such short distances are often small, particularly when taking account of boarding times, etc. On the other hand, short flights have a relatively large environmental impact per passenger kilometre because of high fuel usage during take-off/climb to height and descent/landing. Withdrawing landing slots for short-haul journeys would free additional slots for longer-haul journeys, which would weaken the rationale for the expansion of airport capacity by eating into the potential economic benefits to be derived from such expansion. However, withdrawing landing slots would be subject to similar shortcomings as relate to the raising of APD. It is unlikely that if all the environmental costs of short-haul air journeys were properly internalised, demand for such journeys would run dry completely. Although it would probably fall substantially, there would still be some demand from business travellers placing a high value on time. Hence, although withdrawing landing slots may prevent some flights with a net negative impact on society from being taken, it would also prevent flights or trips with a net positive impact. A much more detailed analysis would be required to gauge the balance between these two effects and determine whether the net effect would be positive or negative. Restriction of short-haul journeys may be more feasible in the near future than other options, including the internalisation options of tradable emission rights and regulatory charges. However, it would also exacerbate the environmental impacts of Heathrow airport’s existing capacity, since short-haul journeys would simply be exchanged for environmentally more degrading32 long-haul journeys.
32 Longer flights often involve larger and heavier aircraft. These produce more noise and emissions during the
landing and take-off phases. Also, the total CO2 emissions of such flights are larger, even though long-haul trips tend to be more efficient in terms of fuel consumption per passenger kilometre.
4.504.1/The economics of Heathrow expansion February 2008 56

Allocating destinations among London’s five airports (Heathrow, Gatwick, Stansted, Luton and London City) The idea behind this option is that it could remove duplicate services and might also increase passenger loads per aircraft, which in turn would hasten the introduction of aircraft with larger capacity, and thus increase efficiency. This would have the effect of reducing the impetus for airport expansion. However, the economic effect of removing duplicate services is unclear. Obviously, there are costs connected to duplicate services. There are, however, also benefits. First of all, the availability of duplicate services exists under normal competition. The costs of lower passenger loads per aircraft for each airline are internal, i.e. already taken into account in the economic decisions. Therefore, it is not obvious that removing duplicate services would improve social welfare. Compare the hypothetical situation in which the Government were to grant all air transport routes to one airline only. That particular airline would then be able to cancel duplicate services which are presently offered by competing airlines. Experience teaches, however, that monopolies are inefficient and do not lead to optimal welfare. Nevertheless, if there is already no free competition between airlines due to restricted airport capacity and there are no market mechanisms for slot allocation, then allocating destinations among London’s five airports could potentially improve social welfare as a second-best solution. At present, there is insufficient information available for us to say whether this is the case.
8.3 Does unnecessary consumption exist?
There are two other factors that may be put forward in the discussion of the desirability of government intervention to manage demand. These factors relate to the utility functions on which the economic analysis is based and may be regarded as examples of market failure. In welfare economics, welfare is determined by the willingness to pay. So if consumers pay more for a certain good than for another good, the consumption of the first good is assumed to lead to a higher welfare. Since people are free to spend their money as they wish, the market determines what leads to the highest welfare. There are two kinds of market failure, however, which have not been discussed so far and which could justify government intervention. The first kind of market failure results from the external costs of positional consumption; the second kind results from imperfect information in the case of habitual behaviour.
4.504.1/The economics of Heathrow expansion February 2008
57

8.3.1 Positional consumption
Although aviation contributes to real wealth creation, there is also a component of positional consumption - the purchasing of goods or services in order to confer status on the purchaser. As with other positional consumption goods, such as sports utility vehicles, some flights are taken by people to distinguish themselves from others or to identify themselves with others. Covering a short distance by air instead of by train (even though the latter may be comparable in comfort and travelling time) may add to the perceived status of the traveller. It may be argued that such positional consumption does not lead to an increase in social wealth. From this perspective, the increased status of one person is acquired at the expense of the status of the rest of society. Such consumption is hence a zero-sum game. As such, from a social standpoint positional consumption merely redistributes wealth instead of creating it. Since the decrease in the wealth of other travellers is not an intended effect, the negative side effects of positional consumption are a kind of external effect, which may call for government regulation. In his Principles of Political Economy (Mill, 1848, Book V, Chapter VI), John Stuart Mill pleaded for taxation of positional goods:
A great portion of the expenses of the higher and middle classes in most countries, and the greatest in this, is not incurred for the sake of the pleasure afforded by the things on which the money is spent, but from regard to opinion, and an idea that certain expenses are expected from them, as an appendage of station; and I cannot but think that expenditure of this sort is a most desirable subject of taxation. If taxation discourages it some good is done, and if not, no harm; for, in so far as taxes are levied on things which are desired and possessed from motives of this description, nobody is the worse for them.
Because positional consumption is a zero-sum game from this perspective, the welfare effects of reducing it are limited. It is difficult to say, however, which consumption is positional and which is not. Another view is possible, however. One’s own perspective of one’s status may not necessarily coincide with that of others. Moreover, one’s own perceived status may also relate to previous generations, or one’s own past. In such cases, it is clear that there is no zero-sum game. I may feel better because I am able to fly, whereas I could not afford to do so in the past. I may feel better because I can fly although my parents could not afford to do so. These are examples of positional consumption which does not necessarily come at the cost of others. Even with this qualification, one might nevertheless ask whether such positional consumption ought not to be restricted. If it were restricted, however, in all likelihood, people would simply find other goods to derive status from.
4.504.1/The economics of Heathrow expansion February 2008 58
8.3.2 Habits
Another issue which might justify demand management is habitual behaviour. Sometimes an acceptable alternative exists for a certain type of socially negative behaviour, but this alternative is not perceived as such by the individuals concerned. In this situation, market failure results from imperfect information. If people were to choose the alternative, they would realise that it was not as bad as they had previously assumed. In such cases, direct government regulation may be justified instead of the use of economic instruments. This reasoning might apply in cases where the train offers a comparable alternative to flying, but flying is chosen as a result of underestimation of the rail alternative.
8.4 Demand management and economic benefits of expansion
Provided that existing capacity is used inefficiently, demand management could mitigate the need for airport expansion. If there is indeed inefficient use of capacity, then it follows that the totality of flights that would take place if account was taken of all social costs and benefits would differ from the flights that currently take place. In other words, some potential flights which would have a higher economic benefit than at least some of the present flights, do not currently take place. If airport capacity were used as efficiently as possible, that would mean that all the flights with the largest net benefit to social welfare would be fitted into the available capacity, and that the economic benefits of expansion would therefore only include the lesser benefits of the more marginal flights. A study by NERA Economic Consulting for the European Commission (2004, see also UK Civil Aviation Authority, 2004), argues that the present slot allocation at airports such as Heathrow is in fact inefficient, since existing users enjoy grandfather rights (rights to slots deriving from past performance) in relation to their current slot holdings (p i.):
The fact that existing airport charges fail to reflect the scarcity value of slots means that they may be allocated to services that are barely profitable at the current level of airport charges. Airlines that might be able to use these slots more efficiently (for example, because their services would carry more passengers or generate more profits), and would therefore be willing to pay considerably more than the current level of charges, may nevertheless be unable to get hold of any slots. In addition, the fact that airlines only pay charges based on their actual use of slots means that they have poor incentives to use slots efficiently. Some slots therefore remain unused, even at congested airports - either because they are returned late to airport coordinators (and cannot be reallocated) or because airlines simply fail to use their full allocation of slots.
4.504.1/The economics of Heathrow expansion February 2008
59
With such inefficiencies, the potential economic benefits of airport expansion are larger than they would be in the absence of these inefficiencies. NERA suggests using market mechanisms for slot allocation, or allowing secondary trading, under which airlines would be able to buy and sell slots from each other. NERA estimates the potential increase in passenger numbers as a result of such measures at about 7%, although not all of this increase could be achieved in practice. It should moreover be noted that the economic benefits of such an approach to demand management would include not only an increase in passenger numbers, but also an increase in economic benefits per passenger, since less profitable flights would be exchanged for more profitable flights.
8.5 Summary
A number of demand management options exist as potential alternatives to expanding runway capacity. From a social welfare perspective, it would be optimal to internalise external costs through a market instrument such as tradable emission rights or a differentiated aviation charge at the level of the external effects caused by aviation. Such market instruments would ‘automatically’ ensure that only trips were made of which the benefits exceeded the full private and social costs. In the absence of such instruments, there are a number of alternatives that may be considered. Three such alternatives are discussed above. First, APD could be increased and extended to transfer passengers. This might reduce the impetus for expansion of runway capacity; however, given that the current APD structure differentiates only very crudely on the basis of the environmental characteristics of flights, it provides only a limited incentive for cleaner engines, higher load factors, larger aircraft and improved fuel efficiency. Nonetheless, it may be a valid short-term approach to reducing the impetus for airport expansion. A second form of demand management discussed is the withdrawal of landing slots for short-haul journeys for which viable alternatives exist. Generally, it may be assumed that the aviation market works sufficiently well that airlines will offer those flights for which passengers are willing to pay most, i.e. those with the highest social benefits. Given that despite the scarcity of slots at Heathrow airport short distance flights are being offered, it can be assumed that at least some of these flights have a net social benefit. Consequently, withdrawing short-haul landing slots may not be the most desirable option in this case. It may prevent some flights with a net negative impact on social welfare, but is likely also to prevent some flights with a net positive impact. A third option is to allocate destinations among London’s five airports, so as to remove duplicate services and increase load factors. This approach could impact substantially on the competitive market for air travel. Only if there is currently no free competition due to restricted airport capacities, and in the absence of market mechanisms for slot allocation, could this option potentially improve social welfare as a second-best solution.
4.504.1/The economics of Heathrow expansion February 2008 60

The conclusion is that each of these more interventionist options is less desirable than the introduction of market instruments, such as a differentiated environmental charge or tradable emission rights, that fully internalise the externalities of aviation. If such market instruments are judged unfeasible, the other options could be regarded as alternatives. More study would be required in order to judge whether any of these options would improve social welfare compared to the current situation.
4.504.1/The economics of Heathrow expansion February 2008
61

4.504.1/The economics of Heathrow expansion February 2008 62

Part C
Competition between hub airports
4.504.1/The economics of Heathrow expansion February 2008
63

4.504.1/The economics of Heathrow expansion February 2008 64 4.504.1/The economics of Heathrow expansion February 2008 64
9 Hub airports and regulators
9.1 Introduction
In discussions about the expansion of individual airports, it has been claimed that hub airports are in competition with one another, and that business will therefore be lost to other hub airports if the airport in question is not allowed to expand. The potential loss of business, in particular of transfer traffic, is predicted to lead to a deterioration of the network, inducing further losses of traffic. The argument is that this process could end by damaging the national economy. In this part of the report, we analyse the nature and level of competition between hub airports. Questions that will be addressed are: • In what ways and on which markets or market segments do hub airports
compete with one another? • How do governments perceive the level of competition? • Is competition between hub airports a good thing or a bad thing, and how
should we evaluate governments’ responses? • How can the level of competition be influenced - which instruments do
airports and governments have at hand? The underlying reason for the analysis of airport competition is this. It is conceivable that competition between hubs may be so fierce that it will result in governments relaxing environmental regulation at the expense of people living in the vicinity of their airports, in order to secure the competitive position of the airports. If this were the case, international harmonisation of environmental regulation of airports could be a remedy, provided that it resulted in better environmental and economic outcomes than the current situation. In section 9.2 competition between hubs is discussed qualitatively, while section 9.3 discusses the impact regulators may have on the competitive market for hub airports and section 9.4 brings forward some empirical data on hub competition. In section 9.5 some data on airport charges are presented, and section 9.6 analyses potential future developments with respect to point-to-point and transfer traffic. In section 9.7 we focus on the governmental view of hub competition. Finally, section 9.8 draws conclusions.
4.504.1/The economics of Heathrow expansion February 2008
65
9.2 Analytical framework
9.2.1 Introduction
The topic of this part of the report is competition between hub airports, especially the major European hubs such as London Heathrow, Paris Charles de Gaulle, Frankfurt, Amsterdam, Madrid and Munich. These airports serve as transportation hubs for an airline or an airline alliance. They form part of a hub-and-spoke system, in which airlines offer flights (spokes) to their central hub, where passengers or freight can then, if required, be transferred to a direct flight to their final destination. Airlines which adopt hub-and-spoke systems (individually or as part of an alliance) are referred to as network carriers. In contrast, other airlines only operate point-to-point flights, offering their passengers no guaranteed connections to onward flights. The latter are predominantly low-cost carriers, but also include some premium-only carriers. There are several types of actors that compete in several markets in the aviation sector. Competition in these markets may or may not interfere with competition between hub airports. Competition between hub airport operators is complicated by the fact that they do not compete directly for passengers, but rather compete for carriers to offer services from their airports. To get some insight in the processes taking place, we first list the markets and actors that compete. There may be competition between: • hub and (smaller) regional airports for carriers; • hub airports for carriers; • regional airports for carriers; • network carriers for passengers; • network and freight-only carriers for air freight; • network carriers and low-cost carriers for passengers; • network carriers and charters for passengers; • charters and low-cost carriers for passengers; and • airlines and other modes of traffic (high-speed railways in particular) for
passengers.
4.504.1/The economics of Heathrow expansion February 2008 66
9.2.2 Demarcation
Since the present study focuses on Heathrow and its potential competitors, this analysis centres around passenger transport. Although Heathrow has freight-only flights, their number is limited compared to passenger flights33. Heathrow does have a substantial level of air freight traffic (55% of all UK air freight goes via the airport), but most of this is carried in the cargo holds of passenger aircraft, not in dedicated freighters. According to UK Civil Aviation Authority (CAA) data, in 2006 94% of all freight which travelled via Heathrow was carried in passenger aircraft (UK CAA, 2007b). As the catchment areas for the hubs considered hardly overlap, the analysis does not consider potential competition for passengers beginning their flights at these hubs. Since low-cost carriers and charter airlines predominantly offer point-to-point flights, it also excludes competition between network carriers and these airline types. Furthermore, the analysis does not focus on the competition between hub airports and regional airports: as most regional airports mainly serve intra-European destinations and/or serve the spoke function in network carriers’ networks, they will not be considered here in detail. In sum, the analysis focuses on competition between airports for network carriers that facilitate transfer traffic and on competition between network carriers for transfer passengers.
9.2.3 Competition for passengers
This section sets out to investigate whether, in addition to the list of aviation markets given above, airports compete for passengers and if so, what the nature of this competition is. It does so by generalising from concrete examples. Passengers travelling from A to B without a direct connection between these airports can generally choose to transfer at any of various hubs. For example, a traveller wishing to fly from Lisbon to Chicago may choose to transfer at Munich, Frankfurt, Paris Charles de Gaulle, London Heathrow, Madrid, Philadelphia, or Newark, according to the official timetable of Lisbon Airport34. An Expedia search reveals that at least on some dates a transfer at Zurich is also possible35. So in this case, the competition of hubs for transfer passengers is not restricted to the major European hubs, but also involves a smaller European hub (Zurich) and non-European hubs (Philadelphia and Newark).
33 All-freight airlines generally operate from other hubs than passenger airlines. Examples of major European
freight hubs are Liège, Leipzig/Halle and Cologne/Bonn. 34 ANA, 2007: Aeroporto de Lisboa, horário de voos regulares, Lisbon. 35 http://www.expedia.com, accessed 22 October 2007.
4.504.1/The economics of Heathrow expansion February 2008
67
The flights depart at different times and are operated by different airlines36. Some airlines offer more choice of departure times than others. Lufthansa, for example, offers three flights per day compared to one flight each by Air France and British Airways (BA). All the Lufthansa flights transfer at Frankfurt or Munich, the Air France flight transfers at Paris Charles de Gaulle and the BA flight transfers at Heathrow37. This Lisbon - Chicago example shows that when airlines compete for transfer passengers, the choice of an airline dictates the choice of transfer hub. Passengers transfer at the hub on which the chosen airline is the home carrier. Airlines compete not only on price and flexibility of tickets, but also on issues of convenience (departure times, total travelling time, flight frequencies). Even if there is a direct flight between A and B, there may still be competition over the same route from airlines offering a flight that involves a transfer. For example, a passenger wishing to fly from Amsterdam to Hong Kong may choose either a direct flight or a flight involving a transfer at any of Heathrow, Helsinki, Zurich, Frankfurt, Munich or Paris. depending on the airline chosen. In such cases, a flight involving a transfer is often cheaper than a direct flight. According to an internet search, for a specific date in 2007, the cheapest available direct Amsterdam - Hong Kong flight was € 811, whereas flights involving a transfer started from € 672, a difference of 17%38. It is not clear whether this price difference is a consequence of the airports charging differently for passengers flying directly and passengers whose flights involve a transfer, or of airlines trying to exploit their hub-and-spoke network by maximising the number of passengers on their long-haul flights, or both. The direct flight takes 11 hours and 15 minutes, whereas the fastest flight with a transfer - at Helsinki - takes two hours longer. People who do not mind an additional stopover and have a value of time below € 70 (€ 140 ÷ 2) per hour may be inclined to opt for the indirect flight. Further details of the Amsterdam - Hong Kong example (not presented here) illustrate again that competition between airlines is intertwined with that between transfer airports, and that competition takes place on price as well as on quality aspects of the journey.
Instruments of competition between European hub airports As illustrated above, network carriers compete for transfer passengers, and where a transfer is involved a passenger’s choice of airline implies a choice of that airline’s hub. An indirect flight with Lufthansa is a flight via Frankfurt or Munich or via one of the hubs of Lufthansa’s alliance partners. Likewise, a flight
36 In this example, Expedia was searched on 22 October 2007 for flights departing on 26 November 2007 and
returning on 3 December 2007. For this particular route, the travelling times varied from a little more than 12 hours to just over 15 hours. Interestingly, both the shortest and the longest travel time involved a transfer at Newark. Prices varied from € 532 to € 650 for an economy class ticket, a difference of 18%, according to Expedia. Prices and durations of the flights were not correlated. Only limited conclusions can however be drawn from such an internet search, since it does not provide insight into the whole range of tickets offered. It may well be that for some flights the cheapest tickets were already sold out.
37 The correlation between hubs and carriers may however not be so strong if one looks at alliances rather than at carriers. For example, TAP Air Portugal, like Lufthansa a member of the Star Alliance, offers a flight to Chicago via London Heathrow with a code-share agreement on the Heathrow - Chicago leg of the route.
38 In this example, Expedia was again searched on 22 October 2007 for flights departing on 26 November 2007 and returning on 3 December 2007.
4.504.1/The economics of Heathrow expansion February 2008 68
via Amsterdam is a flight with KLM or one of its Sky Team alliance partners. There are very few connections at airports that are not hubs for a home carrier or its alliance partners. This raises the question of whether hub airports can assist their home carriers in attracting more passengers. For example, if costs at Heathrow were made lower than those at Frankfurt, BA routes via Heathrow would become more attractive than Lufthansa routes via Frankfurt or Munich. Before considering this issue, we will first look at the reasons why passengers choose a particular airline. The aircraft manufacturer Airbus (2006, p22) reports that passengers surveyed by the US Department of Commerce mentioned several reasons for choosing a particular airline39. The most often cited reason was price, and then (in descending order), schedule, the availability of a frequent flyer programme, the fact that a flight did not involve a transfer, and previous good experience with the airline. The survey results reveal that apart from price, the quality and convenience aspects of a journey are important factors in competition. Although the list is based on a survey of international passengers coming to the USA, it is likely that passengers in other parts of the world have similar reasons for choosing an airline. We now turn to the question of whether hub airports could assist their home carriers in attracting transfer passengers by setting their airport charges low. In general, to do so would represent a cost to the airport, and airports would not be inclined to incur this. Nevertheless, they do have some incentive to offer relatively low charges (if they can do so by increasing efficiency rather than by increasing their own costs), since this may benefit their home carrier which may thus be able to attract more passengers. BA reported in fiscal year 2005/06 (UK CAA, 2007b: UK Airline Financial Tables 2005/06) that airport charges40 amounted to 5.5% of its passenger revenue (5.1% of total operating revenue). So there seems to be some scope for airports and their home carriers to explore the potential cost savings here. An alternative would be for airports to set charges for connecting passengers at a relatively low level compared to those for point-to-point passengers from the airport, potentially by cross-subsidising between these passenger types. In general, however, the scope for unilateral airport action on this appears limited as most charges are regulated (see section 9.3). This means that this instrument of competition cannot be exploited by an airport acting alone, but could possibly be employed by the airport in collaboration with the national regulator. The issue of the use of airport charges as an instrument of competition is considered in more detail in section 9.5. Hub airports may also assist home carriers in enhancing quality and convenience. One of the most important convenience aspects of a journey is the schedule: timing and frequency. Airports may assist carriers by giving them dedicated gates at close proximity to one another in order to reduce transfer times and enhance their schedule. To the same end, they may offer dedicated
39 In the US Department of Commerce's Survey of International Air Travel. 40 Included are ‘landing and departure fees’ and ‘handling charges and parking fees’.
4.504.1/The economics of Heathrow expansion February 2008
69
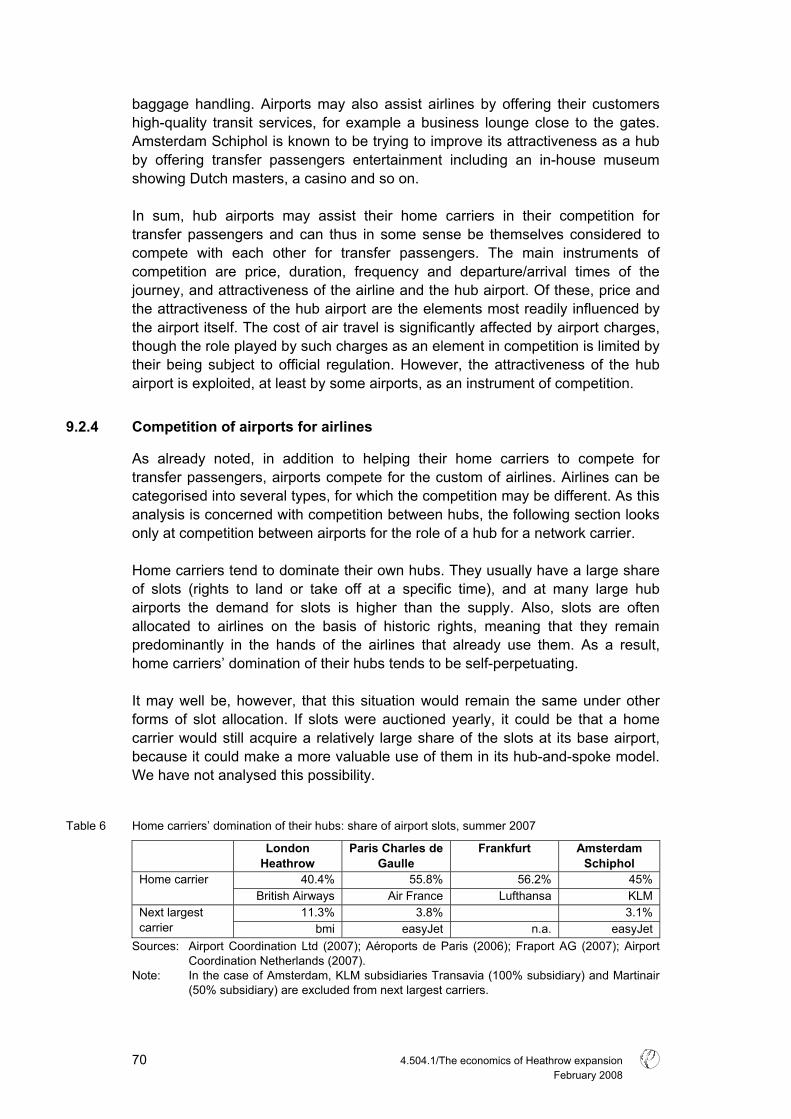
baggage handling. Airports may also assist airlines by offering their customers high-quality transit services, for example a business lounge close to the gates. Amsterdam Schiphol is known to be trying to improve its attractiveness as a hub by offering transfer passengers entertainment including an in-house museum showing Dutch masters, a casino and so on. In sum, hub airports may assist their home carriers in their competition for transfer passengers and can thus in some sense be themselves considered to compete with each other for transfer passengers. The main instruments of competition are price, duration, frequency and departure/arrival times of the journey, and attractiveness of the airline and the hub airport. Of these, price and the attractiveness of the hub airport are the elements most readily influenced by the airport itself. The cost of air travel is significantly affected by airport charges, though the role played by such charges as an element in competition is limited by their being subject to official regulation. However, the attractiveness of the hub airport is exploited, at least by some airports, as an instrument of competition.
9.2.4 Competition of airports for airlines
As already noted, in addition to helping their home carriers to compete for transfer passengers, airports compete for the custom of airlines. Airlines can be categorised into several types, for which the competition may be different. As this analysis is concerned with competition between hubs, the following section looks only at competition between airports for the role of a hub for a network carrier. Home carriers tend to dominate their own hubs. They usually have a large share of slots (rights to land or take off at a specific time), and at many large hub airports the demand for slots is higher than the supply. Also, slots are often allocated to airlines on the basis of historic rights, meaning that they remain predominantly in the hands of the airlines that already use them. As a result, home carriers’ domination of their hubs tends to be self-perpetuating. It may well be, however, that this situation would remain the same under other forms of slot allocation. If slots were auctioned yearly, it could be that a home carrier would still acquire a relatively large share of the slots at its base airport, because it could make a more valuable use of them in its hub-and-spoke model. We have not analysed this possibility.
Table 6 Home carriers’ domination of their hubs: share of airport slots, summer 2007
London Heathrow
Paris Charles de Gaulle
Frankfurt Amsterdam Schiphol
40.4% 55.8% 56.2% 45% Home carrier British Airways Air France Lufthansa KLM
11.3% 3.8% 3.1% Next largest carrier bmi easyJet n.a. easyJet
Sources: Airport Coordination Ltd (2007); Aéroports de Paris (2006); Fraport AG (2007); Airport Coordination Netherlands (2007).
Note: In the case of Amsterdam, KLM subsidiaries Transavia (100% subsidiary) and Martinair (50% subsidiary) are excluded from next largest carriers.
4.504.1/The economics of Heathrow expansion February 2008 70

Table 6 illustrates that, given the share of slots taken by their existing home carriers, most hubs would currently be unable to house a second major home carrier, since this would leave no slots for other operators. They might be able to serve as a hub for smaller airlines, but these airlines would be limited in their expansion capability because of the presence of the largest carrier. Because home carriers need a large number of slots, they cannot easily transfer their activities to another airport. If their operations are constrained, they can however open a second hub (such as Munich, which is Lufthansa’s second hub, or Amsterdam, which became Air France-KLM’s second hub after the merger between the two companies). Conversely, as mentioned above, airports sometimes serve as hubs for several airlines. London Heathrow serves as a hub not only for BA, but also for the smaller airline bmi. So if airports compete at all for home carriers, this competition will most likely be for the role of a secondary hub for a major airline, or the hub for a smaller airline. Establishing a secondary hub takes an airline time, and it is therefore likely that competition on this front will take a long-term form. The potential competition between hubs to be the secondary hub for a large airline or to host a smaller home carrier has been constrained up to now, since the market for international aviation has not been a free market. For many destinations, commercial aviation is governed by bilateral air service agreements between countries, which often restrict commercial aviation between the countries concerned to airlines registered in either country. So, for example, KLM cannot fly commercially from the UK directly to most Asian countries, even if it wanted to, because of the UK’s agreements with those countries. As a result, secondary hubs are almost always established in the same country as primary hubs, and an airport’s subsidiary home carriers come predominantly from the same country as the major home carrier. In recent years, however, aviation has become less regulated. All aviation between EU Member States has been liberalised, for example, and the EU and the USA have entered into an ‘open skies’ agreement, allowing all US and EU airlines to fly from any city in the USA to any city in Europe. Furthermore, India and the UK have agreed to liberalise aviation between the two countries. If this trend continues, current constraints on competition between hubs will be progressively relaxed. However, before an airline can establish a hub in a foreign country, it will still need to be free to fly from there to most of its major destinations. Even with the EU-US ‘open skies’ agreement, this is not generally possible yet as a result of other bilateral air service agreements. Moreover, the level of competition between hub airports in the future may be affected by further international mergers between airlines which are facilitated by the ongoing liberalisation process.
4.504.1/The economics of Heathrow expansion February 2008
71
To summarise, hubs hardly compete with each other for home carriers, since regulations in the aviation sector limit this competition to hubs with the same nationality as the home carrier and competition would thus only be with airports in the same country. Furthermore, at most hubs, capacity restrictions tend to prevent the establishment of a second home carrier, the share of slots taken by the existing home carrier being too large. Unless air transport is further liberalised, hub airports will continue to have little room to attract new network carriers, especially network carriers from abroad.
9.3 Can regulators influence the competitive position of hubs?
9.3.1 Introduction
Section 9.2.3 concluded that hub carriers compete for transfer passengers and are assisted in their competition by their home airports, and showed that the instruments of this competition are price and aspects of service quality and convenience. However, airlines need not be assisted by their hub airports alone. Since aviation is a heavily regulated industry there could be scope for regulatory competition to benefit national hub airports and their home carriers, possibly in light of the potential benefit this can bring to the nation’s economy. Indeed, there are well-documented historical examples of governments and regulators working to adjust regulation in such a way as to improve the competitive position of their national airline. Airlines such as KLM and Singapore Airlines owe their expansion to governments negotiating air service agreements with other governments in their best interest (Dierikx, 2000). It is conceivable that similar regulatory competition still exists today. This section explores the existing potential for this kind of competition. First, section 9.3.2 discusses the EU legal framework in which regulators operate. Section 9.3.3 considers whether regulators can influence the quality/convenience aspects of hub airports and section 9.3.4 discusses to what extent regulators can influence charges. Section 9.3.5 looks at noise regulation at the four major hub airports under consideration, and section 9.3.6 concludes.
4.504.1/The economics of Heathrow expansion February 2008 72

9.3.2 European regulation on airport charges
In January 2007, the European Commission published a proposal for a directive on airport charges (EC, 2007). The hub airports considered in the present report are of a size that they would have to comply with the directive, if it were adopted. In its current form, the proposal sets rules to be respected when EU Member States and/or airport operators determine levels of airport charges. It does not set the levels of airport charges, nor the types of charges that can be levied. The following rules are of interest in this context: 1 The charging system should not discriminate between carriers or passengers
and ‘differences in treatment should be related to the actual cost of the facilities and services provided’ (p5).
2 Member States do not have to apply a particular calculation method for the charges but, to ensure transparency, airport operators and air carriers have to exchange a certain amount of information.
3 Passenger charges are allowed to be varied at a single airport, according to the quality of services offered.
4 Funding of security services via security charges has to be related to its costs.
Thus, even if the directive comes into force, airports will be able to differentiate chargers between transfer passengers and passengers on direct flights. Cross-subsidisation via security charges however will not be (directly) possible. The hub airports under consideration are of such a size that, according to the Council Directive 96/67/EC (EC, 1996), they have to give third-party suppliers access to the market for ground handling and self-handling. The directive aims at lowering prices and improving the quality of ground handling by breaking up the monopoly position of airports in this field. Charges for ground handling do not require approval from public authorities. According to the EU Guidelines on Financing of Airports (EC, 2005) ‘An airport operator acting as a provider of ground handling services may charge different rates for the ground handling charges invoiced to airlines if these differences are linked to the nature or scale of the services provided’ (p10). Thus, it is not forbidden for an airport that provides ground handling services to charge airlines less for transfer passenger-related services. However, ‘Ground handling services must be self-financing and must not be cross-subsidised by the airport’s other commercial revenue or by public resources granted to it as airport authority or operator of a service of general economic interest’ (EC, 2005; p11). EU legislation precludes the possibility of an airport favouring carriers of transfer passengers when allocating slots. In any case, the hub airports under consideration are all classified as ‘coordinated airports’ and therefore have no influence on the allocation of available slots, which are instead allocated by independent national coordinators (EC, 2004). EU legislation also precludes state aid to airports except as laid down in the European Community Guidelines (EC, 2005). These stipulate that such aid is allowed only in exceptional cases, such as for activities that normally fall under state responsibility (air traffic control, safety, etc), for economic activities carried out by an airport that are of general
4.504.1/The economics of Heathrow expansion February 2008
73

economic interest, or for airlines requiring temporary ‘start-up aid’ at regional airports. When regulators set noise regulations, other than the internationally agreed regulation of noise at source, they have to take two directives into account. The Airport Noise Directive (EC, 2002a) specifies the rules under which airports may introduce a ban on noisy aircraft (‘marginally compliant aircraft’). The Environmental Noise Directive (EC, 2002b) specifies how noise should be measured, in such a way as to assign more weight to evening and night-time noise. It also defines a night as lasting eight hours, but leaves regulators a considerable degree of freedom as to when the night starts. The Environmental Noise Directive requires regulators to adopt a noise management plan for airports, but does not specify whether noise management should be aimed at a particular environmental or social goal, such as a target level or a number of affected people.
9.3.3 Can national regulators influence quality and convenience factors?
The most important quality and convenience factors on which hub/home carrier combinations compete are travel time (including transfer time) and attractiveness of the airport and airline. National regulators have very little means of influencing airline timetables41 or airports’ and airlines’ quality of service. So it is unlikely that they will have an effect on these factors. However, national regulators may establish and uphold noise regulations which could negatively affect airlines’ ability to attract transfer passengers. Long-haul flights often fly at night and therefore tend to take off late in the evening and/or land early in the morning. Such a schedule is attractive to passengers who need to transfer, because it allows them to fly during the night and arrive in daytime. By restricting the level of noise that can be generated either late in the evening or early in the morning, regulators may thus limit the freedom of airlines in competing for intercontinental transfer passengers. Conversely, by relaxing evening and early morning noise restrictions, regulators could assist airlines in attracting more transfer passengers. Apart from noise regulation, spatial planning is an important factor by which regulators and other authorities may influence the competitive position of an airport. In Europe, most major hubs operate at or near maximum physical capacity during peak hours42. Expanding an airport would enable airlines to increase their number of flights and thus expand their networks, in terms of either the number of destinations served, or frequencies, or both. Of course, this would benefit not only transfer passengers, but also passengers flying direct routes, who would have more destinations and/or more flights to choose from. And it could benefit other airlines as well as the airport’s home carrier.
41 Apart from determining the opening hours of the airport. 42 The number of night flights (or the noise they produce) is often restricted, so that the level of night flights
being carried out is often much lower than physical capacity.
4.504.1/The economics of Heathrow expansion February 2008 74

9.3.4 Can regulators influence costs?
Airport charges, which make up a significant share of the cost of flying, are often regulated. Because of the locally monopolistic nature of airports, there are often substantial governmental regulations in place with regard to the total permissible revenue from airport charges. This means that the extent to which airports may assist home carriers in using price as an instrument of competition is largely determined by the prevailing regulations (Cranfield University et al., 2002). Since airport competition regulations are national, regulators may allow airport authorities some room to influence costs, although the latter are likely to become bound by the proposed directive on airport charges (section 9.3.2). The issue of the use of airport charges as an instrument of competition is considered in more detail in section 9.5. In addition, governments may levy charges themselves, so potentially influencing costs directly. For example, they may choose to levy lower charges on market segments for which hub airports compete, such as transfer passengers. In many cases governments have refrained from charging transfer passengers fees that are collected for direct passengers. The UK’s APD, the French Contribution de solidarité and the proposed Dutch Vliegticketbelasting all exempt transfer passengers. Lenient environmental regulation of an airport may have an impact on the competitiveness of an airport/home carrier combination, but this is by no means a straightforward relation. It depends in part on the form of the environmental legislation. For example, if an airport’s capacity is constrained because of noise regulations, more lenient regulations would result in more aircraft movements, from which the home carrier might profit. Conversely, if more stringent regulations took the form of banning marginally compliant aircraft43, whether the home carrier or other carriers were more affected would depend upon the condition of their respective fleets. If the home carrier had no noisy aircraft, it might profit from the ban, which would free up slots for its own operations or impose costs on its competitors. In contrast, if the home carrier did have noisy aircraft, it would incur costs as a result of the ban. For a physically constrained airport (i.e. an airport that is not constrained by noise regulations but by runway capacity), adjusting the stringency of noise regulations may have different effects. It may still help to expand capacity by allowing more large and therefore noisy aircraft to depart. But it may have a limited effect since noise is not the factor determining capacity. To generalise, the impact of noise regulation (and by analogy also of local air quality regulation) depends on the constraints under which the airport operates, including the availability of slots at attractive times, the fleet of the home carrier and the fleet of other carriers. These interactions are too complex to analyse in a simple cause-effect relation.
43 These are defined in EU Directive 2002/30 (EC, 2002) as aircraft that that meet ‘the (ICAO noise)
certification limits by a cumulative margin of not more than 5EPNdB (effective perceived noise in decibels)’.
4.504.1/The economics of Heathrow expansion February 2008
75
To sum up, regulators are able to influence the competitive position of an airport/home carrier combination under their control. They can influence the cost of using the airport as a hub through the charges they levy. A more indirect way is to change the regulatory regime so as to allow airports more freedom in setting their own charges. Regulators and other authorities can also influence the quality of an airport by defining night regimes favourable to long-haul schedules and by spatial planning to enable it to expand.
9.3.5 Noise regulator at the four major hub airports
Having considered the potential of regulators to affect the competitive position of hub airports, we now discuss the situation at the hub airports in more detail. Noise regulation measures can generally be divided into two categories (Stratagem and Adecs Air Infra, 2007), according to whether they act on the demand side or on the supply side of an airport. For example, the demand side is influenced if airlines have to pay noise-related fees, whereas the supply side is affected if the airport is not allowed to make use of a specific runway at night. Stratagem and Adecs Air Infra (2007) give an overview of the demand- and supply-side noise regulation of 14 European hub airports. The regulations the four major hubs have in common include daytime restrictions on approach and fly-out routes, a recommendation to use specific runways, noise-related fees and night-time restrictions on runway use. Below we consider whether noise regulation in the UK, the Netherlands, France and Germany is formulated so as to favour hub airports. An example of demand-side noise regulation that favoured hub airports would be noise regulation that was less strict with respect to the hubs’ transfer traffic. By contrast, less strict noise regulation on the supply side would not favour transfer traffic only. But since capacity seems to be perceived as an important instrument of competition between hub airports it is nevertheless interesting to analyse whether the use of the existing capacity at such airports is highly restricted, whether the authorities favour an expansion of capacity, and whether there is evidence that noise regulations are being relaxed to this end. In order for a relaxation of noise regulations to be employed as an instrument to increase capacity, the physical capacity of the airports affected would need to be currently underused, ie noise regulations would have to be constraining their capacity. A crucial question is therefore the extent to which the use of the existing capacity is being restricted by noise regulations. The analysis by Stratagem and Adecs Air Infra (2007) comes to the conclusion that Amsterdam Schiphol, Paris Charles de Gaulle and London Heathrow are unable to use their existing potential capacity fully during peak hours, whereas Frankfurt can. Amsterdam is restricted the most (67% of capacity used) followed by Charles de Gaulle (94%) and then Heathrow (96%). Thus existing capacity is only significantly restricted at Schiphol, so only at Schiphol would relaxing noise regulations be an especially
4.504.1/The economics of Heathrow expansion February 2008 76

effective instrument to increase capacity at peak hours44. However, it should be noted that noise regulations may also affect overall capacity, and at most airports night-time capacity is severely affected by noise regulations. Most of the major European hubs thus are at or close to physical capacity during peak hours, and there the debate about noise regulation is not about using existing runway and terminal capacity, but about expansion of the physical capacity. The German Government has given clear backing to the building of a new runway at Frankfurt (BMVBS, 2000). The German law on aircraft noise was amended in 2007. Under the amended legislation the focus is now on passive protection against noise (e.g. noise insulation), with airports being obliged to pay more for noise protection measures in their vicinity. The UK Government also appears to be supporting a new runway at Heathrow on condition that stringent environmental limits can be met (DfT, 2003).
9.3.6 Conclusions
Three entities - airlines, hub airports and regulators - are involved in the competition for transfer passengers, and they sit in a nested relationship. Airlines compete directly for transfer passengers. Hubs influence the competitive position of airlines to some extent. In turn, regulators influence the competitive position of hub/home carrier combinations to a degree. Regulators may influence the price of a journey directly by designing possible levies in such a way as to exempt transfer passengers. They may also take a strict approach to regulating airport charges. They can also increase the convenience of an airport by defining night regimes favourable to long-haul schedules and authorities may use spatial planning to allow airports to expand and so increase their number of flights.
44 Interestingly, research by the Dutch Environmental Assessment Agency has shown that, since 1990,
governments have consistently relaxed Schiphol’s noise regulations without either presenting a new cost/benefit analysis or making a formal political decision to weight the costs and benefits of Schiphol differently (MNP, 2007). The noise regulations have been relaxed for example by altering the noise restriction methodology. In setting the annual maximum permitted number of flights, modellers had previously assumed that aircraft followed their prescribed paths. If this were true, the number of houses around Schiphol affected by noise would be 10,000, and this was what the regulation aimed for. When however it became clear that aircraft frequently deviated from their prescribed paths, thus affecting a larger number of houses, the number of houses allowed to be affected was increased. As a result, the noise regulation limit, expressed as the maximum number of houses that may be affected by noise impacts above a certain level, has been made 10% higher.
4.504.1/The economics of Heathrow expansion February 2008
77
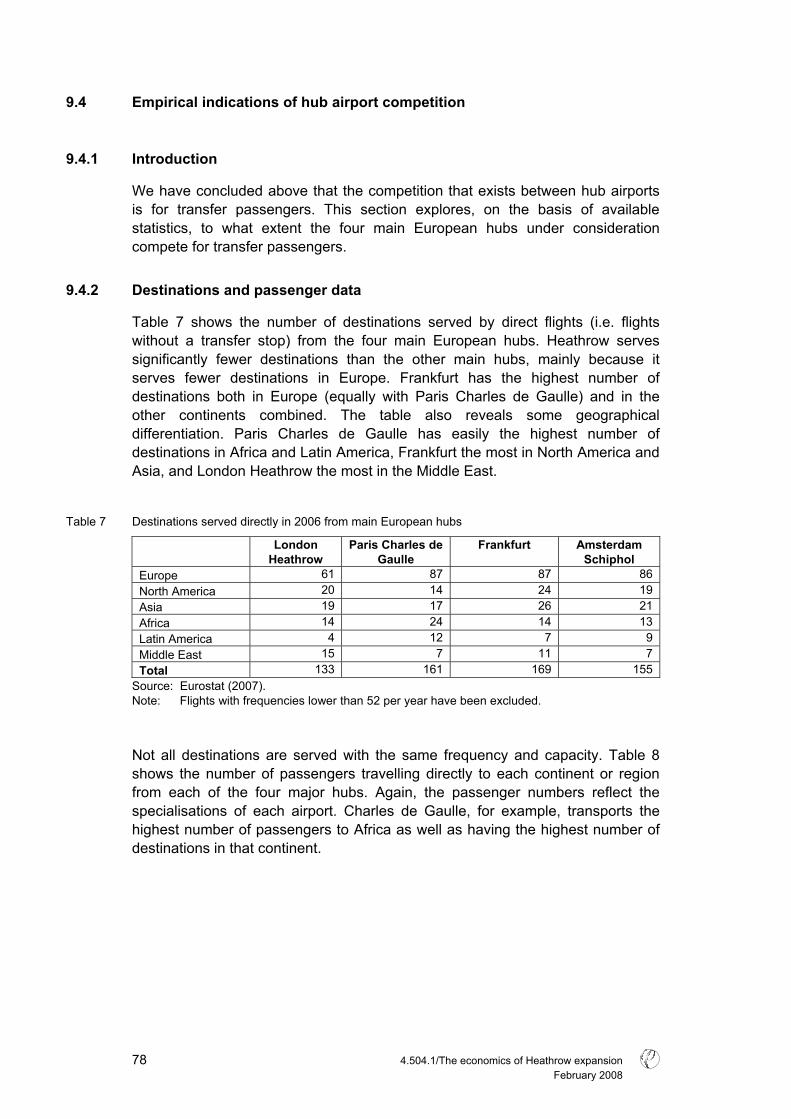
9.4 Empirical indications of hub airport competition
9.4.1 Introduction
We have concluded above that the competition that exists between hub airports is for transfer passengers. This section explores, on the basis of available statistics, to what extent the four main European hubs under consideration compete for transfer passengers.
9.4.2 Destinations and passenger data
Table 7 shows the number of destinations served by direct flights (i.e. flights without a transfer stop) from the four main European hubs. Heathrow serves significantly fewer destinations than the other main hubs, mainly because it serves fewer destinations in Europe. Frankfurt has the highest number of destinations both in Europe (equally with Paris Charles de Gaulle) and in the other continents combined. The table also reveals some geographical differentiation. Paris Charles de Gaulle has easily the highest number of destinations in Africa and Latin America, Frankfurt the most in North America and Asia, and London Heathrow the most in the Middle East.
Table 7 Destinations served directly in 2006 from main European hubs
London
Heathrow Paris Charles de
Gaulle Frankfurt
Amsterdam
Schiphol Europe 61 87 87 86 North America 20 14 24 19 Asia 19 17 26 21 Africa 14 24 14 13 Latin America 4 12 7 9 Middle East 15 7 11 7 Total 133 161 169 155
Source: Eurostat (2007). Note: Flights with frequencies lower than 52 per year have been excluded. Not all destinations are served with the same frequency and capacity. Table 8 shows the number of passengers travelling directly to each continent or region from each of the four major hubs. Again, the passenger numbers reflect the specialisations of each airport. Charles de Gaulle, for example, transports the highest number of passengers to Africa as well as having the highest number of destinations in that continent.
4.504.1/The economics of Heathrow expansion February 2008 78

Table 8 Number of passengers on direct flights in 2006 from main European hubs (millions)
London Heathrow
Paris Charles de Gaulle
Frankfurt
Amsterdam Schiphol
Europe 34 32 30 27 North America 14 7 8 5 Asia 8 5 7 4 Africa 3 5 2 2 Latin America 1 3 1 1 Middle East 4 2 2 0 Total 64 53 49 40
Source: Eurostat (2007). This geographical differentiation is further highlighted in Table 9 and Table 10. Table 9 shows the number of destinations per continent that are connected to all four main hubs by direct flights. One-fifth of all destinations are served from all main hubs, but this average hides large differences between the continents. Whereas over 40% of all Asian destinations are connected directly to all four hubs, only 7% of the African destinations are.
Table 9 Number of destinations served by all four main European hubs, 2006
Number of destinations Share of total Europe 28 19% North America 10 34% Asia 12 41% Africa 3 7% Latin America 2 10% Middle East 2 15% Total 57 20%
Source: Eurostat (2007). Note: Flights with frequencies lower than 52 per year have been excluded. Table 10 shows the number of destinations served by only one of the four hubs, and indicates that the differentiation is most pronounced in Paris, which serves 42 destinations that are not served by any of the other hubs, with Amsterdam having 27 such destinations45. The balance of the figures might look different if, instead of London Heathrow, all London airports were taken into consideration.
45 London Gatwick and Paris Orly were not included in the analysis. However, a brief analysis of their route
networks in 2006, using the same data source, reveals that these two airports have very few unique destinations, so they do not change the number of destinations from London or Paris significantly. Neither do they seem to serve regions that the other airport in the same city does not serve. In other words, there is very little regional specialisation among airports in the same city.
4.504.1/The economics of Heathrow expansion February 2008
79
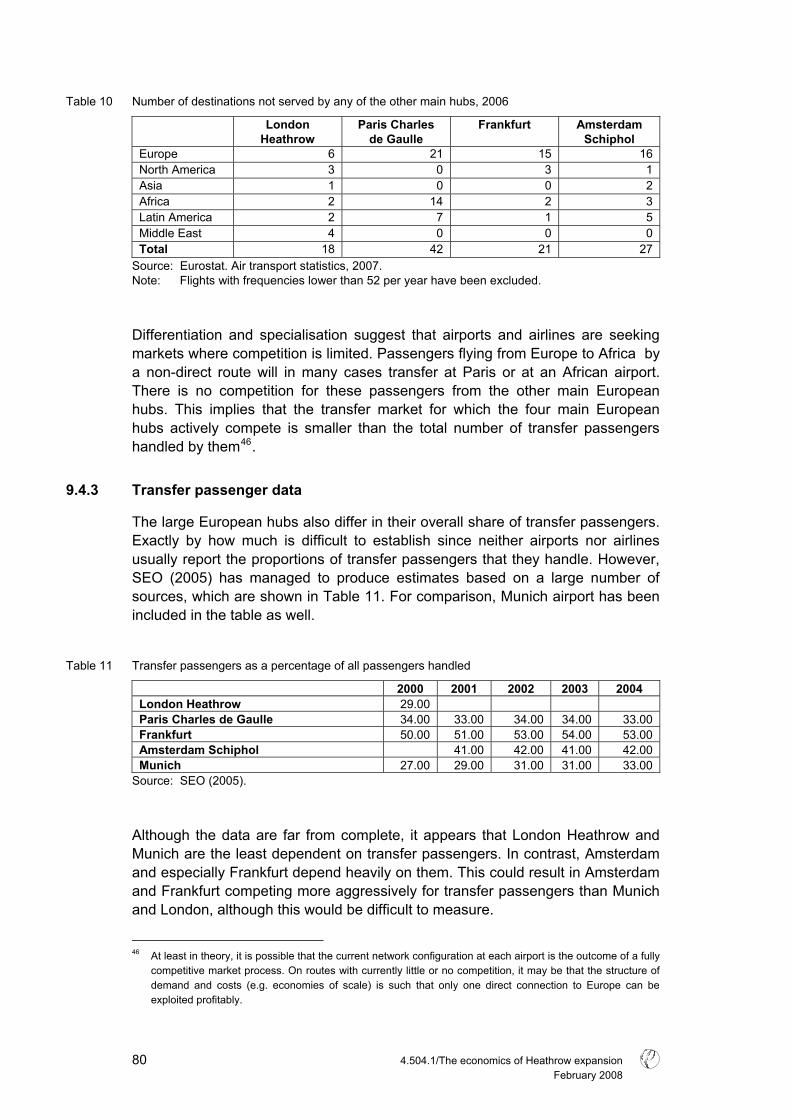
Table 10 Number of destinations not served by any of the other main hubs, 2006
London
Heathrow Paris Charles
de Gaulle Frankfurt
Amsterdam
Schiphol Europe 6 21 15 16 North America 3 0 3 1 Asia 1 0 0 2 Africa 2 14 2 3 Latin America 2 7 1 5 Middle East 4 0 0 0 Total 18 42 21 27
Source: Eurostat. Air transport statistics, 2007. Note: Flights with frequencies lower than 52 per year have been excluded. Differentiation and specialisation suggest that airports and airlines are seeking markets where competition is limited. Passengers flying from Europe to Africa by a non-direct route will in many cases transfer at Paris or at an African airport. There is no competition for these passengers from the other main European hubs. This implies that the transfer market for which the four main European hubs actively compete is smaller than the total number of transfer passengers handled by them46.
9.4.3 Transfer passenger data
The large European hubs also differ in their overall share of transfer passengers. Exactly by how much is difficult to establish since neither airports nor airlines usually report the proportions of transfer passengers that they handle. However, SEO (2005) has managed to produce estimates based on a large number of sources, which are shown in Table 11. For comparison, Munich airport has been included in the table as well.
Table 11 Transfer passengers as a percentage of all passengers handled
2000 2001 2002 2003 2004 London Heathrow 29.00 Paris Charles de Gaulle 34.00 33.00 34.00 34.00 33.00 Frankfurt 50.00 51.00 53.00 54.00 53.00 Amsterdam Schiphol 41.00 42.00 41.00 42.00 Munich 27.00 29.00 31.00 31.00 33.00
Source: SEO (2005). Although the data are far from complete, it appears that London Heathrow and Munich are the least dependent on transfer passengers. In contrast, Amsterdam and especially Frankfurt depend heavily on them. This could result in Amsterdam and Frankfurt competing more aggressively for transfer passengers than Munich and London, although this would be difficult to measure.
46 At least in theory, it is possible that the current network configuration at each airport is the outcome of a fully
competitive market process. On routes with currently little or no competition, it may be that the structure of demand and costs (e.g. economies of scale) is such that only one direct connection to Europe can be exploited profitably.
4.504.1/The economics of Heathrow expansion February 2008 80
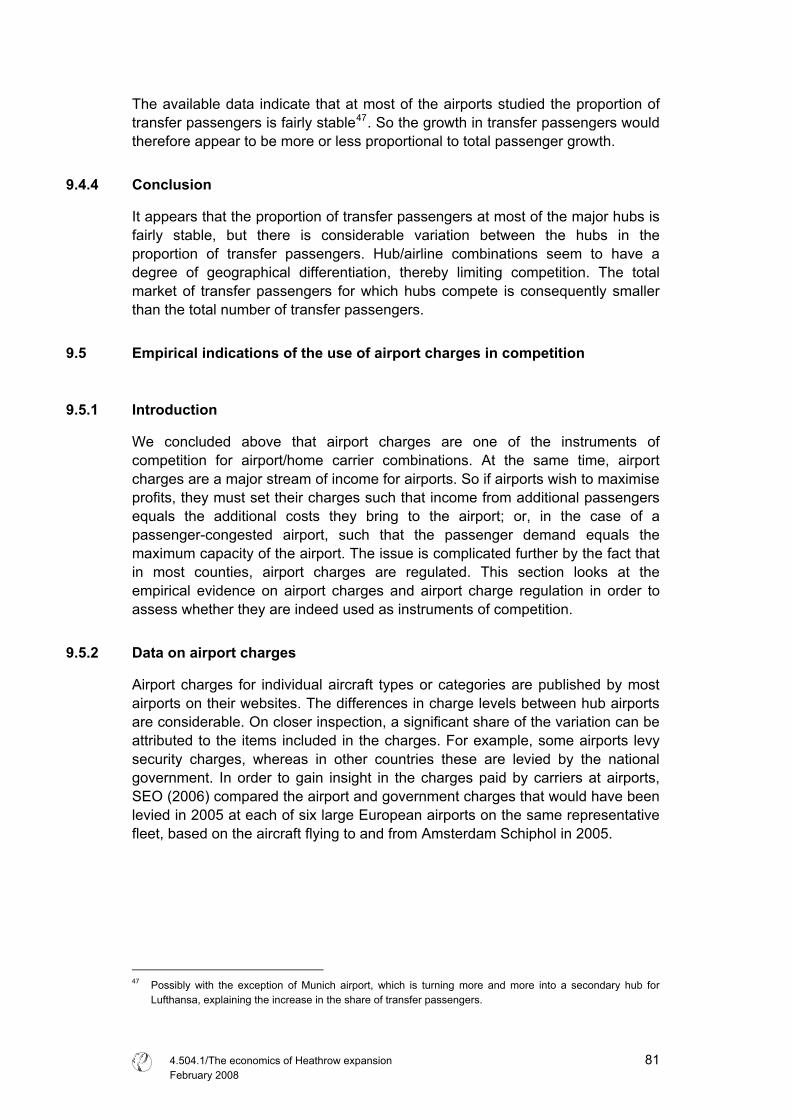
The available data indicate that at most of the airports studied the proportion of transfer passengers is fairly stable47. So the growth in transfer passengers would therefore appear to be more or less proportional to total passenger growth.
9.4.4 Conclusion
It appears that the proportion of transfer passengers at most of the major hubs is fairly stable, but there is considerable variation between the hubs in the proportion of transfer passengers. Hub/airline combinations seem to have a degree of geographical differentiation, thereby limiting competition. The total market of transfer passengers for which hubs compete is consequently smaller than the total number of transfer passengers.
9.5 Empirical indications of the use of airport charges in competition
9.5.1 Introduction
We concluded above that airport charges are one of the instruments of competition for airport/home carrier combinations. At the same time, airport charges are a major stream of income for airports. So if airports wish to maximise profits, they must set their charges such that income from additional passengers equals the additional costs they bring to the airport; or, in the case of a passenger-congested airport, such that the passenger demand equals the maximum capacity of the airport. The issue is complicated further by the fact that in most counties, airport charges are regulated. This section looks at the empirical evidence on airport charges and airport charge regulation in order to assess whether they are indeed used as instruments of competition.
9.5.2 Data on airport charges
Airport charges for individual aircraft types or categories are published by most airports on their websites. The differences in charge levels between hub airports are considerable. On closer inspection, a significant share of the variation can be attributed to the items included in the charges. For example, some airports levy security charges, whereas in other countries these are levied by the national government. In order to gain insight in the charges paid by carriers at airports, SEO (2006) compared the airport and government charges that would have been levied in 2005 at each of six large European airports on the same representative fleet, based on the aircraft flying to and from Amsterdam Schiphol in 2005.
47 Possibly with the exception of Munich airport, which is turning more and more into a secondary hub for
Lufthansa, explaining the increase in the share of transfer passengers.
4.504.1/The economics of Heathrow expansion February 2008
81
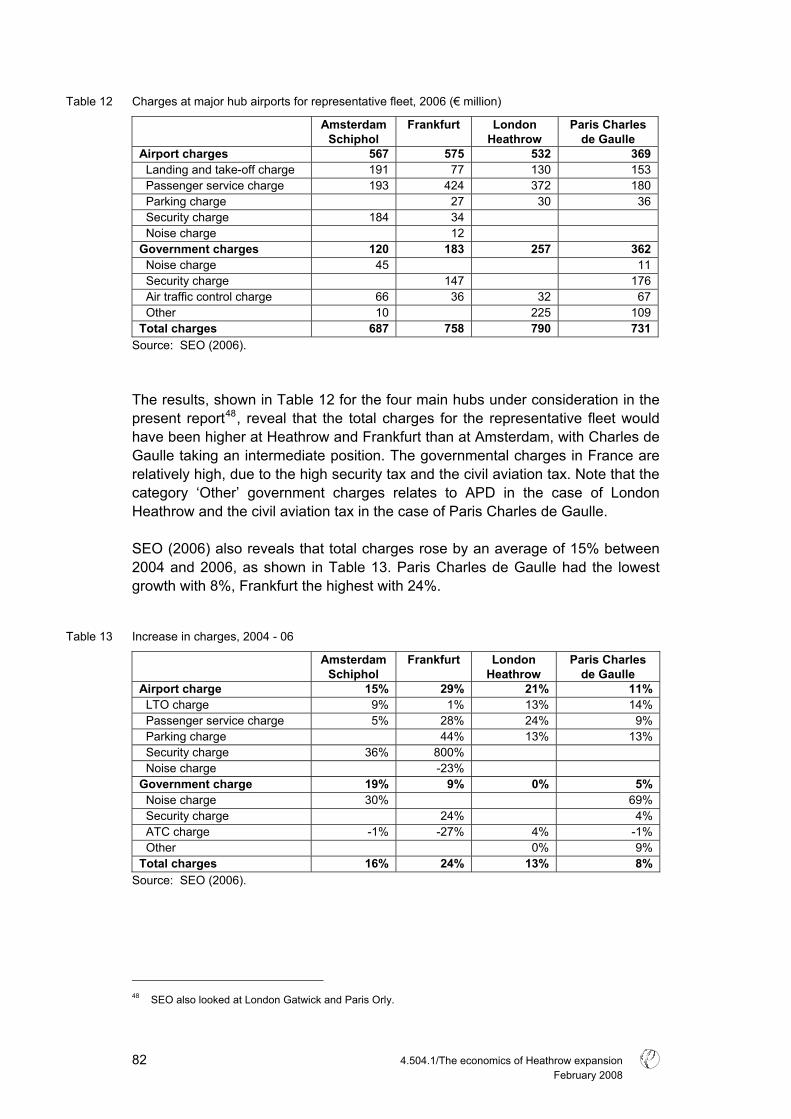
Table 12 Charges at major hub airports for representative fleet, 2006 (€ million)
Amsterdam Schiphol
Frankfurt London Heathrow
Paris Charles de Gaulle
Airport charges 567 575 532 369 Landing and take-off charge 191 77 130 153 Passenger service charge 193 424 372 180 Parking charge 27 30 36 Security charge 184 34 Noise charge 12 Government charges 120 183 257 362 Noise charge 45 11 Security charge 147 176 Air traffic control charge 66 36 32 67 Other 10 225 109 Total charges 687 758 790 731
Source: SEO (2006). The results, shown in Table 12 for the four main hubs under consideration in the present report48, reveal that the total charges for the representative fleet would have been higher at Heathrow and Frankfurt than at Amsterdam, with Charles de Gaulle taking an intermediate position. The governmental charges in France are relatively high, due to the high security tax and the civil aviation tax. Note that the category ‘Other’ government charges relates to APD in the case of London Heathrow and the civil aviation tax in the case of Paris Charles de Gaulle. SEO (2006) also reveals that total charges rose by an average of 15% between 2004 and 2006, as shown in Table 13. Paris Charles de Gaulle had the lowest growth with 8%, Frankfurt the highest with 24%.
Table 13 Increase in charges, 2004 - 06
Amsterdam Schiphol
Frankfurt London Heathrow
Paris Charles de Gaulle
Airport charge 15% 29% 21% 11% LTO charge 9% 1% 13% 14% Passenger service charge 5% 28% 24% 9% Parking charge 44% 13% 13% Security charge 36% 800% Noise charge -23% Government charge 19% 9% 0% 5% Noise charge 30% 69% Security charge 24% 4% ATC charge -1% -27% 4% -1% Other 0% 9% Total charges 16% 24% 13% 8%
Source: SEO (2006).
48 SEO also looked at London Gatwick and Paris Orly.
4.504.1/The economics of Heathrow expansion February 2008 82

Although Frankfurt had the highest charges in 2006 and those charges had grown at the fastest rate, one cannot directly draw the conclusion from SEO (2006) that Frankfurt had not assisted its main carrier in attracting more passengers or cargo. The charge structure at Frankfurt may be very favourable to the fleet of its home carrier. All we can say is that for the representative Amsterdam fleet, charges would have risen quickly at Frankfurt between 2004 and 2006.
Table 14 Passenger fees (2007) (€ per passenger)
Amsterdam Schiphol
Frankfurt London Heathrow
Paris Charles de Gaulle
Departing passenger fee 13.00 18.80 15.92 13.51 Transfer passenger fee 5.46 10.00 15.92 8.78 Rebate (%) 58 47 0 35
Source: Airport published tariffs valid November 2007. Estimated using an exchange rate of £ 1 = €1.48. Note. Fees for ‘all passengers’ at Amsterdam Schiphol, ‘intercontinental passengers’ at Frankfurt, ‘international passengers’ at London Heathrow and Paris Charles de Gaulle. As already mentioned, airports may help their home carriers to attracting transfer passengers by levying different airport charges on direct and transfer passengers. Published tariffs (see Table 14) show that all the major hubs under consideration, except Heathrow, charge lower fees for transfer passengers than for direct passengers. Of course, lower fees for transfer passengers may be related to lower costs. Interestingly, the airports that have the highest proportion of transfer passengers also have the highest rebates for transfer passengers. We have not attempted to establish whether there is a causal relationship, but it is clear that the current rebates support their current high proportion of transfer passengers. In other words, hub airports seem to support their home carriers in attracting transfer passengers to the extent that transfer passengers are important to maintain airport network.
9.5.3 Governmental taxes
As we saw above, some governments have introduced air passenger taxes. These taxes can be seen as environmental regulation measures in a broader sense. Sometimes they are aimed at internalising external costs of air transport (in the case of the Netherlands), at attaining particular environmental goals (the UK), or even at broader goals such as global solidarity (France). All the aviation taxes considered here (the UK’s APD, the Dutch Vliegticketbelasting and the French Contribution de solidarité (CdS)) have in common that they apply only to passengers starting their journey at airports within the country that levies the tax. Taxes are differentiated with respect to final destination of the journey, irrespective of whether the flight is direct or involves a transfer at either a domestic or a foreign airport. For transfer passengers who started their journey abroad, no taxes accrue for a connecting flight. Both the
4.504.1/The economics of Heathrow expansion February 2008
83

APD and the CdS are differentiated according to class of travel (with higher taxes for premium passengers). This approach guarantees that no matter where passengers start their journey, either in the country in question or in another country with or without passenger taxation, they will not be influenced by the tax in their decision of whether to take a direct flight or an indirect flight. Flights involving a transfer generally have higher greenhouse gas emissions per passenger than direct flights with the same origin and final destination. Whether associated ground noise is higher depends on the aircraft used. Therefore one could argue that a tax that is aimed at improving the environment should be set at a higher tariff for transfer flights. However, this is not the case for APD or the Vliegticketbelasting (while the CdS has no direct environmental objective, being aimed at raising revenue for development assistance). This being so, it could be said that the taxes are designed so as to favour hub airports. In the UK there are plans to transform APD. Because it currently provides no incentive for cleaner aircraft, and its differentiation with regard to distance is not at all detailed, it is not considered an effective environmental policy instrument. The intention is to transform it into a duty payable per aircraft rather than per passenger. How this will be done is presently unclear. The Dutch report setting out public finance for 2008 (Tweede Kamer, 2007) states that making transfer passengers liable to the Vliegticketbelasting has not been considered, as this would be detrimental to Schiphols ‘main port function’, which is the hub function.
9.5.4 Conclusion
Although the composition of airport charges varies considerably between airports, the total charges for a given fixed fleet vary less. The element of airport charges that affects competition for transfer passengers is the passenger charge. Here, all major hubs except for Heathrow offer rebates for transfer passengers. These rebates are larger in the case of the airport/home carrier combinations that depend more on transfer passengers. So it seems that some hub airports do support their home carriers in competing on price. This assistance is supplemented by the national passenger taxes considered, which are designed so as to safeguard the hub function by exempting transfer traffic.
4.504.1/The economics of Heathrow expansion February 2008 84
9.6 How is competition between hubs likely to develop?
9.6.1 Introduction
At the beginning of this chapter, we concluded that hub/airline combinations, compete for transfer passengers. This section deals with the question of how competition, or rather the market for which the hub/airline combinations are competing, is likely to develop in the future. Will the market for transfer traffic continue to grow, or is it likely that more and more traffic will be point-to-point? We look first at the historical development of transfer traffic (section 9.6.2). Second, we assess several different forecasts of how long-haul air travel is likely to evolve (section 9.6.3). Section 9.6.4 concludes.
9.6.2 The historical development of transfer traffic
Development of transfer traffic in the United Kingdom Transfer traffic is most prominent on long-haul (intercontinental) routes. On short-haul routes, direct flights are dominant, and increasingly so as a result of the growth of low-cost point-to-point operators who have opened up many new direct short-haul routes. Consequently this section focuses on long-haul traffic. In its report on long-haul passenger operations, the UK CAA (2007a) signals an average annual growth in long-haul passengers from the UK of 4.1% in the period 1996 - 2006. This is despite the decreases in air traffic caused by the economic slowdown and the 9/11 events of 2001, and the outbreak of SARS in 2003. However, growth in passenger numbers on long-haul flights appears to have been somewhat less than growth in short- and medium-haul numbers. DfT’s Transport Statistics for Great Britain (DfT, 2007) report an average growth of Great Britain to EU traffic of 6.4% between 1996 and 2006, albeit with a slightly different definition to that used by the CAA in its report. The majority of passengers on long-haul flights into or out of the UK make at least one connection at either end of the flight (CAA, 2007a). Direct flights dominate very few markets, such as flights from the UK to Latin America and to the Indian subcontinent. For flights to all other regions, transfer flights predominate. There does not seem to be a pronounced trend towards either more direct or more indirect long-haul flights. If anything, the proportion of indirect flights seems to be growing slowly: whereas in 1996 68% of all passengers flying from a UK airport to a long-haul destination flew direct, in 2006 only 64% did so (UK CAA, 2007a). Despite the fact that more UK airports offered direct long-haul flights in 2006 than in 1996, the proportion of UK long-haul passengers transferring at a domestic airport has remained constant over that period.
4.504.1/The economics of Heathrow expansion February 2008
85

Likewise, most of the new long-haul services from secondary airports in the past decade have been to hubs outside the EU (Dennis, 2005; UK CAA, 2007a). The opening of new direct long-haul routes seems not to have reduced the overall number or the proportion of transfer passengers. Some transfer at foreign hubs, many continue to transfer at UK hubs.
Global development of transfer traffic In its most recent Global Market Forecast, Airbus (2006) notes that the main areas of growth in air traffic have been between and to and from hub airports. According to Airbus, many direct routes between non-hub airports have opened up in the past 20 years, but their failure rate has been high. Of routes with at least one hub, a smaller proportion has been discontinued, while almost all the routes between hub airports that have opened in the past 20 years are still operated today. This seems to indicate that the hub concept has been dominant in the past 20 years and has attracted a major proportion of aviation growth, at least on the long-haul market. Since hubs by definition handle transfer passengers, it is likely that the past 20 years have also seen an increase in the number of transfer passengers. To summarise, the reports considered here seem to indicate that in the past 10 to 20 years, the market for long-haul transfer passengers has grown at least at the same rate as the total market for long-haul air travel.
9.6.3 Forecasts of the development of long-haul air travel
There are two contradictory opinions as to how long-haul air travel is likely to evolve in the coming decades. One opinion stresses that traffic growth has historically been concentrated on routes between hubs and routes to or from hubs. This school of thought, subscribed to for example by Airbus (2006) and Dennis (2005), forecasts the continuing dominance of the hub-and-spoke model in long-haul traffic and likewise forecasts an increasing number of transfer passengers. Proponents of the hub-growth school of thought point to the fact that all major hubs are located in the vicinity of major centres of economic activity, ie near thriving cities. They say that these cities will generate a growing demand for aviation that will enable hubs’ home carriers to expand and improve their networks. In order to improve their networks even further, home carriers will have a strong incentive to attract passengers from outside their catchment areas. The other opinion stresses that economic growth and liberalisation will result in more direct connections between major cities. This view is argued by Boeing, which in its Current Market Outlook 2007 (Boeing, 2007) stresses that many major cities (i.e. those with over 6 million inhabitants) have ‘a remarkably low number of direct air connections to other key destinations’. Restrictive regulation is one of the causes of this situation. But as markets open up and restrictions are lifted, more direct connections will be established. Furthermore, Boeing stresses
4.504.1/The economics of Heathrow expansion February 2008 86

that major hubs are suffering from congestion and that as a result, airlines are moving flights to secondary airports. It is not immediately clear how transfer passenger levels would be affected were this forecast to become reality. More direct links from major cities could result in the establishment of new hubs in regions that currently have a low density of hubs, such as Asia and South America. This would potentially lead to an increase in worldwide transfer passenger numbers. The impact on the proportion of transfer passengers at European airports is not clear.
9.6.4 Conclusion
In the past 20 years, the growth in long-haul air traffic has strengthened the transfer market and thus the position of hub airports. Transfer traffic on long-haul routes appears to have grown at least at the same pace as total long-haul traffic, at least in the UK. New long-haul routes from non-hub airports often serve hubs outside the EU, where passengers may change to a connecting flight. As for future development, there are two opposing scenarios. One forecasts the continuing dominance of hubs and thus a growth in transfer passengers. The other forecasts the emergence of new hubs and more direct connections from secondary airports. This might result in a reduced dominance of the current hubs, but it would not necessarily impact on the level of growth in transfer passengers globally.
9.7 Government attitudes to hub airport competition
9.7.1 Introduction
The aviation market is associated with various types of pollution such as greenhouse gas emissions, air pollutants and noise. Of these negative externalities, noise and air pollution are directly associated with airports. Greenhouse gas emissions are a global externality; their impacts on the climate are borne all over the world, not just in the vicinity of airports. As a local pollution, noise pollution calls in general for local or national regulation. Trade-offs between noise and the economic benefits of airports can best be made at the national or local level, where the effects are felt. However, it is conceivable that competition between hub/home carrier combinations is so fierce that it results in governments relaxing environmental regulation at the expense of people living in the vicinity of their airports in order to secure the competitive position of those airports. If this were to occur, the trade-off of economic benefits and environmental damages could result in an inefficient outcome, i.e. an outcome where the marginal damage costs exceed the marginal economic benefits. International harmonisation of environmental regulation of airports could be a remedy for this. Of course, the possible positive effects of harmonisation
4.504.1/The economics of Heathrow expansion February 2008
87

would have to be weighed against the reduced freedom for countries to set their own optimal noise levels. With these considerations in mind, in this section we analyse the perceptions of the UK, Dutch and German authorities with regard to the competitive situation of the major European hub airports, making use of government statements and reports49.
9.7.2 Perception of hub airport competition by public authorities
It is clear from their pronouncements that the UK, Dutch and German governments have an unambiguous perception of the four major European hub airports as competitors for their hub function, and that they consider sufficient capacity as the most important instrument of competition. They argue that demand for air traffic is going to rise considerably in the future, so that airports will sooner or later reach their capacity limit. Scarce capacity at a particular airport would then lead to a decline in market share. This would impact negatively on the network centred on that airport, and as a consequence national welfare would suffer. A few quotes from UK government documents underline this point. DfT (2002) predicts what will happen if capacity at Heathrow is not increased: ‘The route network and destinations served by London airports would also change (…). The total number of destinations would fall and, inevitably, London’s route network would be eroded compared with Paris, Frankfurt and Amsterdam’ (p20). It goes on to say that ‘It is clear that with demand for air travel set to increase, if we do not respond our European competitors will be well-placed to serve that demand’ (p22). In its progress report The Future of Air Transport (DfT, 2006), DfT states with respect to the 2003 White Paper that ‘without additional runway capacity, Heathrow’s competitive position will diminish to the disadvantage of the UK economy and to the advantage of continental hub airports which are continuing to grow’ (p30). In its airport concept document, the German Federal Government also acknowledges the existence of international competition between airports (BMVBS, 2000). It identifies European hub airports such as Amsterdam, Brussels, Copenhagen, London, Paris, Vienna and Zurich as competitors of Frankfurt and Munich (p31). It also points out (p33) that Frankfurt and Munich have a competitive advantage over their European competitors Amsterdam and London Heathrow in the field of baggage handling, which contributes to shorter turn-around times. The German Government clearly supports the elimination of capacity constraints at the competing international airports:
49 The perceptions of the French Government are not discussed here. Although we were able to locate
governmental statements on airport policy via internet research, the competitive position of Paris Charles de Gaulle did not form the subject of these reports.
4.504.1/The economics of Heathrow expansion February 2008 88

Provided that operations at German airports do not impact negatively on the environment and residents, it is important for the strengthening of the multifunctional airport system and for the protection and stimulation of Germany’s attractiveness as a business location factor that the performance of German airports should be maintained, and moreover that it should be improved by eliminating capacity constraints on the ground and in the air. This holds especially in view of the fact that air traffic, just like airports, is globally competitive, and that it encounters capacity constraints due to continuously rising demand and simultaneously tightening environmental regulations (BMVBS, 2000, p30 - translation CE Delft).
The Dutch Government states in its official position paper on Schiphol: ‘The competitive position of Schiphol is obviously determined to a large extent by the available capacity at the other three large hubs and by the home carriers than make use of these hubs’ (Dutch Government, 2006 - translation CE Delft). But in the same paper, the Dutch Government acknowledges that at some point in the future, Schiphol may be large enough to retain its competitive position (or ‘mainport function’ in Dutch government jargon) without further growth. Interestingly, most official reports by the three governments do not specify whether the deterioration of the network that they predict in the absence of additional capacity would be absolute or relative. The one that does address this issue seems to argue that route networks would decline in absolute terms. DfT (2003) states: ‘It appears to be generally accepted that without additional capacity, Heathrow’s route network will tend to shrink over time, most likely to the advantage of other continental hub airports’ (p120). However, research by NYFER indicates that hubs are unlikely to decline to the status of secondary airports (NYFER, 2000). After all, hubs are located near important home markets, and with current aviation technology there is little scope for reducing travel times or costs by changing hubs. Governments hardly ever mention non-European hubs as competitors, even though they are on many routes, as illustrated in section 9.2.
9.7.3 Conclusion
To summarise, the perception of the UK, Dutch and German governments is unambiguous: the four major European hub airports do compete for their hub function with each other and with other European hubs. Adequate capacity is considered to be the most important instrument of competition. The official government reports reviewed consistently argue that airports contribute to economic growth; that in order for them to continue to do so, their capacity is a major factor in preventing passengers being lost to other airports; and that this is a justification for airport expansion, which, in some cases, they acknowledge needs to be balanced against environmental concerns.
4.504.1/The economics of Heathrow expansion February 2008
89
9.8 Conclusion
In this part of the report we have analysed the nature of competition between hub airports. From our analysis, it can be concluded that hub airports compete mainly for transfer passengers. This competition is not limited to the four major European hubs, but extends to minor European hubs and hubs on other continents. Hub competition is not straightforward, but is nested, since it is not hubs that compete directly for passengers, but rather airlines. In most cases, choosing an airline is tantamount to choosing a hub. And since most airlines have hubs in one jurisdiction only, choosing an airline is also tantamount to choosing a regulator. This nested relationship means that regulators can assist hubs, which in turn can assist airlines in their competition for transfer passengers. In the past decade, the market for which hubs are competing, albeit indirectly - transfer passengers - has grown at about the same rate as air transport in general, at least over long-haul routes. For most major hubs, the proportion of their passengers who are transfer passengers seems to have remained fairly stable despite the growth in direct long-haul flights from secondary airports. With regard to future developments, two contradictory views prevail. One view forecasts that current growth patterns will continue, with most new routes operating either to, from or between hubs. In this view, the transfer market will probably remain important for decades to come. The alternative view notes that a significant number of large cities around the world have no major airport yet. It expects airports in these cities to grow and to serve an increasing number of destinations directly. This may result in a reduced dominance of the current hubs, but it will not necessarily impact on the level of growth in transfer passengers globally. Most hubs assist home carriers in competing for transfer passengers and use the instruments of competition at their disposal. They often set charges for transfer passengers lower than charges for direct passengers, thus enabling their home carriers to engage in price competition for transfer passengers. They also assist airlines in competition on quality, although they can hardly influence the most valuable instruments of competition, namely the time and duration of the flight and the frequency of the service. Regulators and other authorities are aware of the competition between hub airports. They often act to support the competitive position of the hub or hubs in their jurisdiction. The clearest example is the exemption of transfer passengers from government taxes and charges. Other examples include support for the expansion of airports.
4.504.1/The economics of Heathrow expansion February 2008 90
In principle, in some cases regulators could also assist hubs and home carriers in their competition by lowering environmental standards, for example on noise or local air pollution. Establishing whether this does in fact occur was beyond the scope of this study. However, one should ask whether, if regulators were found to be lowering environmental standards in order to improve the competitive position of their hubs, this would represent a reason for harmonising regulation at an EU or global level. This study has not carried out a survey of where the economic benefits of air travel accrue, but from the existing literature a picture emerges of most economic benefits from a given airport being within the region in which the airport is located (e.g. NYFER, 2000). The external effects of noise and local air pollution are also borne locally. The external effect of carbon dioxide emissions, climate change is global; it is, however, not an effect of individual airports but of aviation in general. So neither an airport’s positive externalities nor its negative externalities are experienced beyond the region of the airport. This conclusion suggests that the case for local or national regulation of airports is stronger than that for European or global regulation. Local or national regulation allows the lawmaker to weigh the benefits against the costs. As for aviation’s wider external effect of contributing to climate change, there is a strong case for European or global legislation. National or local policies aimed at reducing carbon dioxide emissions would reduce the positive externalities of aviation at a domestic level, but make a significant contribution to reducing the sector’s climate impact only if other nations were to imitate those policies. This being so, unfortunately, few nations would be willing to sacrifice their individual economic welfare to contribute to the greater good. This dilemma can only be solved by European or global policies to reduce aviation’s climate impact.
4.504.1/The economics of Heathrow expansion February 2008
91

4.504.1/The economics of Heathrow expansion February 2008 92

10 References
Aéroports de Paris (2006) Traffic 2006. www.aeroportsdeparis.fr/Adp/en-GB/Groupe/Finance/Investisseurs/Trafic/Accessed autumn 2007 Airbus (2006) Global Market Forecast 2006–2025. Airbus S.A.S, Blagnac, France. Airport Coordination Ltd (2007) Heathrow Summer 2007 Start of Season Report. Airport Coordination Netherlands (2007) Slot allocation list, Summer 2007. www.slotcoordination.nl/info_sal.asp Barkley, D.L. and McNamara, Kevin T. (1994) Manufacturers’ location decisions: Do surveys provide helpful insights? International Regional Science Review, 17(1) 23–47. BHC (2000) Berkeley Hanover Consulting, The impacts of future aviation growth in the UK. BMVBS (2000) Flughafenkonzept der Bundesregierung. Bundesministerium für Verkehr, Bau und Wohnungswesen, Germany. Boeing (2007) Current Market Outlook 2007. Boeing Commercial Airplanes, Seattle. CE Delft (2005) The contribution of aviation to the economy; Assessment of arguments put forward, Delft. Cranfield University, Air Transport Group, Alan Stratford Associates, INECO, Gruppo CLAS and Denton Wilde Spate (2002) Study on competition between airports and the application of state aid rules. Final Report for the European Commission DG TREN, Vol. 1.
Dennis, N.P.S. (2005) The development of long-haul air services from regional and secondary airports in Europe. Paper submitted to the 45th congress of the European Regional Science Association, Vrije Universiteit Amsterdam, 23–27 August.
4.504.1/The economics of Heathrow expansion February 2008
93

DfT (2002) The future development of air transport in the UK: South East. UK Department for Transport. DfT (2003) Passenger forecasts: additional analysis. UK Department for Transport. DfT (2006) The future of air transport progress report. UK Department for Transport. DfT (2007) Transport statistics for Great Britain: 2007 edition. UK Department for Transport. Dierikx, Mark (2000) Blue in the sky: KLM Royal Dutch Airlines, 1919–1999. Sdu Publishers, The Hague. Dutch Government (2006) Kabinetsstandpunt Schiphol. www.verkeerenwaterstaat.nl/Images/kabinetsstandpunt_tcm195-170661.pdf EC (1996) Council Directive 96/67/EC of 15 October 1996 on access to the ground handling market at Community airports. Official Journal of the European Union, L 272 , 25October, P. 0036 – 0045. EC (2002a) Directive 2002/30/EC of the European Parliament and of the Council of 26 March 2002 on the establishment of rules and procedures with regard to the introduction of noise-related operating restrictions at Community airports. Official Journal of the European Union, L 85, 28.03.2002, 40 – 46. EC (2002b) Directive 2002/49/EC of the European Parliament and of the Council of 25 June 2002 relating to the assessment and management of environmental noise – Declaration by the Commission in the Conciliation Committee on the Directive relating to the assessment and management of environmental noise. Official Journal of the European Union, L 189, 18.07.2002, 12 – 25. EC (2004) Regulation (EC) No 793/2004 of the European Parliament and of the Council of 21 April 2004 amending Council Regulation (EEC) No 95/93 on common rules for the allocation of slots at Community airports. Official Journal of the European Union, L 138, 30.04.2004, 50 – 60.
4.504.1/The economics of Heathrow expansion February 2008 94

EC (2005) Community guidelines on financing of airports and start-up aid to airlines departing from regional airports. Official Journal of the European Union, C 312, 1–14. EC (2007) Proposal for a Directive of the European Parliament and of the Council on airport charges. COM(2006) 820 final, 24 January. http://ec.europa.eu/transport/air_portal/airports/doc/2007_charges_en.pdf ECI (2006) Predict and decide: Aviation, climate change and UK policy. Environmental Change Institute, University of Oxford. Eurostat (2007) Air transport statistics, Detailed air passenger transport by reporting coutry and routes. Accessed autumn 2007. Fan, T.P. and Odoni, A.R. (2002) A practical perspective on airport demand management. Air Traffic Control Quarterly 10(3) 285–306. Fraport AG (2007) Lufthansa Heimathafen. www.ausbau.fraport.de/cms/default/rubrik/5/5850.lufthansa_heimathafen.htm Mill, J.S. (1848) Principles of Political Economy. MNP (2007) Letter from Netherlands Environmental Assessment Agency to the Minister of Transport, Public Works and Water Management and the Minister of Housing, Spatial Planning and the Environment on ‘Herziening normstelsel Schiphol’, May 4. NERA (2004) Study to assess the effects of different slot allocation schemes. Report for the European Commission, DG TREN. NERA Economic Consulting. www.nera.com/image/PUB_SlotAllocationSchemes_NPL.pdf NYFER (2000) Hub, of spokestad? NYFER Forum for Economic Research, Breukelen, Netherlands. OEF (1999) The contribution of the aviation industry to the UK economy. Oxford Economic Forecasting.
4.504.1/The economics of Heathrow expansion February 2008
95

OEF (2006) The economic contribution of the aviation industry in the UK. Oxford Economic Forecasting. Pezzey, J.C.V. (2003) Emission taxes and tradeable permits: A comparison of views on long-run efficiency. Environmental and Resource Economics 26(2) 329–342. SEO (2005) Luchthavenmonitor: tien Europese regio’s in de tijd vergeleken. SEO Report no. 793. SEO Economisch Onderzoek, Amsterdam. www.seo.nl/assets/binaries/publicaties/rapporten/2005/793.pdf SEO (2006) Luchthavengelden en Overheidsheffingen: Benchmark van zes Europese Luchthavens. SEO Report no. 911. SEO Economisch Onderzoek, Amsterdam. www.verkeerenwaterstaat.nl/Images/bijlage%20rapport_tcm195-162834.pdf Stern, N. (2007) Stern Review on the economics of climate change. www.hm-treasury.gov.uk/independent_reviews/stern_review_economics_ climate_change/sternreview_index.cfm Stratagem and Adecs Air Infra (2007) Internationale Benchmark capaciteitsontwikkeling luchthavens. Stratagem Strategic Research and Adecs Air Infra Tweede Kamer (2007) Belastingplan 2008, 2007–08, 31205, #3 UK CAA (2004) Introducing commercial allocation mechanisms: The UK CAA’s response to the European Commission’s staff working paper on slot reform. UK Civil Aviation Authority, London. www.caa.co.uk/docs/5/SlotReform-theUKCAAFinalResponse.pdf UK CAA (2006) No-frills carriers: Revolution or evolution. Report CAP770. UK Civil Aviation Authority, London. UK CAA (2007a) Connecting the continents: Long haul passenger operations from the UK. Report CAP771. UK Civil Aviation Authority, London. UK CAA (2007b) UK airport statistics: 2006 – annual. UK Civil Aviation Authority, London. http://www.caa.co.uk/default.aspx?catid=80&pagetype=88&pageid=3&sglid=3
4.504.1/The economics of Heathrow expansion February 2008 96

Weitzman, Martin L. (1974) Prices vs. quantities. Review of Economic Studies 41(4) 477–492.
4.504.1/The economics of Heathrow expansion February 2008
97

4.504.1/The economics of Heathrow expansion February 2008 98

4.504.1/The economics of Heathrow expansion February 2008
99
Report Delft, February 2008 Authors: Bart Boon
Marc Davidson Jasper Faber
Dagmar Nelissen Gerdien van de Vreede
The economics of Heathrow expansion
Annexes
CE Delft Solutions for environment, economy and
technology
Oude Delft 180
2611 HH Delft
The Netherlands
tel: +31 15 2150 150
fax: +31 15 2150 151
e-mail: [email protected]
website: www.ce.nl
KvK 27251086
CE DelftSolutions for
environment,
economy and
technology
Oude Delft 180
2611 HH Delft
The Netherlands
tel: +31 15 2 150 150
fax: +31 15 2 150 151
e-mail: [email protected]
website: www.ce.nl
KvK 27251086

4.504.1/The economics of Heathrow expansion February 2008 100
A Annex on statistical analysis
A.1 Statistical relations as described in OEF report Annex B
Annex B of the OEF report (OEF, 2006) gives two tables containing figures on sectoral growth and the use of air transport in the UK. The tables are reproduced below for clarity (Table 15 and Table 16).
Table 15 Sectoral growth and use of air transport - as the share of air transport in the sector’s total transport demand
Sectoral growth and use of air transport Growth in value added
1994–2004 Share of air in sector’s total
transport demand % year Rank (%, 2003) Rank
Computer activities 12.4 1 23.8 4 Communication 9.2 2 24.4 3 Computers and office equipment 8.8 3 6.6 18 Other business activities 6.7 4 21.7 5 R & D 6.3 5 17.6 6 Pharmaceuticals 5.7 6 3.0 27 Banking and finance 5.0 7 37.2 1 Distribution 3.7 8 2.4 30 Transport 3.7 8 5.2 21 Hotels & catering 2.7 10 10.1 12 Motor vehicles, parts & accessories 2.6 11 7.0 17 Construction 2.4 12 5.6 20 Electronic equipment 2.3 13 7.8 16 Non-market services 2.3 13 8.4 15 Other means of transport 2.2 15 14.6 7 Electricity, gas and water 2.0 16 1.4 33 Real estate and renting 1.9 17 10.9 10 Electrical engineering 1.5 18 6.6 18 Insurance 0.9 19 27.4 2 Precision and optical instruments 0.7 20 10.8 11 Non-metallic mineral extraction 0.6 21 2.8 29 Agriculture, forestry and fishing 0.5 22 2.2 31 Food, beverages and tobacco 0.5 22 2.0 32 Metal products n.e.c. 0.5 22 3.7 25 Rubber and plastics 0.5 22 2.9 28 Extraction 0.4 26 11.8 9 Other manufacturing 0.4 26 5.0 22 Paper, printing, publishing 0.3 28 9.3 14 Other chemicals 0.2 29 4.3 24 Mechanical engineering 0.1 30 4.4 23 Wood and wood products -0.2 31 0.0 34 Coke, petroleum & nuclear fuel -0.8 32 9.6 13 Basic metals -1.1 33 12.4 8 Textiles, leather and clothing -4.9 34 3.6 26 Rank correlation: 0.36
Source: OEF (2006), Table B.1.
4.504.1/The economics of Heathrow expansion February 2008
101

Table 16 Sectoral growth and use of air transport - as the spend per employee on air transport
Sectoral growth and use of air transport Growth in value added
1994-2004 Spend per employee
% year Rank (£, 2003) Rank Computer activities 12.4 1 193 14 Communication 9.2 2 895 5 Computers and office equipment 8.8 3 193 14 Other business activities 6.7 4 257 11 R & D 6.3 5 133 20 Pharmaceuticals 5.7 6 121 22 Banking and finance 5.0 7 1,694 3 Distribution 3.7 8 132 21 Transport 3.7 8 1,211 4 Hotels & catering 2.7 10 74 28 Motor vehicles, parts & accessories 2.6 11 272 9 Construction 2.4 12 44 31 Electronic equipment 2.3 13 161 18 Non-market services 2.3 13 63 30 Other means of transport 2.2 15 219 13 Electricity, gas and water 2.0 16 17 33 Real estate and renting 1.9 17 229 12 Electrical engineering 1.5 18 165 17 Insurance 0.9 19 2,238 1 Precision and optical instruments 0.7 20 176 16 Non-metallic mineral extraction 0.6 21 267 10 Agriculture, forestry and fishing 0.5 22 22 32 Food, beverages and tobacco 0.5 22 101 24 Metal products n.e.c. 0.5 22 69 29 Rubber and plastics 0.5 22 98 25 Extraction 0.4 26 1,998 2 Other manufacturing 0.4 26 110 23 Paper, printing, publishing 0.3 28 374 7 Other chemicals 0.2 29 372 8 Mechanical engineering 0.1 30 93 26 Wood and wood products -0.2 31 0 34 Coke, petroleum & nuclear fuel -0.8 32 543 6 Basic metals -1.1 33 136 19 Textiles, leather and clothing -4.9 34 89 27 Rank correlation: 0.17
Source: OEF (2006), Table B.2. OEF has used the data in the tables to calculate the rank correlations between sectoral growth and the use of air transport (either as the share of air transport in the sector’s total transport demand or as the spend per employee on air transport). Here we discuss two issues arising from this analysis. The first issue relates to the use of rank correlation, and the second to the statistical significance of the results found. Firstly, while the OEF report employs a rank correlation, in our opinion, there was no reason to opt for this form of correlation since a general correlation could have been calculated instead. Rank correlations are used if variables are only
4.504.1/The economics of Heathrow expansion February 2008 102
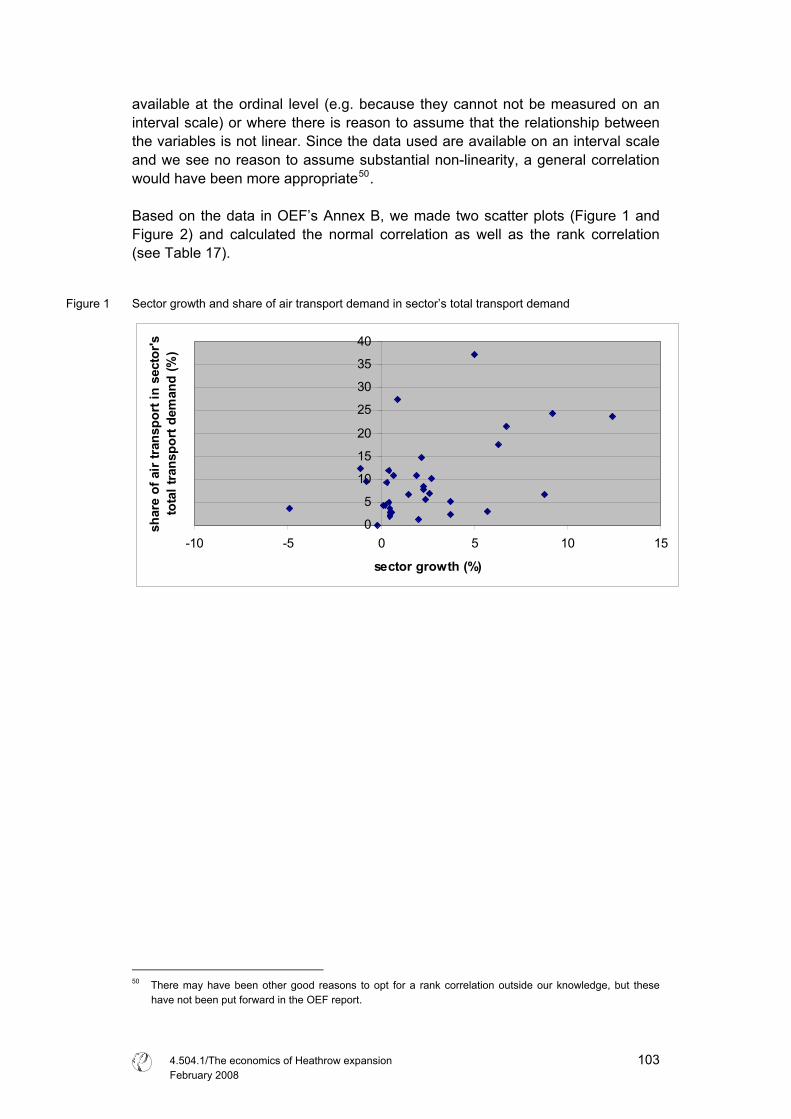
available at the ordinal level (e.g. because they cannot not be measured on an interval scale) or where there is reason to assume that the relationship between the variables is not linear. Since the data used are available on an interval scale and we see no reason to assume substantial non-linearity, a general correlation would have been more appropriate50. Based on the data in OEF’s Annex B, we made two scatter plots (Figure 1 and Figure 2) and calculated the normal correlation as well as the rank correlation (see Table 17).
Figure 1 Sector growth and share of air transport demand in sector’s total transport demand
0
5
10
15
20
25
30
35
40
-10 -5 0 5 10 1
sector growth (%)
shar
e of
air
tran
spor
t in
sect
or's
to
tal t
rans
port
dem
and
(%)
5
50 There may have been other good reasons to opt for a rank correlation outside our knowledge, but these
have not been put forward in the OEF report.
4.504.1/The economics of Heathrow expansion February 2008
103
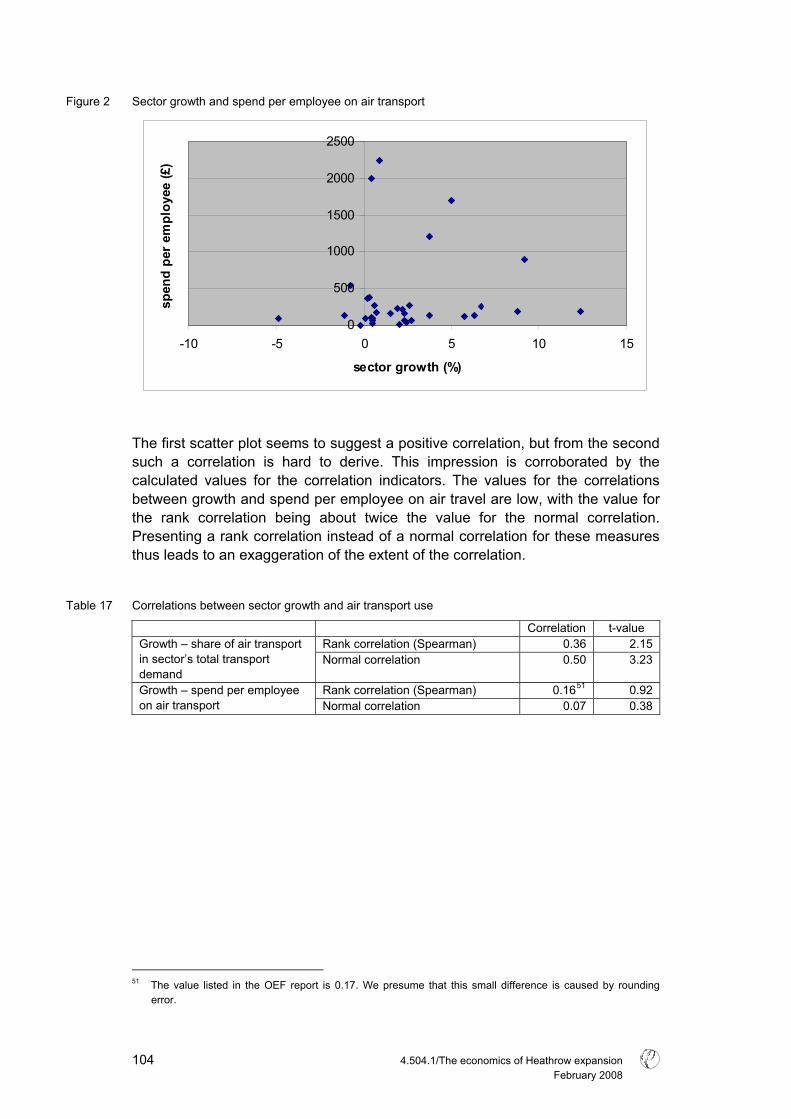
Figure 2 Sector growth and spend per employee on air transport
0
500
1000
1500
2000
2500
-10 -5 0 5 10 1
sector growth (%)
spen
d pe
r em
ploy
ee (£
)
5
The first scatter plot seems to suggest a positive correlation, but from the second such a correlation is hard to derive. This impression is corroborated by the calculated values for the correlation indicators. The values for the correlations between growth and spend per employee on air travel are low, with the value for the rank correlation being about twice the value for the normal correlation. Presenting a rank correlation instead of a normal correlation for these measures thus leads to an exaggeration of the extent of the correlation.
Table 17 Correlations between sector growth and air transport use
Correlation t-value Rank correlation (Spearman) 0.36 2.15 Growth – share of air transport
in sector’s total transport demand
Normal correlation 0.50 3.23
Rank correlation (Spearman) 0.1651 0.92 Growth – spend per employee on air transport Normal correlation 0.07 0.38
51 The value listed in the OEF report is 0.17. We presume that this small difference is caused by rounding
error.
4.504.1/The economics of Heathrow expansion February 2008 104
The second issue to be discussed is the OEF report’s failure to provide the significance levels of the correlations. We have calculated these on the basis of the OEF data, using the following formula to calculate the Student’s t-value of the correlation (which can then be used to assess the significance of the correlation):
( ) ( )2/1 2 −−=
Nrrt
where r is the correlation coefficient and N is the number of observations (34 in this case). If the null hypothesis is correct, then the t-value is distributed as a Student’s t distribution with (N – 2) degrees of freedom. The t-value associated with each of the estimated correlations is listed in Table 17. The minimum value for significance at the 5% level is t(34)= 1.69252. The t-values of both the rank correlation and the normal correlation between sectoral growth and spending on air transport per employee are well below this threshold, meaning that there is no reason to reject the null hypothesis of no correlation. Thus, the correlation between sectoral growth and spending on air transport per employee is not statistically significant and there is therefore insufficient statistical evidence to support the idea of such a correlation existing.
52 Value has been interpolated from t(30)=1.697 and t(40)=1.684.
4.504.1/The economics of Heathrow expansion February 2008
105