The Economics of German Reunificationjah357/Hunt/Transition_files/german...The Economics of German...
31
The Economics of German Reunification A slightly longer version of the entry prepared for the New Palgrave Dictionary of Economics by Jennifer Hunt McGill University and NBER February 2006 I am very grateful to Michael Burda, Wendy Carlin, Adam Posen and Harald Uhlig for helpful discussions, and to Karl Brenke, Michaela Kreyenfeld, Joachim Ragnitz and Werner Smolny for generously and quickly providing me with data.
Transcript of The Economics of German Reunificationjah357/Hunt/Transition_files/german...The Economics of German...
The Economics of German Reunification
A slightly longer version of the entry prepared for the New Palgrave Dictionary of Economics by
Jennifer Hunt McGill University and NBER
February 2006
I am very grateful to Michael Burda, Wendy Carlin, Adam Posen and Harald Uhlig for helpful discussions, and to Karl Brenke, Michaela Kreyenfeld, Joachim Ragnitz and Werner Smolny for generously and quickly providing me with data.
1
Economics of German Reunification
German reunification in 1990 posed the challenge of introducing markets to an economy with none. For citizens of the formerly communist East Germany, the transition brought an immediate increase in political freedom and living standards, yet also a deep trough in output and persistent unemployment. I examine the reasons for the output trough and the subsequent labour market difficulties, analyze the impact of reunification on West Germany and Europe, and draw lessons for transition and economics generally.
On 3rd October 1990, the formerly communist German Democratic Republic joined the
Federal Republic of Germany, thereby reunifying Germany and posing the challenge of
introducing markets to an economy with none. German reunification was part of the
dramatic demise of communism in Europe, an event as significant for economic as for
political reasons. For citizens of the former German Democratic Republic (henceforth
East Germany), the transition brought an immediate increase in both political freedom
and living standards, yet also a large rise in economic uncertainty, manifested not least
through the sudden emergence of high unemployment. Although markets and institutions
were successfully introduced, they have not led to the rapid economic convergence of the
two parts of Germany for which some had hoped, and unemployment has remained high.
The enormous costs of reunification have proved a burden for West Germany, which
prior to unification had been the economic engine of Europe. The shock of unification,
and the subsequent slow growth in West Germany, have in turn affected the rest of
Europe.
Historical and contemporary factors ought to have ensured the best outcomes of
any transition economy. Before the Second World War, East German GDP per capita was
slightly above the German average (Sinn and Sinn 1992), and both at that time and under
2
communism, East Germany was richer than (other) eastern European countries. East
Germany’s relatively small population – 20 per cent of unified Germany – made feasible
the large financial transfers from its rich cousin, West Germany. East Germany has
benefitted from West German institutions, know-how and investment. Yet the Czech
Republic had a GDP per capita only 13 per cent lower in 2004 (OECD in Figures 2005),
and if post-1999 trends continue, the Czech Republic will converge with West Germany
before East Germany does.
In this entry, I note the successful introduction of markets, institutions, democracy
and rule of law, and assess why the short term cost in terms of output and employment
was so high. I examine the reasons for the subsequent labour market difficulties, analyze
the impact of reunification on West Germany and Europe, and draw lessons for transition
and economics generally.
Chronology of unification
The process culminating in the unification of Germany was set in motion when the
Hungarian government began allowing East German citizens to leave Hungary for the
west in May 1989. This occurred against the backdrop of reforms in the Soviet Union by
Michael Gorbachev. By August, large numbers of East Germans were reaching West
Germany via Hungary, Czechoslovakia and Poland, and in September anti-government
demonstrations began in East German cities. On the night of the 9th November 1989, a
combination of government weakness and confusion led to a crowd being permitted to
breach the wall dividing Berlin. The ensuing mass migration to the west removed the

3
power of the East German government to threaten its citizens. Figure 1 shows east-west
and west-east migration: five per cent of the eastern population emigrated in 1989-1990.
- Figure 1 here -
The East German government organized free elections for March 1990. The
victory of the counterpart of the western Christian Democrat party was seen as a mandate
for rapid reunification. Monetary, economic and social union occurred on 1st July 1990.
Political union followed on 3rd October 1990. As East Germany was formally joining the
Federal Republic of Germany, all western institutions were transferred, and only a small
number were subject to a transition period. The western systems of justice, regulation,
industrial relations, banking, education and social security and welfare were all
transplanted, to a large degree by experts from the west.
Faced with the task of integrating a region with decrepit infrastructure, outdated
technology and no capitalist experience, the West German government confronted a
number of important decisions in 1990. These included: the exchange rate at which to
effect monetary union; how to privatize eastern firms; how to spend money in the east,
especially how to spend on consumption versus investment (and infrastructure), and on
capital versus labour, and the amounts and details of these expenditures; and whether to
raise the money through taxes or debt. Important early decisions by other actors included
the decision of labour unions to follow a high wage strategy.
- Figure 2 here -

4
The colossal financial implications of the government’s decisions may be seen in
Figure 2: from 1991-2003 the west spent four to five per cent of its GDP yearly on the
east (including transfers within the social welfare system), which initially represented
more than 50 per cent of eastern GDP, and later 33 per cent.
Economic progress of East Germany
Table 1 documents the evolution of various indicators in east and west. Reunification
precipitated a disastrous collapse in real eastern GDP, with falls of 15.6 per cent in 1990
and 22.7 per cent in 1991 cumulating to a one third decline. Meanwhile, West Germany
experienced two boom years with growth rates of over five per cent. From 1992, East
Germany experienced four years of recovery followed by stagnation. Growth in the west
has also been lacklustre since 1992.
- Table 1 here -
Labour productivity growth in the east was very rapid through 1994, but has since
been modest, although higher than in the west. The eastern capital stock, on the other
hand, grew at almost six per cent per year or more through 1998, and has continued to
grow faster than the western stock since then. Emigration and a plunge in fertility (see
Figure 3) have caused the eastern population to decline each year since unification.
Meanwhile, the western population grew quickly in 1990-1992 with the arrival of East
Germans and immigrants from ex-communist countries other than East Germany.
5
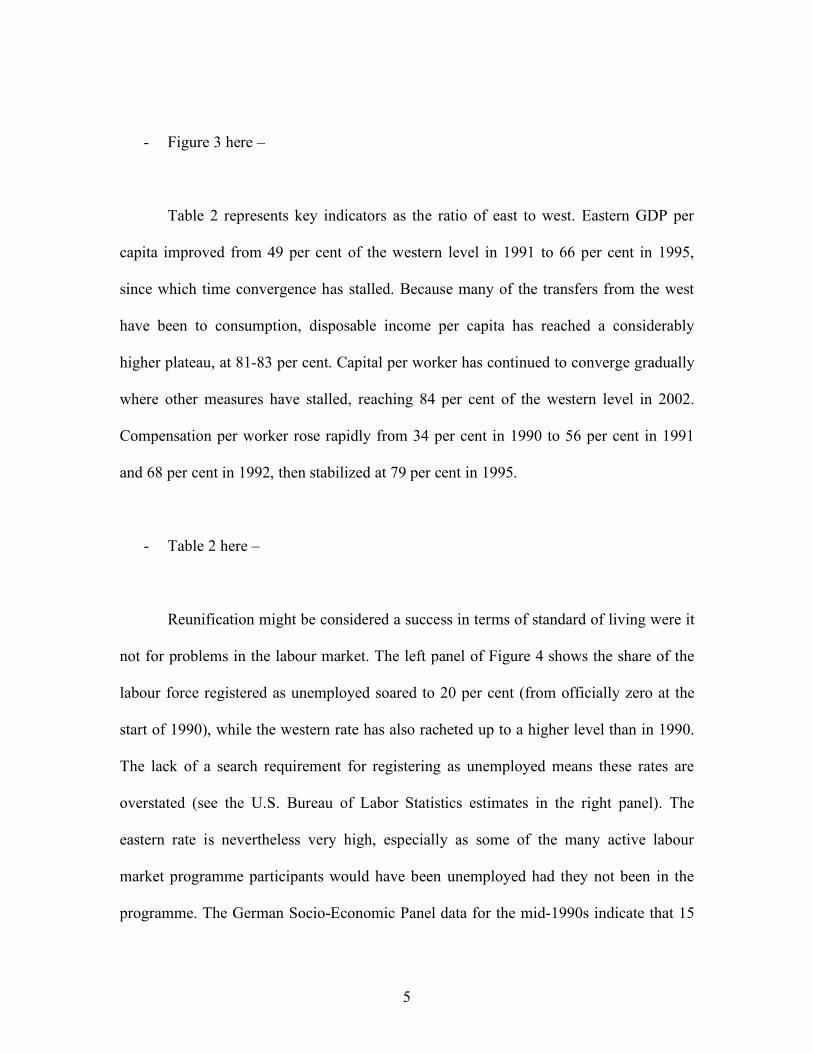
- Figure 3 here –
Table 2 represents key indicators as the ratio of east to west. Eastern GDP per
capita improved from 49 per cent of the western level in 1991 to 66 per cent in 1995,
since which time convergence has stalled. Because many of the transfers from the west
have been to consumption, disposable income per capita has reached a considerably
higher plateau, at 81-83 per cent. Capital per worker has continued to converge gradually
where other measures have stalled, reaching 84 per cent of the western level in 2002.
Compensation per worker rose rapidly from 34 per cent in 1990 to 56 per cent in 1991
and 68 per cent in 1992, then stabilized at 79 per cent in 1995.
- Table 2 here –
Reunification might be considered a success in terms of standard of living were it
not for problems in the labour market. The left panel of Figure 4 shows the share of the
labour force registered as unemployed soared to 20 per cent (from officially zero at the
start of 1990), while the western rate has also racheted up to a higher level than in 1990.
The lack of a search requirement for registering as unemployed means these rates are
overstated (see the U.S. Bureau of Labor Statistics estimates in the right panel). The
eastern rate is nevertheless very high, especially as some of the many active labour
market programme participants would have been unemployed had they not been in the
programme. The German Socio-Economic Panel data for the mid-1990s indicate that 15

6
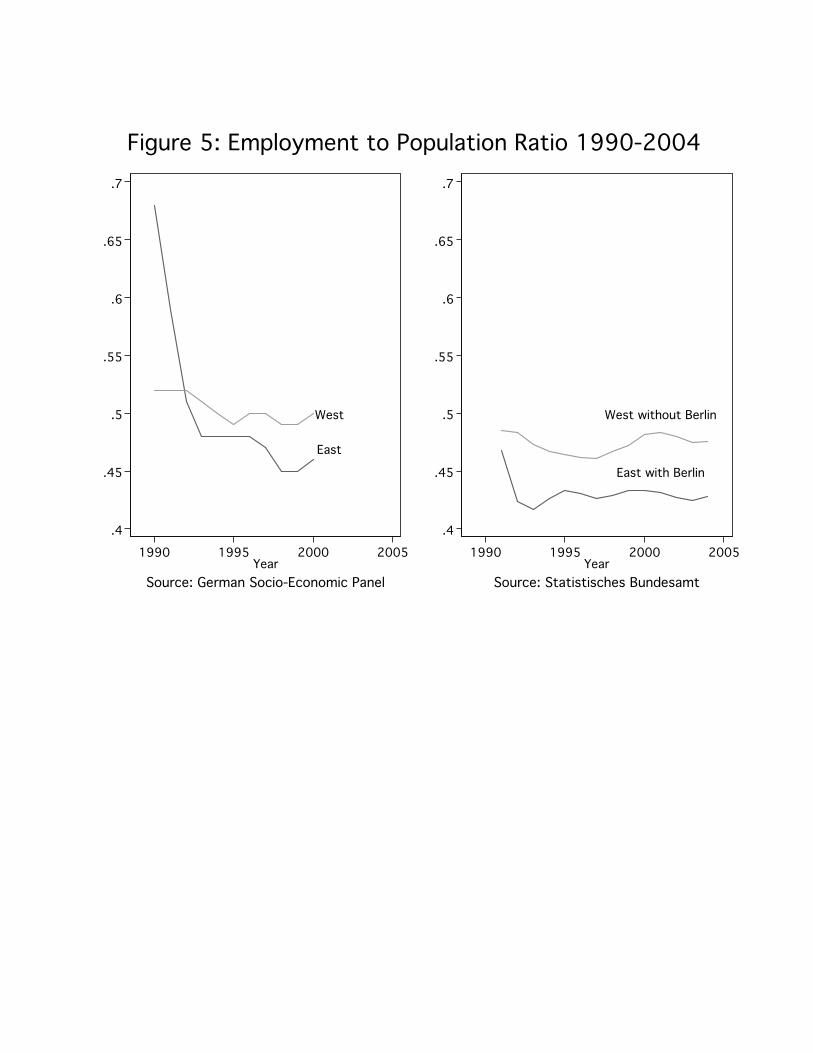
per cent of the eastern female population and ten per cent of the male population were
unemployed. Figure 5 shows the plunge in the eastern employment rate.
- Figure 4 here -
- Figure 5 here -
Splitting the east into its constituent states changes the picture little. The
unemployment rates differ little across the six federal states of East Germany.
Furthermore, with the exception of unified Berlin, the differences in GDP per capita
across the six eastern states are small compared with the east-west gap. This may be seen
in Figure 6, which plots real GDP per capita for Lower Saxony (Niedersachsen), the
poorest western state in 2004, Saxony (Sachsen), the richest eastern state in 2004, and
Mecklenburg-Vorpommern, the poorest eastern state in 2004.
- Figure 6 here -
Even the fastest growing states of Sachsen and Sachsen-Anhalt are growing
considerably more slowly than the Czech Republic, as may be seen with the aid of Figure
7. While East German employment languishes at 60 per cent of its 1989 level, and real
GDP has barely risen above its 1989 level, Czech GDP is 20 per cent above its 1990
level, and while Czech employment has not recovered from liberalization, it fell much
less than East German employment.

7
- Figure 7 here -
Explaining the initial collapse of GDP and employment
All former communist countries except China experienced output declines following
price liberalization, and many countries of the former Soviet Union had larger and longer
output falls than East Germany. Roland (2000) examines why price liberalization
depressed output, emphasizing theories of disruption of supply chains and the need to
identify new business partners before investing. The main other potential culprits for the
GDP and employment declines in East Germany are a reduction in labour supply,
substitution to western products, the exchange rate chosen for monetary union, the
increase in wages, and the privatization process.
a. Reduction in labour supply
Some of the output decline could have been caused by the employment decline, rather
than the reverse. Employment declined by 3.3 million people from 1989-1992. The
government paid one million people to stop working, by offering early retirement onto
the western pension benefits implied by easterners’ years of work experience. A further
one million people emigrated to the west in 1989-1991 (Hunt forthcoming draws lessons
from eastern emigration).
Amongst the prime-aged remaining in the east, women experienced a particularly
large employment decline, a fact often explained by the dismantling of the communist

8
day-care system. However, Hunt (2002) shows that the employment rate of women with
small children fell no more than that of other women.
b. Substitution to western goods
Immediately upon monetary union, eastern shops filled with western goods. Easterners
wanted to consume western products, and at this time “one couldn’t sell an East German
egg” (personal communication from eastern state politician; see also Sinn and Sinn
1992). Economists agree that this caused a sudden fall in demand for eastern goods, and
hence a fall in output.
c. Monetary union exchange rate
For political reasons, the (western) government decided to choose a one-to-one exchange
rate between the eastern Ostmarks and the western Deutschmarks. Early studies, in
particular, argued that an overvalued exchange rate had made the eastern products
uncompetitive with western products, leading to an output decline. With hindsight, it
seems unlikely that the exchange rate was an important contributor to the output decline,
as eastern prices and wages subsequently rose, rather than falling to correct the real
exchange rate.
c. Unions and the wage increase
Although it is possible that the rapid rise in wages was the result of factor price
equalization across regions, there is a consensus that labour unions were the driving force
behind the rise. Unions acquired great power at a time when employers had little, and

9
were not acting only in the interests of eastern workers. Western unions established
themselves in the east in 1990, and were very successful in recruiting new members. The
new eastern unions were led by westerners, who were concerned with east-west equity
and eastern welfare, but also with western wages and the perceived threat to them of mass
east-west migration. The unions pushed for rapid wage convergence with the west,
believing this was just, would prevent mass migration, and would enable eastern workers
who were laid off to receive higher unemployment benefits (these being tied to the pre-
layoff wage). At this time, most firms had no owners, and the unions were bargaining
either with managers, who had no incentive to resist wage increases, or even members of
the western employers’ federations, whose incentive was to prevent undercutting of
western prices by eastern firms.
Most economists believe this rapid rise in wages represented a classic textbook
wage floor that reduced employment, led to high unemployment, and made East German
firms unviable, thereby leading to the output collapse (e.g. Akerlof et al. 1991; Sinn and
Sinn 1992; Sachverständigenrat 2004).
d. Privatization
Small, mostly service firms were privatized separately from large industrial firms. As in
eastern European countries, this privatization was rapid and successful, and was
completed by March 1992 (Sinn and Sinn 1992). Large industrial firms were privatized
by a politically independent body known as the Treuhandanstalt (THA). Its initial
portfolio was 8500 previously state-owned enterprises containing 44,000 plants and 45
per cent of the work force (Carlin 1994).
10
The THA closed the unviable firms and plants, reduced employment at the viable
plants, and sought buyers for the remaining core businesses. The THA’s aim, at which it
was successful, was to match firms with western management expertise in the same
industry (Dyck 1997). Weighted by employment, 74 per cent of sales were to West
German firms or families, six per cent were to non-German firms, and only 20 per cent to
eastern buyers. Privatization thus created subsidiaries of western companies (Carlin
1994). By 31st December 1994, the THA had finished its privatization with net losses of
DM 193 billion (about 95 billion Euro or U.S. dollars; Brada 1996).
The THA destroyed many jobs in the short run, with the aim of curtailing
inefficient production and promoting faster medium-run employment and output growth
than would otherwise have occurred. Most economists studying privatization believe that
the THA carried out its mandate well, leaving a legacy of viable and well-run companies.
However, Roland (2000) believes that the employment reduction necessitated by the
mandate caused a depression in the short run and retarded transition in the medium run.
Explaining the persistent labour market problems
Even observers who did not expect faster GDP convergence than has occurred are
dismayed at the state of the labour market. Most explanations for the initial employment
collapse apply to the short run only. Even labour union power has been severely
weakened: while unions controlled wages from 1990-1993, an employer revolt allowed
wages to be determined more freely subsequently. Table 3 shows the decline over time in
membership in employer federations, which determines whether workers are paid the
union wage.

11
- Table 3 here -
Either the causes of the initial collapse have had lasting effects – for example,
perhaps it is hard to reduce real wages in a low inflation environment – or there must be
other explanations. The leading one is the introduction of the western social welfare
system. Others are investment subsidies, the wholesale transfer of western regulations,
ineffectual active labour market programmes and impediments to the optimal allocation
of resources across sectors.
a. Social welfare and wage floors
Many economists (e.g. von Hagen and Strauch 1999) stress the disincentives of the social
welfare system as a cause of low employment in East Germany. After a very brief
transition period, benefits were set at western levels, which in some cases made them
higher relative to wages than in the west. This was the case in particular for “Sozialhilfe”,
or social assistance (welfare), and for pensions. Unemployment insurance benefits are a
fraction of the previous wage, so to the extent that unemployment insurance is a greater
problem than in the west, it is related to wages being too high. Having a generous social
safety net sets a floor under wages, similar to a union wage, though affecting labour
supply rather than labour demand.
The wage floor theory implies that wages at the bottom of the distribution should
have risen the most, while employment of the least skilled should have fallen the most.
Employment rates indeed fell more for the less skilled than the skilled. However, wage

12
growth for the skilled was equal to or greater than that of the unskilled (Burda and Hunt
2001). Furthermore, by 1999 wage inequality and the wage structure more generally were
very similar to the west. Patterns of unemployment duration were also similar (Hunt
2004). These results are inconsistent with the effect of a wage floor for the less skilled,
which appears to rule out the social welfare theory. However, it is possible that a wage
floor was too simple a model for the effects of the unions, who indeed appeared to aim to
raise the wages of all members.
b. Investment subsidies
At least with hindsight, subsidizing capital (investment) in the face of grave labour
market difficulties seems not obviously a good idea. Indeed, the capital to labour ratio in
manufacturing is now higher in the east than the west (Sachverständigenrat 2004).
Furthermore, many have criticized the subsidies as being too skewed towards structures
compared to equipment (e.g. Burda and Hunt 2001). Finally, the subsidies were designed
as tax breaks, and were hence only attractive to profitable, i.e. established western,
companies. The funds for investment subsidies appear not to have been spent optimally.
c. Active labour market programmes
Easterners are well educated, and the return to eastern schooling was not reduced by
transition (Krueger and Pischke 1995). The post-unification fall in the return to
experience indicated that the human capital lacking was experience working in capitalist
firms. Off-the-job training and make-work jobs were therefore unlikely to be very
helpful, despite the large number of participants: in 1994 there were 259,000 participants
13
in public training programmes and 280,000 participants in jobs whose wage was paid by
the government, compared to 1,142,000 registered unemployed.
The best-documented effect of training programmes has been that of keeping
participants out of the labour force for the duration of the sometimes long programmes
(Lechner et al. 2005). Meanwhile, participants in public jobs had no incentive to look for
another job, as they received 100 per cent of the union wage (90 per cent from 1994 on).
While some groups have benefited from some public programmes, the gains are unlikely
to have justified the large expenditures (Eichler and Lechner 2002; Lechner et al. 2005).
d. Sectoral allocation
Various factors may have intervened to prevent an optimal allocation of resources across
sectors. Brada (1996) observes that the THA requirement that buyers continue operating
the firm in the same industry as before may have delayed sectoral restructuring. Unions,
bargaining at the industry level, may have chosen the wrong wage structure across
sectors, reducing incentives for restructuring (Burda and Hunt 2001; Hunt 2001). A
further complicating factor has been the boom and subsequent bust of the construction
industry. Many observers believe the manufacturing sector is too small, and Table 4
confirms that this sector is smaller than in West Germany or the Czech Republic. Yet
industry in the United States employed only 20 per cent of the workforce in 2004, so East
Germany may simply have leapfrogged West Germany in this regard.
- Table 4 here -

14
Effect of unification on the west
In the short term, reunification was a positive aggregate demand shock for the west,
leading to the boom seen in Table 1. The leap in the demand for capital for investment in
the east, combined with the reduction in the money supply to contain inflation, raised the
interest rate. As the cost of reunification became clear, the government was forced to
raise taxes, but debt rose from 41.8 per cent GDP in 1989 to 64.2 per cent in 2003. The
budget went from surplus in 1989 to a 3.1 per cent deficit in 1991, and has been close to
or above three per cent since then.
It is unclear to what degree the western stagnation that has followed the 1993 end
of the boom can be attributed to reunification. While exports have recovered, domestic
demand has remained weak (Sachverständigenrat 2005). This could possibly be the result
of government debt leading consumers to revise their wealth downwards, depressing
consumption and growth (Carlin and Soskice 2006). The increase in western
unemployment, seen in Figure 4, could be caused in part by increases in payroll taxes to
finance reunification. On the other hand, Siebert (2005) emphasizes that before
reunification, West Germany had already had problems with sluggish growth, rising
unemployment, and funding social security.
Posen (2005) considers that approximately 1.4 per cent of German GDP per year
is paid in transfers to the east that are neither for investment nor infrastructure, nor part of
the unified social welfare system. He calculates the opportunity cost of this money (that
could have been invested and received a return), the increase in interest payments on
other debt (owing to a higher interest rate caused by higher debt), and the deadweight loss

15
from increased taxes. He concludes the burden of these transfers is (at most) 0.7 per cent
of German GDP per year, a large sum.
Reunification has affected the West German labour market through the weakening
of labour unions, caused by the collapse of eastern unions. The impact of eastern
immigrants and commuters is not known. The impact, if any, would have been in
addition to that of the concomitant and similarly sized immigration of ethnic Germans
from other formerly communist countries.
Effect of unification on Europe
The rise in the German interest rate had important consequences for Europe, as it led to a
crisis in the European Exchange Rate Mechanism (ERM) that preceded European
monetary union. The higher German interest rate meant that the Deutschmark required a
revaluation with the ERM, or equivalently, the devaluation of other ERM currencies.
France and other countries attempted to maintain the existing exchange rates, fearful of a
loss of deflationary credibility. But in 1992 speculative attacks forced several countries to
devalue, while the United Kingdom and Italy left the ERM.
The crisis was not all bad in the long run: for the United Kingdom, which had
joined the ERM at an unsuitable exchange rate, leaving the ERM proved to be an
economic boon (Carlin and Soskice 2006). However, Germany may have entered
monetary union at a rate that would prove overvalued once the reunification shock to
interest rates had passed (Sinn 1996), thus requiring a later depreciation. The difficulty of
price and wage adjustments within monetary union may currently be preventing such a

16
depreciation from occurring, slowing German, and therefore European, growth (Carlin
and Soskice 2006).
Lessons learned
Because East Germany joined the well functioning and larger Federal Republic of
Germany, it could feasibly and credibly have an institutional “big bang”, immediately
importing a coherent set of institutions generally suitable for the region. This provided
confidence and familiarity to western investors. The institution that obviously made a
poor transition was the industrial relations system: because labour unions were
established before employer federations, labour unions were initially unnaturally strong,
possibly with lasting consequences.
Some economists believe the social welfare system made an equally poor
transition; yet the nature of reunification meant that there was politically no alternative to
transferring the system fairly rapidly. Siebert (2005) bemoans the transfer of product
regulation and taxation. Yet firms may have complied with western constraints even had
they not been imposed on the east, either in the expectation of their being imposed later,
or for fear of disgruntlement in their western works council. For example, Volkswagen
applied the western prohibition on female night work to its eastern plant although the east
was exempt (Turner 1998).
The feasibility of an institutional big bang made feasible an economic big bang.
Price liberalization and macro stabilization were flawless. The privatization process was
speedy and had many merits, although it may have led to an excessive employment
decline, and was too expensive for most countries to countenance. However, Koreans

17
should note that even an unusual transition that satisfies both the “Washington
consensus” economists, who emphasize speed of economic reform, and the “evolution-
institutionalist” economists, who stress the necessity of establishing institutions before
economic reform, can leave in its wake a difficult regional convergence problem.
For economists interested in unemployment, East Germany is both a validation of
textbook models and a puzzle. Surely the collapse in employment and output in 1990-
1992 must have been strongly influenced by high union wages. Yet now that labour
unions have much less influence and the wage structure is similar to that of the west, why
has unemployment remained so high? Good education and high emigration are not
enough to control unemployment.
Bibliography Akerlof, G., A. Rose, J. Yellen and H. Hessenius. 1991. East Germany in from the Cold: The Economic Aftermath of Currency Union. Brookings Papers on Economic Activity 1, 1-87. Brada, J.C. 1996. Privatization is Transition – Or Is It? Journal of Economic Perspectives 10, 67-86. Burda M. and J. Hunt. 2001. From Reunification to Economic Integration: Productivity and the Labor Market in Eastern Germany. Brookings Papers on Economic Activity 2, 1-92. Carlin, W. 1994. Privatization, distribution and economic justice: efficiency in transition. In Saul Estrin ed. Privatization in Central and Eastern Europe. London: Longman. Carlin, W. and D. Soskice. 2006. Macroeconomics: Imperfections, Institutions and Policies. Oxford: Oxford University Press. Dyck, I.J.A. 1997. Privatization in Eastern Germany: Management Selection and Economic Transition. American Economic Review 87, 565-597. Eichler, M. and M. Lechner. 2002. An Evaluation of Public Employment Programmes in the East German State of Sachsen-Anhalt. Labour Economics 9, 143-186.

18
Von Hagen, J. and R. Strauch. 1999. Tumbling Giant: Germany’s Experience with the Maastricht Fiscal Criteria. ZEI Working Paper. Hunt J. Forthcoming. Staunching Emigration from East Germany: Age and the Determinants of Migration. Journal of the European Economic Association. Hunt J. 2004. Convergence and Determinants of Non-Employment Durations in Eastern and Western Germany. Journal of Population Economics 17, 249-266. Hunt J. 2002. The Transition in East Germany: When is a Ten Point Fall in the Gender Wage Gap Bad News? Journal of Labor Economics 20, 148-169. Hunt J. 2001. Post-Unification Wage Growth in East Germany. Review of Economics and Statistics 83, 190-195. Krueger A. B. and J.-S. Pischke. 1995. A Comparative Analysis of East and West German Labor Markets: Before and after Unification. In R.B. Freeman and L.F. Katz eds. Differences and Changes in Wage Structures. Chicago: University of Chicago Press. Lechner, M., R. Miquel and C. Wunsch. 2005. The Curse and Blessing of Training the Unemployed in a Changing Economy: The Case of East Germany After Unification. University of St. Gallen Working Paper. Posen, A. 2005. Much Ado About Little: the Fiscal Impact of German Economic Unification. CESifo Forum 4, 33-36. Roland, G. 2000. Transition and Economics: Politics, Markets, and Firms. Cambridge, M.A.: The MIT Press. Sachverständigenrat zur Begutachtung der gesamtwirtschaflichen Entwicklung. 2004. Erfolge im Ausland – Herausforderungen im Inland. Jahresgutachten 2004/05. Sachverständigenrat zur Begutachtung der gesamtwirtschaflichen Entwicklung. 2005. Die Chance nutzen – Reformen mutig voranbringen. Jahresgutachten 2005/06. Siebert H. 1995. The German Economy. Princeton: The Princeton University Press. Sinn, G. and H.-W. Sinn. 1992. Jumpstart: The Economic Unification of Germany. Cambridge, M.A.: The MIT Press. Sinn, H.-W. 1996. International Implications of German Unification. University of Munich Working Paper. Turner, L. 1998. Fighting for Partnership: Labor and Politics in Unified Germany. Ithaca N.Y.: Cornell University Press.

19
Jennifer Hunt Acknowledgements I am very grateful to Michael Burda, Wendy Carlin, Adam Posen and Harald Uhlig for helpful discussions, and to Karl Brenke, Michaela Kreyenfeld, Joachim Ragnitz and Werner Smolny for generously and quickly providing me with data. Key terms Transition, unemployment, communism

Table 1: Percent Change in Real GDP, Productivity, Capital and Population, 1990-2004
Year GDP Productivity Capital stock Population East West East West East West East West
1990 -15.6 5.7 -- -- -- -- -2.5 1.6 1991 -22.7 5.1 -- -- -- -- -1.5 1.2 1992 6.2 1.7 18.3 0.7 6.3 2.9 -0.7 1.2 1993 8.7 -2.6 11.0 -1.4 7.1 2.5 -0.6 0.7 1994 8.1 1.4 6.3 2.0 7.4 2.1 -0.4 0.4 1995 3.5 1.4 2.1 1.5 7.4 2.0 -0.4 0.5 1996 1.6 0.6 2.6 0.7 6.8 1.8 -0.3 0.4 1997 0.5 1.5 1.9 1.4 6.5 1.7 -0.4 0.2 1998 0.2 2.3 0.1 0.9 5.8 1.7 -0.5 0.1 1999 1.8 2.1 1.4 0.7 4.9 1.9 -0.5 0.3 2000 1.2 3.1 1.7 0.8 4.3 2.0 -0.6 0.3 2001 -0.6 1.1 0.6 0.3 3.7 1.9 -0.6 0.4 2002 0.2 0.1 1.8 0.4 2.6 1.7 -0.7 0.4 2003 -0.3 -0.1 0.9 0.9 -- -- -0.6 0.2 2004 1.3 1.6 1.0 1.2 -- -- -0.6 0.1
Notes: Berlin is included in the eastern statistics, except for the figures in bold face, where east and west Berlin are included in eastern and western statistics respectively. West Berlin is about 13% of the population of the “greater east”. Productivity is measured as GDP per worker. The change in the eastern population in 1989 was -2.5%. Sources: Statistische Ämter des Bundes und der Länder (GDP, productivity, capital stock, population from 2001). Burda and Hunt (2001) (1990, 1991 GDP growth). Statistisches Bundesamt (population until 2000).

Table 2: Measures of Convergence – East-West Ratios 1990-2004
Year GDP
Disposable income
Capital Compensation
Per capita Per worker Per hour Per capita Per worker Per worker Per hour 1990 -- -- -- -- -- 34 -- 1991 49 51 -- 63 47 56 -- 1992 53 60 -- 67 54 68 -- 1993 60 68 -- 74 57 74 -- 1994 64 70 -- 77 59 77 -- 1995 66 71 -- 81 61 79 -- 1996 67 72 -- 83 64 80 -- 1997 67 73 -- 83 68 80 -- 1998 66 72 67 82 72 81 74 1999 66 72 69 83 75 81 74 2000 66 73 68 82 79 81 75 2001 65 73 68 81 82 81 76 2002 66 74 71 82 84 82 76 2003 67 74 71 82 -- 82 73 2004 67 74 -- -- -- 82 -- Notes: East as a percent of west. Berlin is included in the eastern statistics, except for the figures in bold face, where east and west Berlin are included in eastern and western statistics respectively. 1990 figures are for the first quarter, seasonally adjusted. Productivity is measured as GDP per worker or GDP per hour worked. Source: DIW (for 1990), Statistische Ämter des Bundes und der Länder and author’s calculations.

Table 3: Membership of Firms in Employers’ Associations in East Germany 1993-2003 (%)
1993 1995 1998 2000 2003
Share of firms that are members 36 27 21 16 10
Share of employees employed by member firms 76 64 45 34 29
Note: East Berlin is included in East Germany. Source: Deutsches Institut für Wirtschaftsforschung
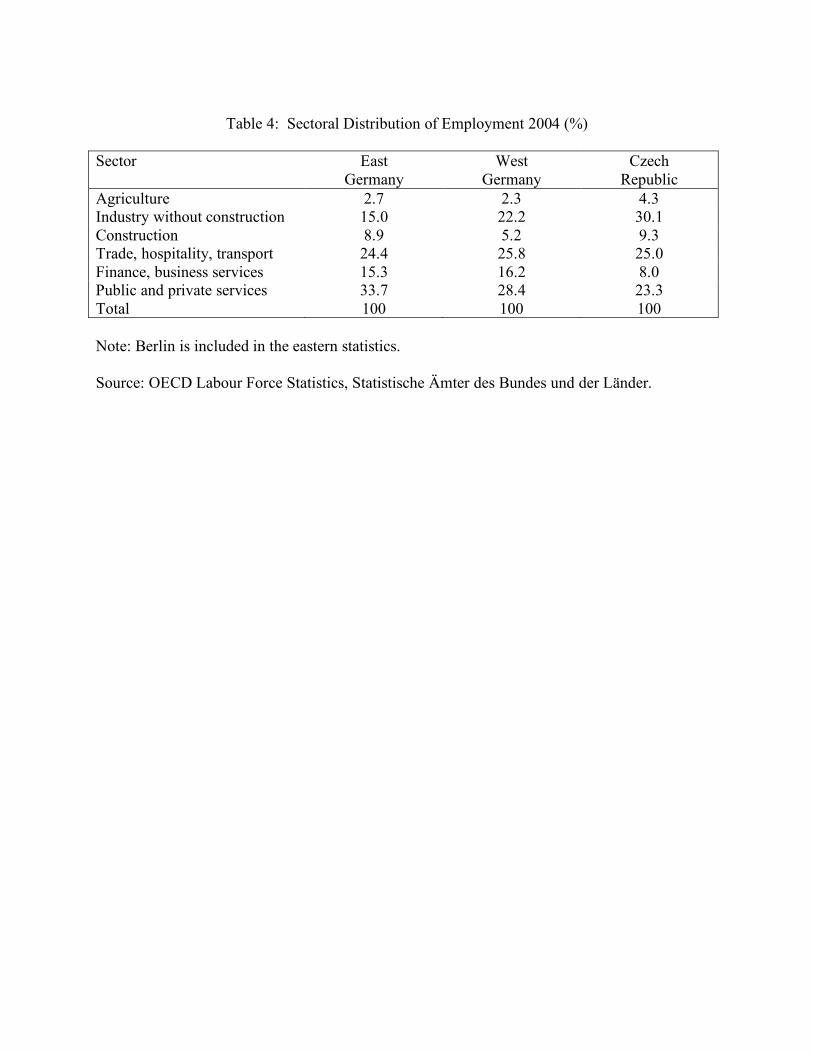
Table 4: Sectoral Distribution of Employment 2004 (%)
Sector East
Germany West
Germany Czech
Republic Agriculture 2.7 2.3 4.3 Industry without construction 15.0 22.2 30.1 Construction 8.9 5.2 9.3 Trade, hospitality, transport 24.4 25.8 25.0 Finance, business services 15.3 16.2 8.0 Public and private services 33.7 28.4 23.3 Total 100 100 100 Note: Berlin is included in the eastern statistics. Source: OECD Labour Force Statistics, Statistische Ämter des Bundes und der Länder.

Without Berlin
Without Berlin
All
All
0
0
100
100
200
200
300
300
400
400
0
0
100
100
200
200
300
300
400
400
Thousands
Thou
sand
s
1960
1960
1965
1965
1970
1970
1975
1975
1980
1980
1985
1985
1990
1990
1995
1995
2000
2000
2005
2005
Year
Year
East to West Migration
East to West Migration
All
All
Without Berlin
Without Berlin
0
0
100
100
200
200
300
300
400
400
0
0
100
100
200
200
300
300
400
400
Thousands
Thou
sand
s
1960
1960
1965
1965
1970
1970
1975
1975
1980
1980
1985
1985
1990
1990
1995
1995
2000
2000
2005
2005
Year
Year
West to East Migration
West to East Migration
Source: Statistisches Bundesamt
Source: Statistisches Bundesamt
Figure 1: Migration Between East and West 1957-2004
Figure 1: Migration Between East and West 1957-2004

30
30
40
40
50
50
60
60
% Eastern GDP
% E
aste
rn G
DP
0
0
2
2
4
4
6
6
% Western GDP
% W
este
rn G
DP
1991
1991
1993
1993
1995
1995
1997
1997
1999
1999
2001
2001
2003
2003
Year...
Year...
Source: Estimates by Ragnitz at IW Halle research institute
Source: Estimates by Ragnitz at IW Halle research institute
Notes: 2000 data are missing; 2003 flood aid excluded
Notes: 2000 data are missing; 2003 flood aid excluded
Figure 2: Net Transfers to the East 1991-2003
Figure 2: Net Transfers to the East 1991-2003

Wall in place
Wall in place
West
West
East
East
0
0
.5
.5
1
1
1.5
1.5
2
2
2.5
2.5
0
0
.5
.5
1
1
1.5
1.5
2
2
2.5
2.5
Children per woman
Child
ren
per
wom
an
1950
1950
1955
1955
1960
1960
1965
1965
1970
1970
1975
1975
1980
1980
1985
1985
1990
1990
1995
1995
2000
2000
2005
2005
Year
Year
Source: Statistisches Bundesamt
Source: Statistisches Bundesamt
Note: Berlin split between East and West 1950-2000; from 2001 without Berlin
Note: Berlin split between East and West 1950-2000; from 2001 without Berlin
Figure 3: Total Fertility Rates 1950-2003
Figure 3: Total Fertility Rates 1950-2003

East with Berlin
East with Berlin
Germany
Germany
West without Berlin
West without Berlin
5
5
10
10
15
15
20
20
Percent
Perc
ent
1990
1990
1995
1995
2000
2000
2005
2005
Year
Year
Concept: Registered Unemployed
Concept: Registered Unemployed
Source: Statistisches Bundesamt
Source: Statistisches Bundesamt
West
West
Germany
Germany
5
5
10
10
15
15
20
20
Percent
Perc
ent
1990
1990
1995
1995
2000
2000
2005
2005
Year
Year
Concept: United States
Concept: United States
Source: Bureau of Labor Statistics
Source: Bureau of Labor Statistics
Figure 4: Unemployment Rate 1990-2004
Figure 4: Unemployment Rate 1990-2004
West
West
East
East
.4
.4
.45
.45
.5
.5
.55
.55
.6
.6
.65
.65
.7
.7
1990
1990
1995
1995
2000
2000
2005
2005
Year
Year
Source: German Socio-Economic Panel
Source: German Socio-Economic Panel
West without Berlin
West without Berlin
East with Berlin
East with Berlin
.4
.4
.45
.45
.5
.5
.55
.55
.6
.6
.65
.65
.7
.7
1990
1990
1995
1995
2000
2000
2005
2005
Year
Year
Source: Statistisches Bundesamt
Source: Statistisches Bundesamt
Figure 5: Employment to Population Ratio 1990-2004
Figure 5: Employment to Population Ratio 1990-2004

Berlin
Berlin
Niedersachsen
Niedersachsen
Mecklenburg-Vorpommern
Mecklenburg-Vorpommern
Sachsen
Sachsen
10000
1000
0
15000
1500
0
20000
2000
0
25000
2500
0
1995 Euros
1995
Eur
os
1990
1990
1995
1995
2000
2000
2005
2005
Year
Year
Source: Statistische Aemter des Bundes und der Laender
Source: Statistische Aemter des Bundes und der Laender
Figure 6: Real GDP per Capita for Selected States
Figure 6: Real GDP per Capita for Selected States

Czech GDP
Czech GDP
East GDP
East GDP
Czech employment
Czech employment
East employment
East employment
60
60
70
70
80
80
90
90
100
100
110
110
120
120
60
60
70
70
80
80
90
90
100
100
110
110
120
120
1989=100 (1990=100 Czech GDP)
1989
=100
(19
90=1
00 C
zech
GDP
)
1990
1990
1995
1995
2000
2000
2005
2005
Year
Year
Source: Transition Reports, Czech Stat Office, DIW, Stat Amter Bund/Lander
Source: Transition Reports, Czech Stat Office, DIW, Stat Amter Bund/Lander
Figure 7: Comparison with the Czech Republic
Figure 7: Comparison with the Czech Republic