The economics of airline financial performance and wider ...
23
The economics of airline financial performance and wider economic benefits 6 th April 2018, Paris Brian Pearce, Chief Economist, IATA www.iata.org/economics
Transcript of The economics of airline financial performance and wider ...

The economics of airline
financial performance
and wider economic
benefits
6th April 2018, Paris
Brian Pearce,
Chief Economist, IATA
www.iata.org/economics

Outline
• Why is the airline industry suddenly profitable?
• After decades of investor capital destruction
• Is the change widespread?
• Have the underlying economics of the industry changed?
• Why is the emergence of protectionism such a threat?
• How does air transport bring economic benefit?
• Users
• Wider economic benefits• Come from the people, goods, capital and ideas we carry between cities
• Rather than the jobs required to run the service (with some exceptions)

Airlines have suddenly become profitable (for their equity investors)
Source: IATA Economics using data from McKinsey, The Airlines Analyst, IATA forecasts
0.0
2.0
4.0
6.0
8.0
10.0
12.0
1993 1995 1997 1999 2001 2003 2005 2007 2009 2011 2013 2015 2017
% o
f in
vest
ed c
apit
alReturn on capital invested in airlines and their cost of capital
Cost of capital (WACC)
Return on capital (ROIC)

After decades of investor value destruction
Source: IATA Economics using data from McKinsey, The Airlines Analyst, IATA forecasts
-40
-30
-20
-10
0
10
20
30
1993 1995 1997 1999 2001 2003 2005 2007 2009 2011 2013 2015 2017
US$
bill
ion
Difference between investing in airlines and investing in similar assets elsewhere

And widespread airline failures
Source: HSBC report – early 2014 situation. Since then Monarch and airberlin have failed
European LCCs
Planet
duo
nexus
Air Wales
ThomsonflyNordic
airlink
flyforbeans.com
clickair
Atlas-blue
myair
flyglobespan
GoDebonair
mytravellite
dba
Basiqair
jetmagic
Iceland Express
AerArann
Aerlingus
Ryanair
Monarch
easyJetflybe Transavia
Eurowingsairberlin
WIZZ
Voloteavueling
SkyExpress
Norwegian
Pegasus
Jet2
snowflake
flyecoSkyeurope
Hamburg airlines
Helvetic
VBIRDVirginExpress
EUjet
FlyMe
buzz
Volareweb
Maersk Air
Air Finland
Flying Finn
Kiss
GetJet
Aeris
Smart Wings
centralwings
fly gibraltar
HLXLTU
Air polonia
flybaboo
flywest
Viking
SterlingCimber
Air Turquoise
Germania
air lib express
Clickair
WindJet
Failed Survived

But improvement has been very uneven across the industry
Source: IATA Economics using data from IATA and The Airline Analyst
0%
2%
4%
6%
8%
10%
12%
14%
16%
18%
20%
2010 2011 2012 2013 2014 2015 2016
EBIT
ad
just
ed f
or
op
erat
ing
leas
es a
s %
inve
sted
cap
ital
Return on invested capital
Industry average
North America
Europe
Asia PacificLatin America
Middle East
Weighted Average Cost of Capital

Balance sheet remain highly leveraged in some regions
Source: IATA Economics using data from The Airline Analyst
0
1
2
3
4
5
6
7
8
2010 2011 2012 2013 2014 2015 2016
Deb
t ad
just
ed f
or
op
erat
ing
leas
es/E
BIT
DA
RAdjusted net debt/EBITDAR
Latin America
Asia Pacific
Industry average
Europe
North America
Middle East
Investment grade

There has always been a paradox at the heart of air transport
Source: McKinsey presentation to IATA
2015-18: 9.7%

Technology continues to cut costs dramatically
Source: Lee
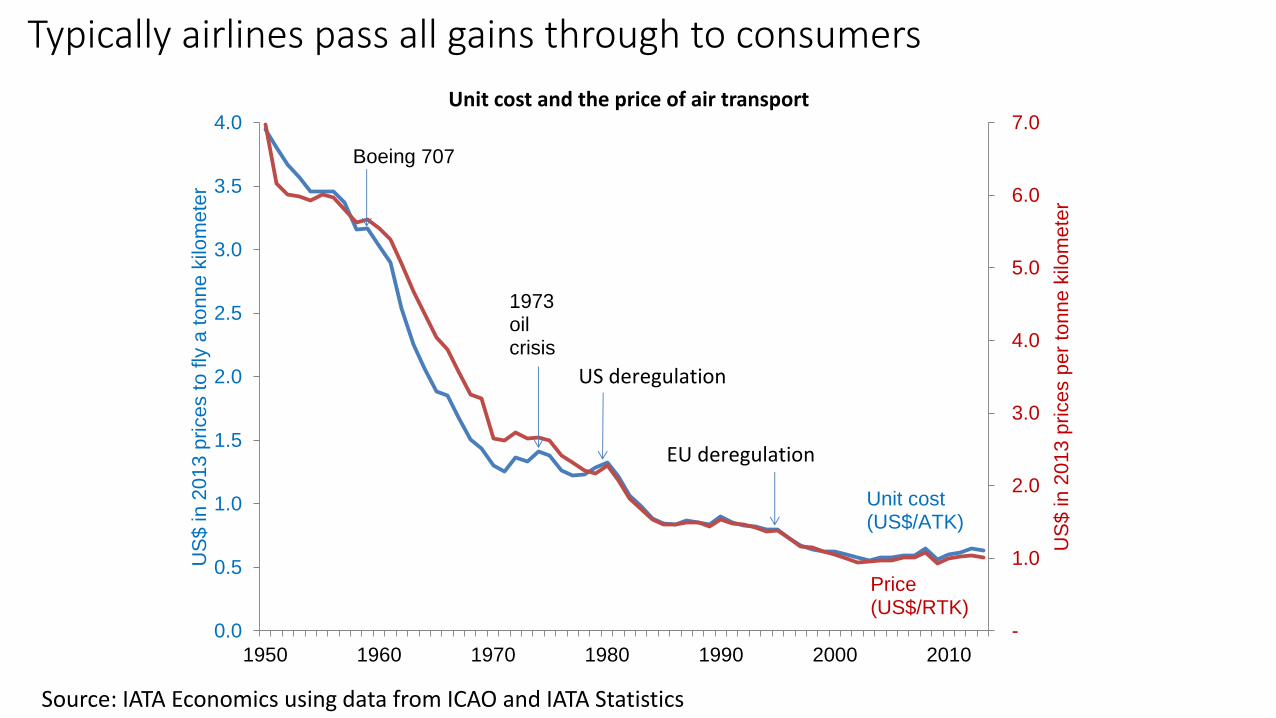
Typically airlines pass all gains through to consumers
-
1.0
2.0
3.0
4.0
5.0
6.0
7.0
0.0
0.5
1.0
1.5
2.0
2.5
3.0
3.5
4.0
1950 1960 1970 1980 1990 2000 2010
US
$ in
20
13
price
s p
er
ton
ne
kilo
me
ter
US
$ in
20
13
price
s t
o f
ly a
to
nn
e k
ilom
ete
r
Unit cost and the price of air transport
Price(US$/RTK)
Unit cost(US$/ATK)
US deregulation
EU deregulation
Boeing 707
1973 oil crisis
Source: IATA Economics using data from ICAO and IATA Statistics

In fact prices have fallen further than costs forcing up breakeven loads
45%
50%
55%
60%
65%
70%
1970 1975 1980 1985 1990 1995 2000 2005 2010
% A
TK
s
Breakeven and actual load factors
Breakeven load factor
Load factor achieved
+15%points
Source: IATA Economics using data from ICAO and IATA Statistics
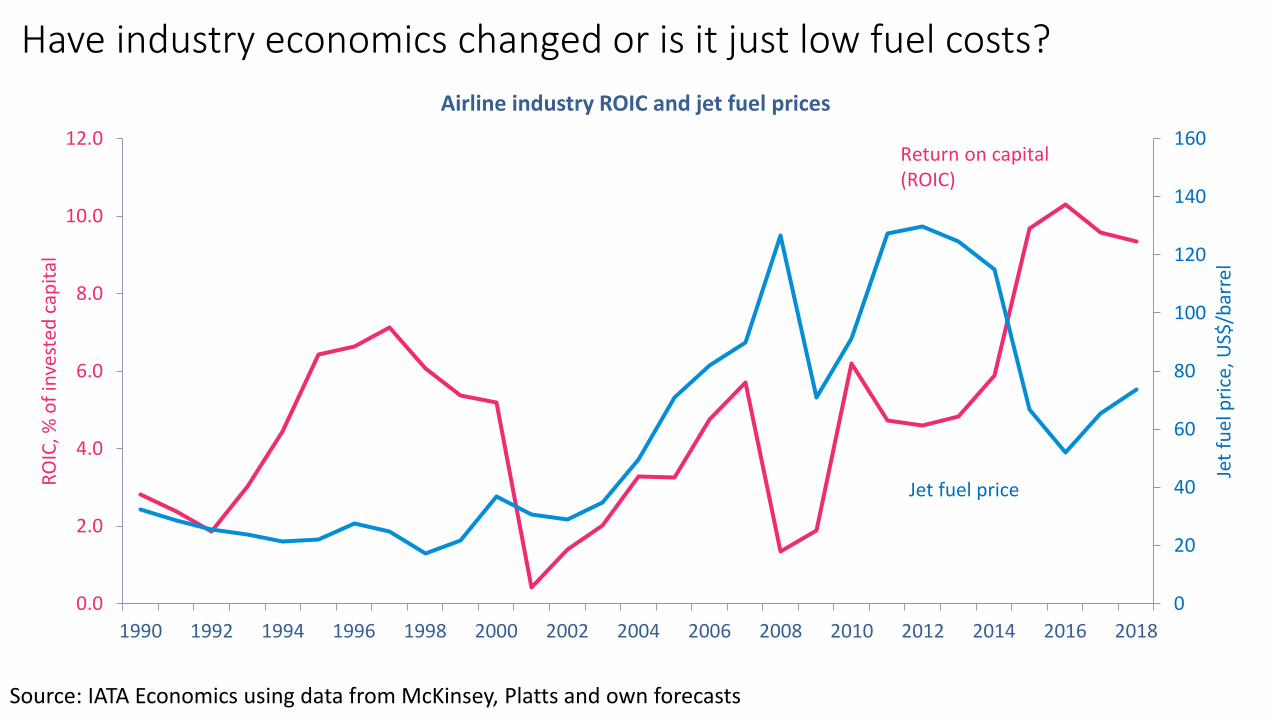
Have industry economics changed or is it just low fuel costs?
0
20
40
60
80
100
120
140
160
0.0
2.0
4.0
6.0
8.0
10.0
12.0
1990 1992 1994 1996 1998 2000 2002 2004 2006 2008 2010 2012 2014 2016 2018
Jet
fuel
pri
ce, U
S$/b
arre
l
RO
IC, %
of
inve
sted
cap
ital
Airline industry ROIC and jet fuel prices
Return on capital (ROIC)
Jet fuel price
Source: IATA Economics using data from McKinsey, Platts and own forecasts

The underlying economics of air transport
• Perishable
• Fixed costs high
• Barriers to entry low
• Competitive advantages hard to defend
• Aircraft are a platform to serve many markets
• Economies of scale in aircraft size but business travelers want frequency and flexibility
• Few scale economies in fleet size but economies of density in networks
OUTCOME:
• Prices pushed down towards variable costs,
• But ways need to be found to cover fixed costs:• Differential pricing, sequential use of coupons, non-refundable tickets….and now ancillaries
• Network density economies through merger prevented by bilateral and O&C regulation barriers:• Leading to code shares, alliances and now ATI JVs and equity partnerships on international markets

Improvement in performance pre-dates fall in fuel costs
Source: IATA Economics using data from ICAO, IATA Statistics, IATA forecasts
55
57
59
61
63
65
67
69
71
2000 2002 2004 2006 2008 2010 2012 2014 2016 2018
% A
TKs
Breakeven and achieved weight load factors
Load factor achieved
Breakeven load factor

Airlines are sweating assets as well as improving margins
Source: IATA Economics using data from ICAO, McKinsey, The Airline Analyst, IATA forecasts
0.8
0.9
1.0
1.1
1.2
1.3
1.4
1.5
-6
-4
-2
0
2
4
6
8
10
2000 2002 2004 2006 2008 2010 2012 2014 2016 2018
Cap
ital
pro
du
ctiv
ity,
rev
enu
e/in
vest
ed c
apit
al, U
S$
Op
erat
ing
mar
gin
, % r
even
ue
Components of return on capital
Capital productivity
Operating margin

Wide variety of successful business models
-0.10
-0.05
0.00
0.05
0.10
0.15
0.20
0.25
0.30
0.35
0.40
0.45
0.00 0.50 1.00 1.50 2.00 2.50
EBIT
mar
gin
, ad
just
ed E
BIT
/rev
enu
e
Capital productivity ($ revenue per $ invested capital)
2015 ROIC = adjusted EBIT/revenue * revenue/invested capital
WALMART
PFIZER
Allegiant
Lufthansa
Easyjet
Southwest
Alaska
Spirit
Ryanair
Jazeera
Delta
IAG
AF-KLM
Hawaiian
AMR JAL
Qantas
United
Thai
Volaris
Mesa
Spring
Air CanadaPIA
GOLKorean
SIA
Air China
Cathay
Aeromexico
JetBlue
LATAMANA
Increasing return on capital (ROIC)
Comair
Source: IATA using data from The Airline Analyst IATA Economics www.iata.org/economics
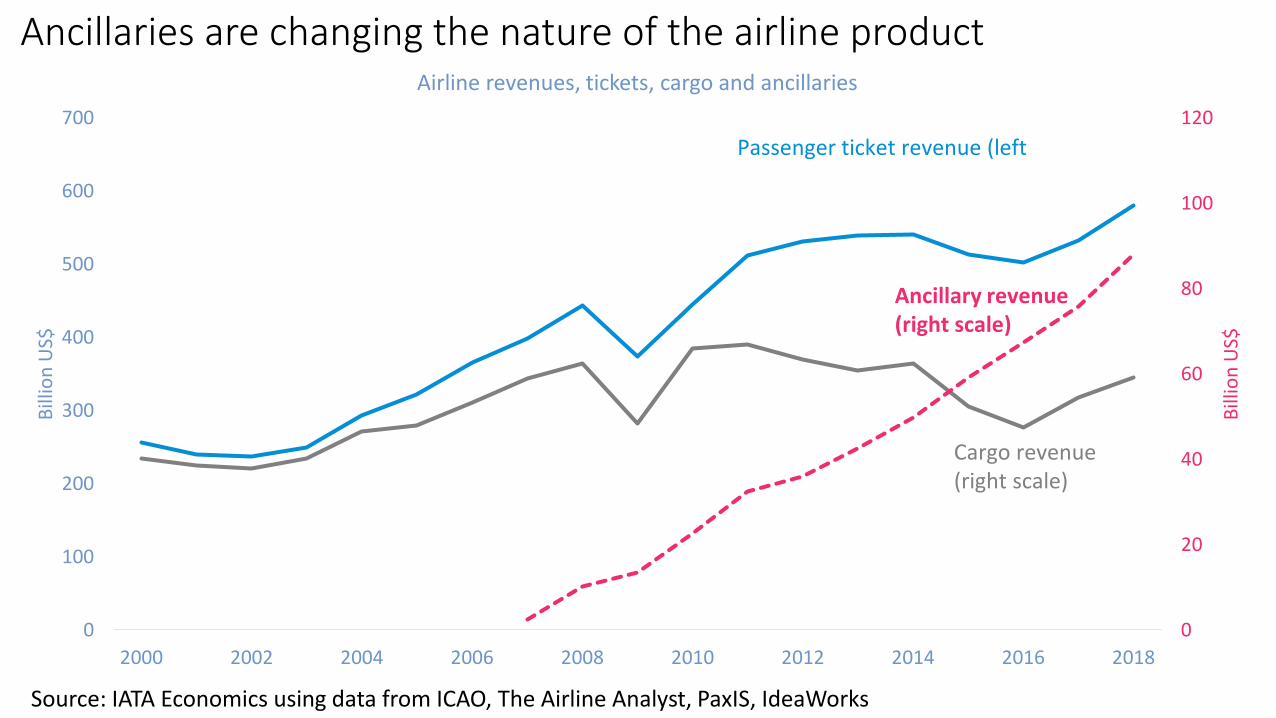
Ancillaries are changing the nature of the airline product
Source: IATA Economics using data from ICAO, The Airline Analyst, PaxIS, IdeaWorks
0
20
40
60
80
100
120
0
100
200
300
400
500
600
700
2000 2002 2004 2006 2008 2010 2012 2014 2016 2018
Bill
ion
US$
Bill
ion
US$
Airline revenues, tickets, cargo and ancillaries
Passenger ticket revenue (left
Cargo revenue (right scale)
Ancillary revenue (right scale)

Consolidation important but not simply because of size
Source: IATA Economics using data from IATA and The Airline Analyst
-
5
10
15
20
25
30
35
40
45
-10% 0% 10% 20% 30% 40% 50%
Inve
sted
cap
ital
, $ b
illio
n
Return on invested capital, %
Return on invested capital versus invested capital, 2016
American
United
Delta
Allegiant
Air ChinaChina SouthernChina Eastern
Lufthansa
FedexSouthwest
IAGRyanair
AlaskaIcelandic
Korean Turkish
CathaySingapore
AF-KLMLATAM
Emirates (2015)
Qatar (2015)

JVs doing better job than code shares/alliances to get density economies
Source: Lufthansa

Protectionism (or the new ‘localism’) is a major threat
10
12
14
16
18
20
22
1991 1993 1995 1997 1999 2001 2003 2005 2007 2009 2011 2013 2015 2017
% o
f G
DP
Share of goods trade (exports+imports) in global GDP
Global financial
crisis
Source: IATA Economics using data from Netherlands CPB

Benefits to consumers (and economy) arise from cheap city connections
Source: IATA Economics using data from ICAO, Boeing, OAG, SRS Analyser
0.50
1.00
1.50
2.00
2.50
3.00
3.50
0
2000
4000
6000
8000
10000
12000
14000
16000
18000
20000
22000
1995 1997 1999 2001 2003 2005 2007 2009 2011 2013 2015 2017
US$
/RTK
in 2
01
4U
S$
Nu
mb
er o
f u
niq
ue
city
-pai
rs
Unique city-pairs and real transport costs
Unique city pairs
Real cost of air transport

Wider economic benefits
• Often measured by the jobs and GVA in the supply chain, through I-O models• Economic footprint is a useful description
• But it measures cost not benefit• Do labor productivity gains really mean lower wider economic benefits?
• Economic benefits generated by connecting cities at lower cost• Air transport network is an infrastructure asset, a bridge between cities
• Boosting the productive capacity of an economy
• Generating flows of people, goods, capital, ideas, competitive pressure
• Raising productivity through agglomeration, gains from trade
• Higher GDP from the supply-side, in economies close to full capacity
• Demand-side/spending flows do matter where economies/regions under-developed
• More research and evidence required!