The economic value of the EU shipping industry - …llsa.lt/images/articles/naudinga_info/2014-04-01...
71
The economic value of the EU shipping industry March 2014 The economic value of the EU shipping industry A report for the European Community Shipowners’ Associations (ECSA) April 2014
Transcript of The economic value of the EU shipping industry - …llsa.lt/images/articles/naudinga_info/2014-04-01...

The economic value of the EU shipping industry
March 2014
The economic value of the
EU shipping industry
A report for the European Community Shipowners’ Associations (ECSA)
April 2014

The economic value of the EU shipping industry
March 2014
2
Contents
Executive Summary ...................................................................................... 3
Infographic .................................................................................................... 6
1 Introduction and definitions of terms used in the study .............. 7
2 The evolution of the EU shipping fleet ......................................... 12
3 The economic impact of the EU shipping industry ..................... 25
4 The economic impact of measures adopted under the
Community guidelines on state aid to maritime transport ......... 44
5 The contribution of maritime academies ..................................... 53
Annex A: An overview of input-output tables ........................................... 59
Annex B: Data sources ............................................................................... 61

The economic value of the EU shipping industry April 2014
3
Executive Summary
The EU shipping fleet
At the start of 2014, the EU controlled fleet (which comprises ships whose ultimate
ownership or control lies in an EU country, but which may be flagged in a different country)
comprised of 660 million deadweight tonnes, 450 million gross tonnes, and 23,000 vessels.
For the purposes of this report, the EU includes the 28 EU countries plus Norway.
Between the start of 2005 and the start of 2014, the EU controlled fleet expanded by more
than 70 per cent in terms of both gross and deadweight tonnage. The number of vessels
grew at a much lower rate, reflecting the trend towards larger ships which offer greater
economies of scale.
At the start of 2014, the EU controlled 40 per cent of world gross tonnage and 39 per cent of
world deadweight tonnage. This is a slight decrease from 41 per cent in 2005 (on both
measures), reflecting that EU shipping companies continue to face strong competitive
pressure from other rapidly-growing centres of world shipping, particularly those in Asia and
the Middle East.
Greece has the largest controlled fleet within Europe, equivalent to 36 per cent of gross
tonnage, or 43 per cent of deadweight tonnage. Germany represents a further 21 per cent of
gross tonnage, or 19 per cent of deadweight tonnage.
The EU controlled fleet is dominated by three types of vessel: bulkers (28 per cent of gross
tonnage), oil tankers (25 per cent) and container ships (25 per cent). The EU controls 60 per
cent of the world’s container ships in gross tonnage terms.
Within the EU controlled fleet, the strongest growth between 2005 and 2014 was recorded
amongst offshore vessels. The EU’s share of the world offshore fleet increased from 28 per
cent in 2005 to 37 per cent in 2014 (in gross tonnage terms).
Economic impacts estimated in this study
This study estimates the economic impact of the shipping industry across three channels:
the direct impact of the shipping industry itself; the indirect impact of shipping firms’
expenditure on inputs of goods and services from their EU supply chain (such as port
services, ship repairs, insurance, and shipping-related financial and legal services); and the
induced impact of spending by employees in the shipping industry and its supply chain.
Direct impact
In 2012, the EU shipping industry is estimated to have directly contributed €56 billion to EU
GDP, employed 590,000 people, and generated tax revenues of €6 billion.
It is estimated that around four-fifths of posts, or 470,000 jobs, are based at sea. It is
tentatively estimated that around 40 per cent of these seafarers are EU or EEA nationals.
Shipping is a high productivity industry: each worker is estimated to have generated €88,000
of GDP, significantly above the EU average of €53,000.
The skills and experience of seafarers are vital to the smooth functioning of the shipping
industry, and are also highly valued by firms in the wider maritime cluster and beyond.
Indicative estimates suggest there were approximately 38,000 students/cadets in maritime
academy – type training in 2012, an 11 per cent increase from 2004.

The economic value of the EU shipping industry April 2014
4
Indirect and induced impacts
The shipping industry indirectly supported an estimated €59 billion contribution to GDP and
1.1 million jobs through its European supply chain in 2012.
The spending of wages by those employed in the shipping industry and its supply chain
supported an estimated additional €30 billion of GDP of and jobs for 550,000 people.
Total economic impact
Taking all of the impacts together, direct, indirect and induced, the total GDP contribution of
the European shipping industry in 2012 is estimated to have been €145 billion.
For every €1 million the European shipping industry contributes to GDP itself, it creates
another €1.6 million elsewhere in the European economy.
The industry also supported employment for an estimated 2.3 million people and tax
revenues estimated at €41 billion.
The total economic impact of the European shipping industry, 2012
Impact of measures adopted under the Community guidelines on state aid to maritime transport
The shipping industry has a number of unique features which provide a rationale for a more
favourable taxation policy than is available to other industries. The industry is, by its very
nature, highly mobile and activity can easily be moved to countries which adopt more
favourable taxation and regulatory regimes. A healthy and competitive shipping industry
forms the core of the wider European maritime cluster and supports development of the
EU’s international trading linkages. It is also strategically important, for example in ensuring
a secure energy supply and in providing capacity to support military operations in times of
crisis or in peacekeeping missions.
Total Impact
Direct
Indirect
Induced
547
1,126
2,263
Employment(000s)
12 2341 596 56 30 145Contribution
to GDP(€bn)
Tax Revenue(€bn)
590
2012

The economic value of the EU shipping industry April 2014
5
Recognising such arguments, and in response to intense international competition from third
country shipping registers and global shipping centres, EU governments have introduced a
range of state aid measures to support shipping, most notably in the form of tonnage tax and
reduced income tax and social security contributions for seafarers. This approach has been
guided by policy at the European level through the Commission’s guidelines on state aid.
Based on an illustrative counter-factual scenario using trends in fleet data for nine EU
countries, it is tentatively estimated that the total economic contribution of the European
shipping industry could have been around 50 per cent lower in 2012, in terms of GVA and
employment, if the countries in the analysis had not introduced tonnage tax regimes and
other state aid measures.

The economic value of the EU shipping industry
March 2014
6
Infographic

The economic value of the EU shipping industry
March 2014
7
1 Introduction and definitions of terms used in the study
1.1 Purpose of the study
This report has been prepared for the European Community Shipowners’ Associations (ECSA), the
trade association representing the national shipowners’ associations of the EU and Norway. The
study aims to provide an understanding of the economic value generated by the EU shipping
industry, both directly and through its interactions with other parts of the economy. As well as
analysing the contribution of the industry, the study reviews the recent development of the EU
shipping fleet; estimates the impact of state aid measures permitted under the Community
guidelines on state aid; and outlines the contribution of maritime academies in training seafarers.
1.2 Geographical coverage
Throughout this document results are reported for the ‘EU shipping industry’ which is defined as
the industry within the 28 EU member states plus Norway. Where data are presented over time,
information for all 29 countries is presented for the entire time period to avoid distortions caused by
new member countries joining the EU. In a small number of cases information is only available for
the European Economic Area (EEA), which includes Iceland and Liechtenstein, as well as the EU
countries and Norway.
1.3 Defining the shipping industry
The brief for the study was to assess the economic contribution of the shipping industry, defined by
ECSA as:
the transport of goods by sea (both containerised and non-containerised);
the transport of persons by sea (both on ferries and on cruise ships);
service and offshore support vessels, such as ships laying or repairing undersea cables
or pipelines; prospecting for oil; conducting oceanographic research; diving assistance;
undertaking undersea work; servicing offshore wind farms, oil and gas platforms; and
towage and dredging activities at sea.
To analyse the economic contribution of the EU shipping industry it is necessary to identify the best
possible fit between this preferred definition of the industry, and the categories for which economic
data are available.
Eurostat categorises economic activity according to its NACE1 system. This identifies a number of
sectors which include activities that predominantly fall within the preferred definition of the shipping
industry set out above (see Table 1.3a). Using these definitions it has been possible to gather
information from the Eurostat national accounts and Structural Business Statistics datasets on
1 Nomenclature statistique des activités économiques dans la Communauté européenne
The economic value of the EU shipping industry April 2014
8
gross value added and employment in passenger transport, freight transport, and the renting and
leasing of water transport equipment.
Wherever possible, the Eurostat data have been complimented with information provided by ECSA
members drawn from previous economic impact studies and national sources. Where such figures
have been used, they have been adjusted to match the Eurostat categories as closely as possible.
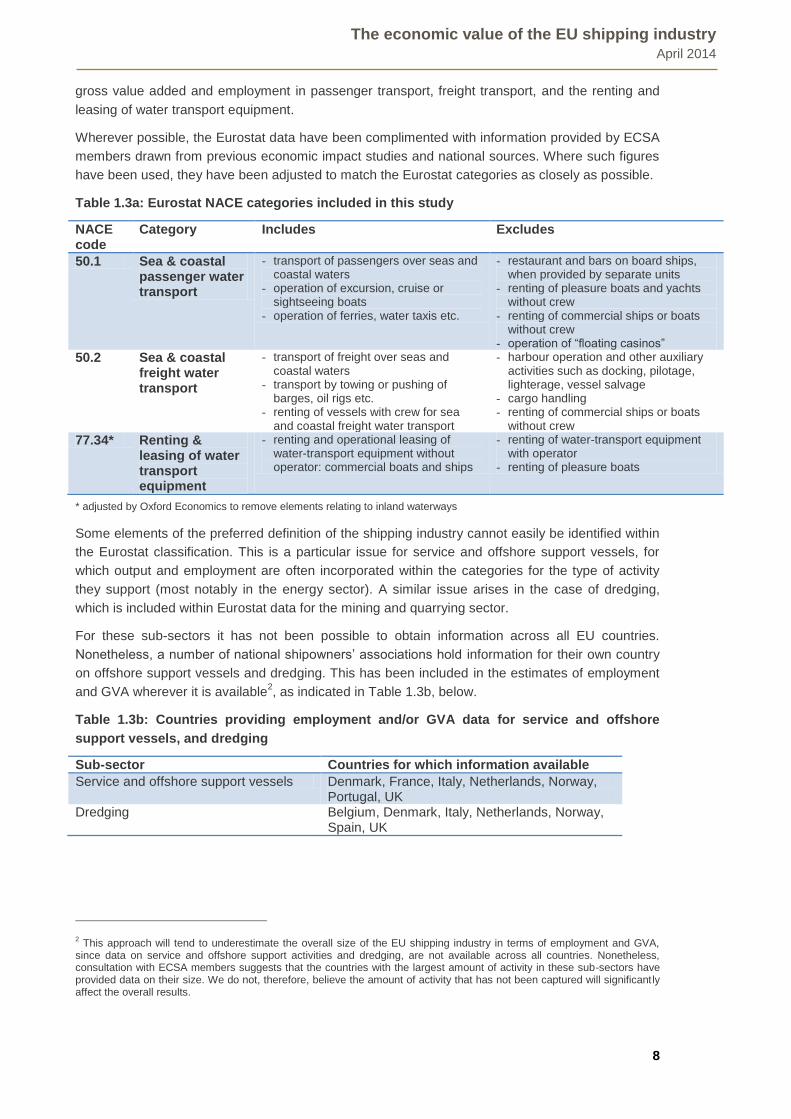
Table 1.3a: Eurostat NACE categories included in this study
NACE code
Category Includes Excludes
50.1 Sea & coastal passenger water transport
- transport of passengers over seas and coastal waters
- operation of excursion, cruise or sightseeing boats
- operation of ferries, water taxis etc.
- restaurant and bars on board ships, when provided by separate units
- renting of pleasure boats and yachts without crew
- renting of commercial ships or boats without crew
- operation of “floating casinos”
50.2 Sea & coastal freight water transport
- transport of freight over seas and coastal waters
- transport by towing or pushing of barges, oil rigs etc.
- renting of vessels with crew for sea and coastal freight water transport
- harbour operation and other auxiliary activities such as docking, pilotage, lighterage, vessel salvage
- cargo handling - renting of commercial ships or boats
without crew
77.34* Renting & leasing of water transport equipment
- renting and operational leasing of water-transport equipment without operator: commercial boats and ships
- renting of water-transport equipment with operator
- renting of pleasure boats
* adjusted by Oxford Economics to remove elements relating to inland waterways
Some elements of the preferred definition of the shipping industry cannot easily be identified within
the Eurostat classification. This is a particular issue for service and offshore support vessels, for
which output and employment are often incorporated within the categories for the type of activity
they support (most notably in the energy sector). A similar issue arises in the case of dredging,
which is included within Eurostat data for the mining and quarrying sector.
For these sub-sectors it has not been possible to obtain information across all EU countries.
Nonetheless, a number of national shipowners’ associations hold information for their own country
on offshore support vessels and dredging. This has been included in the estimates of employment
and GVA wherever it is available2, as indicated in Table 1.3b, below.
Table 1.3b: Countries providing employment and/or GVA data for service and offshore
support vessels, and dredging
Sub-sector Countries for which information available
Service and offshore support vessels Denmark, France, Italy, Netherlands, Norway, Portugal, UK
Dredging Belgium, Denmark, Italy, Netherlands, Norway, Spain, UK
2 This approach will tend to underestimate the overall size of the EU shipping industry in terms of employment and GVA,
since data on service and offshore support activities and dredging, are not available across all countries. Nonetheless, consultation with ECSA members suggests that the countries with the largest amount of activity in these sub-sectors have provided data on their size. We do not, therefore, believe the amount of activity that has not been captured will significantly affect the overall results.

The economic value of the EU shipping industry April 2014
9
In many cases the time periods data are available for do not precisely correspond to the needs of
the project and a degree of estimation has been necessary to generate consistent time series
across countries. Details of the sources used are set out at Annex B.

The economic value of the EU shipping industry April 2014
10
1.4 Gross and deadweight tonnage
There are a number of ways of measuring the size of a country’s shipping fleet. Two main
measures are used in this study:
gross tonnage (GT) - a measure of volume inside a vessel; and
deadweight tonnage (DWT) – measures how much weight a ship can safely carry. It is
the sum of the weights of cargo, fuel, fresh water, ballast water, provisions, passengers
and crew.
When looking across the entire European shipping fleet it is not clear which measure is most
appropriate: gross tonnage tends to give a greater weighting to passenger, cruise, roll-on roll-off
and container vessels. Deadweight tonnage tends to give greater weighting to freight vessels. In
some cases data are only available on the basis of one measure, but wherever possible this report
includes fleet data based on both measures.
1.5 The channels of economic impact
The economic value of the EU shipping industry is examined across three metrics of impact:
the gross value added contribution to GDP measures the contribution to the economy of
each individual producer, industry or sector. It is a measure of output and is aggregated
across all industries or firms to form the basis of a country’s Gross Domestic Product
(GDP), the main measure of the total level of economic activity;
employment, measured on a headcount basis; and
tax revenues flowing to EU governments.
The economic impacts measured in this study are quantified across three channels:
direct impacts reflect the economic contribution of the shipping industry itself;
indirect impacts occur as a result of shipping firms’ expenditure on inputs of goods and
services from their EU supply chain. Economic activity in this category could include, for
example, ship building, ship repairs, port services, insurance, and shipping-related financial
and legal services; and
induced impacts arise as employees in the shipping industry and its supply chain spend a
proportion of their wages on consumer goods and services. These impacts are first felt at
the retail and leisure outlets close to where these employees live, but also ripple out
through the supply chains of the businesses selling consumer goods and services.
Our calculations of these impacts are on a gross basis. They therefore make no allowance for what
the people and other resources deployed by the shipping industry and its suppliers would have
contributed to the economy if the industry did not exist3.
3 This is a standard procedure in the analysis of the economic impact of individual industries.

The economic value of the EU shipping industry April 2014
11
Figure 1.5: The economic impact of the EU shipping industry
Some studies of this type also assess ‘catalytic effects’, whereby the shipping industry creates
positive spillovers that enhance output and productivity in other sectors. This report includes
analysis of the contribution of maritime academies, but other types of catalytic effect are beyond
the scope of this work.
1.6 Report structure
The remainder of the report is structured as follows:
Section 2 analyses the evolution of the EU shipping fleet;
Section 3 presents the assessment of the economic impact of the EU shipping industry;
Section 4 estimates the impact of the state aid measures on the EU shipping industry; and
Section 5 reviews the contribution of maritime academies.
Direct impacte.g. Freight servicesPassenger servicesTowing & dredging
Service and offshore support activitiesRenting and leasing
Indirect impact
e.g. Ship buildingShip repairsPort services
InsuranceShipping-related financial
and legal servicesetc.
Induced impact
e.g. Food and beveragesOther consumer goods
RestaurantsRecreation services
etc.
Total economic impact

The economic value of the EU shipping industry April 2014
12
2 The evolution of the EU shipping fleet
Key points
At the start of 2014, the EU controlled fleet (which comprises ships whose ultimate
ownership or control lies in an EU country, but which may be flagged in a different country)
comprised of 660 million deadweight tonnes, 450 million gross tonnes, and 23,000 vessels.
For the purposes of this report, the EU includes the 28 EU countries plus Norway.
Between the start of 2005 and the start of 2014, the EU controlled fleet expanded by more
than 70 per cent in terms of both gross and deadweight tonnage. The number of vessels
grew at a much lower rate, reflecting the trend towards larger ships which offer greater
economies of scale.
At the start of 2014, the EU controlled 40 per cent of world gross tonnage and 39 per cent of
world deadweight tonnage. This is a slight decrease from 41 per cent in 2005 (on both
measures), reflecting that EU shipping companies continue to face strong competitive
pressure from other rapidly-growing centres of world shipping, particularly those in Asia and
the Middle East.
Greece has the largest controlled fleet within Europe, equivalent to 36 per cent of gross
tonnage, or 43 per cent of deadweight tonnage. Germany represents a further 21 per cent of
gross tonnage, or 19 per cent of deadweight tonnage.
The EU controlled fleet is dominated by three types of vessel: bulkers (28 per cent of gross
tonnage), oil tankers (25 per cent) and container ships (25 per cent). The EU controls 60 per
cent of the world’s container ships in gross tonnage terms.
Within the EU fleet, the strongest growth between 2005 and 2014 was recorded amongst
offshore vessels. The EU’s share of the world offshore fleet increased from 28 per cent in
2005 to 37 per cent in 2014 in gross tonnage terms.
2.1 Context
Global GDP recorded average annual growth of 3.9 per cent between 2004 and 2007, before
recession took hold in 2008 in 2009 (Figure 2.1a). Global GDP growth has recovered since 2010,
although has not returned to pre-recession rates. This reflects the slow pace of recovery in
developed economies, particularly within the EU, and, more recently, slower growth in developing
economies.
Over the last decade, seaborne trade has tended to grow more strongly than GDP, reflecting the
increasingly globalised nature of production and consumption, particularly as developed country
firms have outsourced production to lower cost manufacturing centres in Asia. Nonetheless, the
pattern of growth in seaborne trade has tended to broadly follow that of GDP. The rate of growth in
trade volumes fell sharply in 2008 and 2009, but has since rebounded.

The economic value of the EU shipping industry April 2014
13
Figure 2.1a: World GDP and seaborne trade flows4, 2004 to 2012
The global merchant fleet increased by 78 per cent between 2004 and 2013 (in deadweight
tonnage terms, Figure 2.1b), and within this total, bulk carriers and container ship tonnage more
than doubled. The “other” category comprises all other propelled sea-going merchant vessels of at
least 100 gross tonnes, including cruise ships, ferries and vessels supporting the offshore energy
sector5.
Figure 2.1b: World merchant fleet by type of ship, 2004 to 2013
4 World seaborne trade based on UNCTAD series for total goods loaded, in millions of metric tonnes
5 Although the “other” category recorded the strongest growth rate between 2004 and 2013, this result should be treated
with caution due to a change in the definition of the underlying data series from 2011 onwards.
-6
-4
-2
0
2
4
6
8
10
2004 2005 2006 2007 2008 2009 2010 2011 2012
Source: Oxford Economics, UNCTAD
Seabornetrade
GDP
% change on previous year
0
200
400
600
800
1,000
1,200
1,400
1,600
1,800
2004 2005 2006 2007 2008 2009 2010 2011 2012 2013
Other
General cargo
Container
Oil tankers
Bulk carriers
Deadweight tonnage in millions
Source: UNCTAD

The economic value of the EU shipping industry April 2014
14
The impacts of the 2008-09 recession, combined with steady and continuous growth in the global
fleet have led to an industry-wide challenge of over-capacity, which has put pressure on freight
rates. By way of illustration, Figure 2.1c shows the Baltic Dry Index which measures the cost of
moving major raw materials by sea, as assessed by a panel of shipbroking houses around the
world, on a per tonne and a daily hire basis, and across a range of routes. The Index suggests
global shipping rates fell by 85 per cent between the final quarter of 2004 and the final quarter of
2012 (although some of this fall was subsequently reversed as conditions improved during 2013).
Figure 2.1c: Baltic Dry Index, quarterly values from March 2004 to December 2013
In addition to sharp falls in freight rates, shipping companies have faced significant increases in
fuel prices. Based on the benchmark Rotterdam 380 centistoke measure, marine fuel costs
increased from an average of $234 per tonne in 2005 and to $640 per ton in 20126. Fuel costs can
account for 50 to 60 per cent of operating costs7, and so can have a significant impact on
profitability.
6 Source: UNCTAD Review of Maritime Transport, 2013
7 World Shipping Council (2008) Record fuel prices place stress on ocean shipping, quoted in UNCTAD Review of Maritime
Transport, 2013
0
2,000
4,000
6,000
8,000
10,000
12,000
Mar
-04
Sep
-04
Mar
-05
Sep
-05
Mar
-06
Sep
-06
Mar
-07
Sep
-07
Mar
-08
Sep
-08
Mar
-09
Sep
-09
Mar
-10
Sep
-10
Mar
-11
Sep
-11
Mar
-12
Sep
-12
Mar
-13
Sep
-13
Source: Baltic Exchange, Reuters

The economic value of the EU shipping industry April 2014
15
2.2 What is the EU fleet?
There are three main ways of measuring the EU fleet, each with its own merits and drawbacks.
Firstly, the ‘controlled’ or ‘beneficially owned’ fleet includes ships whose ultimate ownership or
control lies in an EU country, but which may be flagged in a different country. It is imperfect as a
measure of economic activity since the country of ownership or control (to which dividends and
profits flow) does not necessary align with where the direct operational activity and employment
associated with the fleet takes place. Whilst imperfect, some data are available to assess the size
of the EU fleet in terms of the number of vessels and tonnage on this basis.
Secondly, the ‘operated’ fleet comprises ships operated by companies (or legal entities) based in
the EU, which have substantive shore establishments within the EU, and which are subject to EU
laws and taxation. The operated fleet includes ships operated under EU flags, plus non-EU flagged
ships operated by EU shipping companies. The shore establishments may be a company’s
headquarters, but they may also be the European or national subsidiary of the company in
question. Nonetheless, they are the centre of commercial management of the business that takes
decisions on day-to-day operations and employment, even if all or part of their shareholding is
abroad.
The operated fleet is likely to align most closely with the industry’s economic impact in terms of
gross value added and employment, as discussed in the next section of the report. However, only
very limited data are currently available to measure the size of the EU operated fleet.
Finally, the ‘flag’ fleet comprises ships operating under the flag of an EU country. Flagging is an
embodiment of the legal principle that every ship should belong to a state. Flag country is important
since it determines which country’s jurisdiction a ship and its crew falls under in terms of legal
matters. The cost of complying with a flag state’s legal and regulatory requirements is just one of a
wide range of factors that may influence a shipowner’s choice of flag state. Other factors include
the type of vessel (some countries have registry practices tailored to specific sectors); a flag state’s
reputation for upholding safety and other standards; the provision of naval protection; and
marketing considerations. A flag state, or a group of potential flag states, may also be specified by
a ship’s charter, financing organisation, or insurer.
There may be some link between country of flag and the location of economic benefit due to
reasons of cultural closeness or geographic proximity, but in many cases there may be little or no
link. Nonetheless, the registration process creates very good data sets, which go back over 30
years in some cases.
The EU controlled fleet is the main focus of the analysis in this report. This definition has
been chosen as the preferred measure of the EU fleet because it provides the best balance
between data availability and alignment with economic impact.
Figure 2.2 presents information on the country of control and flag of the EEA fleet. In terms of gross
and deadweight tonnage, around 40 per cent is both EEA controlled and EEA flagged. In terms of
the number of vessels, the proportion of the fleet that is both controlled and flagged in an EEA
country is slightly higher at 54 per cent.

The economic value of the EU shipping industry April 2014
16
Just over half of the fleet in terms of gross and deadweight tonnage is controlled from EEA
countries, but operates under a non-EEA flag. Seven per cent of the fleet is EEA flagged, but
controlled in a non-EEA country.
Figure 2.2: The EEA fleet by control and flag, 2013
54%40% 39%
39%53% 54%
7% 7% 7%
0%
10%
20%
30%
40%
50%
60%
70%
80%
90%
100%
Number of vessels Gross tonnage Deadweight tonnage
EEA controlled / EEA flaggedEEA controlled / Non-EEA flaggedNon-EEA controlled / EEA flagged
Source: Clarkson Research Services Ltd., ECSA

The economic value of the EU shipping industry April 2014
17
2.3 The EU controlled fleet
The EU controlled fleet has grown strongly since 2005 (the earliest year for which data are
available on a consistent basis for all EU countries). Between the start of 2005 and the start of
2014, the fleet expanded by 74 per cent in gross tonnage terms, and by 72 per cent in terms of
deadweight tonnage (Figure 2.3a). Growth in the number of vessels was much lower, at 31 per
cent, reflecting the trend for shipping companies to invest in larger vessels that offer greater
economies of scale. It should be noted that this analysis includes all 28 EU countries and Norway
for the entire duration of the time series. The growth trend shown is not, therefore, influenced by
the accession of Bulgaria, Romania and Croatia to the EU during the period shown.
Figure 2.3a: The evolution of the EU controlled fleet, 1 January 2005 to 1 January 2014
The world fleet has also grown over the last decade, and at a slightly higher rate than the EU fleet,
reflecting that other centres of world shipping, particularly in Asia and the Middle East, continue to
expand rapidly. As a result, the EU controlled share of the global fleet has declined slightly from 41
per in 2005 to 40 per cent in 2014 in gross tonnage terms, or to 39 per cent by deadweight tonnage
(Figure 2.3b). Nonetheless, the EU controls 26 per cent of the world’s vessels, the same proportion
as in 2005. The fact that the EU controlled share of the number of vessels has remained constant
whilst its share of tonnage has decreased slightly reflects that growth elsewhere has been
particularly concentrated on very large vessels.
90
100
110
120
130
140
150
160
170
180
2005 2006 2007 2008 2009 2010 2011 2012 2013 2014
Number of vessels Gross tonnage Deadweight tonnage
Source: Clarkson Research Services Ltd.
Index, 2005=100
23,000 vessels
450 million GT
660 million DWT
Position on 1 Jan 2014

The economic value of the EU shipping industry April 2014
18
Figure 2.3b: The EU controlled fleet as a proportion of the world fleet, 1 January 2005 to 1 January 2014
Within Europe, Greece has the largest controlled fleet, comprising 164 million gross tonnes, or 284
million deadweight tonnes (Figure 2.3c). This is equivalent to 36 per cent and 43 per cent of the
total EU controlled fleet respectively. Germany represents a further 21 per cent of EU controlled
gross tonnage, or 19 per cent of deadweight tonnage.
Figure 2.3c: The EU fleet by country of control, 1 January 2014
The rate of growth in the Greek controlled fleet between 2005 and 2014 was broadly in line with the
EU average (73 per cent in gross tonnage terms, Figure 2.3d). The growth rate in Germany,
however, was even stronger at 128 per cent over this period. In proportionate terms, the French
and Belgian controlled fleets also grew more quickly than the EU average, by 169 and 96 per cent
respectively.
20
25
30
35
40
45
2005 2006 2007 2008 2009 2010 2011 2012 2013 2014
Number of vessels Gross tonnage Deadweight tonnage
Source: Clarkson Research Services Ltd.
Per cent
0 50 100 150 200 250 300
Greece
Germany
Norway
Italy
Denmark
UK
Netherlands
France
Belgium
Sweden
Cyprus
Finland
Spain
Poland
Croatia
Other
Gross tonnage (millions)
Deadweight tonnage (millions)
Source: Clarkson Research Services Ltd.

The economic value of the EU shipping industry April 2014
19
Figure 2.3d: The EU fleet by country of control, 1 January 2005 and 1 January 2014
The EU controlled fleet is dominated by three types of vessel (Figure 2.3e): bulkers (28 per cent of
EU controlled gross tonnage), oil tankers (25 per cent) and container ships (25 per cent).
Figure 2.3e: The EU controlled fleet by type of vessel, by gross tonnage, 1 January 2014
As discussed above, the EU controlled fleet represents 40 per cent of the world’s gross tonnage. In
some types of vessel, however, the EU controlled share is much higher (Figure 2.3f). Most notably,
the EU controls 60 per cent of the world’s container ships. Although smaller in terms of their
significance within the EU fleet, EU countries control 61 per cent of roll-on roll-off vessels, 57 per
cent of ferries and 52 per cent of multi-purpose ships.
0 20 40 60 80 100 120 140 160 180
Greece
Germany
Norway
Italy
Denmark
UK
Netherlands
France
Belgium
Sweden
Cyprus
Finland
Spain
Poland
Croatia
Other
million gross tonnes
2005
2014
Source: Clarkson Research Services Ltd.
Bulkers
Oil tankers
Container ships
Offshore
Multi-purpose vessels
Pure car carriers
Chemical tankers
LNG & LPG
Roll-on, Roll-off Ferries Cruise Other
Source: Clarkson Research Services Ltd.

The economic value of the EU shipping industry April 2014
20
Figure 2.3f: The EU controlled share of the world fleet, 1 January 2014
The strongest growth rate between 2005 and 2014 was recorded amongst offshore vessels (Figure
2.3g). The global offshore industry has also grown strongly over this period, but the EU’s share of
the world fleet nonetheless increased from 28 per cent in 2005 to 37 per cent in 2014 (in gross
tonnage terms). This sector is particularly important in terms of economic impact because it is more
labour-intensive than many other sub-sectors, and many of the jobs created are high-skill, high-
value positions.
The EU controlled fleet of container ships, LNG & LPG tankers, and cruise ships also achieved
particularly strong growth over the period: gross tonnage increased by around 100 per cent or more
for each of these types of vessel.
Figure 2.3g: Growth in the EU controlled fleet by type of vessel, 1 January 2005 to 1 January 2014
0 10 20 30 40 50 60 70
Roll-on, Roll-off
Container ships
Ferries
Multi-purpose vessels
Oil tankers
Chemical tankers
Offshore
Bulkers
Pure car carriers
LNG & LPG
Cruise
Other
EU as % of world gross tonnage
Source: Clarkson Research Services Ltd.
-50 0 50 100 150 200
Offshore
Container ships
LNG & LPG
Cruise
Bulkers
Pure car carriers
Oil tankers
Chemical tankers
Ferries
Multi-purpose vessels
Roll-on, Roll-off
Other
% change in gross tonnage, 2005-2014
Source: Clarkson Research Services Ltd.

The economic value of the EU shipping industry April 2014
21
2.4 The EU flagged fleet
Although less closely aligned to economic impact than the controlled fleet, information on the
flagged fleet is available for a much longer period (this is particularly useful when considering how
policy changes may have affected the attractiveness of flying the flag of an EU Member State on
vessels managed by European shipowners, for example). As with the analysis of the controlled
fleet, the chart and commentary below is based on a fixed definition of the EU and Norway, so the
trends apparent in the time series are not affected by the accession of countries to the EU during
the period8.
The red line in Figure 2.4a plots the evolution of deadweight tonnage operating under an EU flag
since 1994. On this basis, little growth was recorded during the 1990s and early 2000s (deadweight
tonnage increased by just nine per cent between 1994 and 2006). Since then, the EU flagged fleet
has expanded more quickly, by 38 per cent between 2006 and 2013. Nonetheless, this was well
below the 69 per cent expansion in the world fleet recorded over the same period and the EU
flagged share of the world fleet has continued to decline. In 2013, 20 per cent of the world fleet was
operated under the flag of an EU country.
The reduction in the EU flagged share of the world fleet since 2005 is more pronounced than the
slight decline in the EU controlled share of the world fleet over this period (as shown in Section
2.3). To the extent that changes in the EU’s share of the world fleet reflect policy measures, this
may suggest that policies such as tonnage tax have been relatively effective at keeping shipowners
in Europe, but other factors that determine choice of flag, such as the service levels of maritime
authorities, have been less effective in stabilising the share of the European flagged fleet.
Figure 2.4a: The EU flagged fleet by deadweight tonnage, 1994 to 2013
8 To enable a consistent comparison over a longer time period, the series shown in Figure 2.4a excludes Slovakia in all
years. Slovakia accounted for 46,000 DWT in 2013
0
50
100
150
200
250
300
350
0
5
10
15
20
25
30
35
199
4
199
5
199
6
199
7
199
8
199
9
200
0
200
1
200
2
200
3
200
4
200
5
200
6
200
7
200
8
200
9
201
0
201
1
201
2
201
3
As % of world (left scale) DWT, 000s (right scale)
% million DWT
Source: UNCTAD

The economic value of the EU shipping industry April 2014
22
Within Europe, there is a large degree of consistency between the largest flagged fleets and the
largest controlled fleets (as shown in Section 2.3). The main exception to this is Malta, which
accounts for 19 per cent of the EU flagged fleet by gross tonnage, or 21 per cent by deadweight
tonnage (Figure 2.4b). In contrast, Malta does not appear in the top 15 countries for the EU
controlled fleet. This reflects that while Malta has a large amount of tonnage registered to its flag,
much smaller amounts are under the control of Maltese operators or owners. Similarly, Cyprus has
a much higher rank in terms of flagged fleet than for controlled fleet.
Figure 2.4b: The EU fleet by country of flag, 20139
The strongest growth in terms of flagged fleets between 2004 and 2013 occurred in Belgium, which
has seen extensive ‘re-flagging’ following the introduction of tonnage tax in 2002 (Figure 2.4c).
Germany and the UK also saw their flagged fleets more than double over this period, and Italy saw
an increase of 95 per cent.
9 UK includes Isle of Man
0 20 40 60 80
Malta
Greece
UK
Cyprus
Italy
Norway
Germany
Denmark
Netherlands
France
Belgium
Sweden
Spain
Finland
Luxembourg
Other
Gross tonnage (millions)
Deadweight tonnage (millions)
Source: UNCTAD

The economic value of the EU shipping industry April 2014
23
Figure 2.4c: Growth in the flagged fleets of EU countries, 2004-2013
-50 0 50 100 150 200 250 300
Belgium
Germany
UK
Italy
Malta
Denmark
Greece
Luxembourg
Finland
France
Netherlands
Spain
Cyprus
Sweden
Norway
Other
% change in DWT, 2004-2013
Source: UNCTAD

The economic value of the EU shipping industry April 2014
24
2.5 The EU operated fleet
Very few data were available to the study to analyse the EU operated fleet. Nonetheless, the EU
plays a prominent role in the world fleet by this measure. Eight of the top 25 largest operated fleets
in the world belong to EU countries (Figure 2.5). Within this, Greece, Germany and Denmark fall
within the top five largest operated fleets in the world.
Figure 2.5: Merchant fleet by operator domicile – 25 largest countries by gross tonnage,
1 July 2013
0 20 40 60 80 100 120 140
JapanGreece
China
Germany
DenmarkSouth Korea
U.S.A.Singapore
Hong KongTaiwan
Switzerland
NorwayBermuda
U.K.France
ItalyTurkey
Canada
Russia
IndiaIndonesiaMalaysiaSweden
BrazilIran
Gross tonnage (millions)
Source: IHS Fairplay

The economic value of the EU shipping industry April 2014
25
3 The economic impact of the EU shipping industry
Key points
In 2012, the EU shipping industry is estimated to have directly contributed €56 billion to
GDP, employed 590,000 people, and generated tax revenues of €6 billion.
It is estimated that around four-fifths of posts, or 470,000 jobs, are based at sea. It is
tentatively estimated that around 40 per cent of these seafarers are EU or EEA nationals.
Shipping is a high productivity industry: each worker is estimated to have generated €88,000
of GDP, significantly above the EU average of €53,000.
The shipping industry indirectly supported an estimated €59 billion contribution to GDP and
1.1 million jobs through its European supply chain in 2012. The spending of wages by those
employed in the shipping industry and its supply chain supported an estimated additional
€30 billion of GDP of and jobs for 550,000 people.
Taking these effects together, the total GDP contribution of the European shipping industry
in 2012 is estimated to have been €145 billion. The industry also supported employment for
an estimated 2.3 million people, and tax revenues estimated at €41 billion.
For every €1 million the European shipping industry contributes to GDP itself, it creates
another €1.6 million elsewhere in the European economy.
3.1 Direct impacts
3.1.1 Approach to estimating direct impacts
To estimate the industry’s direct impact it is necessary to collect data that corresponds as closely
as possible to the definition of the shipping industry discussed in Section 1.3. Where possible, the
study draws on information provided by ECSA members based on previous economic impact
studies and national sources. For other countries, information has been drawn from the Eurostat
national accounts and Structural Business Statistics datasets on gross value added and
employment.
In many cases the data available do not precisely correspond to the needs of the project and a
degree of estimation has been necessary to ensure consistency across countries, and to generate
time series that cover both 2004 and 2012. Details of the sources used for each country are set out
at Annex B.
3.1.2 Direct contribution to employment
ECSA members have provided detailed employment data for the following countries: Belgium,
France, Germany, Italy, the Netherlands, Norway, Portugal, Spain, and the UK. Comparison of
Eurostat data and this more detailed country-specific information suggests the Eurostat figures
tend to underestimate total employment in the shipping industry. It is difficult to be certain of the
precise reasons for this, but our research and consultation with national experts and Eurostat
suggests the most likely reason is that the Eurostat data do not capture some proportion of workers
who work on ships, many of whom may not be subject to income tax in the EU state from which
their vessel is managed.

The economic value of the EU shipping industry April 2014
26
As a result, for those countries for which detailed national figures are not available, it has been
necessary to estimate this ‘missing’ section of the workforce using a combination of GVA statistics
and productivity data.
Overall, it is estimated that the European shipping industry directly employed 590,000 people in
2012. This means that shipping employs more people than travel agents and tour operators;
forestry and logging; and air transport (Table 3.1.2).
Table 3.1.2: Direct employment in the EU and Norway – shipping and comparator industries,
2012
Industry Employment (000s)
Paper manufacturing 653
Pharmaceutical manufacturing 598
Shipping 590
Travel agents and tour operators 533
Forestry and logging 502
Air transport 425
Source: Eurostat, Oxford Economics
Within the total shipping employment figure, 63 per cent of workers are involved in freight transport
(including towing and dredging); 27 per cent are involved in passenger transport; and 9 per cent
work in service and offshore support activities. Just under 7,000 people are employed in renting
and leasing, equivalent to one per cent of employment (Figure 3.1.2a).
Figure 3.1.2a: Direct employment in the EU shipping industry by sub-sector, 2012
A proportion of employment in the freight, passenger, and services and offshore support sub-
sectors comprises seafarers who generally work at sea. This element of employment in these sub-
sectors has been estimated using information provided by national associations and ECSA. For
countries where no such data are available, the number of workers at sea has been estimated
using the average split of land-based and sea-based employment in the countries for which data
are available. It is assumed that all of the employment in the renting and leasing sub-sector is
0
50,000
100,000
150,000
200,000
250,000
300,000
350,000
400,000
Freight transport(incl. towing &
dredging)
Passenger transport Service & offshoresupport vessels
Renting & leasing
Source: Oxford Economics

The economic value of the EU shipping industry April 2014
27
shore-based. On this basis it is estimated that around four-fifths of European shipping industry
employment consists of positions at sea (Figure 3.1.2b).
Figure 3.1.2b: Total employment in the EU shipping industry by place of work, 201210,11
Officers account for an estimated 41 per cent of positions at sea, and ratings 59 per cent12
. The
estimated split by country is shown in Figure 3.1.2c. Noticeable in the chart is the large number of
UK ratings, which includes a significant number of hospitality employees in the country’s cruise
fleet. The Netherlands also has a high proportion of ratings amongst its seafarers, once again
reflecting large numbers of hospitality ratings on cruise ships.
10 This chart includes both EU and non-EU seafarers
11 The sea-based employment figures for Greece only include those working on ships flying the Greek flag, and a small
proportion of Greek controlled ships operating under foreign flags but affiliated with the Greek NAT Seamen’s Pension Fund. The use of these data is consistent with the previous national study by the Boston Consulting Group (see http://www.bcg.gr/documents/file146826.pdf). However, it is likely to result in an under-estimate of total employment in Greek shipping industry. This point is acknowledged in a 2013 report by the Foundation for Economic and Industrial Research titled ‘The contribution of ocean-going shipping to the Greek economy: performance and outlook’. That study suggested that “total employment in Greek-owned ships exceeds 60,000 jobs”.
12 The split between officers and ratings was estimated using information from ECSA members or, where none was held,
from ISF/BIMCO data presented in the European Commission Study on Seafarers Employment, available at: http://ec.europa.eu/transport/modes/maritime/studies/doc/2011-05-20-seafarers-employment.pdf
0 20,000 40,000 60,000 80,000 100,000 120,000
UK
Germany
Norway
Italy
Netherlands
Denmark
Greece
France
Spain
Sweden
Poland
Finland
Belgium
Croatia
Bulgaria
Other
At sea Shore-basedSource: Oxford Economics

The economic value of the EU shipping industry April 2014
28
Figure 3.1.2c: Employment at sea split by officers and ratings, 201213
The international nature of the shipping industry means that a wide range of nationalities are
employed on board ships. For a small number of countries data are available on the share of
seafarers that are from an EU or EEA country (Figure 3.1.2d). Taking a weighted average for these
three countries suggests 40% of employees working at sea were EU or EEA nationals. It is not
possible to robustly calculate the equivalent figure across the entire EU fleet, but if the same
proportion applied across the countries for which data are not available, around 195,000 of the
estimated 473,000 seafarers on EU ships would have been EU/EEA nationals in 2012.
13 This chart includes both EU and non-EU seafarers
0 20,000 40,000 60,000 80,000 100,000 120,000
UK
Germany
Norway
Netherlands
Italy
Denmark
France
Greece
Spain
Poland
Sweden
Belgium
Finland
Croatia
Bulgaria
Other
Officers RatingsSource: Oxford Economics

The economic value of the EU shipping industry April 2014
29
Figure 3.1.2d: Proportion of seafarers that are EU or EEA nationals14
As discussed in Section 2, the EU fleet grew strongly between 2004 and 2012. This was
accompanied by growth in employment, from 484,000 in 2004 to 590,000 in 2012. The increase in
employment was proportionately less than the increase in both controlled and flagged tonnage,
indicating that productivity also increased over the period so that fewer workers are now needed
per tonne of the fleet. This is perhaps unsurprising, given that newer ships entering the fleet are
likely to incorporate more modern technology and automated systems than the older vessels they
replace.
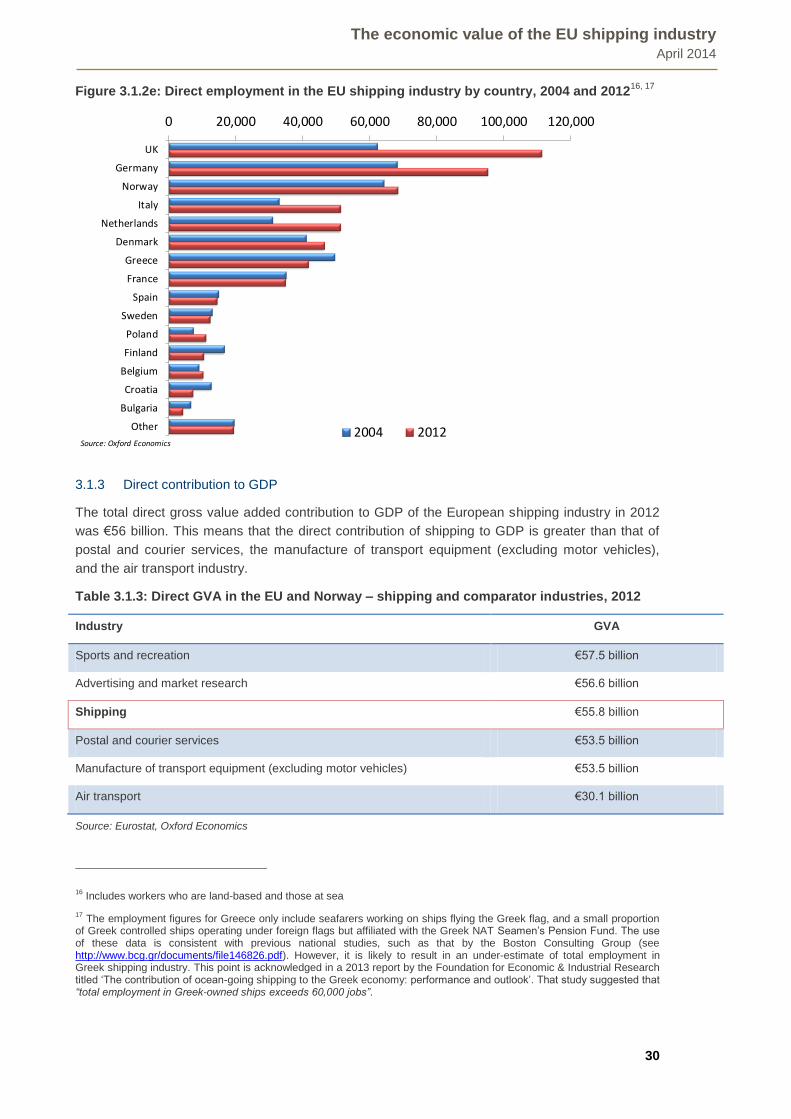
There was a mixed picture in terms of employment growth amongst European countries (Figure
3.1.2e). The UK, the Netherlands, Italy and Germany, in particular, recorded strong employment
growth rates between 2004 and 2012, reflecting large increases in the fleets controlled by these
countries. In 2012, the UK accounted for 111,00015
workers, or 19 per cent of employment in the
EU shipping industry. Germany accounted for 95,000 workers, or 16 per cent of EU shipping
industry employment. Norway accounted for a further 12 per cent of employment.
14 The relatively low proportion of EU nationals for the Netherlands reflects that large numbers of non-EU ratings are
employed on the cruise vessels of the Holland America Line
15 The UK employment estimates are based on results from the UK Chamber of Shipping (CoS) survey of members. Survey
results are grossed up to reflect that CoS membership does not cover the entire UK shipping industry. In previous national studies a grossing factor of 1.7 was applied based on consultation with the UK Office for National Statistics (ONS). However, research in this area is ongoing and more recent evidence suggests this may result in an over-estimate. At the same time, applying no grossing factor would result in an under-estimate. Following consultation with the UK CoS it was decided that the most appropriate approach for this study was to apply a grossing factor of 1.35, at the mid-point of the plausible range. It is recommended that this issue should be revisited in any future national study.
0%
10%
20%
30%
40%
50%
60%
Greece(% EU)
Netherlands(% EU)
Portugal(% EU)
Spain(% EEA)
UK(% EEA)
Average ofcountries
shownSource: Oxford Economics
The economic value of the EU shipping industry April 2014
30
Figure 3.1.2e: Direct employment in the EU shipping industry by country, 2004 and 201216, 17
3.1.3 Direct contribution to GDP
The total direct gross value added contribution to GDP of the European shipping industry in 2012
was €56 billion. This means that the direct contribution of shipping to GDP is greater than that of
postal and courier services, the manufacture of transport equipment (excluding motor vehicles),
and the air transport industry.
Table 3.1.3: Direct GVA in the EU and Norway – shipping and comparator industries, 2012
Industry GVA
Sports and recreation €57.5 billion
Advertising and market research €56.6 billion
Shipping €55.8 billion
Postal and courier services €53.5 billion
Manufacture of transport equipment (excluding motor vehicles) €53.5 billion
Air transport €30.1 billion
Source: Eurostat, Oxford Economics
16 Includes workers who are land-based and those at sea
17 The employment figures for Greece only include seafarers working on ships flying the Greek flag, and a small proportion
of Greek controlled ships operating under foreign flags but affiliated with the Greek NAT Seamen’s Pension Fund. The use of these data is consistent with previous national studies, such as that by the Boston Consulting Group (see http://www.bcg.gr/documents/file146826.pdf). However, it is likely to result in an under-estimate of total employment in Greek shipping industry. This point is acknowledged in a 2013 report by the Foundation for Economic & Industrial Research titled ‘The contribution of ocean-going shipping to the Greek economy: performance and outlook’. That study suggested that “total employment in Greek-owned ships exceeds 60,000 jobs”.
0 20,000 40,000 60,000 80,000 100,000 120,000
UK
Germany
Norway
Italy
Netherlands
Denmark
Greece
France
Spain
Sweden
Poland
Finland
Belgium
Croatia
Bulgaria
Other 2004 2012Source: Oxford Economics

The economic value of the EU shipping industry April 2014
31
Within the total contribution to GDP, freight transport (including towing and dredging) accounted for
€33 billion or 59 per cent (Figure 3.1.3a). Passenger transport contributed 19 per cent, and service
and offshore support activities contributed 15 per cent. The remaining 7 per cent came from renting
and leasing.
Figure 3.1.3a: Direct gross value added contribution to GDP of the EU shipping industry by
sub-sector, 2012
Germany accounted for €11 billion of the European shipping industry’s direct GVA contribution to
GDP in 2012, equivalent to 20 per cent of the EU total (Figure 3.1.3b). Norway contributed a further
17 per cent, Greece 13 per cent, and the UK 11 per cent.
Germany’s share of EU shipping industry GVA is broadly in line with its share of the EU controlled
fleet. Norway’s 17 per cent share of EU shipping industry GVA in 2012 compares to a 10 per cent
share of gross tonnage in that year (or 9 per cent in deadweight tonnage terms). This reflects that
the Norwegian shipping industry is orientated towards higher value added activities, particularly
support of the offshore energy sector. The UK’s share of EU shipping industry GVA, at 11 per cent,
is more than twice its share of tonnage, again reflecting an orientation towards higher-value sectors
such as offshore support vessels and cruise shipping.
In 2004 the EU shipping industry made a direct gross value added contribution to GDP of €47
billion18
. This means the industry’s direct contribution to GDP increased by around 18 per cent over
this period. Whilst the EU fleet grew more strongly between 2004 and 2012, growth in the
industry’s GDP contribution has been held back by the challenging trading conditions discussed in
Section 2. In particular, global over-capacity and the associated drop in freight rates have hit
profitability since the third quarter of 2008.
18 This value is expressed in current (non-inflation-adjusted) terms. As discussed in the Section 2, there have been large
fluctuations in global shipping rates between 2004 and 2012. This has led to considerable year-to-year volatility in GDP deflators for the water transport sector which make it difficult to draw clear conclusions regarding the evolution of the shipping industry’s direct GDP contribution over the period when data are expressed in real (inflation-adjusted) terms.
0
5,000
10,000
15,000
20,000
25,000
30,000
35,000
Freight transport(incl. towing &
dredging)
Passengertransport
Service & offshoresupport vessels
Renting & leasing
€m
Source: Oxford Economics

The economic value of the EU shipping industry April 2014
32
Nonetheless, there is again a mixed picture amongst European countries (Figure 3.1.3b). The
shipping industry’s direct gross value added contribution to GDP in Germany, Norway and Belgium
increased strongly between 2004 and 2012. In contrast, the direct contribution to GDP declined by
5 per cent between 2004 and 2012 in Greece, where the industry has faced adverse conditions as
a result of the severe economic crisis. Italy saw an even sharper fall in shipping industry GVA
between 2004 and 2012, reflecting the orientation of its fleet towards large tankers and bulk
carriers, which have been particularly hard hit by the challenging conditions in the industry since
200819
.
Fig 3.1.3b: Direct gross value added contribution to GDP of the EU shipping industry by
country, 2004 and 2012
Combining the results for the direct employment and gross value added contributions suggests
productivity levels are relatively high within the European shipping industry: each worker generated
an average of €88,000 of gross value added in 2012 (Figure 3.1.3c)20
. This compares to an
average figure for the EU and Norway of €53,000 across all industries.
19 A methodological change in the Italian GVA statistics also contributed to the reduction in shipping industry GVA between
2004 and 2012. However, we understand from the Italian Shipowners’ Association that the bulk of the decline is attributable to the composition of the country’s fleet.
20 Because of the likely under-estimation of employment in the Greek shipping industry, Greece has been excluded from the
shipping industry productivity calculation.
0 2,000 4,000 6,000 8,000 10,000 12,000
Germany
Norway
Greece
UK
Denmark
Italy
France
Netherlands
Belgium
Sweden
Spain
Finland
Poland
Ireland
Croatia
Other
€m
2004 2012Source: Oxford Economics

The economic value of the EU shipping industry April 2014
33
Figure 3.1.3c: Productivity in EU shipping and comparator industries, euro per employee,
2012
High productivity means the shipping industry contributes an above-average amount to Europe’s
GDP for each worker employed and therefore helps to raise living standards. Based on the
estimate above, productivity in the shipping industry is higher than for the water supply industry
(€86,000), the film and television industry (€84,000 per worker) and the air transport sector
(€71,000 per worker). Productivity in the land transport sector is €44,000 per worker, less than half
the figure for shipping.
3.1.4 Direct contribution to tax revenue
In addition to contributing to employment and GDP, the shipping industry generates tax revenues
for member state governments. The analysis for this project has estimated the value of revenues
generated in the form of employee and employer social security contributions, income tax levied on
the earnings of the workforce, VAT on the spending of employees, and corporation and tonnage
tax revenues from shipping firms21
.
To estimate income tax and social security payments, OECD data on social security contributions
and income tax rates have been applied to average industry wages in each country. It is assumed
that all onshore workers are subject to tax and social security at the usual rates. In contrast, some
proportion of workers at sea are likely to be exempt from income tax and social security payments
because they are non-EU nationals, and/or because they spend a large proportion of their time at
sea. In addition, some countries have schemes in place to reduce income tax and social security
contributions for seafarers. National associations have provided information to indicate the
proportion of seafarers who do not pay tax, or who are non-EU nationals and therefore unlikely to
pay tax. For other countries, it is assumed that the proportion of non-taxpayers is in line with the
average amongst those countries for which data are available.
21 It should be noted that the shipping industry also benefits from government expenditure in European countries. The
estimation of this expenditure is beyond the scope of this study.
€ 0 € 20,000 € 40,000 € 60,000 € 80,000 € 100,000 € 120,000 € 140,000
Financial services (excludinginsurance and pensions)
Insurance
Chemical manufacturing
Shipping
Water supply
Film and television
Air transport
Land transport
EU average
Source: Oxford Economics

The economic value of the EU shipping industry April 2014
34
To estimate VAT revenues, the consumption expenditure of shipping industry employees working
on shore and EU nationals working at sea is estimated based on average wages, and Eurostat
information on the savings rate in each country. Eurostat data on VAT receipts as a proportion of
consumption expenditure in each country have then been used to estimate the VAT on the
spending of shipping industry employees.
Tonnage tax revenues for countries with a tonnage tax regime have been estimated based on
revenue information provided by a small sample of national associations. It is assumed that the
renting and leasing sub-sector is subject to regular corporation tax, and the tax revenues from
these activities have been estimated using information on average profitability and corporation tax
rates in each country. For countries with no tonnage tax, it is assumed companies in the freight and
passenger transport sub-sectors are also subject to corporation tax at the average rate for each
country.
Using this approach, it is estimated that the EU shipping industry directly generated €6 billion in tax
revenues in 2012. Almost four-fifths of this total was attributable to just six countries: Germany,
Norway, Italy, France, the UK and Denmark.
Figure 3.1.4: The direct tax contribution of the EU shipping industry, 2012
0 200 400 600 800 1,000 1,200 1,400
Germany
Norway
Italy
France
UK
Denmark
Netherlands
Greece
Sweden
Spain
Belgium
Finland
Croatia
Portugal
Ireland
Other
€m
Source: Oxford Economics

The economic value of the EU shipping industry April 2014
35
3.2 Indirect and induced impacts
3.2.1 Indirect and induced impact on GDP
The indirect, or supply chain, impacts of the shipping industry are estimated using ‘input-output’
tables which map the inputs required by firms in a sector to produce a unit of output. To illustrate
this concept consider the following simple example: to provide shipping services that sell for €5
million, a shipping firm may need to purchase fuel for €1 million, port services for €1 million and
professional and technical services for €0.5 million. In this example the shipping firm has generated
€2.5 million of gross value added (the value of its output less the value of inputs), and has
generated €2.5 million in turnover for other firms in the supply chain.
The estimation of indirect GDP impacts for this project has been undertaken using Oxford
Economics’ Global Input-Output model. This not only allows the estimation of supply chain effects
within countries, but also captures cross-country impacts amongst European countries. For
example, this would detect the impact of, say, a Dutch shipping firm purchasing insurance from a
firm in the City of London and computer software from a company in France22
.
Overall, it is estimated that the indirect gross value added contribution to GDP of the European
shipping industry in 2012 was €59 billion. As with the direct contribution to GDP, the largest figures
were recorded for Germany and Norway. Figure 3.2.1a presents a breakdown of the indirect
contribution to GDP according to whether it occurs domestically, or within another European
country. For Germany, Italy, the UK, and France, at least four-fifths of the indirect impact is
estimated to have occurred within the same country as the direct impact. However, a number of
countries have very internationalised supply chains. For example, in Denmark around 77 per cent
of the indirect impact occurred elsewhere in Europe, and for Norway the equivalent figure is 63 per
cent.
22 There is further discussion of the input-output methodology at Annex A.

The economic value of the EU shipping industry April 2014
36
Figure 3.2.1a: Indirect gross value added contribution to GDP of the EU shipping industry
by country, 2012
Induced impacts result from the spending of workers employed in the shipping industry or its supply
chain. The impacts are mainly felt in sectors serving households such as hotels, restaurants and
shops. Within the Input-Output model, the induced GDP impact is estimated through ratios which
estimate the value of wages generated by the activity associated with the direct and indirect
contributions to GDP. From there it is possible to estimate consumer expenditure, and the induced
contribution to GDP associated with this expenditure.
The total induced gross value added contribution to GDP of the European shipping industry is
estimated to have been €30 billion in 2012. As with the indirect contribution to GDP, it is possible to
split out whether induced expenditure impacts occur within the same country as the direct GDP
impact, or elsewhere in Europe. This time, an estimated 74 per cent of the induced contribution to
GDP from the Danish shipping industry is felt in other European countries. In Norway the
equivalent figure is 61 per cent. These figures imply that a large amount of consumption
expenditure in these two countries is on goods that are either imported from other European
countries, or actually occurs in other EU countries, perhaps in the form of personal travel or cross-
border shopping.
0 2,000 4,000 6,000 8,000 10,000 12,000 14,000 16,000
Germany
Norway
Italy
Denmark
UK
France
Greece
Belgium
Netherlands
Sweden
Spain
Finland
Poland
Ireland
Croatia
Other
€m
Indirect domestic Indirect other EUSource: Oxford Economics

The economic value of the EU shipping industry April 2014
37
Figure 3.2.1b: Induced gross value added contribution to GDP of the European shipping
industry by country, 2012
0 1,000 2,000 3,000 4,000 5,000 6,000 7,000
Norway
Germany
UK
Italy
Denmark
France
Greece
Netherlands
Belgium
Sweden
Finland
Spain
Poland
Ireland
Croatia
Other
€m
Induced domestic Induced other EUSource: Oxford Economics

The economic value of the EU shipping industry April 2014
38
3.2.2 Indirect and induced impact on employment
Once the indirect and induced impacts have been estimated in GVA terms, productivity data can be
used to estimate the number of jobs created in the supply chain and in sectors where direct and
indirect employees spend their wages. As with the GDP impacts, the employment impacts can be
divided into those which occur within the same country as the direct impact, and those which occur
elsewhere in Europe. In total, the indirect employment contribution of the European shipping
industry is estimated to have been equivalent to around 1.1 million jobs across Europe in 2012.
Figure 3.2.2a: Indirect employment impact of the EU shipping industry by country, 2012
The induced impact of the European shipping industry in 2012 is estimated to have been 547,000
jobs. Just over half of these jobs were created in the same country that the direct impact occurs,
and just under half were created in other European countries.
0 60,000 120,000 180,000 240,000 300,000
Germany
Norway
Italy
Denmark
UK
France
Greece
Belgium
Netherlands
Sweden
Spain
Poland
Finland
Croatia
Portugal
Other Indirect domestic Indirect other EUSource: Oxford Economics

The economic value of the EU shipping industry April 2014
39
Figure 3.2.2b: Induced employment impact of the EU shipping industry by country, 201223
3.2.3 Indirect and induced impact contribution to tax revenue
To estimate the value of employment taxes associated with the indirect and induced impacts of the
EU shipping industry, average tax and social security rates have been applied to the estimated
amount of indirect and induced employment in each country. This includes cross-border effects so
that, for example, the calculations are based on the number of people employed in France not only
as a result of the indirect and induced effects of the French shipping industry, but also those
employed in France as a result of the indirect and induced effects of the industry in other EU
countries.
Consistent with the direct tax impact, VAT on the spending of workers has been estimated by
applying average VAT rates from Eurostat to the estimated amount of spending, taking into
account wages and savings rates.
Corporation tax revenues have been estimated by applying average profit margins and corporation
tax rates to the indirect and induced GVA effects which occur within each country.
Using this methodology, it is estimated that the EU shipping industry supported €35 billion in tax
revenues as a result of activity in its supply chain, and the induced spending of its employees and
those in the supply chain (Figure 3.2.3).
23 The Union of Greek Shipowners has noted that the Oxford Economics approach results in more conservative estimates of
indirect and induced employment in Greece than the 2013 report by the Foundation for Economic and Industrial Research titled ‘The contribution of ocean-going shipping to the Greek economy: performance and outlook’. The latter estimates that the indirect and induced employment impact of the Greek shipping industry was around 160,000 in 2009. That figure relates only to impacts occurring within Greece and does not incorporate any cross-border effects.
0 20,000 40,000 60,000 80,000 100,000 120,000
Germany
UK
Norway
Italy
Denmark
Greece
France
Netherlands
Belgium
Sweden
Spain
Finland
Poland
Croatia
Portugal
OtherInduced domestic Induced other EU
Source: Oxford Economics

The economic value of the EU shipping industry April 2014
40
Figure 3.2.3: Indirect and induced tax contribution of the EU shipping industry, 201224
24 For certain countries, notably Denmark, Greece and Norway, a large proportion of the indirect and induced GVA impact is
estimated to occur in another EU country. This has contributed to the ranking of these countries being lower for the indirect and induced tax contribution, than for the direct tax contribution.
0 2,000 4,000 6,000 8,000
Germany
France
Italy
UK
Norway
Belgium
Netherlands
Sweden
Spain
Denmark
Greece
Finland
Poland
Austria
Ireland
Other
€m
Indirect Tax Induced TaxSource: Oxford Economics

The economic value of the EU shipping industry April 2014
41
3.3 Total economic impact of the EU shipping industry
Adding together the direct, indirect and induced impacts described above gives the total economic
contribution of the European shipping industry. The total gross value added contribution to GDP
from the EU shipping industry is estimated to have been €145 billion in 2012. €57 billion, or 39 per
cent of this total came from just two countries: Germany and Norway (Figure 3.3a). Altogether, 99
per cent of the total impact was generated by the 15 largest countries.
The blue boxes in Figure 3.3a indicate the total contribution of the shipping industry relative to the
total GDP of each country. Overall, the total economic contribution of shipping is equivalent to 1.1
per cent of EU GDP, but in some countries it can be considerably greater: between 5 and 7 per
cent in Norway, Greece and Denmark.
Figure 3.3a: Total gross value added contribution to GDP of the EU shipping industry by country, 2012
For every €1 million the European shipping industry contributes to GDP itself, it creates another
€1.6 million elsewhere in the European economy. This means that that industry’s GDP multiplier is
2.625
.
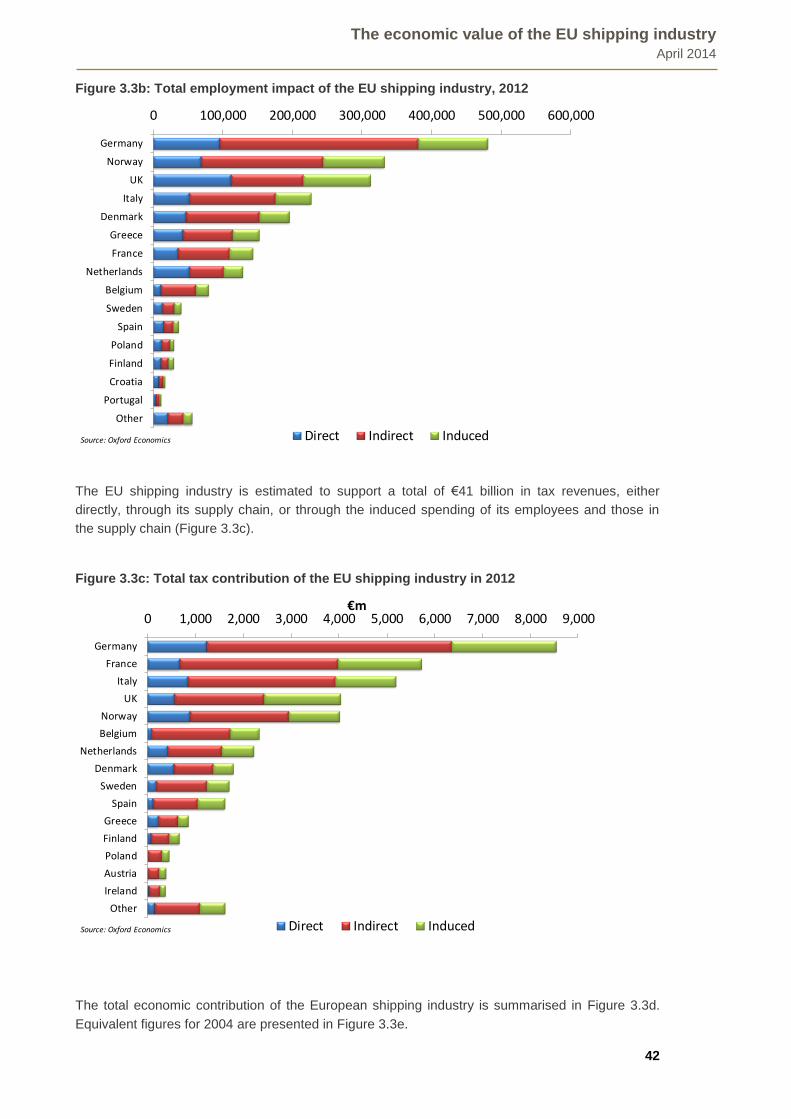
Following a similar approach, the European shipping industry is estimated to have supported a total
of 2.3 million jobs in 2012, either directly through its own activities, or through its supply-chain or
the induced expenditure of its employees and those in its supply chain. For every direct job the
industry creates, another 2.8 are created elsewhere in the European economy. This means the
shipping industry’s employment multiplier is 3.8. Half of the total employment contribution of the
shipping industry occurs in Germany, Norway and the UK (Figure 3.3b).
25 The multiplier is calculated as: (Direct GDP + Indirect GDP + Induced GDP) / Direct GDP
0 5,000 10,000 15,000 20,000 25,000 30,000 35,000
Germany
Norway
UK
Denmark
Italy
Greece
France
Netherlands
Belgium
Sweden
Spain
Finland
Poland
Ireland
Croatia
Other
€m
Direct Indirect InducedSource: Oxford Economics
1.1%
6.8%
0.8%
5.6%
0.9%
6.4%
0.5%
1.2%
1.6%
0.6%
0.2%
0.9%
0.2%
0.3%
1.0%
Percentages denote totaleconomic contribution of the shipping industry as a proportion of national GDP
The economic value of the EU shipping industry April 2014
42
Figure 3.3b: Total employment impact of the EU shipping industry, 2012
The EU shipping industry is estimated to support a total of €41 billion in tax revenues, either
directly, through its supply chain, or through the induced spending of its employees and those in
the supply chain (Figure 3.3c).
Figure 3.3c: Total tax contribution of the EU shipping industry in 2012
The total economic contribution of the European shipping industry is summarised in Figure 3.3d.
Equivalent figures for 2004 are presented in Figure 3.3e.
0 100,000 200,000 300,000 400,000 500,000 600,000
Germany
Norway
UK
Italy
Denmark
Greece
France
Netherlands
Belgium
Sweden
Spain
Poland
Finland
Croatia
Portugal
Other
Direct Indirect InducedSource: Oxford Economics
0 1,000 2,000 3,000 4,000 5,000 6,000 7,000 8,000 9,000
Germany
France
Italy
UK
Norway
Belgium
Netherlands
Denmark
Sweden
Spain
Greece
Finland
Poland
Austria
Ireland
Other
€m
Direct Indirect InducedSource: Oxford Economics

The economic value of the EU shipping industry April 2014
43
Figure 3.3d: The total economic impact of the EU shipping industry, 2012
Figure 3.3e: The total economic impact of the EU Shipping industry, 2004
Total Impact
Direct
Indirect
Induced
547
1,126
2,263
Employment(000s)
12 2341 596 56 30 145Contribution
to GDP(€bn)
Tax Revenue(€bn)
590
2012Total Impact
Direct
Indirect
Induced
555
1,108
2,146
Employment(000s)
9 1834 507 47 26 122Contribution
to GDP(current
prices and exchange
rates)
Tax Revenue(current
prices and exchange
rates)
484
2004

The economic value of the EU shipping industry April 2014
44
4 The economic impact of measures adopted under the Community guidelines on state aid to maritime transport
Key points
The shipping industry has a number of unique features which provide a rationale for a more
favourable taxation policy than is available to other industries. The industry is, by its very
nature, highly mobile and activity can easily be moved to countries which adopt more
favourable taxation and regulatory regimes. A healthy and competitive shipping industry
forms the core of the wider European maritime cluster and supports development of the
EU’s international trading linkages. It is also strategically important, for example in ensuring
a secure energy supply and in providing capacity to support military operations in times of
crisis or in peacekeeping missions.
Recognising such arguments, and in response to intense international competition from third
country shipping registers and global shipping centres, EU governments have introduced a
range of state aid measures to support shipping, most notably in the form of tonnage tax and
reduced income tax and social security contributions for seafarers. This approach has been
guided by policy at the European level, through the Commission’s guidelines on state aid.
Based on an illustrative counter-factual scenario using trends in fleet data for nine EU
countries, it is tentatively estimated that the total economic contribution of the European
shipping industry could have been around 50 per cent lower in 2012, in terms of GVA and
employment, if the countries in the analysis had not introduced tonnage tax regimes and
other state aid measures.
4.1 The state aid guidelines and the economic rationale for their implementation
The shipping industry has a number of unique and specific features which provide a rationale for a
more favourable taxation policy than is available to other European industries.
Shipping is, by its very nature, a highly mobile activity and it is very easy for shipowners to register
vessels under the flag of the country with the lowest corporate tax burden. This has resulted in
intense international competition in taxation and regulatory regimes to attract shipping firms to
‘open registries’, which do not place nationality requirements on ship owners or shipping company
employees.
For example, Singapore is actively attempting to become the world’s maritime hub and has
adopted a favourable taxation regime that provides tax exemptions on shipping income from the
operation of Singapore-flagged ships, and on foreign flagged ships plying international waters
where the control and management of the fleet is based in Singapore. Countries including China,
Dubai and Hong Kong are also making significant efforts to become international centres of
shipping.
A large amount of the activity undertaken by EU shipping firms involves cross-trades between two
non-EU ports. It may make little difference to operations to move land-based activity to a country
with a more favourable taxation and regulatory system. As well as leading to the loss of jobs within
the EU shipping sector, this can have negative impacts on the wider maritime cluster, including
high value onshore jobs in associated industries such as finance and insurance.

The economic value of the EU shipping industry April 2014
45
International competition to attract shipping firms could also have wider implications for
international trade. A number of European countries have a long and successful history of maritime
activity and possess a competitive advantage in some aspects of the sector. Such countries may
be able to provide shipping services more efficiently or cheaply than other countries, encouraging
international trade growth. However, this competitive advantage could become distorted by
international tax competition, and the benefits to European trade may be lost.
At the same time, the shipping industry is strategically important for the EU. As well as enabling
international trade, the shipping industry helps secure the EU energy supply through imports of oil
and other fuels. The EU merchant fleet may also be called upon to support military operations in
times of crisis, or in peacekeeping missions.
More broadly, the global shipping industry, and wider society, benefit, from an EU fleet that upholds
the highest safety, security and social standards, as set out by international bodies such as the
International Maritime Organisation and the International Labour Organisation.
There are also wider benefits to society from having a highly trained workforce of seafarers who
may go on to work in other parts of the maritime cluster or the wider economy after they finish
working on board ships26
(this is discussed in more detail in Section 5).
Recognising the need to support the international competitiveness of the EU shipping industry in
the face of intense international competition, national governments have introduced a range of
measures to support the shipping industry, particularly in the form of tonnage tax and reductions in
income tax and social security contributions for seafarers. The first European country to introduce a
tonnage tax was Greece, during the 1950s. The current Greek regime was introduced in 1975, and
it has remained largely unchanged since then. A number of European countries have followed this
example over the last two decades (Table 4.1).
The steps national governments have taken have been guided by policy at the European level: the
European Commission introduced its first set of state aid guidelines for the shipping sector in 1989
in an attempt to encourage consistency in the policy stances of member states. However, this
proved relatively ineffective and the flagged fleets of many EU countries continued to decline. New
guidelines were introduced in 1997, revised in 2004 and confirmed in 2013 (following a public
consultation in 2012), again with the aim of encouraging a more harmonised approach to
supporting the EU shipping industry amongst member states. More specifically, the 2004
guidelines aim to increase transparency and support the European Union’s maritime interests by
clarifying the kinds of state aid schemes that European governments may introduce. In general any
such benefits may only be granted to ships flying the flag of a member state, although aid may also
be granted to non-EU flagged ships that comply with international standards and EU law, which are
operated from within the EU, and which are owned by a company established within the EU.
26 Economists refer to this as a “positive externality” – the benefit to ship-owners of training seafarers is lower than the total
benefit to society. Left to their own devices, shipowners would tend to train fewer seafarers than may be optimal from society’s perspective

The economic value of the EU shipping industry April 2014
46
Table 4.1: Year of introduction of national tonnage tax regimes
1957 Greece (adapted in 1975)
…
1963 Cyprus
…
1973 Malta
…
1996 Netherlands, Norway
…
1999 Germany
2000 UK
…
2002 Belgium (adapted in 2004); Denmark (slightly amended in 2004, 2005 and 2007); Latvia;
Spain
2003 France (adapted in 2004); Ireland
…
2005 Bulgaria; Italy
2006 Poland
2007 Lithuania
2008 Slovenia
…
2012 Finland
The main types of aid that can be granted under the guidelines are:
tonnage tax, whereby a shipowner pays tax linked to the amount of tonnage they operate,
regardless of the profit or loss generated. Tax relief is applicable to shipowners, but can
also be applied to ship managers under certain circumstances;
reduced income tax and social security contribution rates for seafarers employed on board
ships;
aid with the training of seafarers or cadets on board ships; and
support with the set-up costs for short-sea shipping between EU member state ports.
The following sections consider how the EU shipping industry and its economic contribution might
have evolved in the absence of such state aid measures.
4.2 Developing an alternative scenario: how might the EU shipping industry have
evolved in the absence of national state aid regimes?
This section of the report compares the estimates of the economic impact of the EU shipping
industry presented in Section 3 with an illustrative counterfactual scenario in which shipping firms
are assumed to have been subjected to more traditional tax regimes.
Counter-factual scenarios have been constructed across a number of countries by assuming the
trend in a country’s fleet observed before the introduction of state aid measures would have
continued had the measures not been introduced. The analysis uses information on either the
flagged or controlled fleet for each of the countries, depending on data availability and the definition
of the fleet that is most closely related to GVA trends.

The economic value of the EU shipping industry April 2014
47
The output from this analysis is an estimate of the percentage by which the national fleet could
have been smaller in the absence of state aid measures. It is assumed that the economic
contribution of the shipping industry in that country would have been reduced in proportion to this.
This section of the analysis should be regarded as purely illustrative. It is extremely difficult to know
what would have actually happened in the absence of state aid measures, not least because the
evolution of national shipping fleets is influenced by a wide range of other factors within countries,
in the wider shipping industry, and in the global economy. This task is further complicated by the
global recession and its impact on the shipping industry, which have introduced a strong cyclical
component into recent data trends.
To summarise, the aim of this part of the analysis is to show what could have happened
under the assumption that the pre-state aid trend in a country’s fleet continued to 2012, and
assuming a proportionate effect on the economic impact of the shipping industry in that
country. It should not be regarded as a formal assessment of what would have happened.
4.3 Assessing the economic impact of state aid regimes in individual countries
This section of the report presents case studies for four countries to examine the impact of the
introduction of state aid measures on national fleets. A fifth case study is then presented for
Sweden, a country with employment tax incentives, but no tonnage tax regime.
4.3.1 Denmark
Denmark introduced a tonnage tax regime in 2002, and this was slightly amended in 2004, 2005
and 2007. The Danish controlled fleet initially continued to decline in 2002. There was an increase
in 2005, mainly as a result of A.P. Møller-Maersk buying P.O. Nedlloyd, but the Danish controlled
fleet has continued to record strong growth since 2006. In addition to the tonnage tax, the
development of Denmark’s fleet has been supported by the government’s 2006 strategy to develop
the country as a leading shipping nation. This has resulted in a large number of measures to
support the industry, including research, the removal of special technical rules, other tax
adjustments, and education initiatives.
Figure 4.3.1: Denmark controlled fleet, 1994 to 2012
0
5,000
10,000
15,000
20,000
25,000
30,000
35,000
40,000
199
4
199
5
199
6
199
7
199
8
199
9
200
0
200
1
200
2
200
3
200
4
200
5
200
6
200
7
200
8
200
9
201
0
201
1
201
2
Controlled fleet Controlled fleet, 'No state aid' scenario
Source: ISL Bremen; counter-factual scenario estimated by Oxford Economics
DWT (000s)
No tonnage tax
Controlled fleet is 58% smaller in the counter-factual scenario
Tonnage tax

The economic value of the EU shipping industry April 2014
48
For the counter-factual scenario, it is assumed that if the tonnage tax regime (including the
subsequent amendments) and the government’s other support measures had not been
implemented, the trend in the Danish controlled fleet observed between 2001 and 2005 would have
continued. Had this been the case, in 2012 the fleet would have been 58 per cent smaller in the
counter-factual scenario than in reality. If the economic impact was proportionate to the impact on
the Danish controlled fleet, the industry’s direct contribution to Danish GVA would have been
around €3 billion lower in 2012.
4.3.2 France
France introduced tonnage tax in 2003, and adapted the scheme in 2004. Between 2001 and 2005
France also applied a separate system to reimburse social security contributions and charges to
shipowners, subject to certain conditions relating to training, employment and fleet evolution. From
2006, all ships that face international competition have been exempted from social security
contributions. While there appears to have been no immediate response in the size of the
controlled fleet to the introduction of tonnage tax in 2003, or the 2004 changes, there is a clear
upward trend in the controlled fleet from 2006 onwards, suggesting the simplified social security
exemption may have played an important role in encouraging renewed growth in the French
controlled fleet.
Figure 4.3.2: France controlled fleet, 1994 to 2012
For the counter-factual scenario, it is assumed that the French controlled fleet would have
continued to decline at the rate observed between 1994 and 2002 if state aid measures had not
been introduced (Figure 4.3.2). Had the pre-2003 trend continued, it is estimated that the French
controlled fleet would have been 61 per cent smaller by 2012. If the economic contribution of the
French shipping industry was also 61 per cent smaller in 2012, there would have been 21,000
fewer jobs in French shipping, and the industry’s direct contribution to French GDP would have
been £1.9 billion lower than in reality.
4.3.3 Germany
Germany introduced a tonnage tax regime in 1999. In the same year, it also introduced a separate
wage tax retention scheme, which allows the employer of crew members serving on board German
flagged merchant ships to retain 40 per cent of the wage taxes they would otherwise have paid to
the tax authorities. The introduction of these measures appears to have supported a noticeably
0
2,000
4,000
6,000
8,000
10,000
12,000
199
4
199
5
199
6
199
7
199
8
199
9
200
0
200
1
200
2
200
3
200
4
200
5
200
6
200
7
200
8
200
9
201
0
201
1
201
2
Controlled fleet Controlled fleet, 'No state aid' scenario
Source: ISL Bremen; counter-factual scenario estimated by Oxford Economics
DWT (000s)
Tonnage Tax
Controlled fleet is 61% smaller in the counter-factual scenario
No tonnage tax

The economic value of the EU shipping industry April 2014
49
stronger growth rate amongst the German controlled fleet, particularly since 2003. By 2012, the
German controlled fleet was almost four times as large as in 1999.
Figure 4.3.3: Germany controlled fleet, 1994 to 2012
To estimate a counter-factual scenario, it is assumed that if the state aid measures had not been
implemented, the German controlled fleet would have continued to grow at the rate observed
between 1994 and 1998. As a result, by 2012 the fleet would have been 68 per cent smaller than
the size actually observed in 2012.
The direct GDP contribution of the German shipping industry in 2012 was €11 billion. In the
counter-factual scenario, which assumes a much more modest progression of the German
controlled fleet and a proportionate reduction in economic impact, the direct contribution of the
German shipping industry to German GDP in 2012 would have been just €4 billion. There would
also have been around 65,000 fewer jobs in the German shipping industry 2012.
4.3.4 The UK
Tonnage tax was introduced in the UK in July 2000, with the objective of creating a positive fiscal
environment for international shipping based in the UK, in line with other major maritime countries.
To join the system, a company must have “strategic and commercial management” of its fleet in the
UK, and the ship must be over 100 tonnes and be seagoing. The UK regime brings a requirement
that a shipping company must recruit and train one new cadet each year for every 15 officer posts
in the tonnage tax fleet, and the cadet must be ordinarily resident in the UK (there is further
discussion of training in Section 5 of this report).
The UK controlled fleet declined steeply during the 1980s and 1990s, and by 1999 it was just one
fifth of its size in 1980 (Figure 4.3.4). However, there was a clear reversal of this trend following the
introduction of tonnage tax: the fleet increased strongly and steadily after 1999, and by 2012 it had
more than tripled in size. This meant the UK controlled fleet was at its largest since the early
1980s.
0
20,000
40,000
60,000
80,000
100,000
120,000
140,000
199
4
199
5
199
6
199
7
199
8
199
9
200
0
200
1
200
2
200
3
200
4
200
5
200
6
200
7
200
8
200
9
201
0
201
1
201
2
Controlled fleet Controlled fleet, 'No state aid' scenario
Source: ISL Bremen; counter-factual scenario estimated by Oxford Economics
DWT (000s)
No tonnage tax
Controlled fleet is 68% smaller in the counter-factual scenario
Tonnage tax

The economic value of the EU shipping industry April 2014
50
Figure 4.3.4: UK controlled fleet, 1994 to 2012
For the counter-factual scenario it is assumed that the pre-1999 trend in the controlled fleet would
have continued in the absence of tonnage tax. As a result, in 2012 the fleet is 85 per cent smaller
than was observed in reality. Assuming a proportionate impact on the industry’s economic
contribution, this implies that the direct contribution to UK GDP from the shipping industry would
have been around €5 billion lower in 2012 in the counter-factual scenario. Employment in the UK
shipping industry in 2012 would have been 95,000 below the level actually observed.
4.3.5 Sweden
The final case study example looks at the experience in Sweden, which in 2001 introduced a
system of social security and income tax incentives for Swedish flagged ships. However, in
contrast to the countries discussed above, Sweden has not introduced a tonnage tax regime.
The Swedish flagged fleet declined sharply during the 1980s (Figure 4.3.5). After a temporary
recovery in the early 1990s, the Swedish flagged fleet has been relatively flat at around two million
deadweight tonnes since 1998. Figures for the Swedish controlled fleet exhibit considerable
volatility in the late 1990s, but between 2004 and 2012 the controlled fleet was relatively flat at
between six and seven million deadweight tonnes.
0
5,000
10,000
15,000
20,000
25,000
30,000
35,000
40,0001
980
198
2
198
4
198
6
198
8
199
0
199
2
199
4
199
6
199
8
200
0
200
2
200
4
200
6
200
8
201
0
201
2
Controlled fleet Controlled fleet, 'No state aid' scenario
Controlled fleet is 85% smaller in the counter-factual scenario
Source: UK Chamber of Shipping, Oxford Economics
DWT (000s)
No tonnage tax Tonnage tax

The economic value of the EU shipping industry April 2014
51
Figure 4.3.5: Sweden controlled fleet, 1994 to 2012
The most striking difference between the experience in Sweden and that in the countries discussed
above, is that those countries which have introduced a tonnage tax have experienced strong fleet
growth over the last decade, whereas the Swedish fleet has remained relatively flat. Given that the
world fleet has also grown strongly over the last ten years, this means that the Swedish flagged
share of the world fleet has fallen from 1.1 per cent in 1980, to just 0.1 per cent in 2012. The
Swedish Shipowners’ association reports that at least three shipowners have moved their head
offices to other EU countries between January 2010 and January 2014.
0
5,000
10,000
15,000
20,000
25,000
0
1,000
2,000
3,000
4,000
5,000
6,000
7,000
8,0001
980
198
2
198
4
198
6
198
8
199
0
199
2
199
4
199
6
199
8
200
0
200
2
200
4
200
6
200
8
201
0
201
2
Controlled fleet, 000 DWT
Flagged fleet, 000 DWT
Flagged fleet (left scale) Controlled fleet (right scale)
Source: UNCTAD, ISL Bremen

The economic value of the EU shipping industry April 2014
52
4.4 Illustrative assessment of the economic impact of state aid regimes across
the EU
Following the same methodology used in Sections 4.3.1 to 4.3.4, it has been possible to estimate
the impact of state aid regimes in a number of other countries: Belgium, Ireland, the Netherlands,
Norway and Poland. It was not possible to estimate counter-factual scenarios for all countries that
have introduced tonnage tax regimes and other state aid measures, either because data series are
not available for a sufficiently long time period, or because there is too much ‘noise’ in the data to
be able to identify clear changes in long-term trends.
To estimate an EU figure for the economic impact of state aid regimes, the direct economic
contribution of each of the countries has been reduced in proportion to the reduction in fleet size
under each country’s counter-factual scenario. By applying the multiplier estimates from the Oxford
Economics Input-Output model it is also possible to estimate the indirect and induced impacts in
the counter-factual scenario. The results are presented in Figure 4.4, below.
In this illustrative counter-factual scenario, the direct GVA contribution of the EU shipping in 2012 is
€27 billion, or 52 per cent, lower than in our main estimate. Once indirect and induced effects are
included, the total GVA contribution of the EU shipping falls from €145 billion to €68 billion, a
reduction of 54 per cent.
The direct employment contribution of the shipping industry is 287,000 in the counter-factual
scenario, 51 per cent lower than in reality. Including indirect and induced effects, it is estimated that
the total employment contribution of the EU shipping industry in 2012 would have been around 1.1
million, compared to 2.3 million in reality.
Figure 4.4: The total economic impact of the EU shipping industry, 2012
0
500,000
1,000,000
1,500,000
2,000,000
2,500,000
0
20,000
40,000
60,000
80,000
100,000
120,000
140,000
160,000
GVA GVA(counter-factual)
Employment Employment(counter-factual)
InducedIndirectDirect
GVA, €m Employment
Source: Oxford Economics

The economic value of the EU shipping industry April 2014
53
5 The contribution of maritime academies
Key points
The skills and experience of seafarers are vital to the smooth functioning of the shipping
industry, and are also highly valued by firms in the wider maritime cluster and beyond.
Indicative estimates suggest there were almost 38,000 students/cadets in maritime academy
–type training across the EU and Norway in 2012, an 11 per cent increase from 2004.
5.1 The economic importance of trained seafarers
It is essential that seafarers are properly trained and have a thorough understanding of the
intricacies and complexities of working in a maritime setting. This is important in terms of safety,
efficiency and ensuring the maritime environment is protected. Ultimately, it is the professionalism
of seafarers that ensures the smooth running of the shipping industry and, in turn, global maritime
trade.
The training of seafarers also brings benefits away from ships and ports. Their skills are highly
valued by firms in the wider cluster of maritime-related industries across Europe, as outlined in a
2009 study by the Copenhagen Center of Shipping Economics and Innovation27
. An earlier survey
by Gardner et al.28
in the UK showed that for around 16,000 jobs it was preferred to hire a former
seafarer and considered essential for half of these positions.
More broadly, seafarers enjoy a genuinely international career and in an increasingly globalised
world such experience is highly valued beyond maritime-related companies.
5.2 The number of students/cadets in training in the EU
Given the benefits trained seafarers bring to the shipping industry and wider economy, national
governments have made provisions to encourage greater investment in maritime education. Aid
with the training of seafarers is also covered by the 2004 Community guidelines on state aid to
maritime transport.
This section analyses the contribution of maritime academies over the last decade. This task is
complicated by the lack of a single consistent dataset for the number of seafarers trained in each
European country. Nonetheless, it has been possible to develop an estimate of the total number of
students/cadets in maritime academy-type training across the EU and Norway.
Information for some countries has been provided by ECSA members, and this has been
complemented with data from previous research in this area. This information has been used to
generate an indicative estimate of the number of students/cadets in other countries, using
information on the average ratio of students/cadets to people employed in freight and passenger
27 Sorn-Friese, H and Iversen, M (2009) Evermore, the Times They Are A-Changin’: Expounding the Challenge of Offshoring in the International Shipping Industry, Mercator Media Forum, December 2009, pp. 143-147
28 Gardner, BM, Marlow, PB, Naim, MM, Nair, RV and Pettit, SJ (2003), The UK economy's requirements for people with experience of working at sea 2003, Department for Transport

The economic value of the EU shipping industry April 2014
54
water transport29
. The analysis suggests there were approximately 38,000 students/cadets in 2012,
a 11 per cent increase in over the estimate for 2004 (Figure 5.2).
Figure 5.2: Indicative estimates of the total number of students/cadets in maritime academy
–type training across the EU, 2004 to 2012
29 Based on Eurostat official statistics
25,000
27,000
29,000
31,000
33,000
35,000
37,000
39,000
2004 2005 2006 2007 2008 2009 2010 2011 2012
Source: Oxford Economics

The economic value of the EU shipping industry April 2014
55
5.3 Analysis of maritime students and cadets by country
This section sets out summary data for individual countries. As discussed above, there is little
consistency of data definitions between countries, hindering comparison between countries on a
like-for-like basis. Nonetheless, this analysis is informative in highlighting recent trends within
specific countries.
Belgium
Since the introduction of a tonnage tax regime in
2002 (adapted in 2004), Belgium has seen a
significant increase in the size of its flagged and
controlled fleets. This growth has been reflected in
a substantial increase in the number of students
registered at the Antwerp Maritime Academy.
Looking at the entire period for which figures are
available, the number of students registered at the
Antwerp Maritime Academy expanded from 251 in
1999/00 to 657 in 2013/14, an increase of 162 per
cent.
Number of students registered at
Antwerp Maritime Academy
Denmark
In 2005, just under 1,000 people graduated from
maritime training programmes in Denmark. This
figure declined slightly in subsequent years, before
increasing to 1,100 in 2009. The number of
students entering programmes also increased
noticeably in 2009 and 2010.
The increased intake in the latter years’ data may
reflect the impact of the “World Careers” publicity
campaign launched by the Danish Shipowners’
Association in 2008.
Number of graduates and entrants in
Danish maritime training programmes
France
Education and training courses for seafarers are
provided by the lycées professionnels maritimes
(ratings) and the Ecole Nationale Supérieure
Maritime (officers; previously called Ecoles
Nationales de la Marine Marchande).
The total number of trainees remained relatively
stable between 2001/02 and 2008/09, but has
picked up since then. In 2011/12 there were 1,200
students at lycées professionnels maritimes and
1,100 at the Ecole Nationale Supérieure Maritime.
Trainees in French national schools of
the merchant navy
0
100
200
300
400
500
600
700
Source: Antwerp Maritime Academy
0
200
400
600
800
1,000
1,200
1,400
1,600
1,800
2,000
2005 2006 2007 2008 2009 2010
Intake of students to maritime training programmes
Graduates from maritime training programmes
Source: Danish Maritime Authority
N/a
0
500
1,000
1,500
2,000
2,500
Lycées professionnels maritimes* ENMM/ENSM
Source: Armateurs de France *Only includes trainees on courses directly related to merchant marine activities

The economic value of the EU shipping industry April 2014
56
Germany30
The number of students/cadets in maritime
academies has gradually decreased from 3,200 in
2009, to 2,800 in 2012.
Across this period, just under 60 per cent of
students/cadets were undertaking nautical watch
officer training. The proportion undertaking rating
level training fell from 26 per cent in 2009 to 21 per
cent in 2012. In contrast, the proportion
undertaking technical watch officer training
increased from 17 per cent in 2009 to 23 per cent
in 2012, reflecting efforts by the German
Shipowners’ Association to promote this type of
training to young people.
Total number of students/cadets in
German maritime academies
Greece
The number of trainees in Greek national merchant
marine academies fluctuates year to year, but
between 2008-09 and 2013-14 there have been an
average of around 1,260 trainees per year. This
average is dragged down by an unusually low
number of trainees in 2010-11. In the current,
2013/14, academic year there are almost 1,400
trainees at merchant marine academies in Greece.
Trainees in Greek national merchant
marine academies
Italy
In 2005, the introduction of tonnage tax imposed a
requirement to train at least one cadet on board
each ship on the International Italian Register that
adopts the tax regime. This condition helped to
increase the number of cadets by 79 per cent
between 2005 and 2013.
To date there is no sign that the trend is levelling
off: in 2013 there were just over 2,500 cadets in
training, the highest number on record.
Number of cadets training in Italy
30 Oxford Economics has been advised by the German Shipowners’ Association that maritime training within Germany is
difficult to accurately estimate, due to its flexible and complicated nature. As such, the above figures should be treated as indicative estimates.
0
200
400
600
800
1,000
1,200
1,400
1,600
2008/09 2009/10 2010/11 2011/12 2012/13 2013/14Source: Union of Greek Shipowners
0
500
1,000
1,500
2,000
2,500
3,000
2005 2006 2007 2008 2009 2010 2011 2012 2013
Source: Accademia Italiana della Marina Mercantile of Genoa, ITS Giovanni Caboto of Gaeta and Nautical Technical Institutes

The economic value of the EU shipping industry April 2014
57
Netherlands
In 2007 there were just over 2,000 students at
Dutch maritime academies. This had increased to
over 2,500 by 2012. This increase was primarily
driven by a 48 per cent increase in higher
education students; vocational students increased
by just 12 per cent.
In 2012, around 490 trainees were serving on
board ships through on board traineeships taking
place in the 3rd
and 4th year of study. The number
of trainees on board ships in 2012 was down
slightly from 530 in 2007.
Students at Dutch maritime academies
Norway
The number of students in maritime education in
Norway declined from 1,240 in 2003 to 1,060 in
2006. However, in 2007 the Norwegian Maritime
Forum launched a recruitment campaign to
highlight maritime sector opportunities to young
people. Since then, the total number of students
has increased by 42 per cent to reach 1,500 in
2013.
In the most recent year, 55 per cent of all maritime
students were at high school, 33 per cent studied
at technical college, and 12 per cent were at
university.
Students in maritime education in
Norway
Poland
Poland produces the largest number of maritime
academy graduates amongst EU countries. The
annual number of graduates is too great to be
absorbed by the Polish fleet, and many go on to
work on ships owned by or flagged in other EU
countries.
Although there was some year-to-year fluctuation,
the total number of maritime students in Poland
remained reasonably stable between 2006/07 and
2010/11 at around 10,000.
Students at maritime academies in
Poland
0
500
1,000
1,500
2,000
2,500
3,000
2007 2008 2009 2010 2011 2012
Higher Education Vocational Education
Source: Royal Association of Netherlands Shipowners
0
200
400
600
800
1000
1200
1400
1600
2002 2003 2004 2005 2006 2007 2008 2009 2010 2011 2012 2013
High school* Technical college University
Source: Maritime Opplæringskontor *High school figures are for the academic year starting in the calendar year indicated
6,000
7,000
8,000
9,000
10,000
11,000
2006/07 2007/08 2008/09 2009/10 2010/11
Source: Polish Statistcal Yearbook of Martime Economy

The economic value of the EU shipping industry April 2014
58
UK
In the UK there is a direct link between
membership of the tonnage tax regime and
training. This imposes a minimum requirement that
a shipping company must recruit and train one new
cadet each year for every 15 officer posts in the
tonnage tax fleet, and the cadet must ordinarily
reside in the UK.
The number of officer cadets in training has risen
strongly from 780 in 1999 to almost 2,200 in 2012.
Officer cadets in training in the UK
0
500
1,000
1,500
2,000
2,500
1999 2000 2001 2002 2003 2004 2005 2006 2007 2008 2009 2010 2011 2012Source: Department for Transport Statistics

The economic value of the EU shipping industry April 2014
59
Annex A: An overview of input-output tables
An input-output model gives a snapshot of an economy at any point in time. The model shows the
major spending flows from “final demand” (i.e. consumer spending, government spending
investment and exports to the rest of the world); intermediate spending patterns (i.e. what each
sector buys from every other sector – the supply chain in other words); how much of that spending
stays within the economy; and the distribution of income between employment incomes and other
income (mainly profits). In essence an input-output model is a table which shows who buys what
from whom in the economy.
Figure A1: A simple input-output model
Traditionally input-output tables are produced on a national basis, with the linkages recorded for a
single economy only. However, the World Input-Output Database, funded by the European
Commission, has developed a series of global input-output tables that reflect the linkages between
economies, as well as within them. Consequently, such tables enable supply chains to be tracked
across multiple countries. For example, a Dutch shipping company may purchase a vessel from
Germany, which in turn uses steel from Spain, the supplier of which uses an IT provider based in
France. Under a tradtitional input-output table the purchase of a vessel from Germany would be a
‘leakage’ and be removed from the model. As a consequence, the economic activity created in
Germany, Spain and France would not be captured. The World Input-Output Database’s global
input-output table captures all of these transactions, and consequently provides a greater degree of
coverage and accuracy in an impact assessment.
This study has used the Oxford Economics’ Global Input-Output model, which is based on the
World Input-Output Database global input-output table. Norway and Croatia are not covered by the
World Input-Output Database as standard, but Oxford Economics has undertaken bespoke
modelling to incorporate them into its model, based on national input-ouput tables and trade data.
The economic value of the EU shipping industry April 2014
60
Input-output tables can be used to generate industry multipliers by using the Leontief system.31
Under the Leontief system, industry multipliers are achieved through a series of manipulations of
the input-output matrix. The first of these manipulations is the creation of a new base coefficients
matrix (A matrix) for global economy. The second manipulation is the creation of an identity matrix
(I matrix), within which all values are zero except for when the consuming industry (columns) and
the producing industry (rows) are the same; these cells are given a value of 1. The third stage of
the manipulation is the subtraction of the A matrix from the I matrix. The final stage is the inversion
of the matrix produced in the third stage. The result of these manipulations is a matrix in which the
values represent the individual cross-multipliers for each industry, showing the impact on each
producing industry (row) of an increase in 1 unit of output in a consuming industry (column). The
total multiplier for each consuming industry is the sum of the multipliers in the relevant column.
31 Leontief, W. (1986). Input-output economics (2nd ed.). New York: Oxford University Press
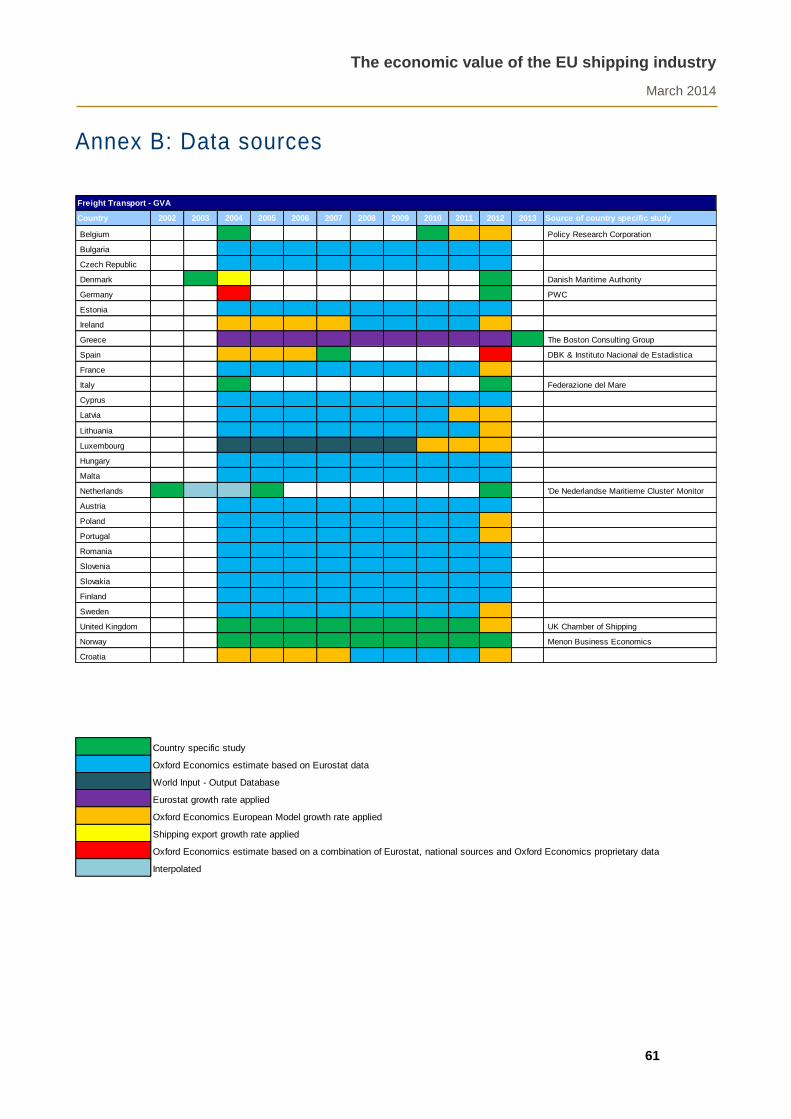
The economic value of the EU shipping industry
March 2014
61
Annex B: Data sources
Freight Transport - GVA
Country 2002 2003 2004 2005 2006 2007 2008 2009 2010 2011 2012 2013 Source of country specific study
Belgium Policy Research Corporation
Bulgaria
Czech Republic
Denmark Danish Maritime Authority
Germany PWC
Estonia
Ireland
Greece The Boston Consulting Group
Spain DBK & Instituto Nacional de Estadistica
France
Italy Federazione del Mare
Cyprus
Latvia
Lithuania
Luxembourg
Hungary
Malta
Netherlands 'De Nederlandse Maritieme Cluster' Monitor
Austria
Poland
Portugal
Romania
Slovenia
Slovakia
Finland
Sweden
United Kingdom UK Chamber of Shipping
Norway Menon Business Economics
Croatia
Country specific study
Oxford Economics estimate based on Eurostat data
World Input - Output Database
Eurostat growth rate applied
Oxford Economics European Model growth rate applied
Shipping export growth rate applied
Oxford Economics estimate based on a combination of Eurostat, national sources and Oxford Economics proprietary data
Interpolated
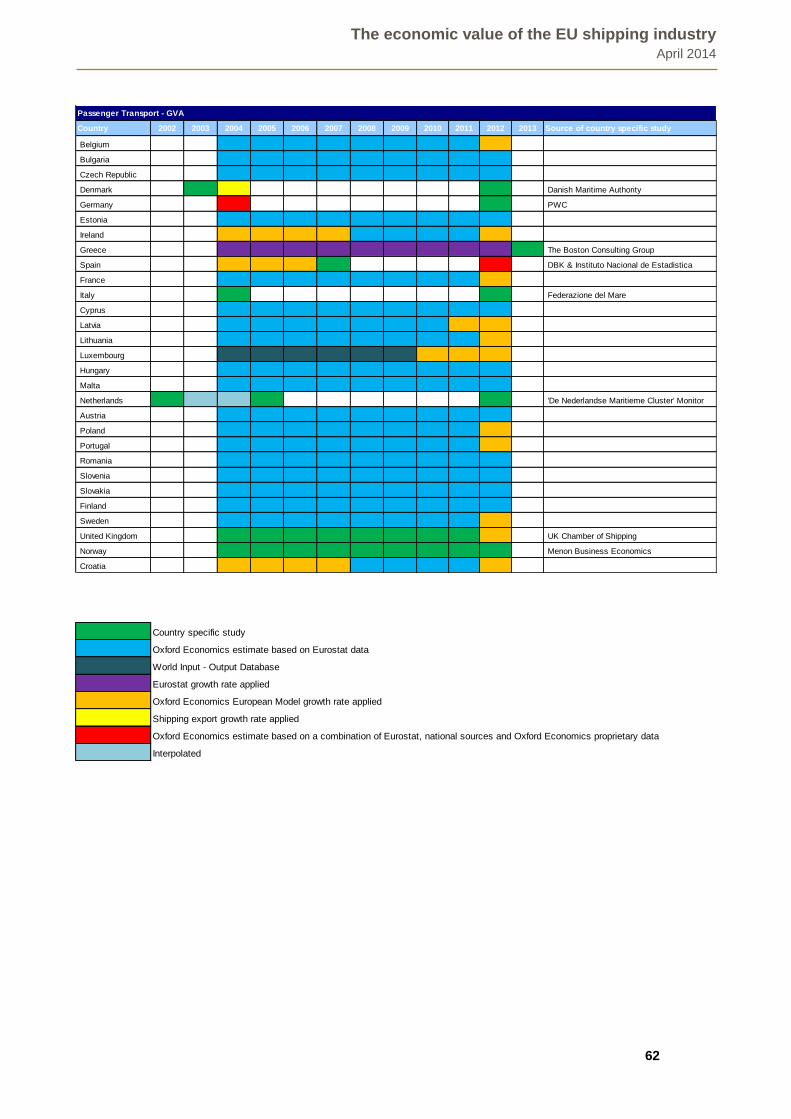
The economic value of the EU shipping industry April 2014
62
Country specific study
Oxford Economics estimate based on Eurostat data
World Input - Output Database
Eurostat growth rate applied
Oxford Economics European Model growth rate applied
Shipping export growth rate applied
Oxford Economics estimate based on a combination of Eurostat, national sources and Oxford Economics proprietary data
Interpolated
Passenger Transport - GVA
Country 2002 2003 2004 2005 2006 2007 2008 2009 2010 2011 2012 2013 Source of country specific study
Belgium
Bulgaria
Czech Republic
Denmark Danish Maritime Authority
Germany PWC
Estonia
Ireland
Greece The Boston Consulting Group
Spain DBK & Instituto Nacional de Estadistica
France
Italy Federazione del Mare
Cyprus
Latvia
Lithuania
Luxembourg
Hungary
Malta
Netherlands 'De Nederlandse Maritieme Cluster' Monitor
Austria
Poland
Portugal
Romania
Slovenia
Slovakia
Finland
Sweden
United Kingdom UK Chamber of Shipping
Norway Menon Business Economics
Croatia

The economic value of the EU shipping industry April 2014
63
Country specific study
Oxford Economics European Model growth rate applied
Oxford Economics estimate based on a combination of Eurostat, national sources and Oxford Economics proprietary data
Interpolated
Towage and Dredging - GVA
Country 2002 2003 2004 2005 2006 2007 2008 2009 2010 2011 2012 2013 Source of country specific study
Belgium Policy Research Corporation
Bulgaria
Czech Republic
Denmark Danish Maritime Authority
Germany
Estonia
Ireland
Greece
Spain Spanish Shipowners' Association
France Armateurs de France
Italy Federazione del Mare
Cyprus
Latvia
Lithuania
Luxembourg
Hungary
Malta
Netherlands 'De Nederlandse Maritieme Cluster' Monitor
Austria
Poland
Portugal Associação de Armadores da Marinha de Comércio
Romania
Slovenia
Slovakia
Finland
Sweden
United Kingdom UK Chamber of Shipping
Norway Menon Business Economics
Croatia

The economic value of the EU shipping industry April 2014
64
Offshore Support Vessels - GVA
Country 2002 2003 2004 2005 2006 2007 2008 2009 2010 2011 2012 2013 Source of country specific study
Belgium
Bulgaria
Czech Republic
Denmark Danish Maritime Authority
Germany
Estonia
Ireland
Greece
Spain
France Armateurs de France
Italy Federazione del Mare
Cyprus
Latvia
Lithuania
Luxembourg
Hungary
Malta
Netherlands 'De Nederlandse Maritieme Cluster' Monitor
Austria
Poland
Portugal Associação de Armadores da Marinha de Comércio
Romania
Slovenia
Slovakia
Finland
Sweden
United Kingdom UK Chamber of Shipping
Norway Menon Business Economics
Croatia
Country specific study
Oxford Economics European Model growth rate applied
Oxford Economics estimate based on a combination of Eurostat, national sources and Oxford Economics proprietary data
Interpolated

The economic value of the EU shipping industry April 2014
65
Renting and Leasing of Water Transport Equipment - GVA
Country 2002 2003 2004 2005 2006 2007 2008 2009 2010 2011 2012 2013 Source of country specific study
Belgium
Bulgaria
Czech Republic
Denmark
Germany
Estonia
Ireland
Greece
Spain
France
Italy
Cyprus
Latvia
Lithuania
Luxembourg
Hungary
Malta
Netherlands
Austria
Poland
Portugal
Romania
Slovenia
Slovakia
Finland
Sweden
United Kingdom
Norway
Croatia
Oxford Economics estimate based on Eurostat data
Oxford Economics European Model growth rate applied

The economic value of the EU shipping industry April 2014
66
Freight Transport - Employment
Country 2002 2003 2004 2005 2006 2007 2008 2009 2010 2011 2012 2013 Source of country specific study
Belgium Policy Research Corporation
Bulgaria
Czech Republic
Denmark Danish Maritime Authority
Germany PWC & German Shipowners‘ Association
Estonia
Ireland
Greece The Boston Consulting Group
Spain Spanish Shipowners' Association
France
Italy Federazione del Mare
Cyprus
Latvia
Lithuania
Luxembourg
Hungary
Malta
Netherlands 'De Nederlandse Maritieme Cluster' Monitor
Austria
Poland
Portugal
Romania
Slovenia
Slovakia
Finland
Sweden
United Kingdom UK Chamber of Shipping
Norway Norwegian Ship owners' Association
Croatia
Country specific study
Oxford Economics estimate based on Eurostat data
Eurostat growth rate applied
Oxford Economics European Model growth rate applied
Estimated using productivity assumptions from the World Input Output Database
Oxford Economics estimate based on a combination of Eurostat, national sources and Oxford Economics proprietary data
Interpolated

The economic value of the EU shipping industry April 2014
67
Country specific study
Oxford Economics estimate based on Eurostat data
Eurostat growth rate applied
Oxford Economics European Model growth rate applied
Estimated using productivity assumptions from the World Input Output Database
Oxford Economics estimate based on a combination of Eurostat, national sources and Oxford Economics proprietary data
Interpolated
Passenger Transport - Employment
Country 2002 2003 2004 2005 2006 2007 2008 2009 2010 2011 2012 2013 Source of country specific study
Belgium
Bulgaria
Czech Republic
Denmark Danish Maritime Authority
Germany PWC & German Shipowners‘ Association
Estonia
Ireland
Greece The Boston Consulting Group
Spain Spanish Shipowners' Association
France
Italy Federazione del Mare
Cyprus
Latvia
Lithuania
Luxembourg
Hungary
Malta
Netherlands 'De Nederlandse Maritieme Cluster' Monitor
Austria
Poland
Portugal
Romania
Slovenia
Slovakia
Finland
Sweden
United Kingdom UK Chamber of Shipping
Norway Norwegian Ship owners' Association
Croatia
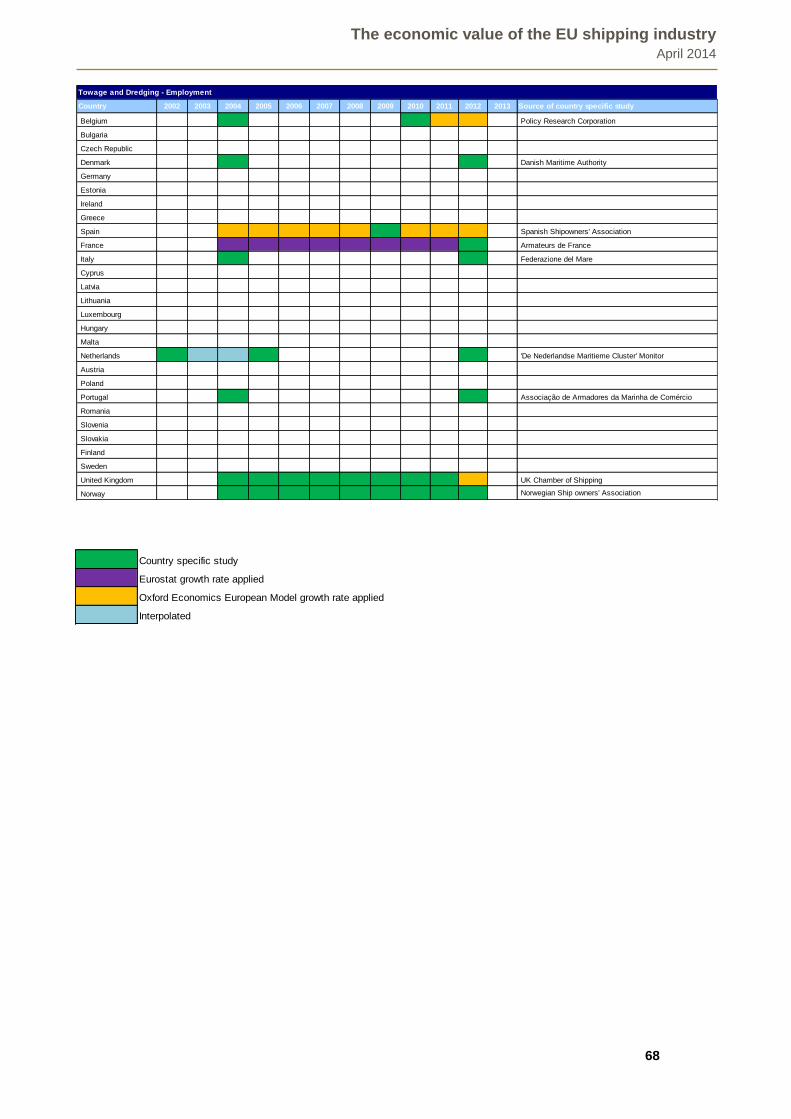
The economic value of the EU shipping industry April 2014
68
Towage and Dredging - Employment
Country 2002 2003 2004 2005 2006 2007 2008 2009 2010 2011 2012 2013 Source of country specific study
Belgium Policy Research Corporation
Bulgaria
Czech Republic
Denmark Danish Maritime Authority
Germany
Estonia
Ireland
Greece
Spain Spanish Shipowners' Association
France Armateurs de France
Italy Federazione del Mare
Cyprus
Latvia
Lithuania
Luxembourg
Hungary
Malta
Netherlands 'De Nederlandse Maritieme Cluster' Monitor
Austria
Poland
Portugal Associação de Armadores da Marinha de Comércio
Romania
Slovenia
Slovakia
Finland
Sweden
United Kingdom UK Chamber of Shipping
Norway Norwegian Ship owners' Association
Country specific study
Eurostat growth rate applied
Oxford Economics European Model growth rate applied
Interpolated

The economic value of the EU shipping industry April 2014
69
Offshore Support Vessels - Employment
Country 2002 2003 2004 2005 2006 2007 2008 2009 2010 2011 2012 2013 Source of country specific study
Belgium
Bulgaria
Czech Republic
Denmark Danish Maritime Authority
Germany
Estonia
Ireland
Greece
Spain
France Armateurs de France
Italy Federazione del Mare
Cyprus
Latvia
Lithuania
Luxembourg
Hungary
Malta
Netherlands 'De Nederlandse Maritieme Cluster' Monitor
Austria
Poland
Portugal Associação de Armadores da Marinha de Comércio
Romania
Slovenia
Slovakia
Finland
Sweden
United Kingdom UK Chamber of Shipping
Norway Menon Business Economics
Croatia
Country specific study
Eurostat growth rate applied
Oxford Economics European Model growth rate applied
Interpolated

The economic value of the EU shipping industry April 2014
70
Renting and Leasing of Water Transport Equipment - Employment
Country 2002 2003 2004 2005 2006 2007 2008 2009 2010 2011 2012 2013 Source of country specific study
Belgium
Bulgaria
Czech Republic
Denmark
Germany
Estonia
Ireland
Greece
Spain
France
Italy
Cyprus
Latvia
Lithuania
Luxembourg
Hungary
Malta
Netherlands
Austria
Poland
Portugal
Romania
Slovenia
Slovakia
Finland
Sweden
United Kingdom
Norway
Croatia
Oxford Economics estimate based on Eurostat data
Oxford Economics European Model growth rate applied

The economic value of the EU shipping industry
March 2014
OXFORD
Abbey House, 121 St Aldates
Oxford, OX1 1hb, UK
Tel: +44 1865 268900
LONDON
Broadwall House, 21 Broadwall
London, SE1 9PL, UK
Tel: +44 207 803 1400
BELFAST
Lagan House, Sackville Street
Lisburn, BT27 4AB, UK
Tel: +44 28 9266 0669
NEW YORK
817 Broadway, 10th Floor
New York, NY 10003, USA
Tel: +1 646 786 1863
PHILADELPHIA
303 Lancaster Avenue, Suite 1b
Wayne PA 19087, USA
Tel: +1 610 995 9600
SINGAPORE
No.1 North Bridge Road
High Street Centre #22-07
Singapore 179094
Tel: +65 6338 1235
PARIS
9 rue Huysmans
75006 Paris, France
Tel: + 33 6 79 900 846
Email: [email protected]
www.oxfordeconomics.com