The economic value of informal care in - Carers...
68
The economic value of informal care in 2010 12 October 2010 Report by Access Economics Pty Limited for Carers Australia
Transcript of The economic value of informal care in - Carers...
The economic value of informal care in 2010
12 October 2010
Report by Access Economics Pty Limited for
Carers Australia
© Access Economics Pty Limited and Carers Australia This work is copyright. The Copyright Act 1968 permits fair dealing for study, research, news reporting, criticism or review. Selected passages, tables or diagrams may be reproduced for such purposes provided acknowledgment of the source is included. Permission for any more extensive reproduction must be obtained from Access Economics Pty Limited through the contact officer listed for this report. Disclaimer
While every effort has been made to ensure the accuracy of this document and any attachments, the uncertain nature of economic data, forecasting and analysis means that Access Economics Pty Limited is unable to make any warranties in relation to the information contained herein. Access Economics Pty Limited, its employees and agents disclaim liability for any loss or damage which may arise as a consequence of any person relying on the information contained in this document and any attachments. Access Economics Pty Limited ABN 82 113 621 361 www.AccessEconomics.com.au CANBERRA MELBOURNE SYDNEY Level 1 9 Sydney Avenue Barton ACT 2600
Level 27 150 Lonsdale Street Melbourne VIC 3000
Suite 1401, Level 14 68 Pitt Street Sydney NSW 2000
T: +61 2 6175 2000 F: +61 2 6175 2001
T: +61 3 9659 8300 F: +61 3 9659 8301
T: +61 2 9376 2500 F: +61 2 9376 2501
Suggested citation: Access Economics (2010) The economic value of informal care in 2010, Report for Carers Australia, October.
For information on this report please contact Lynne Pezzullo T: 02 9376 2500 E: [email protected] Report prepared by Lynne Pezzullo Rebecca McKibbin Simone Cheung Henry Cutler
2 Commercial‐in‐Confidence
The economic value of informal care in 2010
Foreword
In 2005 Carers Australia commissioned Access Economics to undertake the first Australian study of the economic value of the informal care provided by unpaid family carers for people with disability, mental illness, chronic conditions, terminal illness and the frail aged. That report found that, five years ago, the annual ‘replacement value’ of informal care had passed the $30 billion mark.
Five years on, this report shows that – using the same method – the value of informal care has increased to exceed $40 billion per annum in 2010, 33% higher than in 2005.
The growth in the value of informal care derives largely from demographic ageing – which is increasing the number of Australians who require and receive care – together with growth in the replacement cost of care from $25 per hour on average in 2005 to $31 per hour today.
Even using the most conservative ‘opportunity cost’ method, the value of informal carer is around $6.5 billion per annum. This is about the same value as all high‐end residential aged care paid for by the Australian Government (0.5% GDP).
Informal carers provide 1.32 billion hours of care each year, and represent a precious economic resource in an age of growing health and aged care workforce shortage.
The valuable contribution of Australia’s 2.9 million carers, which enables their loved ones to remain at home, comes at a health cost to carers themselves. The case study in this report illustrates the extent of the burden of caring‐related conditions such as depression, stress‐related illness, sleep deprivation and musculoskeletal problems.
Young carers also make enormous sacrifices, giving up what can be millions of dollars of lifetime earnings in order to provide the care that their parents need.
Yet informal family care remains one of the lowest subsidised forms of care, and family carers remain under‐resourced in terms of education and information compared to paid care workers. Greater investment in training for informal carers could generate savings that are many times the value of the investment, as literature reviewed in this report shows.
Without some serious policy thinking, it will be challenging to address the emerging care shortfalls projected for the coming decade, as demand increasingly outstrips supply.
Carers Australia advocates strongly to enact the recommendations of this report to prioritise support for family carers that can prevent or delay institutionalisation – respite, income support, training and preventive health care.
I commend the report to you.
Tim Moore President, Carers Australia
Commercial‐in‐Confidence
Contents
Glossary i
Executive Summary .........................................................................................................................i
1 Who are Australia’s informal carers? ................................................................................. 7 1.1 Demographic profile of carers ............................................................................................... 7 1.2 Care needs ........................................................................................................................... 12
2 Valuing carers’ time .......................................................................................................... 15 2.1 Opportunity cost .................................................................................................................. 15 2.2 Replacement valuation ........................................................................................................ 18 2.3 Comparisons ........................................................................................................................ 21
3 Other effects of informal care .......................................................................................... 23 3.1 Income support payments for carers................................................................................... 23 3.2 Forgone taxation and efficiency costs ................................................................................. 26 3.3 Health and wellbeing impacts on carers.............................................................................. 27 3.4 Young carers ........................................................................................................................ 30
4 Who bears the cost of care? ............................................................................................. 35 4.1 Support programs for carers................................................................................................ 35 4.2 Education and training......................................................................................................... 36 4.3 Comparison of different care models .................................................................................. 43
5 Conclusions and implications for the future..................................................................... 47 5.1 Informal care demand and supply ....................................................................................... 47 5.2 Challenges and opportunities .............................................................................................. 52
References................................................................................................................................... 55
Charts
Chart 1.1 : Number of informal carers by age and gender, Australia ........................................... 8
Chart 1.2 : Primary carers by age and gender, Australia............................................................... 8
Chart 1.3 : Rate of informal care provision by age and gender, Australia .................................... 9
Chart 1.4 : Geographic location of carers, Australia ................................................................... 10
Chart 1.5 : Gross income distribution by carer status, Australia ................................................ 10
Chart 1.6 : Number of carers, by type of carer, Australia 2010 .................................................. 12
Chart 1.7 : Primary carers – relationship to main recipient of care............................................ 13
Chart 1.8 : Weekly hours of care, primary carers, main care recipient’s disability status.......... 14
Chart 1.9 : Co‐resident primary carers, main disability of the main recipient of care................ 14
Chart 2.1 : Age and gender standardised employment rates by carer status, Australia ............ 16
Chart 2.2 : Value of informal care, Australia, selected studies, constant 2010 dollars .............. 22
Chart 4.1 : Average cost of care models per recipient, Australia, 2010 ..................................... 45
Commercial‐in‐Confidence
The economic value of informal care in 2010
Chart 4.2 : Average cost of combined care packages per primary care recipient, 2010 ............ 46
Chart 5.1 : Ratio of females 50 to 64 years of age to persons aged 80 years and over.............. 48
Chart 5.2 : Projected demand and supply of informal carers .................................................... 49
Chart 5.3 : Scenario analysis of projected demand and supply of informal carers .................... 51
Chart 5.4 : Projected Australian Government aged care spending............................................. 53
Tables
Table 1.1 : Proportion of people providing care in Australia ...................................................... 11
Table 1.2 : Estimated informal carers by age, gender and type, Australia, 2010 ....................... 12
Table 1.3 : Source of assistance by level of disability ................................................................. 13
Table 2.1 : Unemployment and participation rates by carer status, Australia 2003 .................. 16
Table 2.2 : Age and gender standardised employment rates by carer status, Australia ............ 17
Table 2.3 : Opportunity cost of informal care, primary and non‐primary, Australia, 2010........ 18
Table 2.4 : Average hours of care provided per week by carer status........................................ 19
Table 2.5 : Replacement valuation of informal care, unit cost components .............................. 19
Table 2.6 : Replacement cost of informal care, Australia 2010 .................................................. 20
Table 2.7 : Relative value of informal care.................................................................................. 22
Table 3.1 : Carer Payment and Allowance, rates, March 2010................................................... 24
Table 3.2 : Carer Payment and Allowance, payments, 2008‐09 to 2010‐11 ($m) ...................... 25
Table 3.3 : Recipients of income support for carers, 2008‐09 .................................................... 25
Table 3.4 : Total cost of income support to carers, Australia, 2010 ........................................... 26
Table 3.5 : Efficiency cost from additional taxation.................................................................... 27
Table 4.1 : Subsidies for education of paid carers, 2010 ............................................................ 39
Table 4.2 : Input data for cost benefit analysis of a carer education and training interventions40
Table 4.3 : Average cost per recipient of different care streams, Australia 2010 ...................... 44
Commercial‐in‐Confidence

The economic value of informal care in 2010
Glossary
ABS Australian Bureau of Statistics
ADAT Adult Disability Assessment Tool
AIHW Australian Institute for Health and Welfare
CACP Community Aged Care Packages (Federal program)
CDAP Child Disability Assistance Payment
CPI Consumer Price Index
CSTDA Commonwealth State/Territory Disability Agreement
EACH Extended Aged Care in the Home (Federal program)
EACH‐D Extended Aged Care in the Home Dementia (Federal program)
FaHCSIA Family and Housing, Community Services and Indigenous Affairs (Australian Government Department of)
GDP gross domestic product
GP general practitioner
HACC Home and Community Care (Federal program)
NATSEM National Centre for Social and Economic Modelling, University of Canberra
RAC residential aged care
REACH Resources for Enhancing Alzheimer’s Caregiver Health
SDAC Survey of Disability, Ageing and Carers (ABS)
UK United Kingdom
Commercial‐in‐Confidence

The economic value of informal care in 2010
Executive Summary
Carers provide informal care1 to people who need assistance due to disability, mental illness, chronic conditions, terminal illness or due to being frail aged. In this report, Access Economics examines the amount of informal care being provided in Australia today. Placing a dollar value on the work of informal carers is the first step in evaluating whether the current use of informal and formal care models is socially optimal, in terms of both efficiency and equity.
Section 1 identifies who are Australia’s carers, providing a profile of carers and the care needs of the people they care for.
In 2010, over 1 in 8 Australians (2.87 million people) are estimated to be providing informal care. This represents 13.1% of Australia’s population, a higher share than in 2003.
■ 540,000 (1 in 40 Australians) are ‘primary carers’, providing the majority of the recipient’s care.
■ In absolute terms, there are around 310,000 more carers in 2010 compared to 2003, and 65,400 more primary carers. The number of carers, and primary carers, is increasing at some 2% per annum (around the same rate as population growth)
Informal carers together provide an estimated 1.32 billion hours of care in 2010.
■ This is equivalent to each carer providing an average of 460 hours of care per year or 9 weehours per k.
However, care hours are in fact much more unevenly distributed, with primary carers ■ providing 54% or 714 million hours annually, despite representing only 19% of all carers.
tio
■
es that are diverted each year m p i
Australian average, even when standardised from
■
be $40.9 billion (equivalent to 3.2% of GDP and 60% of other formal health
e that should be included in a full account of the costs and benefits of alternative care models.
Sec n 2 looks at two measures of how this time spent by carers could be valued.
In 2010, an estimated 129,900 carers will not be employed due to their caring responsibilities (1.1% of Australia’s workforce). The opportunity cost of time devoted to informal care, measured as reduction in paid employment due to caring, provides a ‘lower bound’ estimate of $6.5 billion (equivalent to 0.5% of GDP and 9.5% of the value of formal health care). This measure reveals the resourcfro roduction n the formal economy to informal care.
Rates of employment and labour force participation among carers are substantially lower than the differing age‐gender profiles.
The replacement valuation reveals the resources that would need to be diverted each year from the formal economy to replace the work done by informal carers, were their services no longer available. If all hours of informal care were replaced with services purchased from formal care providers and provided in the home, the replacement value would care).
Section 3 reviews, and quantifies where possible, other effects of informal car
1 ‘Informal care’ refers to care provided by unpaid family carers.
i Commercial‐in‐Confidence
The productivity losses associated with provision of informal care are borne mainly by the individuals themselves, whose wage income is reduced.
■ However, the wider community is affected through reduced personal income tax collection and the payment of income support payments to carers.
■ While the taxation and welfare payments are transfer payments not real economic costs, they have associated efficiency losses estimated to be $1.76 billion in 2010.
Also likely to be substantial, but not costed here, are the impacts of caring on the health and wellbeing of carers. Often the burden of pain and suffering associated with depression, musculoskeletal injuries and other problems dwarfs the financial costs.
■ On a relative prevalence basis, the sleep impacts of caring alone may exceed $1 billion ofper annum, including a financial estimate the reduced quality of life.
One case study model presented in this report was of a hypothecated carer, ‘Karen’, with mild‐moderate depression, stress‐related angina (a cardiovascular condition), and chronic lower back pain. The total financial impact of all three conditions is over $33,000 in 2010. Adding in the cost of the loss of Karen’s healthy life (about 27% of a healthy life year is lost to the conditions), the total impact is nearly $79,000. Karen bears 56% of the financial costs (mainly lost income but also health
■
costs over $1,000), while the Government bears 21%. Karen bears all the wellbeing loss.
unds the many difficulties faced by young carers in obtaining certain
■
n, comprising lost tax revenue of $0.5 million and a loss to Chantelle of $1.9 million.
es the level of public (Government) support for carers relative to other models of care.
ough welfare
■ ded to formal care workers,
■
ustralia to confirm these modelled findings, potentially across a variety of care settings.
Young carers, an often over‐looked group, are at high risk of long term disadvantage as result of missed education opportunities and compromised high school performance. The ’25‐hour rule’ which limits recipients of Carer Payment to a maximum of 25 hours per week of study, work and travel, compotertiary qualifications.
A case study interview with Chantelle, 21, who has cared for her mother since she was 12, shows that by being unable to undertake a medical degree, for which she gained entry, due to the ’25‐hour rule’ Chantelle will earn less than 60% of what she could have as a doctor i.e. $3.1 million as a psychologist rather than $5.45 million over a lifetime, in real 2010 dollars. The difference is $2.35 millio
Section 4 examin
Governments are increasingly recognising the contribution of family carers, and the costs they bear in providing informal care. The level of Government support, both thrsupport payments and service provision, has increased over the past few years.
However, in contrast to the education and training provithere is relatively little funded training for informal carers.
A case study based on a randomised clinical trial of an informal carer training program in the UK showed that, if the same program was delivered in Australia, benefits would exceed costs by over $19,000 per annum per person – through reducing reliance on formal health sector and community services relative to a situation of no carer training. A similar randomised controlled trial should be conducted in A
ii Commercial‐in‐Confidence
The economic value of informal care in 2010
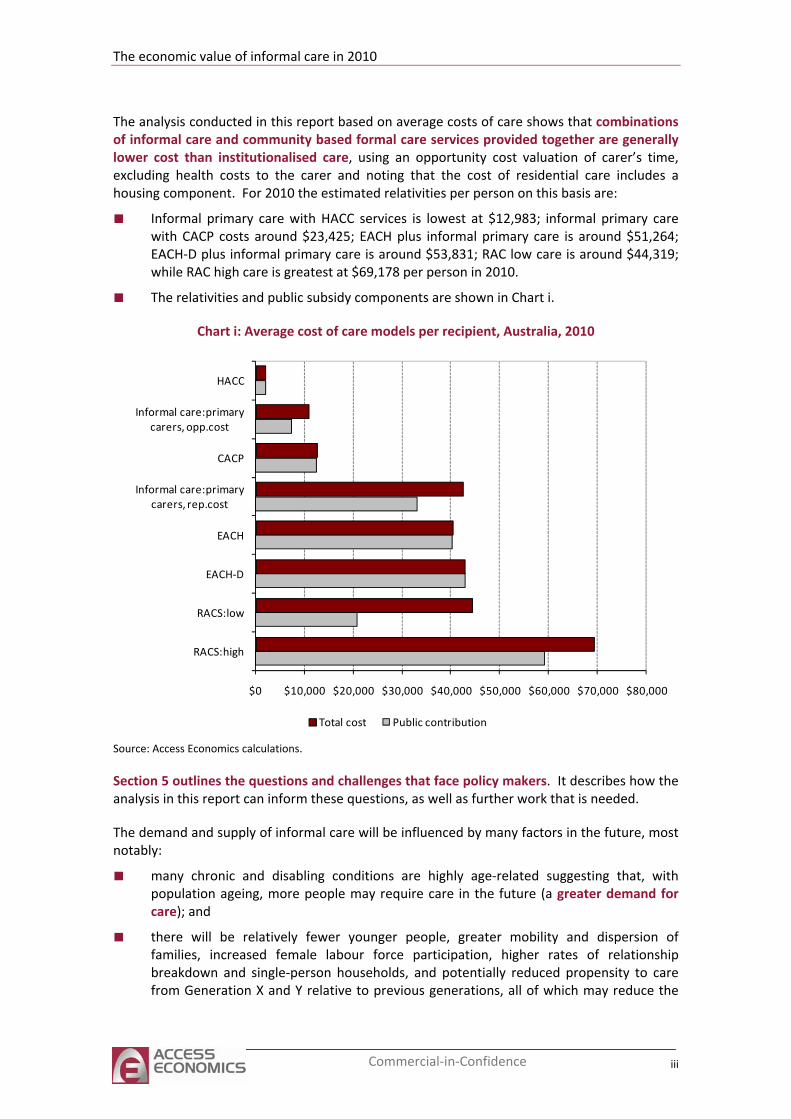
The analysis conducted in this report based on average costs of care shows that combinations of informal care and community based formal care services provided together are generally lower cost than institutionalised care, using an opportunity cost valuation of carer’s time, excluding health costs to the carer and noting that the cost of residential care includes a housing component. For 2010 the estimated relativities per person on this basis are:
■ Informal primary care with HACC services is lowest at $12,983; informal primary care with CACP costs around $23,425; EACH plus informal primary care is around $51,264; EACH‐D plus informal primary care is around $53,831; RAC low care is around $44,319; while RAC high care is greatest at $69,178 per person in 2010.
■ The relativities and public subsidy components are shown in Chart i.
Chart i: Average cost of care models per recipient, Australia, 2010
$0 $10,000 $20,000 $30,000 $40,000 $50,000 $60,000 $70,000 $80,000
RACS:high
RACS:low
EACH‐D
EACH
Informal care:primary carers, rep.cost
CACP
Informal care:primarycarers, opp.cost
HACC
Total cost Public contribution
Source: Access Economics calculations.
Section 5 outlines the questions and challenges that face policy makers. It describes how the analysis in this report can inform these questions, as well as further work that is needed.
The demand and supply of informal care will be influenced by many factors in the future, most notably:
■ many chronic and disabling conditions are highly age‐related suggesting that, with population ageing, more people may require care in the future (a greater demand for
andcare);
■ there will be relatively fewer younger people, greater mobility and dispersion of families, increased female labour force participation, higher rates of relationship breakdown and single‐person households, and potentially reduced propensity to care from Generation X and Y relative to previous generations, all of which may reduce the
iii Commercial‐in‐Confidence
desire or ability to provide informal care (a lower supply of informal care, or growth of supply lower than demand growth).
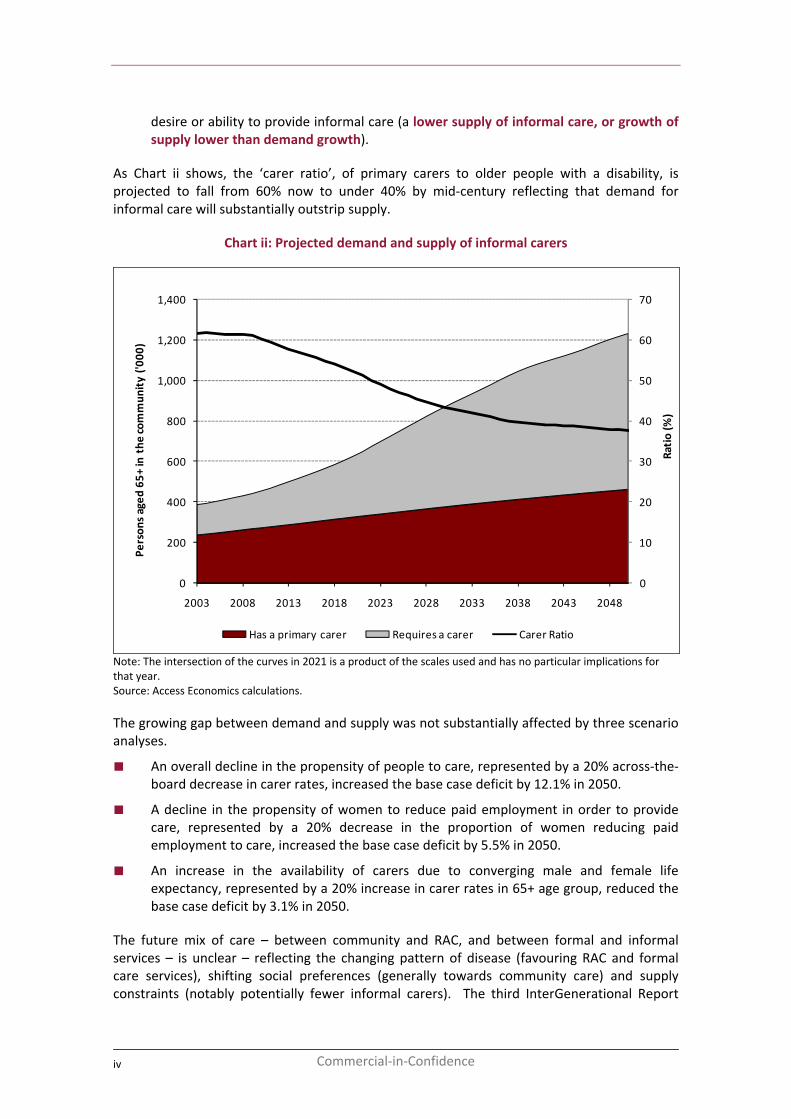
As Chart ii shows, the ‘carer ratio’, of primary carers to older people with a disability, is projected to fall from 60% now to under 40% by mid‐century reflecting that demand for informal care will substantially outstrip supply.
Chart ii: Projected demand and supply of informal carers
0
10
20
30
40
50
60
70
0
200
400
600
800
1,000
1,200
1,400
2003 2008 2013 2018 2023 2028 2033 2038 2043 2048
Ratio (%
)
Person
s aged
65+
in the
commun
ity ('0
00)
Has a primary carer Requires a carer Carer Ratio
Note: The intersection of the curves in 2021 is a product of the scales used and has no particular implications for that year. Source: Access Economics calculations.
The growing gap between demand and supply was not substantially affected by three scenario analyses.
■ An overall decline in the propensity of people to care, represented by a 20% across‐the‐board decrease in carer rates, increased the base case deficit by 12.1% in 2050.
■ A decline in the propensity of women to reduce paid employment in order to provide care, represented by a 20% decrease in the proportion of women reducing paid employment to care, increased the base case deficit by 5.5% in 2050.
■ An increase in the availability of carers due to converging male and female life expectancy, represented by a 20% increase in carer rates in 65+ age group, reduced the base case deficit by 3.1% in 2050.
The future mix of care – between community and RAC, and between formal and informal services – is unclear – reflecting the changing pattern of disease (favouring RAC and formal care services), shifting social preferences (generally towards community care) and supply constraints (notably potentially fewer informal carers). The third InterGenerational Report
iv Commercial‐in‐Confidence
The economic value of informal care in 2010
(Treasury, 2010) concluded there will be a much larger relative increase in spending on RAC than on community care, with formal care expenditure increasing from 0.8% of GDP today to 1.8% of GDP in 2049‐50.
Given that investments in informal carer support have been shown to be cost effective, there is a strong case to prioritise support for carers that can delay or prevent costly institutionalisation, including:
■ respite care;
■ income support;
■ education and training; and
preventive health care (e.g. lifting techniques,■ health checks and a personalised health record to help maintain carers’ health).
ing for the frail aged those disadvantaged by disability, mental illness or chronic illness.
ccess Economics
Such support for carers will help ensure and enhance future labour productivity across the formal and informal sectors of the economy, as well as meeting Australia’s obligations to optimise wellbe
A
v Commercial‐in‐Confidence

The economic value of informal care in 2010
1 Who are Australia’s informal carers?
Carers are people who provide care to others in need of assistance or support. Informal carers provide this service free of charge and outside the boundaries of ‘formal’ government services provision. Typically, an informal carer is a family member or friend of the person receiving care. Much informal care is provided by people living in the same household as the recipient of the care. As such, many people receive informal care from more than one person. The person who provides the majority of informal care is known as the primary carer.
Although informal care can be defined to include parenting and other forms of unpaid child care, this report focuses solely on unpaid care provided to people with a disability, mental illness, chronic condition, terminal illness and the frail aged.
The most comprehensive profile of people receiving care and their carers is provided by the Survey of Disability, Ageing and Carers (SDAC). This national survey, conducted by the Australian Bureau of Statistics (ABS), covers people living in private dwellings in urban or rural areas. However, also within its scope are people living in non‐private dwellings including care accommodation (nursing homes, hostels and other facilities). The most recent survey was conducted in 2009 but the results have not yet been published. As such this report relies on data from the 2003 survey, with those results presented first, followed by estimates for 2010.
1.1 Demographic profile of carers
There were just under 2.6 million Australians in the 2003 SDAC providing informal care to those who needed help due to disability or age (ABS, 2004b), equivalent to 12.9% of the Australian population at that time (ABS, 2004c). Chart 1.1 shows the distribution of these carers by age and gender. The majority of carers are female (54.1%), with most carers being middle‐aged (35 to 54 years) although over three quarters are of working age (18 to 64 years). There were also an estimated 169,900 minors who were carers.
Primary carers provide the majority of informal assistance to the care recipient and as such are usually living in the same household (78%). One in five informal carers or 474,600 Australians were primary carers. The age‐gender distribution of primary carers (Chart 1.2) is different from that of all carers (both primary and non‐primary). Women represent a far greater proportion of primary carers, at around 71.3% of the total.
7
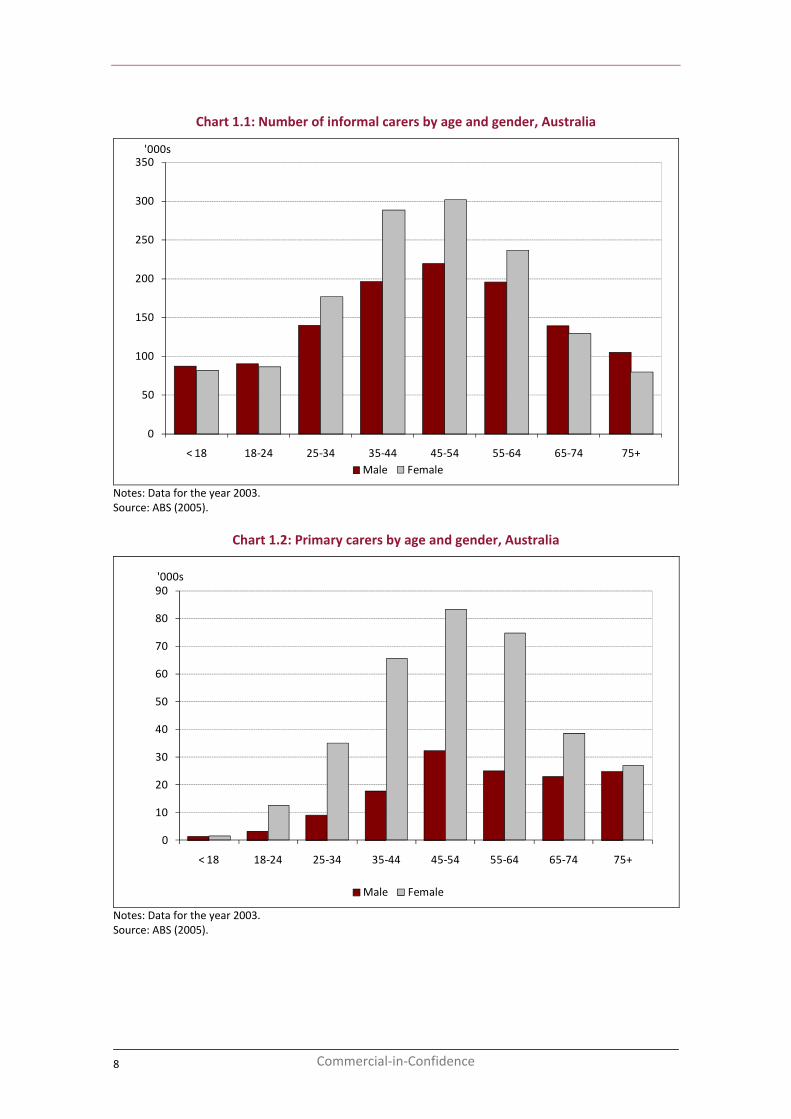
Chart 1.1: Number of informal carers by age and gender, Australia
0
50
100
150
200
250
300
350
< 18 18‐24 25‐34 35‐44 45‐54 55‐64 65‐74 75+
'000s
Male Female
Notes: Data for the year 2003. Source: ABS (2005).
Chart 1.2: Primary carers by age and gender, Australia
0
10
20
30
40
50
60
70
80
90
< 18 18‐24 25‐34 35‐44 45‐54 55‐64 65‐74 75+
'000s
Male Female
Notes: Data for the year 2003. Source: ABS (2005).
8 Commercial‐in‐Confidence
The economic value of informal care in 2010
1.1.2 Propensity to give care by demographic group
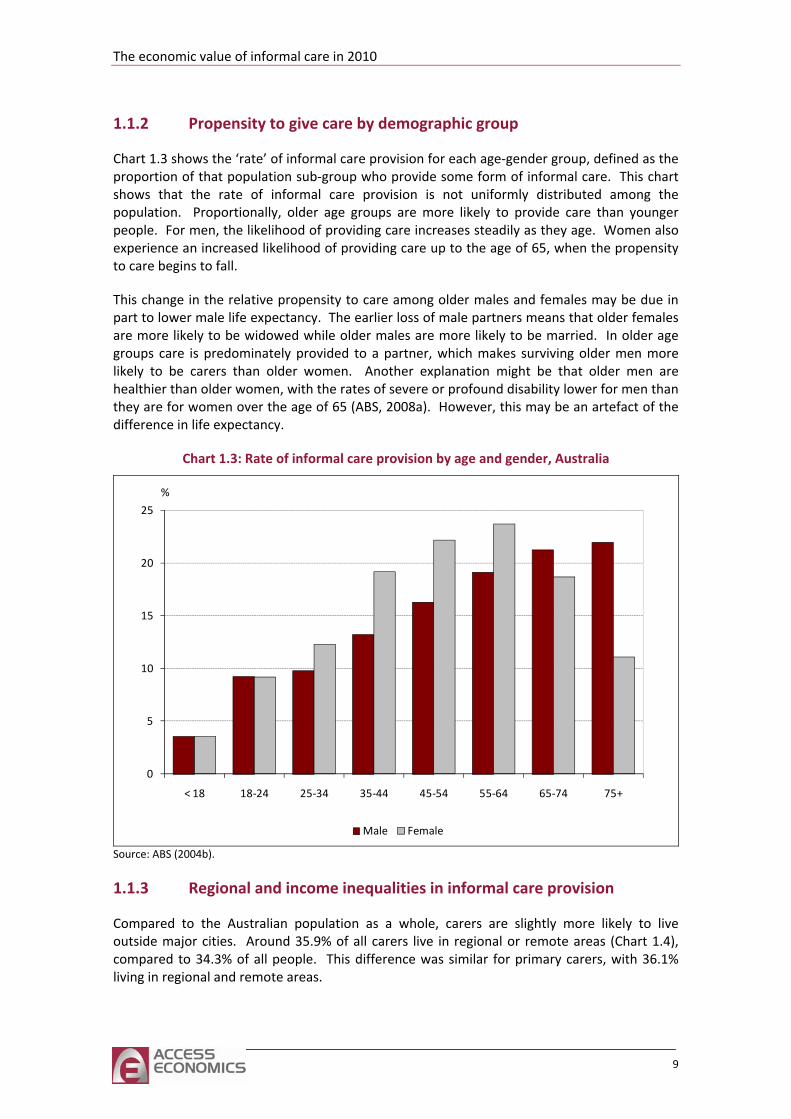
Chart 1.3 shows the ‘rate’ of informal care provision for each age‐gender group, defined as the proportion of that population sub‐group who provide some form of informal care. This chart shows that the rate of informal care provision is not uniformly distributed among the population. Proportionally, older age groups are more likely to provide care than younger people. For men, the likelihood of providing care increases steadily as they age. Women also experience an increased likelihood of providing care up to the age of 65, when the propensity to care begins to fall.
This change in the relative propensity to care among older males and females may be due in part to lower male life expectancy. The earlier loss of male partners means that older females are more likely to be widowed while older males are more likely to be married. In older age groups care is predominately provided to a partner, which makes surviving older men more likely to be carers than older women. Another explanation might be that older men are healthier than older women, with the rates of severe or profound disability lower for men than they are for women over the age of 65 (ABS, 2008a). However, this may be an artefact of the difference in life expectancy.
Chart 1.3: Rate of informal care provision by age and gender, Australia
0
5
10
15
20
25
< 18 18‐24 25‐34 35‐44 45‐54 55‐64 65‐74 75+
%
Male Female
Source: ABS (2004b).
1.1.3 Regional and income inequalities in informal care provision
Compared to the Australian population as a whole, carers are slightly more likely to live outside major cities. Around 35.9% of all carers live in regional or remote areas (Chart 1.4), compared to 34.3% of all people. This difference was similar for primary carers, with 36.1% living in regional and remote areas.
9
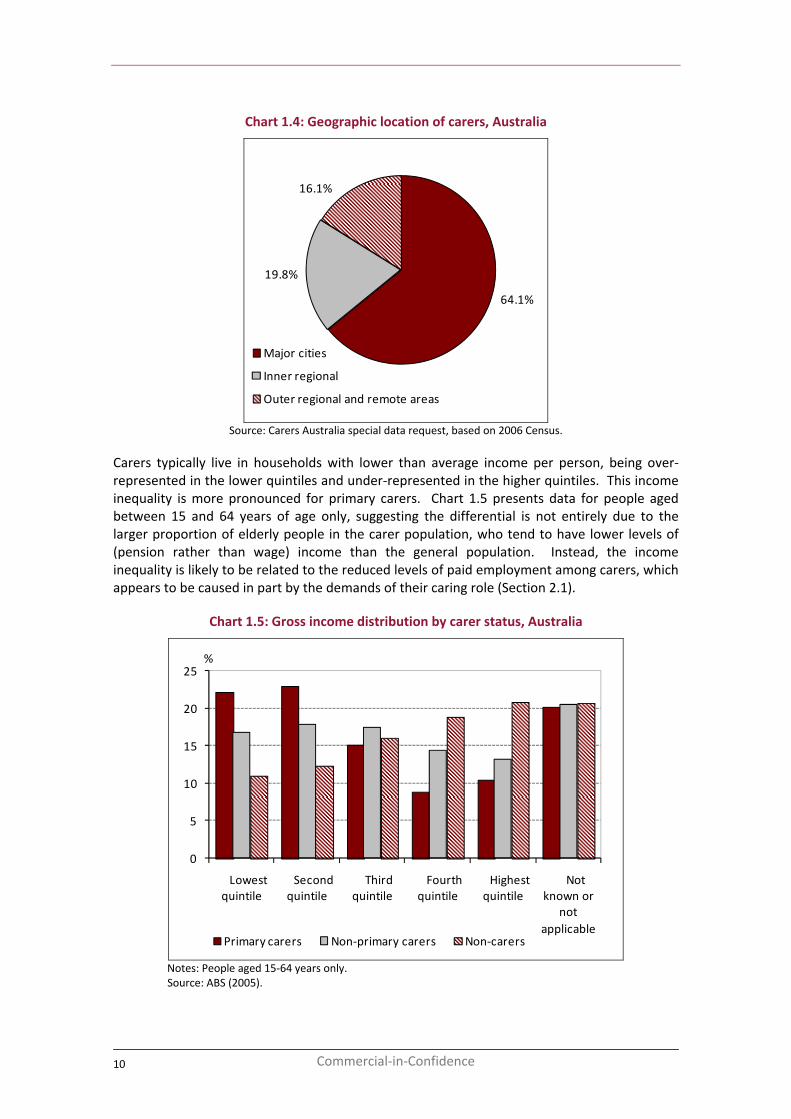
Chart 1.4: Geographic location of carers, Australia
64.1%
19.8%
16.1%
Major cities
Inner regional
Outer regional and remote areas
Source: Carers Australia special data request, based on 2006 Census.
Carers typically live in households with lower than average income per person, being over‐represented in the lower quintiles and under‐represented in the higher quintiles. This income inequality is more pronounced for primary carers. Chart 1.5 presents data for people aged between 15 and 64 years of age only, suggesting the differential is not entirely due to the larger proportion of elderly people in the carer population, who tend to have lower levels of (pension rather than wage) income than the general population. Instead, the income inequality is likely to be related to the reduced levels of paid employment among carers, which appears to be caused in part by the demands of their caring role (Section 2.1).
Chart 1.5: Gross income distribution by carer status, Australia
0
5
10
15
20
25
Lowest quintile
Second quintile
Third quintile
Fourth quintile
Highest quintile
Not known or
not applicable
%
Primary carers Non‐primary carers Non‐carers
Notes: People aged 15‐64 years only. Source: ABS (2005).
10 Commercial‐in‐Confidence
The economic value of informal care in 2010
If people aged 65 and over are included in the analysis the income inequality among primary carers increases further still. Over 25% or one quarter of all primary carers reported to the SDAC have gross household income in the lowest quintile.
1.1.4 Informal carers in 2010
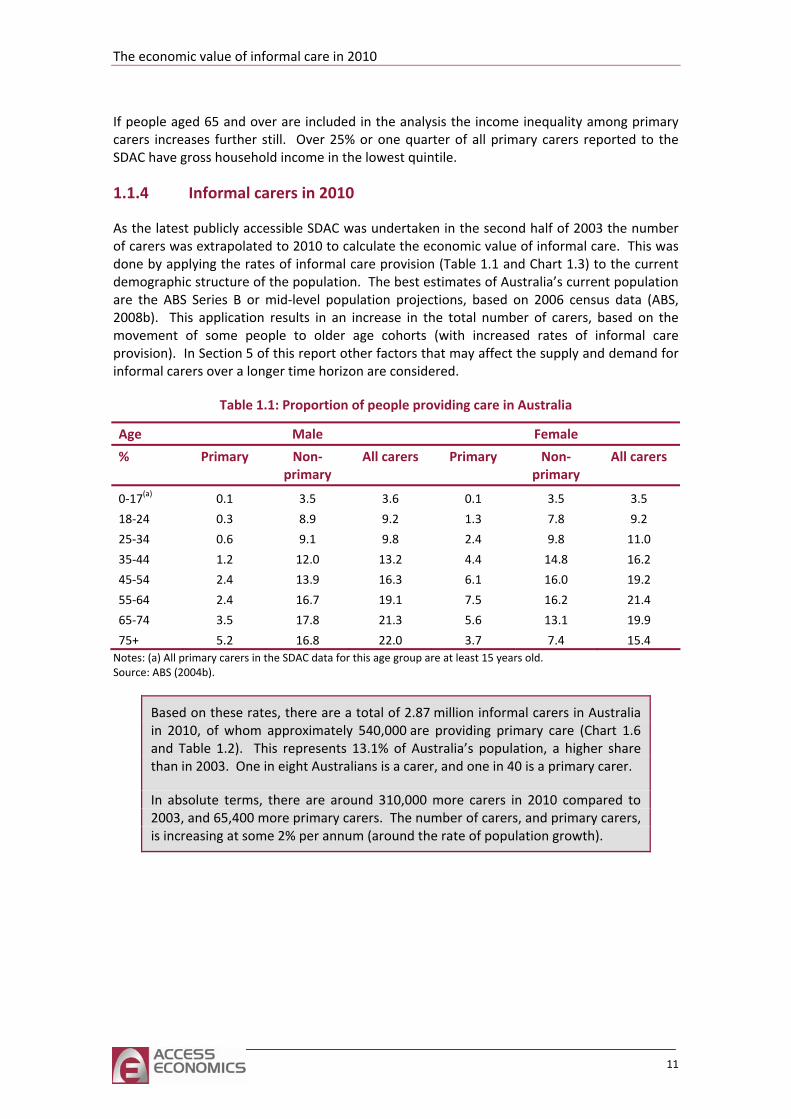
As the latest publicly accessible SDAC was undertaken in the second half of 2003 the number of carers was extrapolated to 2010 to calculate the economic value of informal care. This was done by applying the rates of informal care provision (Table 1.1 and Chart 1.3) to the current demographic structure of the population. The best estimates of Australia’s current population are the ABS Series B or mid‐level population projections, based on 2006 census data (ABS, 2008b). This application results in an increase in the total number of carers, based on the movement of some people to older age cohorts (with increased rates of informal care provision). In Section 5 of this report other factors that may affect the supply and demand for informal carers over a longer time horizon are considered.
Table 1.1: Proportion of people providing care in Australia
Age Male Female
% Primary Non‐primary
All carers Primary Non‐primary
All carers
0‐17(a) 0.1 3.5 3.6 0.1 3.5 3.5
18‐24 0.3 8.9 9.2 1.3 7.8 9.2
25‐34 0.6 9.1 9.8 2.4 9.8 11.0
35‐44 1.2 12.0 13.2 4.4 14.8 16.2
45‐54 2.4 13.9 16.3 6.1 16.0 19.2
55‐64 2.4 16.7 19.1 7.5 16.2 21.4
65‐74 3.5 17.8 21.3 5.6 13.1 19.9
75+ 5.2 16.8 22.0 3.7 7.4 15.4 Notes: (a) All primary carers in the SDAC data for this age group are at least 15 years old. Source: ABS (2004b).
Based on these rates, there are a total of 2.87 million informal carers in Australia in 2010, of whom approximately 540,000 are providing primary care (Chart 1.6 and Table 1.2). This represents 13.1% of Australia’s population, a higher share than in 2003. One in eight Australians is a carer, and one in 40 is a primary carer.
In absolute terms, there are around 310,000 more carers in 2010 compared to 2003, and 65,400 more primary carers. The number of carers, and primary carers, is increasing at some 2% per annum (around the rate of population growth).
11
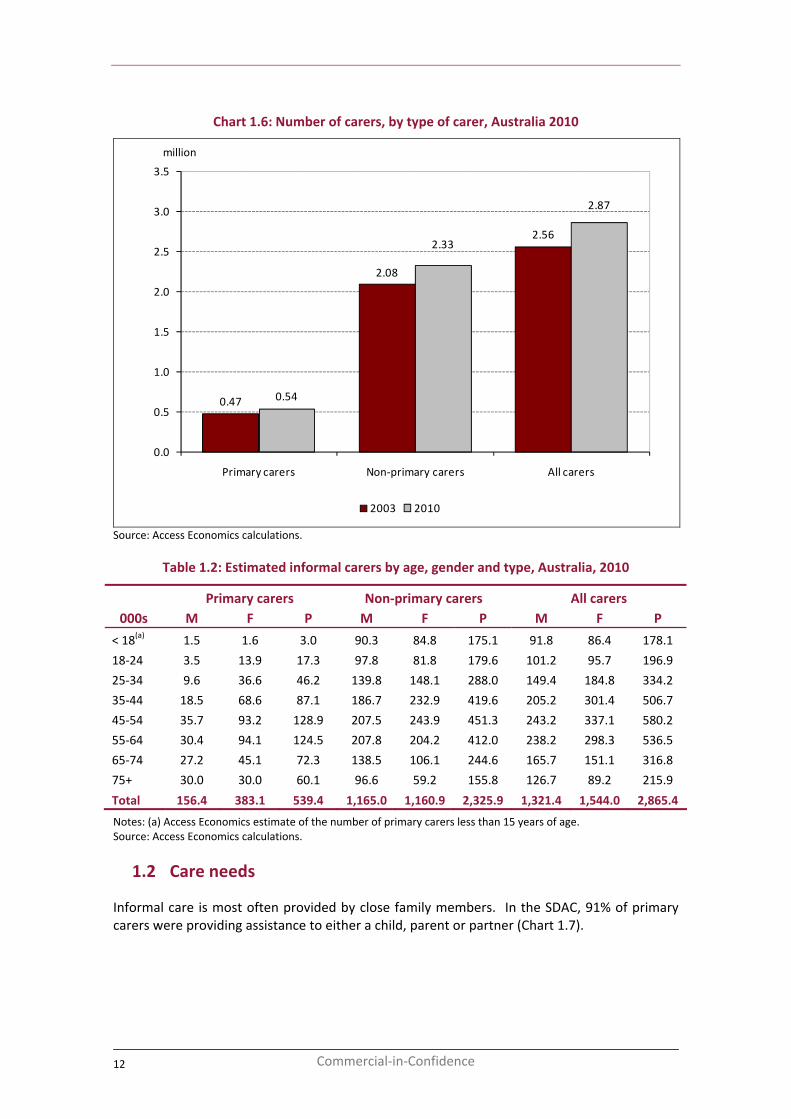
Chart 1.6: Number of carers, by type of carer, Australia 2010
0.47
2.08
2.56
0.54
2.33
2.87
0.0
0.5
1.0
1.5
2.0
2.5
3.0
3.5
Primary carers Non‐primary carers All carers
million
2003 2010
Source: Access Economics calculations.
Table 1.2: Estimated informal carers by age, gender and type, Australia, 2010
Primary carers Non‐primary carers All carers 000s M F P M F P M F P
< 18(a) 1.5 1.6 3.0 90.3 84.8 175.1 91.8 86.4 178.1
18‐24 3.5 13.9 17.3 97.8 81.8 179.6 101.2 95.7 196.9
25‐34 9.6 36.6 46.2 139.8 148.1 288.0 149.4 184.8 334.2
35‐44 18.5 68.6 87.1 186.7 232.9 419.6 205.2 301.4 506.7
45‐54 35.7 93.2 128.9 207.5 243.9 451.3 243.2 337.1 580.2
55‐64 30.4 94.1 124.5 207.8 204.2 412.0 238.2 298.3 536.5
65‐74 27.2 45.1 72.3 138.5 106.1 244.6 165.7 151.1 316.8
75+ 30.0 30.0 60.1 96.6 59.2 155.8 126.7 89.2 215.9
Total 156.4 383.1 539.4 1,165.0 1,160.9 2,325.9 1,321.4 1,544.0 2,865.4
Notes: (a) Access Economics estimate of the number of primary carers less than 15 years of age. Source: Access Economics calculations.
1.2 Care needs
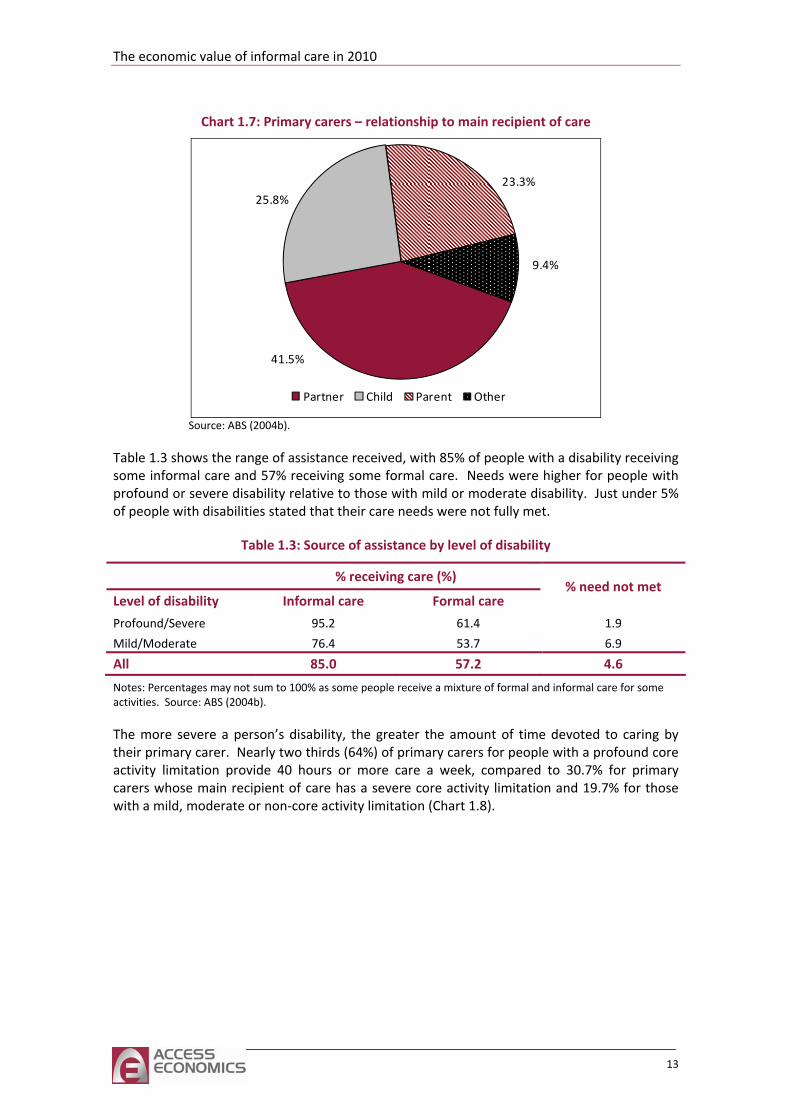
Informal care is most often provided by close family members. In the SDAC, 91% of primary carers were providing assistance to either a child, parent or partner (Chart 1.7).
12 Commercial‐in‐Confidence
The economic value of informal care in 2010
Chart 1.7: Primary carers – relationship to main recipient of care
41.5%
25.8%23.3%
9.4%
Partner Child Parent Other
Source: ABS (2004b).
Table 1.3 shows the range of assistance received, with 85% of people with a disability receiving some informal care and 57% receiving some formal care. Needs were higher for people with profound or severe disability relative to those with mild or moderate disability. Just under 5% of people with disabilities stated that their care needs were not fully met.
Table 1.3: Source of assistance by level of disability
% receiving care (%)
Level of disability Informal care Formal care % need not met
Profound/Severe 95.2 61.4 1.9
Mild/Moderate 76.4 53.7 6.9
All 85.0 57.2 4.6
Notes: Percentages may not sum to 100% as some people receive a mixture of formal and informal care for some activities. Source: ABS (2004b).
The more severe a person’s disability, the greater the amount of time devoted to caring by their primary carer. Nearly two thirds (64%) of primary carers for people with a profound core activity limitation provide 40 hours or more care a week, compared to 30.7% for primary carers whose main recipient of care has a severe core activity limitation and 19.7% for those with a mild, moderate or non‐core activity limitation (Chart 1.8).
13
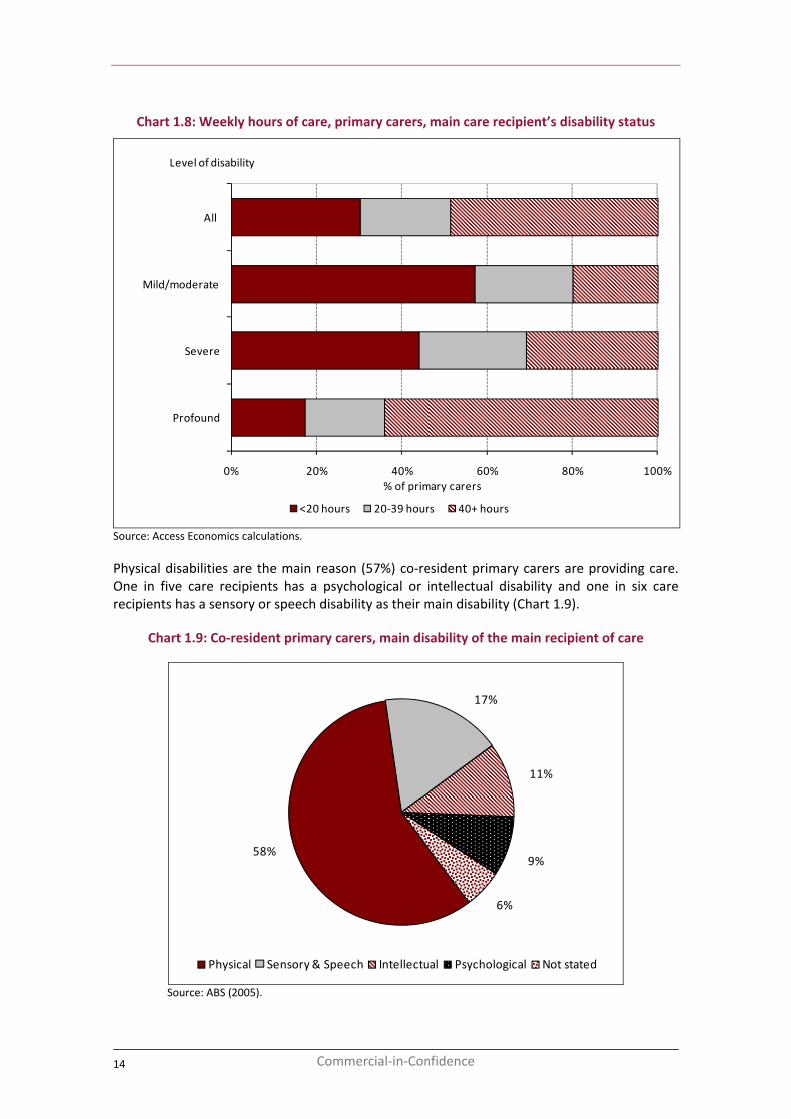
Chart 1.8: Weekly hours of care, primary carers, main care recipient’s disability status
0% 20% 40% 60% 80% 100%
Profound
Severe
Mild/moderate
All
% of primary carers
<20 hours 20‐39 hours 40+ hours
Level of disability
Source: Access Economics calculations.
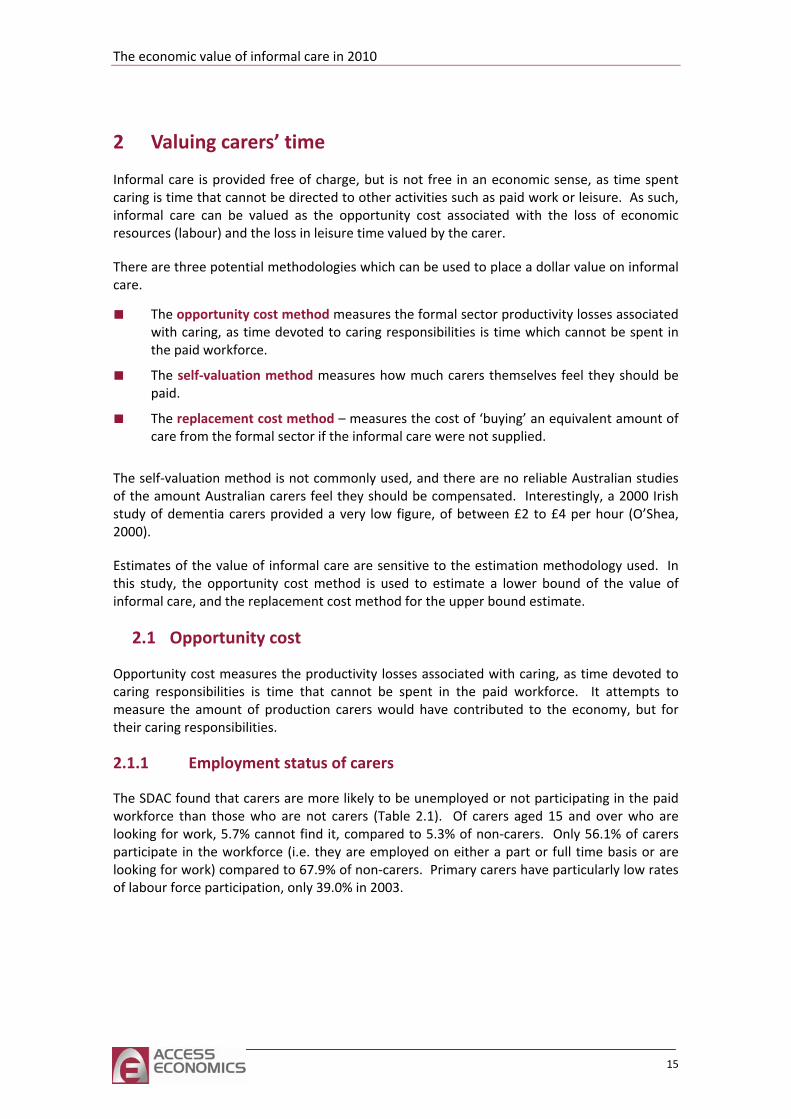
Physical disabilities are the main reason (57%) co‐resident primary carers are providing care. One in five care recipients has a psychological or intellectual disability and one in six care recipients has a sensory or speech disability as their main disability (Chart 1.9).
Chart 1.9: Co‐resident primary carers, main disability of the main recipient of care
58%
17%
11%
9%
6%
Physical Sensory & Speech Intellectual Psychological Not stated
Source: ABS (2005).
14 Commercial‐in‐Confidence
The economic value of informal care in 2010
2 Valuing carers’ time
Informal care is provided free of charge, but is not free in an economic sense, as time spent caring is time that cannot be directed to other activities such as paid work or leisure. As such, informal care can be valued as the opportunity cost associated with the loss of economic resources (labour) and the loss in leisure time valued by the carer.
There are three potential methodologies which can be used to place a dollar value on informal care.
■ The opportunity cost method measures the formal sector productivity losses associated with caring, as time devoted to caring responsibilities is time which cannot be spent in the paid workforce.
■ The self‐valuation method measures how much carers themselves feel they should be paid.
■ The replacement cost method – measures the cost of ‘buying’ an equivalent amount of care from the formal sector if the informal care were not supplied.
The self‐valuation method is not commonly used, and there are no reliable Australian studies of the amount Australian carers feel they should be compensated. Interestingly, a 2000 Irish study of dementia carers provided a very low figure, of between £2 to £4 per hour (O’Shea, 2000).
Estimates of the value of informal care are sensitive to the estimation methodology used. In this study, the opportunity cost method is used to estimate a lower bound of the value of informal care, and the replacement cost method for the upper bound estimate.
2.1 Opportunity cost
Opportunity cost measures the productivity losses associated with caring, as time devoted to caring responsibilities is time that cannot be spent in the paid workforce. It attempts to measure the amount of production carers would have contributed to the economy, but for their caring responsibilities.
2.1.1 Employment status of carers
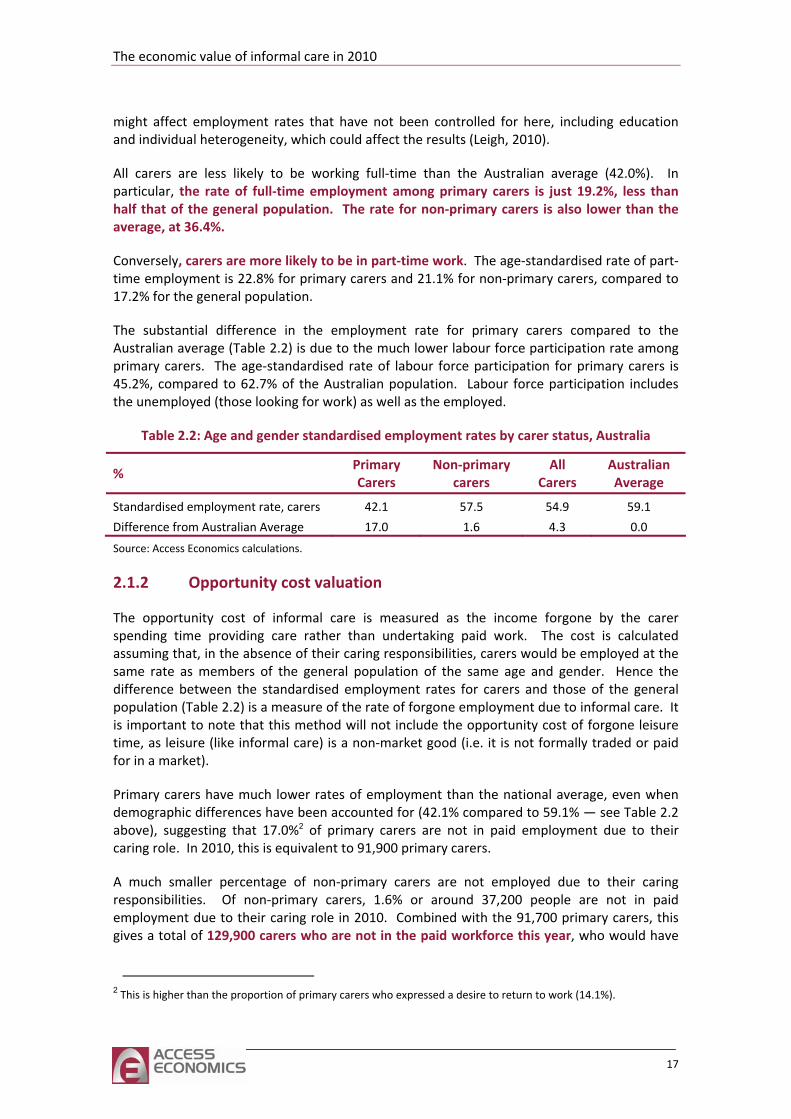
The SDAC found that carers are more likely to be unemployed or not participating in the paid workforce than those who are not carers (Table 2.1). Of carers aged 15 and over who are looking for work, 5.7% cannot find it, compared to 5.3% of non‐carers. Only 56.1% of carers participate in the workforce (i.e. they are employed on either a part or full time basis or are looking for work) compared to 67.9% of non‐carers. Primary carers have particularly low rates of labour force participation, only 39.0% in 2003.
15
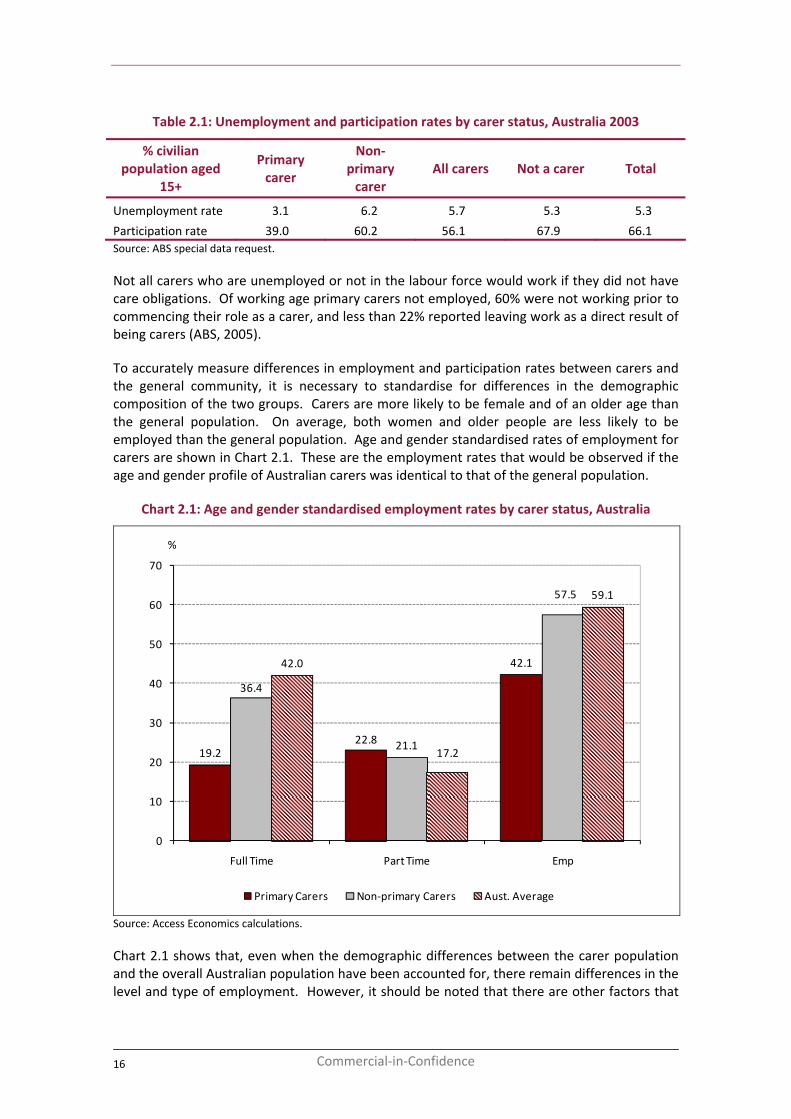
Table 2.1: Unemployment and participation rates by carer status, Australia 2003
% civilian population aged
15+
Primary carer
Non‐primary carer
All carers Not a carer Total
Unemployment rate 3.1 6.2 5.7 5.3 5.3
Participation rate 39.0 60.2 56.1 67.9 66.1 Source: ABS special data request.
Not all carers who are unemployed or not in the labour force would work if they did not have care obligations. Of working age primary carers not employed, 60% were not working prior to commencing their role as a carer, and less than 22% reported leaving work as a direct result of being carers (ABS, 2005).
To accurately measure differences in employment and participation rates between carers and the general community, it is necessary to standardise for differences in the demographic composition of the two groups. Carers are more likely to be female and of an older age than the general population. On average, both women and older people are less likely to be employed than the general population. Age and gender standardised rates of employment for carers are shown in Chart 2.1. These are the employment rates that would be observed if the age and gender profile of Australian carers was identical to that of the general population.
Chart 2.1: Age and gender standardised employment rates by carer status, Australia
19.222.8
42.1
36.4
21.1
57.5
42.0
17.2
59.1
0
10
20
30
40
50
60
70
Full Time Part Time Emp
%
Primary Carers Non‐primary Carers Aust. Average
Source: Access Economics calculations.
Chart 2.1 shows that, even when the demographic differences between the carer population and the overall Australian population have been accounted for, there remain differences in the level and type of employment. However, it should be noted that there are other factors that
16 Commercial‐in‐Confidence
The economic value of informal care in 2010
might affect employment rates that have not been controlled for here, including education and individual heterogeneity, which could affect the results (Leigh, 2010).
All carers are less likely to be working full‐time than the Australian average (42.0%). In particular, the rate of full‐time employment among primary carers is just 19.2%, less than half that of the general population. The rate for non‐primary carers is also lower than the average, at 36.4%.
Conversely, carers are more likely to be in part‐time work. The age‐standardised rate of part‐time employment is 22.8% for primary carers and 21.1% for non‐primary carers, compared to 17.2% for the general population.
The substantial difference in the employment rate for primary carers compared to the Australian average (Table 2.2) is due to the much lower labour force participation rate among primary carers. The age‐standardised rate of labour force participation for primary carers is 45.2%, compared to 62.7% of the Australian population. Labour force participation includes the unemployed (those looking for work) as well as the employed.
Table 2.2: Age and gender standardised employment rates by carer status, Australia
% Primary Carers
Non‐primary carers
All Carers
Australian Average
Standardised employment rate, carers 42.1 57.5 54.9 59.1
Difference from Australian Average 17.0 1.6 4.3 0.0
Source: Access Economics calculations.
2.1.2 Opportunity cost valuation
The opportunity cost of informal care is measured as the income forgone by the carer spending time providing care rather than undertaking paid work. The cost is calculated assuming that, in the absence of their caring responsibilities, carers would be employed at the same rate as members of the general population of the same age and gender. Hence the difference between the standardised employment rates for carers and those of the general population (Table 2.2) is a measure of the rate of forgone employment due to informal care. It is important to note that this method will not include the opportunity cost of forgone leisure time, as leisure (like informal care) is a non‐market good (i.e. it is not formally traded or paid for in a market).
Primary carers have much lower rates of employment than the national average, even when demographic differences have been accounted for (42.1% compared to 59.1% — see Table 2.2 above), suggesting that 17.0%2 of primary carers are not in paid employment due to their caring role. In 2010, this is equivalent to 91,900 primary carers.
A much smaller percentage of non‐primary carers are not employed due to their caring responsibilities. Of non‐primary carers, 1.6% or around 37,200 people are not in paid employment due to their caring role in 2010. Combined with the 91,700 primary carers, this gives a total of 129,900 carers who are not in the paid workforce this year, who would have
2 This is higher than the proportion of primary carers who expressed a desire to return to work (14.1%).
17
been employed if not for their caring responsibilities. This is equivalent to 1.1% of Australia’s current workforce (ABS, 2010a).
If these people were employed and received, on average, the same rate of pay as the average weekly earnings of all Australian workers (seasonally adjusted) they would earn $968.10 per week3, equivalent to $49,818 per annum (ABS, 2010c). This average includes superannuation and overtime and penalty rates where earned.
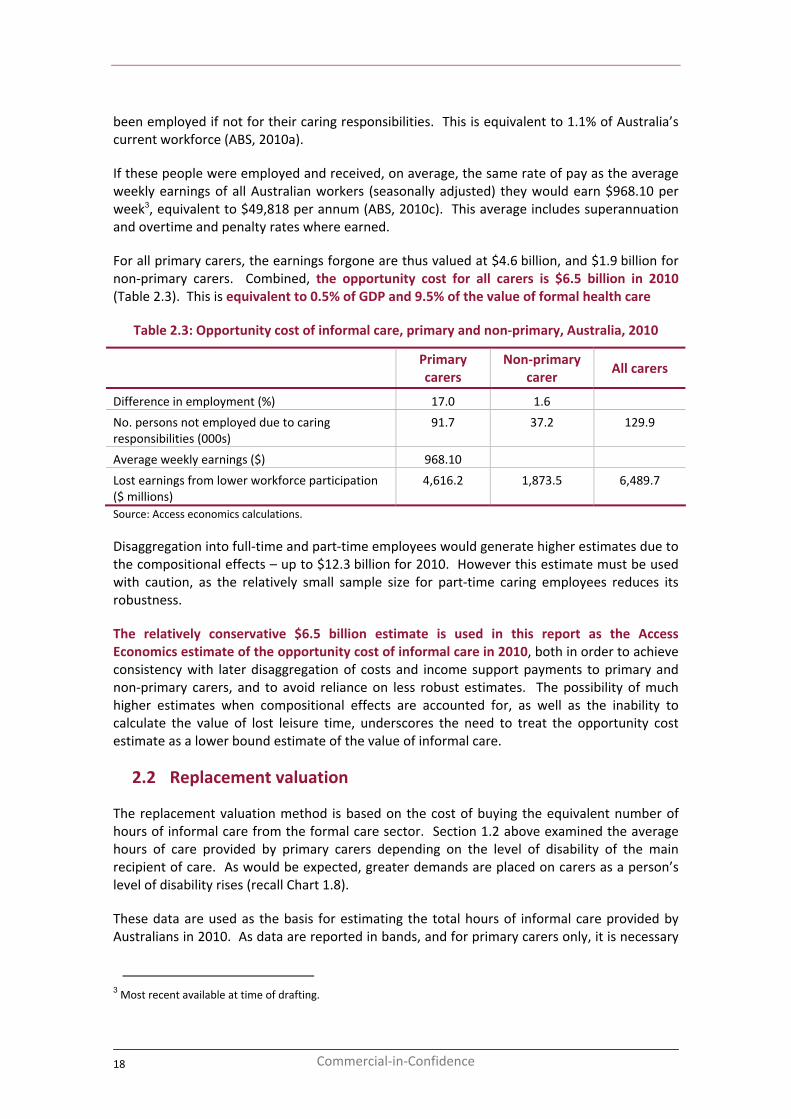
For all primary carers, the earnings forgone are thus valued at $4.6 billion, and $1.9 billion for non‐primary carers. Combined, the opportunity cost for all carers is $6.5 billion in 2010 (Table 2.3). This is equivalent to 0.5% of GDP and 9.5% of the value of formal health care
Table 2.3: Opportunity cost of informal care, primary and non‐primary, Australia, 2010
Primary carers
Non‐primary carer
All carers
Difference in employment (%) 17.0 1.6
No. persons not employed due to caring responsibilities (000s)
91.7 37.2 129.9
Average weekly earnings ($) 968.10
Lost earnings from lower workforce participation ($ millions)
4,616.2 1,873.5 6,489.7
Source: Access economics calculations.
Disaggregation into full‐time and part‐time employees would generate higher estimates due to the compositional effects – up to $12.3 billion for 2010. However this estimate must be used with caution, as the relatively small sample size for part‐time caring employees reduces its robustness.
The relatively conservative $6.5 billion estimate is used in this report as the Access Economics estimate of the opportunity cost of informal care in 2010, both in order to achieve consistency with later disaggregation of costs and income support payments to primary and non‐primary carers, and to avoid reliance on less robust estimates. The possibility of much higher estimates when compositional effects are accounted for, as well as the inability to calculate the value of lost leisure time, underscores the need to treat the opportunity cost estimate as a lower bound estimate of the value of informal care.
2.2 Replacement valuation
The replacement valuation method is based on the cost of buying the equivalent number of hours of informal care from the formal care sector. Section 1.2 above examined the average hours of care provided by primary carers depending on the level of disability of the main recipient of care. As would be expected, greater demands are placed on carers as a person’s level of disability rises (recall Chart 1.8).
These data are used as the basis for estimating the total hours of informal care provided by Australians in 2010. As data are reported in bands, and for primary carers only, it is necessary
3 Most recent available at time of drafting.
18 Commercial‐in‐Confidence
The economic value of informal care in 2010
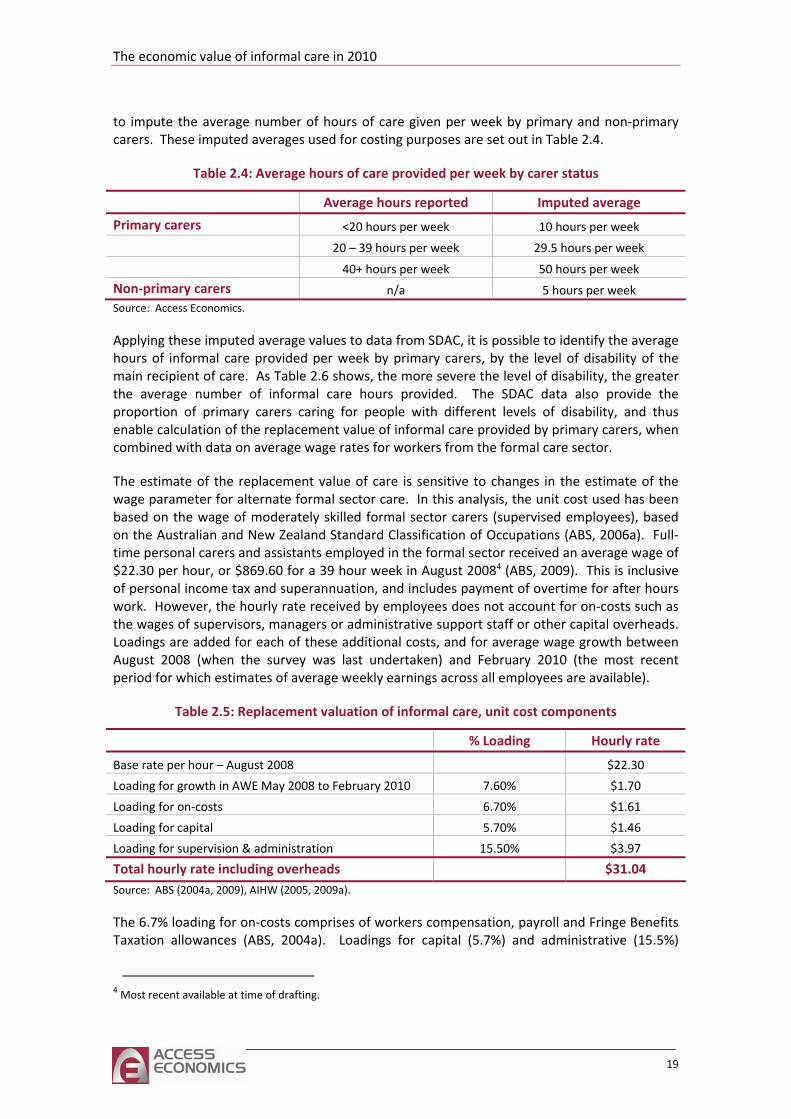
to impute the average number of hours of care given per week by primary and non‐primary carers. These imputed averages used for costing purposes are set out in Table 2.4.
Table 2.4: Average hours of care provided per week by carer status
Average hours reported Imputed average
Primary carers <20 hours per week 10 hours per week
20 – 39 hours per week 29.5 hours per week
40+ hours per week 50 hours per week
Non‐primary carers n/a 5 hours per week Source: Access Economics.
Applying these imputed average values to data from SDAC, it is possible to identify the average hours of informal care provided per week by primary carers, by the level of disability of the main recipient of care. As Table 2.6 shows, the more severe the level of disability, the greater the average number of informal care hours provided. The SDAC data also provide the proportion of primary carers caring for people with different levels of disability, and thus enable calculation of the replacement value of informal care provided by primary carers, when combined with data on average wage rates for workers from the formal care sector.
The estimate of the replacement value of care is sensitive to changes in the estimate of the wage parameter for alternate formal sector care. In this analysis, the unit cost used has been based on the wage of moderately skilled formal sector carers (supervised employees), based on the Australian and New Zealand Standard Classification of Occupations (ABS, 2006a). Full‐time personal carers and assistants employed in the formal sector received an average wage of $22.30 per hour, or $869.60 for a 39 hour week in August 20084 (ABS, 2009). This is inclusive of personal income tax and superannuation, and includes payment of overtime for after hours work. However, the hourly rate received by employees does not account for on‐costs such as the wages of supervisors, managers or administrative support staff or other capital overheads. Loadings are added for each of these additional costs, and for average wage growth between August 2008 (when the survey was last undertaken) and February 2010 (the most recent period for which estimates of average weekly earnings across all employees are available).
Table 2.5: Replacement valuation of informal care, unit cost components
% Loading Hourly rate
Base rate per hour – August 2008 $22.30
Loading for growth in AWE May 2008 to February 2010 7.60% $1.70
Loading for on‐costs 6.70% $1.61
Loading for capital 5.70% $1.46
Loading for supervision & administration 15.50% $3.97
Total hourly rate including overheads $31.04 Source: ABS (2004a, 2009), AIHW (2005, 2009a).
The 6.7% loading for on‐costs comprises of workers compensation, payroll and Fringe Benefits Taxation allowances (ABS, 2004a). Loadings for capital (5.7%) and administrative (15.5%)
4 Most recent available at time of drafting.
19
overheads are based on the relative shares of capital expenditure and administration costs to other areas of recurrent spending in Australia’s formal health sector (AIHW 2005, 2009a) When these loadings are added, the average hourly cost of employing a carer in the formal sector to replace an informal carer is estimated as $31.04 in 2010. These loadings reflect the fact that formal sector community care requires more than just labour inputs – there is a need to supervise and administer the care, often requiring a facility and vehicles. Travel costs have conservatively not been included, due to lack of data.
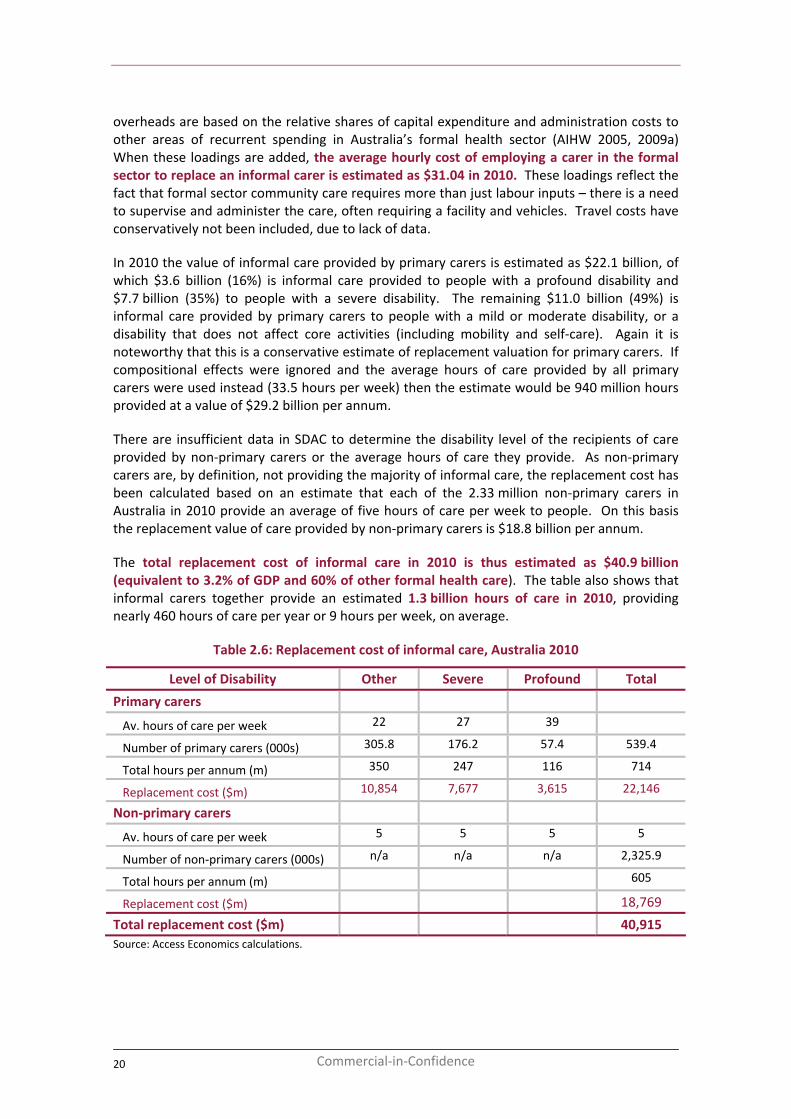
In 2010 the value of informal care provided by primary carers is estimated as $22.1 billion, of which $3.6 billion (16%) is informal care provided to people with a profound disability and $7.7 billion (35%) to people with a severe disability. The remaining $11.0 billion (49%) is informal care provided by primary carers to people with a mild or moderate disability, or a disability that does not affect core activities (including mobility and self‐care). Again it is noteworthy that this is a conservative estimate of replacement valuation for primary carers. If compositional effects were ignored and the average hours of care provided by all primary carers were used instead (33.5 hours per week) then the estimate would be 940 million hours provided at a value of $29.2 billion per annum.
There are insufficient data in SDAC to determine the disability level of the recipients of care provided by non‐primary carers or the average hours of care they provide. As non‐primary carers are, by definition, not providing the majority of informal care, the replacement cost has been calculated based on an estimate that each of the 2.33 million non‐primary carers in Australia in 2010 provide an average of five hours of care per week to people. On this basis the replacement value of care provided by non‐primary carers is $18.8 billion per annum.
The total replacement cost of informal care in 2010 is thus estimated as $40.9 billion (equivalent to 3.2% of GDP and 60% of other formal health care). The table also shows that informal carers together provide an estimated 1.3 billion hours of care in 2010, providing nearly 460 hours of care per year or 9 hours per week, on average.
Table 2.6: Replacement cost of informal care, Australia 2010
Level of Disability Other Severe Profound Total
Primary carers
Av. hours of care per week 22 27 39
Number of primary carers (000s) 305.8 176.2 57.4 539.4
Total hours per annum (m) 350 247 116 714
Replacement cost ($m) 10,854 7,677 3,615 22,146
Non‐primary carers
Av. hours of care per week 5 5 5 5
Number of non‐primary carers (000s) n/a n/a n/a 2,325.9
Total hours per annum (m) 605
Replacement cost ($m) 18,769
Total replacement cost ($m) 40,915 Source: Access Economics calculations.
20 Commercial‐in‐Confidence
The economic value of informal care in 2010
2.3 Comparisons
Sections 2.1 and 2.2 above show how sensitive the estimated value of informal care is to the methodology. A replacement valuation approach yields an estimate of $40.9 billion in 2010, more than six times the estimate of $6.5 billion generated using the opportunity cost method. It is important to bear in mind that:
■ the opportunity cost measure reveals the resources that are diverted each year from production in the formal economy to informal care; while
■ the replacement cost measure reveals the additional care that would need to be provided each year by the formal economy to replace the work done by informal carers, were their services no longer available.
The replacement cost measure does not take into consideration differences in efficiency of providing care. Many informal carers only provide care to one person while a carer in the formal sector might be able to provide care to a number of people at the same time, if the care recipients were co‐located. These economies of scale are the rationale behind residential care. However, many people prefer to stay in their own homes.
On the other hand, to provide the same number of hours of care as co‐resident informal carers self‐report, with the care recipient remaining at home, a formal carer might need to spend more hours overall, due to travel time. For other reasons also (e.g. inaccuracies in self‐reporting, regulations in the formal sector requiring ‘round the clock’ care), the replacement cost estimate may not be a true reflection of the number of hours needed to provide the same level of care in the formal sector.
That said, both estimates are large numbers and this section provides a comparison with previous estimates of the value of informal care in Australia, and the estimated size of the other sectors in the Australian economy.
There have been previous attempts to estimate an imputed value for informal care. Chart 2.2 demonstrates the relative value, in 2010 dollars, placed on informal care in each of these studies. Care should be taken when comparing the studies, as there are significant methodological differences between them, as discussed below. Also, no allowance has been made for Australian population growth that has occurred since the earlier studies, which would increase the total stock of, and hence the value of, informal care.
A study by the Australian Institute of Family Studies (de Vaus et al, 2003) estimated the value of time spent by Australians in 1997 providing unpaid personal care to adults was $6.8 billion in 1997. A replacement valuation approach was used, combining the average hourly wage of a personal carer/nursing assistant with data from the ABS 1997 Time Use Survey (ABS, 1998). This estimate would not include other activities that informal carers may assist with, such as household chores.
Another study placed the value of all unpaid welfare work done during 2005‐06, including informal care and volunteer work through organisations at $27.4 billion. The amount of informal care provided was determined from time‐use surveys, and valued at the average hourly pay rate of an appropriately qualified person, in this case an adult employed as a full‐time, community or personal services worker (AIHW, 2007).
21
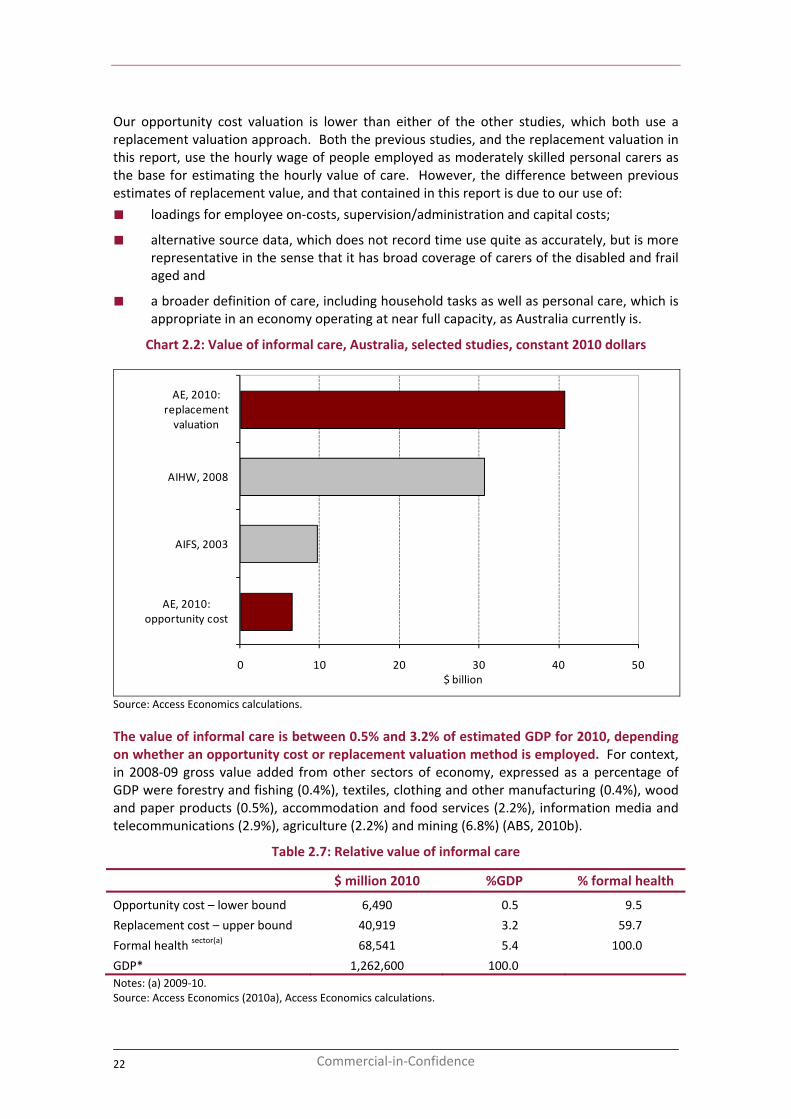
Our opportunity cost valuation is lower than either of the other studies, which both use a replacement valuation approach. Both the previous studies, and the replacement valuation in this report, use the hourly wage of people employed as moderately skilled personal carers as the base for estimating the hourly value of care. However, the difference between previous estimates of replacement value, and that contained in this report is due to our use of:
■ loadings for employee on‐costs, supervision/administration and capital costs;
■ alternative source data, which does not record time use quite as accurately, but is more representative in the sense that it has broad coverage of carers of the disabled and frail aged and
■ a broader definition of care, including household tasks as well as personal care, which is appropriate in an economy operating at near full capacity, as Australia currently is.
Chart 2.2: Value of informal care, Australia, selected studies, constant 2010 dollars
0 10 20 30 40 50
AE, 2010: opportunity cost
AIFS, 2003
AIHW, 2008
AE, 2010: replacement valuation
$ billion
Source: Access Economics calculations.
The value of informal care is between 0.5% and 3.2% of estimated GDP for 2010, depending on whether an opportunity cost or replacement valuation method is employed. For context, in 2008‐09 gross value added from other sectors of economy, expressed as a percentage of GDP were forestry and fishing (0.4%), textiles, clothing and other manufacturing (0.4%), wood and paper products (0.5%), accommodation and food services (2.2%), information media and telecommunications (2.9%), agriculture (2.2%) and mining (6.8%) (ABS, 2010b).
Table 2.7: Relative value of informal care
$ million 2010 %GDP % formal health
Opportunity cost – lower bound 6,490 0.5 9.5
Replacement cost – u
health secpper bound 40,919 3.2 59.7
10 Formal tor(a)
1,262,600 100.0
68,541 5.4 0.0
GDP* Notes: (a) 2009‐10. Source: Access Economics (2010a), Access Economics calculations.
22 Commercial‐in‐Confidence
The economic value of informal care in 2010
3 Other effects of informal care
The previous chapter showed how income is lower for carers, and associated with this there is also a reduction in taxation revenue. Moreover, in Australia, people with primary caring responsibilities may be eligible for income support payments from the Federal Government. In a budget‐neutral setting these payments must also be funded by additional taxation. Taxation is a cost to Government and creates society‐wide efficiency losses, which are estimated in this chapter.
3.1 Income support payments for carers
There are main two Federal Government assistance payments for carers – Carer Payment and Carer Allowance.
The Carer Payment is an income support payment for people who are unable to participate in the workforce full‐time as a result of their caring responsibilities. The payment is means tested (with income and asset tests) and is paid at the same rate as other social security pensions. To be eligible, the carer must be providing care in the home of the person requiring care. There are two payments, paid at the same rate, but with different qualifying criteria.
1. To receive the Carer Payment (caring for a person 16 years or over) the carer must provide one of the following levels of care:
■ full‐time care to an adult who has a disability or medical condition that is long term and severe and has a minimum level of care needs assessed by the Adult Disability Assessment Tool (ADAT); or
■ full‐time care for an adult whose care requirements are less severe but also have a dependent child under 6 or a dependent child aged 6‐16 with care needs that enable them to receive the Carer Allowance (caring for a person under 16 years).5
2. The Carer Payment (caring for a person under 16 years) is paid to those who provide:
■ care for a child under 16 with a profound disability; or
■ care for between two and four children under 16 with a disability who, together, need a level of care that is at least equivalent to the level of care needed by a child with a
■ least equivalent to the level of care needed by a child with a
■ t (care
is shared between two parents or legal guardians who are not in a relationship). 6
profound disability; or
care to one or two children under 16 and an adult with a disability who, together, need a level of care that is atprofound disability; or
a significant amount of care to two or more children under 16 years of age each with a severe disability or a severe medical condition in an exchanged care arrangemen
The Carer Allowance is an income supplement available to people who provide daily care and attention at home for a person who has a disability or severe medical condition or who is frail
5 http://www.centrelink.gov.au/internet/internet.nsf/payments/carer_adult.htm 6 http://www.centrelink.gov.au/internet/internet.nsf/payments/carer_child.htm
23
aged. Carer Allowance is not taxable or means tested. It can be paid in addition to wages or a social security income support payment. A carer is eligible to receive the Carer Allowance for up to two adults who meet the criteria. The care can be provided to people aged 16 years or over7 or to a child under 16 years8 who has a physical, intellectual or psychiatric disability (and hence the care is additional to what would be provided to a healthy child). Carer Allowance can also be paid to someone who cares for two children with disabilities and the children do not individually qualify but together create a substantial caring responsibility.
by a medical practitioner or other approved person meeting the medical eligibility criteria.
ber each year. This means that there are four rates of payment within each financial year.
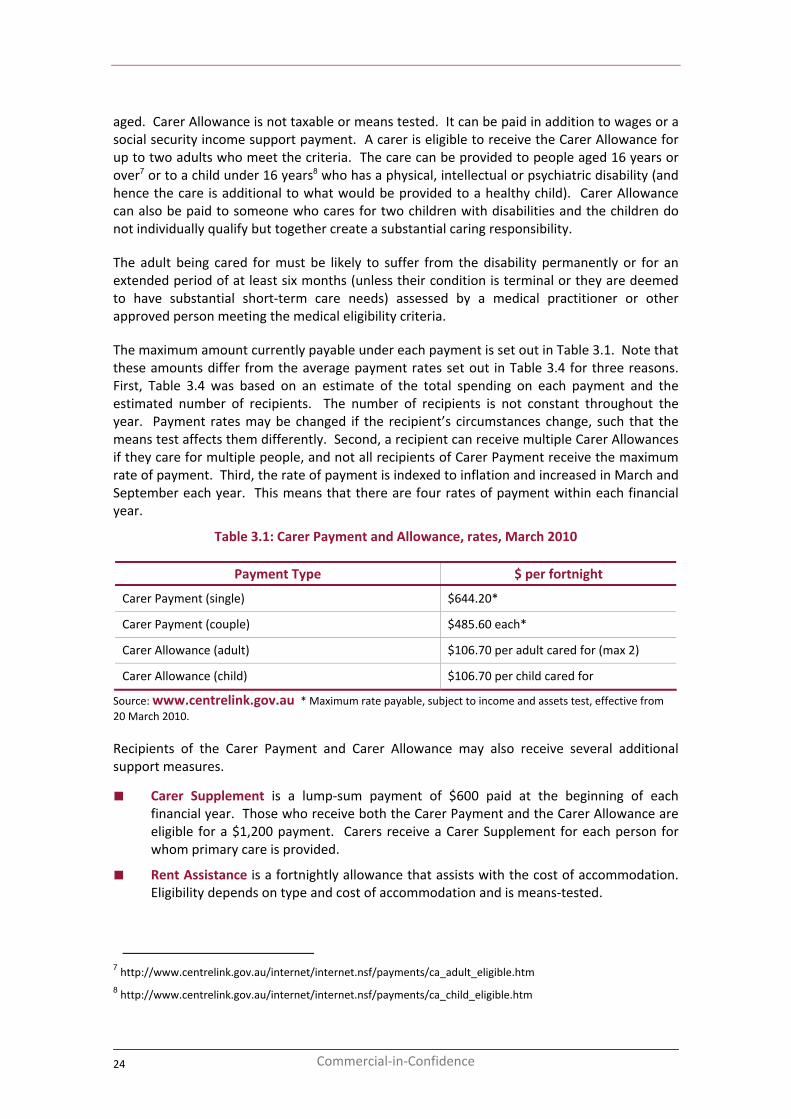
Table 3.1: Carer Payment and Allowance, rates, March 2010
ment Type $ per fortnight
The adult being cared for must be likely to suffer from the disability permanently or for an extended period of at least six months (unless their condition is terminal or they are deemed to have substantial short‐term care needs) assessed
The maximum amount currently payable under each payment is set out in Table 3.1. Note that these amounts differ from the average payment rates set out in Table 3.4 for three reasons. First, Table 3.4 was based on an estimate of the total spending on each payment and the estimated number of recipients. The number of recipients is not constant throughout the year. Payment rates may be changed if the recipient’s circumstances change, such that the means test affects them differently. Second, a recipient can receive multiple Carer Allowances if they care for multiple people, and not all recipients of Carer Payment receive the maximum rate of payment. Third, the rate of payment is indexed to inflation and increased in March and Septem
Pay
Carer Payment (single) $644.20*
Carer Payment (couple) $485.60 each*
Carer Allowance (adult) $106.70 per adult cared for (max 2)
Carer Allowance (child) $106.70 per child cared for
Source: www.centrelink.gov.au * Maximum rate payable, subject to income and assets test, effective from 20 March 2010.
rer Payment and Carer Allowance may also receive several additional
■
arers receive a Carer Supplement for each person for
■ modation.
Recipients of the Casupport measures.
Carer Supplement is a lump‐sum payment of $600 paid at the beginning of each financial year. Those who receive both the Carer Payment and the Carer Allowance are eligible for a $1,200 payment. Cwhom primary care is provided.
Rent Assistance is a fortnightly allowance that assists with the cost of accomEligibility depends on type and cost of accommodation and is means‐tested.
7 http://www.centrelink.gov.au/internet/internet.nsf/payments/ca_adult_eligible.htm 8 http://www.centrelink.gov.au/internet/internet.nsf/payments/ca_child_eligible.htm
24 Commercial‐in‐Confidence
The economic value of informal care in 2010
■ Child Disability Assistance Payment (CDAP) is a $1,000 annual lump‐sum payment for carers of children who are receiving Carer Allowance.
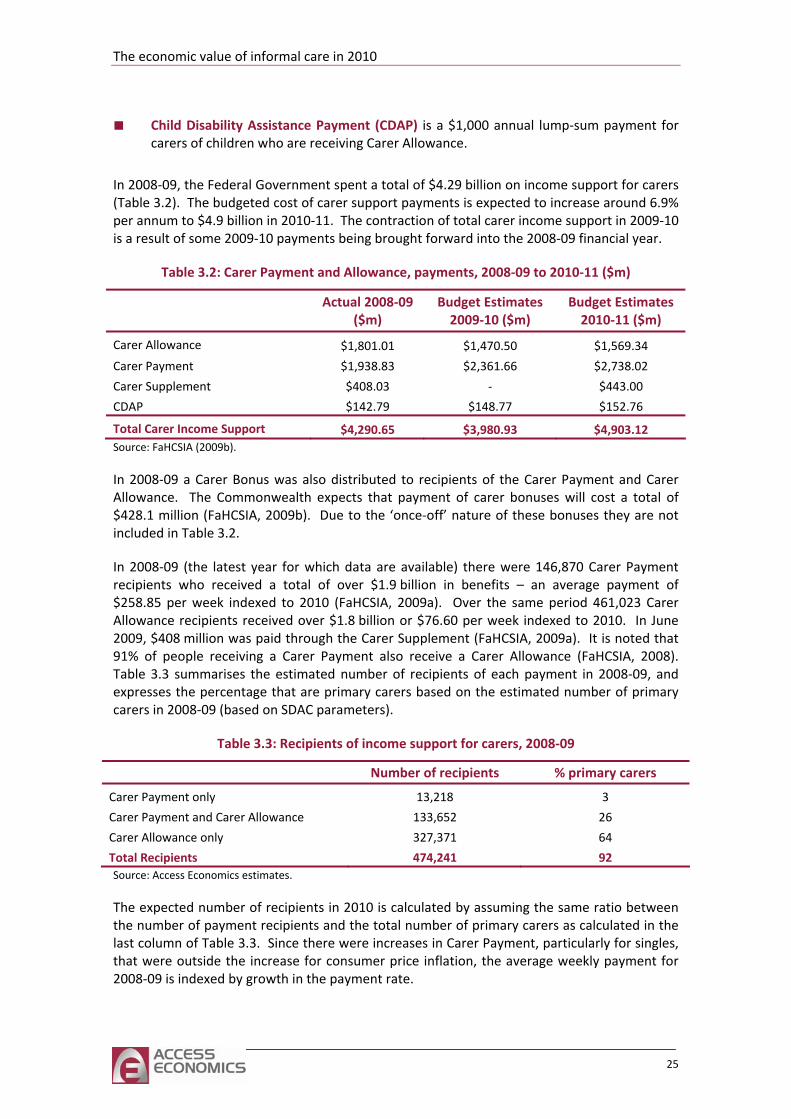
In 2008‐09, the Federal Government spent a total of $4.29 billion on income support for carers (Table 6.9% per ann ‐10 is a result of some 2009‐10 paymen fo 8‐0
: Carer Payment and , payments to 2010‐11
Ac Bud tes
2009‐10 ($m) Bud tes 20 )
3.2). The budgeted cost of carer support payments is expected to increase aroundum to $4.9 billion in 2010‐11. The contraction of total carer income support in 2009
ts being brought rward into the 200 9 financial year.
Table 3.2 Allowance , 2008‐09 ($m)
tual 2008‐09($m)
get Estima get Estima10‐11 ($m
Carer Allowance $ $ $1,801.01 1,470.50 1,569.34
Carer Payment $1,938.83 $2,361.66 $2,738.02
Carer Supplement $408.03 ‐ $443.00
CDAP $142.79 $148.77 $152.76
Total Carer Income Support $4,290.65 $3,980.93 $4,903.12 Source: FaHCSIA (2009b).
In 2008‐09 a Carer Bonus was also distributed to recipients of the Carer Payment and Carer
receive a Carer Allowance (FaHCSIA, 2008). Table 3.3 summ 2008‐09, and expresses the perce are primary carers based on the estimated number of primary carers in 2008‐09 (based on SDAC paramet
3.3: Recipients of income su for carers, 2008‐09
Numbe pients % prim carers
Allowance. The Commonwealth expects that payment of carer bonuses will cost a total of $428.1 million (FaHCSIA, 2009b). Due to the ‘once‐off’ nature of these bonuses they are not included in Table 3.2.
In 2008‐09 (the latest year for which data are available) there were 146,870 Carer Payment recipients who received a total of over $1.9 billion in benefits – an average payment of $258.85 per week indexed to 2010 (FaHCSIA, 2009a). Over the same period 461,023 Carer Allowance recipients received over $1.8 billion or $76.60 per week indexed to 2010. In June 2009, $408 million was paid through the Carer Supplement (FaHCSIA, 2009a). It is noted that 91% of people receiving a Carer Payment also
arises the estimated number of recipients of each payment inntage that
ers).
Table pport
r of reci ary
Carer Payment only 13,218 3
C e 133,652 26
C
T
arer Payment and Carer Allowanc
arer Allowance only 327,371 64
otal Recipients 474,241 92 Source: Access Economics estimates.
The expected number of recipients in 2010 is calculated by assuming the same ratio between the number of payment recipients and the total number of primary carers as calculated in the last column of Table 3.3. Since there were increases in Carer Payment, particularly for singles, that were outside the increase for consumer price inflation, the average weekly payment for 2008‐09 is indexed by growth in the payment rate.
25
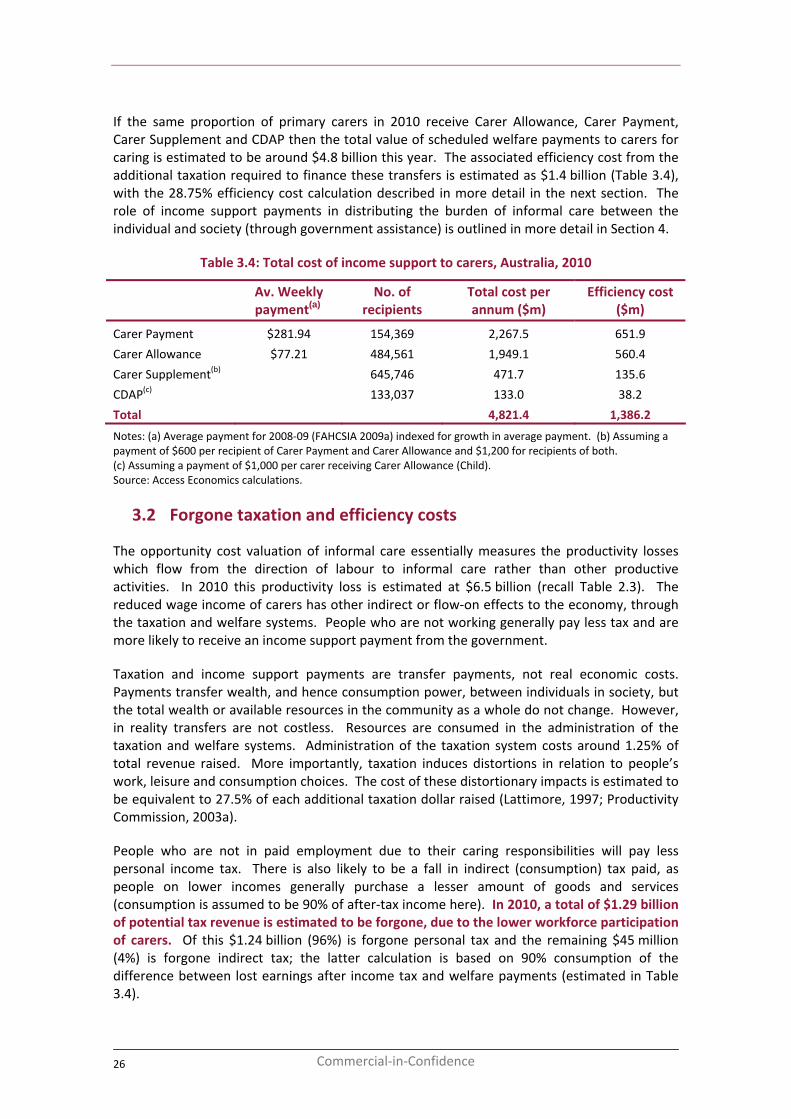
If the same proportion of primary carers in 2010 receive Carer Allowance, Carer Payment, Carer Supplement and CDAP then the total value of scheduled welfare payments to carers for caring is estimated to be around $4.8 billion this year. The associated efficiency cost from the additional taxation required to finance these transfers is estimated as $1.4 billion (Table 3.4), with the 28.75% efficiency cost calculation described in more detail in the next section. The role of incom en the individual and society (thr ment is outlined deta
Table 3.4 t of inc t to ca , 2010
Av. payme recipients
Total r ann
Efficiency cost
e support payments in distributing the burden of informal care betweough govern
: Total cos
assistance)
ome suppor
in more
rers, Australia
il in Section 4.
Weekly
nt(a) No. of cost pe
um ($m)
($m)
Carer Payment $281.94 2154,369 ,267.5 651.9
Carer Allowance $77.21 484 1 (b)
8.2
821.4 1,386.2
,56 1,949.1 560.4
Carer Supplement 645,746 471.7 135.6
CDAP(c) 133,037 133.0 3
Total 4,
Notes: (a) Average payment for 2008‐09 (FAHCSIA 2009a) indexed for growth in average payment. (b) Assuming a pay d $1,200 for recipients of both. (c) hild). Source: Access Economics calculations.
call Table 2.3). The reduced wage income of carers has other indirect or flow‐on effects to the economy, through
More importantly, taxation induces distortions in relation to people’s work, leisure and consumption choices. The cost of these distortionary impacts is estimated to
ers. Of this $1.24 billion (96%) is forgone personal tax and the remaining $45 million (4%) is forgone indirect tax; the latter calculation is based on 90% consumption of the
ment of $600 per recipient of Carer Payment and Carer Allowance anAssuming a payment of $1,000 per carer receiving Carer Allowance (C
3.2 Forgone taxation and efficiency costs
The opportunity cost valuation of informal care essentially measures the productivity losses which flow from the direction of labour to informal care rather than other productive activities. In 2010 this productivity loss is estimated at $6.5 billion (re
the taxation and welfare systems. People who are not working generally pay less tax and are more likely to receive an income support payment from the government.
Taxation and income support payments are transfer payments, not real economic costs. Payments transfer wealth, and hence consumption power, between individuals in society, but the total wealth or available resources in the community as a whole do not change. However, in reality transfers are not costless. Resources are consumed in the administration of the taxation and welfare systems. Administration of the taxation system costs around 1.25% of total revenue raised.
be equivalent to 27.5% of each additional taxation dollar raised (Lattimore, 1997; Productivity Commission, 2003a).
People who are not in paid employment due to their caring responsibilities will pay less personal income tax. There is also likely to be a fall in indirect (consumption) tax paid, as people on lower incomes generally purchase a lesser amount of goods and services (consumption is assumed to be 90% of after‐tax income here). In 2010, a total of $1.29 billion of potential tax revenue is estimated to be forgone, due to the lower workforce participation of car
difference between lost earnings after income tax and welfare payments (estimated in Table 3.4).
26 Commercial‐in‐Confidence
The economic value of informal care in 2010
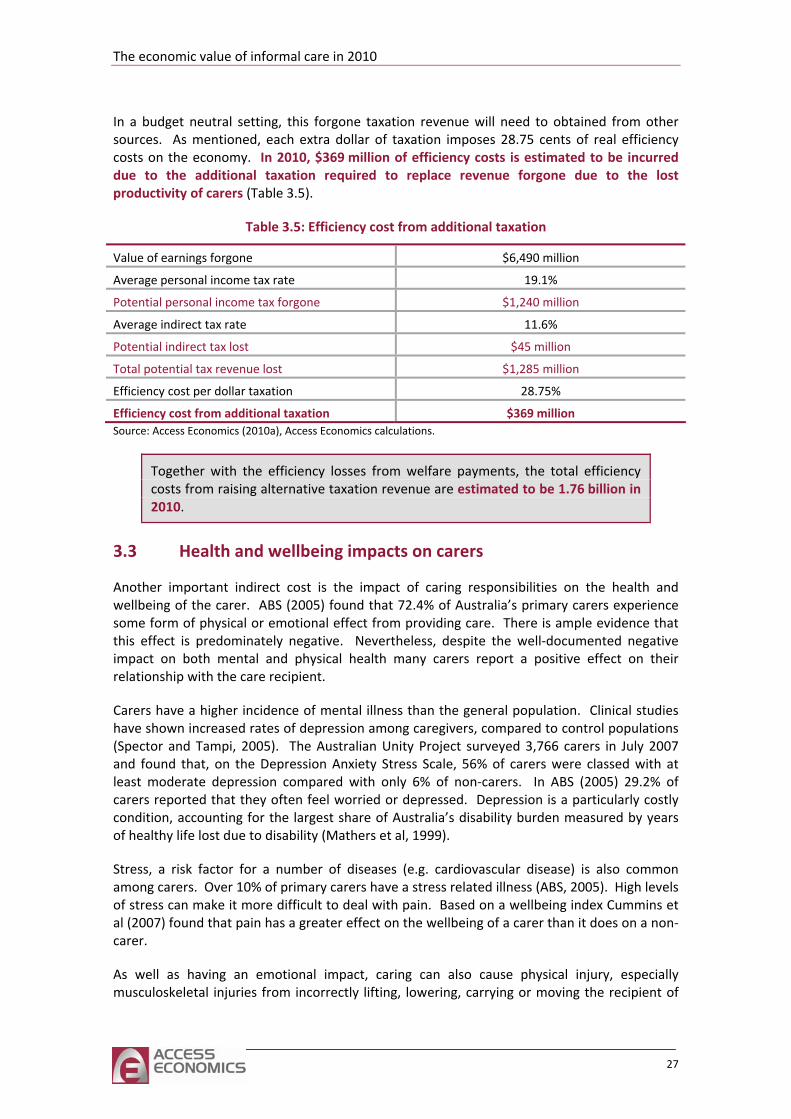
In a budget neutral setting, this forgone taxation revenue will need to obtained from other sources. As mentioned, each extra dollar of taxation imposes 28.75 cents of real efficiency costs on the economy. In 2010, $369 million of efficiency costs is estimated to be incurred due to the additional taxation required to replace revenue forgone due to the lost productivity of carers
ble 3.5: Efficiency cost from additional t
(Table 3.5).
Ta axation
Value of earnings forgone $6,490 million
Average personal income tax rate 19.1%
Potential personal income tax forgone $1, 240 million
Average indirect tax rate 11.6%
Potential indirect tax lost $4 5 million
Total potential tax revenue lost $1, 285 million
Efficiency cost per dollar taxation 28.75%
Efficiency cost from additional taxation $369 million Source: Access Economics (2010a), Access Economics calculations.
Together with the efficiency losses from welfare payments, the total efficiency costs from raising alternative taxation revenue are estimated to be 1.76 billion in 2010.
3.3 Health and wellbeing impacts on carers
Another important indirect cost is the impact of caring responsibilities on the health and wellbeing of the carer. ABS (2005) found that 72.4% of Australia’s primary carers experience some form of physical or emotional effect from providing care. There is ample evidence that this effect is predominately negative. Nevertheless, despite the well‐documented negative impact on both mental and physical health many carers report a positive effect on their
. Depression is a particularly costly condition, accounting for the largest share of Australia’s disability burden measured by years
can make it more difficult to deal with pain. Based on a wellbeing index Cummins et al (2007) found that pain has a greater effect on the wellbeing of a carer than it does on a non‐
relationship with the care recipient.
Carers have a higher incidence of mental illness than the general population. Clinical studies have shown increased rates of depression among caregivers, compared to control populations (Spector and Tampi, 2005). The Australian Unity Project surveyed 3,766 carers in July 2007 and found that, on the Depression Anxiety Stress Scale, 56% of carers were classed with at least moderate depression compared with only 6% of non‐carers. In ABS (2005) 29.2% of carers reported that they often feel worried or depressed
of healthy life lost due to disability (Mathers et al, 1999).
Stress, a risk factor for a number of diseases (e.g. cardiovascular disease) is also common among carers. Over 10% of primary carers have a stress related illness (ABS, 2005). High levels of stress
carer.
As well as having an emotional impact, caring can also cause physical injury, especially musculoskeletal injuries from incorrectly lifting, lowering, carrying or moving the recipient of
27
care. A 1999 survey into the wellbeing of carers conducted by Carers Australia found that 33% of all carers reported having being physically injured at least once in the course of providing care, of which over a half were due to lifting or carrying the patient or other objects (Carers Association of Australia, 2000). Similar results have been found in overseas studies (Carers UK,
mary carers reported that they felt satisfied with their caring role (implying that three quarters were
cardiovascular disease. On a relative prevalence basis then, the sleep impacts of caring may exceed $1 billion reduced quality of life.
2004).
Although health is an important component of wellbeing, family relationships and life satisfaction also play an important role. ABS (2005) found that more carers report feeling that giving care has brought them closer to the care recipient than those who report that it has strained their relationship (34% compared with 18%). Just over a quarter (25.7%) of pri
not satisfied). Adverse effects on wellbeing were reported by 29% of carers (ABS, 2005).
Sleep deprivation can contribute to a number of health conditions and reduce overall wellbeing. Often feeling weary or lacking energy as a result of being a carer was reported by 33.7% of primary carers in ABS (2005). Sleep interruptions due to the requirements of their caring role were reported by 44.5% of carers. Of these, 46.4% reported that these interruptions were frequent. Hillman et al (2006) estimated that almost 1.2 million Australians experience sleep disorders with associated costs in excess of $10 billion in 2004, through the costs of sleep disturbance itself and its associated attributable costs from fatigue‐related motor vehicle accidents, work‐related injuries, depression, diabetes and
per annum, including a financial estimate of the
Case study model: health impacts of caring
In this study, a hypotheticated female carer ‘Karen’ in her mid‐forties has conditions typical of caring as shown in the literature above –mild‐moderate depression, stress‐related angina (a cardiovascular condition), and chronic lower back pain. As the primary carer for her disabled child, aged 19, Karen no longer works due to her caring responsibilities and her own health conditions.
The cost impacts of each of these health conditions have been previously estimated by Access Economics (2009a, 2007a, 2007b) – not just the health system expenditures, but also the productivity losses, other financial costs (such as efficiency losses and State Government programs), and the burden of disease.
28 Commercial‐in‐Confidence
The economic value of informal care in 2010
The disease burden is measured in disability adjusted life years based on disease‐specific weights published by the AIHW (Begg et al, 2007; Mathers et al, 1999). These are then converted to 2010 dollars using the value of a year of healthy life of $166,604 from the Department of Finance and Deregulation (2009).
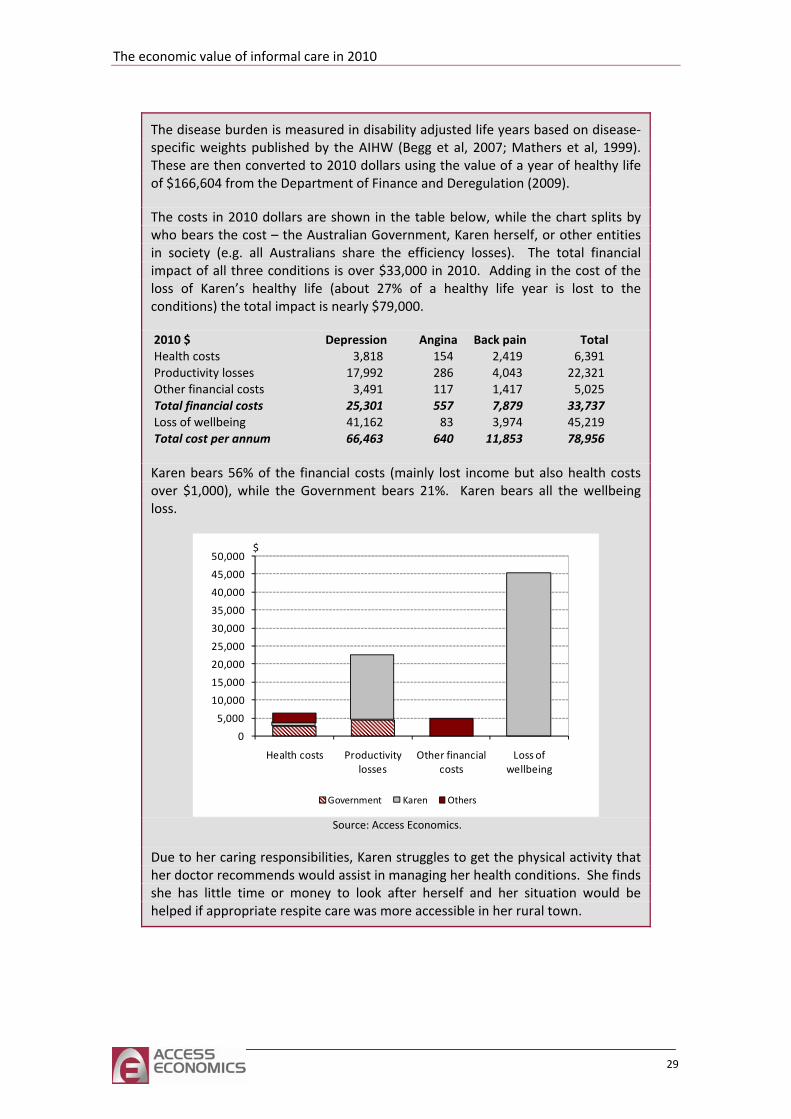
The costs in 2010 dollars are shown in the table below, while the chart splits by who bears the cost – the Australian Government, Karen herself, or other entities in society (e.g. all Australians share the efficiency losses). The total financial impact of all three conditions is over $33,000 in 2010. Adding in the cost of the loss of Karen’s healthy life (about 27% of a healthy life year is lost to the conditions) the total impact is nearly $79,000.
2010 $ Depression Angina Back pain TotalHealth costs 3,818 154 2,419 6,391 Productivity losses 17,992 286 4,043 22,321 Other financial costs 3,491 117 1,417 5,025 Total financial costs 25,301 557 7,879 33,737 Loss of wellbeing 41,162 83 3,974 45,219 Total cost per annum 66,463 640 11,853 78,956
Karen bears 56% of the financial costs (mainly lost income but also health costs over $1,000), while the Government bears 21%. Karen bears all the wellbeing loss.
0
5,000
10,000
15,000
20,000
25,000
30,000
35,000
40,000
45,000
50,000
Health costs Productivity losses
Other financial costs
Loss of wellbeing
$
Government Karen Others
Source: Access Economics.
Due to her caring responsibilities, Karen struggles to get the physical activity that her doctor recommends would assist in managing her health conditions. She finds she has little time or money to look after herself and her situation would be helped if appropriate respite care was more accessible in her rural town.
29
3.4 Young carers
Young carers are people under the age of 25 who provide informal care (Hill et al, 2009). Little formal research has been undertaken into the impact of providing care from a young age, in part due to the difficulties involved in identifying young carers. Consequently the indirect costs uniquely associated with providing care from a young age are often overlooked. The situation of young carers is distinctive because care is provided during the years in which a person would typically undertake education and establish themselves in the labour force. As such, providing informal care from a young age increases the risk of long term financial disadvantage.
Providing informal care can interfere with schooling and work because it is time intensive and stressful. Many young carers undertake the same tasks as an older carer would – including housework, assisting with bathing and toileting, administering medication and providing emotional support. Although many young people contribute to households tasks, young carers do so with a much greater intensity and over a wider range of tasks than other young people. A UK study revealed that 17% of young carers provide more than 20 hours per week of support to their family (Warren, 2007).
It is difficult to accurately estimate the number of young carers for several reasons. First, research suggests that a large proportion of young carers do not access support services remaining ‘hidden’ (Cass et al, 2009). Second, it is difficult to obtain survey data on people under the age of 18. In many surveys, including the SDAC, people under the age of 15 are not interviewed and those under 18 require parental consent to participate. Accordingly, information on minors is usually collected from the parents. However, parents may not be forthcoming with information about their child’s care giving responsibilities due to the social stigma attached. ABS (2005) showed that 62% of young carers in Australia were providing informal care to a parent. Finally, young people are less likely to identify themselves as carers than would be an older person providing the equivalent amount of care because they perceive their responsibilities as `normal’ (Cass et al, 2009).
Presently the best estimate of the number of young carers comes from the SDAC. In 2010 it is estimated that there are around 375,071 young people in Australia providing informal care to a relative or friend with a disability, of which 20,369 are primary carers (Table 1.2). Due to the sampling difficulties discussed above this is likely to be an underestimate. There has been some work done in estimating potential young carers. Hill et al (2009) defined potential young carers as those aged 15‐24 who reside with someone who requires care but no one in the household has identified themselves as a carer. For children aged 12‐14 the criteria is co‐residence with a person requiring care regardless of whether or not another carer had been identified. Using data from the 2006 Census of Population and Housing, Hill et al (2009) identified 14,000 potential young carers aged 12‐14 and 77,000 aged 15‐24. This is lower than Cass et al (2009) who identified 717,000 potential young carers using Wave 5 of the HILDA survey, although the definition of a carer was less strict, only requiring a person to co‐reside with someone likely to require care.
Young carers may be at greater risk of not completing high school, or poor achievement, than non carers. ABS (2008a) found that 66% of young carers aged 19‐24 had completed high school compared to 73% of non‐carers in this age group. This estimate should be interpreted
30 Commercial‐in‐Confidence
The economic value of informal care in 2010
with caution as it suffers from some self acknowledged methodological issues.9 Although there is inconclusive statistical evidence on the educational difficulties faced by young carers, there is supportive anecdotal evidence. Dearden and Becker (2002) found that at least a quarter of young carers in the UK experienced educational difficulties including:
■ worry about how the person that they care for is faring in their absence;
■ tiredness, difficulty concentrating;
■ difficulty completing homework on time and often being punished for it;
■ social isolation and difficulty identifying with their peers;
■ about having a disability in their family or about being financially disadvantaged.
want to allow caring to limit their future or they wanted their parents to be proud of them.
may face reduced opportunity as
■ who they
or
■ Young carers who live in regional areas may not have access to the course of their for
young carers come from families who are
■ being bullied; and
embarrassment
Many of these factors also reduce academic achievement, which is an important precursor to dropping out of education. Through interviews with 51 young carers, Moore et al (2006) confirmed that these factors also applied to Australia. However, they also found that being a carer could have a positive influence on education. Young carers develop valuable life skills through their caring role that are not obtained through formal education. They may also be motivated to persevere with education because they are financially aware and understand the need to secure employment in the future. Others did not
Poor school results are an obvious barrier to opportunity to undertake higher education. However, even those who are able to achieve in high schoola result of their caring role for the following reasons.
Young carers may be financially responsible for themselves and the personcare for and may feel that they have no choice but to find paid employment.
Young carers require flexibility in their education program and not all institutions■ course convenors are willing to accommodate their needs (Carers Australia, 2002).
choice and leaving or relocating the person who they care might not be an option.
The lasting effect of missed education opportunities is a greater chance of financial disadvantage. It may also be difficult for young carers to establish themselves in the workforce, even if they do obtain a tertiary or vocational qualification. While non‐carer counterparts are gaining valuable work experience and establishing their career path, this can be more difficult for young carers. Failure to gain work experience can make it more difficult to find successful employment in the future. Many
9 This measure is an ex post measure, meaning that it does not imply causality. Since it does not control for whether or not people were young carers during high school, it could indicate that being a young carer increases the risk of not completely high school or that not completing high school increases the chance of being a young carer. This estimate is the most reliable available. Other estimates look at the proportion of young carers who are studying. None of these estimates adequately control for differences in the age distribution of the carer and non carer sample, which will affect the findings because the probability of being in education is different at different ages.
31
reliant on income support and without providing them with opportunity to change their circumstances, the cycle of poverty will continue.
Another important barrier to education for young carers is the 25 hour rule on the Carer Payment. Young carers who are eligible for the Carer Payment are not allowed to spend more than 25 hours per week in study or paid employment, including travel time. This means that they cannot study full‐time, prolonging the length of time that they must juggle study and caring. By choosing to study, they may also have to forgo the income that they are allowed to earn to supplement their Carer Payment. The inclusion of travel time compounds the problem for young carers living in regional areas.
32 Commercial‐in‐Confidence
The economic value of informal care in 2010
Case study: educational opportunities for young carers
Chantelle, now 21, has from the age of 12 been the primary carer for her mother (aged 50), who has congenital nephritis. Chantelle manages her mother’s many medical appointments, medication and personal care at home, and all the family’s domestic household work and finances (her older sister and estranged father are not co‐resident). Her mother’s illness can be unpredictable, causing emergency hospitalisations, night‐time sleep interruptions and periodic absences from education for Chantelle.
Chantelle did not identify herself as a carer until age 17. She simply did what she ‘had to do’ to make ends meet, including working after hours through high school to pay for rent, food and medical bills – which were particularly high after her mother’s two nephritis‐related strokes (her mother’s DSP was inadequate to meet expenses and Chantelle was too young to receive any payments for caring). The strokes occurred when Chantelle was at critical points in her education, during Years 9 and Year 11.
Her mother’s illness complicated Chantelle’s exam and assignment deadlines, and teachers were not understanding of her missed classes, telling her she did not have her priorities right. Chantelle found this difficult as, through high school, she slept on average only four hours per night in order to discharge her study, work and caring duties. She developed an eating disorder at one point, which she now has under control.
Despite the obstacles, Chantelle’s resilience, optimism and diligence led to her being School Captain in Year 12 and being offered a place at the university of her choice to study Medicine. This had been her career goal since her mother’s diagnosis. Although it was difficult juggling lectures, laboratory pracs and her caring duties, she developed strategies to enable her to meet her study and caring schedules, as she had at high school with study and work.
However, after her first months in Medicine, Centrelink notified her that, due to studying more than 25 hours per week (essential for her course), she would lose her Carer Payment. Chantelle explored various options hoping to be able to continue her study, but the regulated financial constraints meant she was unable to complete her education and continue to care for her mother. She made the difficult decision to postpone her dream, possibly forever. Her family came first.
With regret, Chantelle transferred to a Psychology degree that she could undertake part time in order to meet Centrelink’s requirements. Now in her third year, Chantelle encourages policy‐makers to reconsider current funding arrangements so that young carers can complete their chosen study, saying: ‘Education is everything – what 16‐year old should have to work three jobs to finish high school?’ She also encourages greater awareness raising for teachers, as she says the statistics suggest there is a ‘carer in every class’, yet they are still an invisible minority whose needs should be mainstreamed like those of other disadvantaged groups.
33
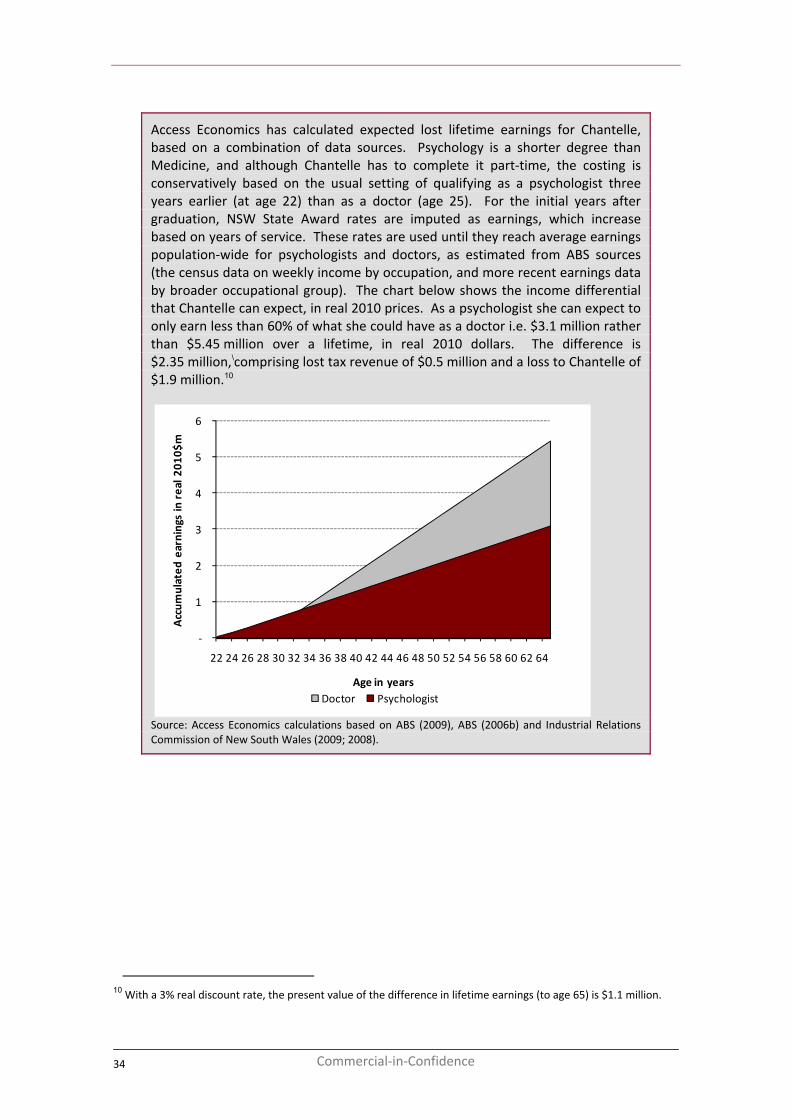
Access Economics has calculated expected lost lifetime earnings for Chantelle, based on a combination of data sources. Psychology is a shorter degree than Medicine, and although Chantelle has to complete it part‐time, the costing is conservatively based on the usual setting of qualifying as a psychologist three years earlier (at age 22) than as a doctor (age 25). For the initial years after graduation, NSW State Award rates are imputed as earnings, which increase based on years of service. These rates are used until they reach average earnings population‐wide for psychologists and doctors, as estimated from ABS sources (the census data on weekly income by occupation, and more recent earnings data by broader occupational group). The chart below shows the income differential that Chantelle can expect, in real 2010 prices. As a psychologist she can expect to only earn less than 60% of what she could have as a doctor i.e. $3.1 million rather than $5.45 million over a lifetime, in real 2010 dollars. The difference is $2.35 million,\comprising lost tax revenue of $0.5 million and a loss to Chantelle of $1.9 million.10
‐
1
2
3
4
5
6
22 24 26 28 30 32 34 36 38 40 42 44 46 48 50 52 54 56 58 60 62 64
Accum
ulated
earnings in real 2
010$
m
Age in yearsDoctor Psychologist
Source: Access Economics calculations based on ABS (2009), ABS (2006b) and Industrial Relations Commission of New South Wales (2009; 2008).
10 With a 3% real discount rate, the present value of the difference in lifetime earnings (to age 65) is $1.1 million.
34 Commercial‐in‐Confidence
The economic value of informal care in 2010
4 Who bears the cost of care?
Section 3.1 estimated the cost of income support to carers, estimated in total as $4.82 billion in 2010. In addition, there are payments made for education and training of carers, respite and other supportive program payments. This chapter assesses the relative contributions from government for informal and formal carers.
4.1 Support programs for carers
Support programs are generally aimed at reducing the amount of time a carer spends on providing care, enhancing quality of life for the carer and the care recipient, and delaying the need for institutionalisation. Services include respite care, and also interventions that reduce the dependence of care recipients such as memory clinics for patients with dementia and activity therapy programs designed to improve day‐to‐day activities (Sorenson, 2002).
Formal support programs are available to carers through programs such as:
■ the Home and Community Care (HACC) program;
■ Veterans’ Home Care;
■ dCommunity Age Care Packages (CACP);
■ Extended Aged Care in the Home (EACH) including dementia‐specific places (EACH‐D);
STDA) services; and
■ other government aged care and disability programs.
through respite care, counselling, education, and care planning and coordination services.
Health and Ageing, 2009). e di
■ rvices to assist carers in accessing general, short‐
and
■ Commonwealth State/Territory Disability Agreement (C
These are designed to assist carers
The National Respite for Carers Program is the main Commonwealth government program that funds respite services for carers. Respite may be provided at the carer’s home, or in other residential settings such as day centres, residential overnight cottage‐style accommodation or aged care facilities. It is estimated that around $202 million was spent in 2009‐10 by the Australian Government through the National Respite for Carers Program, equivalent to an average of $374 per annum for each primary carer (Department ofTh fferent components of the program are summarised below.11
Respite and Carelink Centres provide information and coordinate a national network of over 600 community‐based respite seterm and emergency respite services.
■ The Network of Carer Associations provides carers with professional counselling, specialist advice and information.
11 Based on http://www.health.gov.au/internet/main/publishing.nsf/Content/ageing‐carers‐nrcp.htm.
35
■ The National Carer Counselling Program provides counselling on a sessional basis and aims to address issues specific to carers such as carer stress, grief and loss, coping skills and transition issues.
Only a relatively small number of carers make use of respite care. In 2007‐08 13.7% of
ed 10.5 of
dd
g programs and resources ca
3.
educa g, and support for people with special needs);
mentia Training and Study Centres, which raise awareness of dementia issues in ng.
Wh of respite and support services, a particular area
30% r ealth proble for anxiety, depression or emotional problems, with 71% reporting that their caring
rly care recipients to enter a
potential respite care users accessed a service and the average length of stay for residential respite care was 3.3 weeks in that year (AIHW, 2009b). On average, each user receivhours of respite care per week. Respite care can also be received in‐home for short periodstime.
Carer Resource Centres provide information, support and advice to carers on a range of issues. Centres are located in each capital city and can be reached through a Freecall number.
In a ition, over the period 2005‐2009, the Australian Government allocated over $320 million to Dementia‐ a National Health Priority initiative, which included a number of programs that assist families and carers of people with dementia, as well as traininfor re workers and health professionals working with people with dementia, such as:
the National Dementia Support Program (including a helpline and referral service, memory and community centres, early intervention and counselling, information awareness
tion and trainin
4. Dementia Behaviour Management Advisory Services, which assist informal and formal carers in the management of behavioural and psychological symptoms of dementia; and
5. four Decarer traini
ile it is essential to provide a broad rangeof focus of this report is in providing education and training to carers, which we review in the next section.
4.2 Education and training
As discussed in the previous chapters, the responsibilities associated with being a carer may impact on carers’ mental and physical wellbeing. According to a survey of over 1000 carers,
ated their health as fair or poor and 49% reported a long‐standing physical hm (Cormac and Tihanyi, 2006). As well, 13% had consulted a GP in the past year
responsibilities made them feel worried. Kasuya et al (2000) has defined the carer burden as:
… a multidimensional response to physical, psychological, emotional, social, and financial stressors associated with the caregiving experience.
In light of this, it is important to improve accessibility to carer education and training programs to reduce the carer burden. Studies have shown that providing training for carers of stroke patients reduced costs of care while improving overall quality of life and psychosocial outcomes in carers at one year follow up (see for example, Patel et al, 2004; Kalra et al, 2004). Also, carer training and support may reduce the need for eldenursing home, thereby reducing the cost of long‐term care (Etters et al, 2008). According to the Resources for Enhancing Alzheimer’s Caregiver Health (REACH), a large randomised trial
36 Commercial‐in‐Confidence
The economic value of informal care in 2010
studying the effectiveness of interventions for carers of people with dementia, carers in the intervention group had a significantly lower carer burden score.
In a cost effectiveness analysis of a behaviour intervention program using the REACH II study with carers of patients with Alzheimer’s, it was found that this educational intervention provided carers with an extra one hour per day not spent in caregiving, at a cost of $5 per day.
network of resources to allow the carer to respond effectively to problems that arise. There is thus a close
ucational interventions have primarily domain‐specific effects rather than a generalised global effect (Sorensen et al, 2002). For example, providing education and training
line. These services provided information and education using multi‐media programs related to caregiving, and carers and care recipients could make direct
ediate avenues for support in the provision of care
In sum provision of training and support programs for carers has been shown to be nef
al, 200 :
sessions;
This means the additional cost to bring about one additional unit of benefit (i.e. the reduction in hours per day of providing care) is approximately $5. This is significant as it suggests that, at a relatively low additional cost, the intervention provided carers with extra time that they did not have to spend providing care.
Education and training generally aim to enhance the wellbeing and coping skills of carers by providing information about the care recipient’s condition, as well as providing a
nexus with support interventions – such as professional counselling with a trained professional or peer group support groups that focus on building rapport among carers and creating a forum through which they can discuss their problems, successes and feelings – which may reduce the stress and relieve the psychological conflicts that caregiving can bring.
Naturally, some ed
for carers about the care recipient’s condition and symptoms may improve their caregiving ability, but not necessarily improve their ability to cope with stress and other negative impacts on their mental health, which requires more specific interventions such as counselling and psychoeducation.
Other training interventions aim to cover multiple educational aspects, and can involve new technologies. An example is a project developed in the European Union involving Sweden, England, Northern Ireland, the Republic of Ireland and Portugal (Assisting Carers Using Telematics Interventions to meet Older persons’ Needs). The project involved setting up technology in the homes of a number of family carers – such as a television and remote control, a small set‐top box with CD‐ROM and a videoconferencing card, a small video‐camera lens and an ISDN telephone
contact with professional carers and other support networks via a video‐telephone. The trial found that the use of the technology increased carers and care recipients’ sense of control and provided direct and, at times, imm(Magnusson et al, 2002).
mary, thebe icial for their health and wellbeing, and programs need to be well targeted (Sorensen et
2) with consideration given to
■ the intensity of the program such as group or individual sessions and the number of
■ the extent to which participants adhere to the program including drop‐out rates and regularity of attendance; and
■ the type of relationship between the carer and the care recipient such as spousal, adult or young carer.
37
Currensector
ged Care Lifestyle and Diploma in Nursing (Enrolled Nurse
■
involved in the delivery of Australian Government‐subsidised CACP, EACH
and EACH‐D packages, with some 2,000 to 3,000 places per annum offered in Certificate
o r th of is Tab .1. enrolled nurse are based on the difference between the
international12 and domestic fees13 for a Certificate III in Aged care and Diploma of nursing respectively at some randomly selected institutions. The subsidy for a RN is based on the difference between the average of the fee rates charged to international students at 13 Australian universities14 and the HECS‐HELP contribution for 2010 (http://www.goingtouni.gov.au).
tly in Australia, there are a substantial investment in education and training for formal (paid) care workers, for example:
■ the Better Skills For Better Care Program, which funds the education and training of RAC workers through courses including Certificate III in Aged Care, Certificate IV in Aged Care, Certificate IV in AQualifications) at around $29 million per annum;
the Support for Aged Care Training program, which provides training to upgrade skills of personal care workers in 600 smaller regional RAC services, cost $30 million over the four years to June 2010;
■ the Community Aged Care Workforce Program, which supports training for personal care workers
III in Home and Community Care and Certificate IV in Service Coordination; and
■ other programs specifically for education in dementia care – such as Dementia Care Essentials.
Information n subsidies fo e education paid carers presented in le 4 The subsidies for a personal carer and
12 TAFE SA (http://www.courses.tafesa.edu.au/xml/prospectus/ip_Y.aspx), TAFE NSW (http://www.detinternational.nsw.edu.au/tafe/courses/certificate_diploma_courses/c18167.html) Education and Training International WA (http://www.eti.wa.edu.au/course‐catalogue/health‐and‐community‐services/diploma‐of‐nursing‐enrolled‐/‐division‐2‐nursing.html).
13 TAFE SA (http://www.courses.tafesa.edu.au/xml/prospectus/ip_Y.aspx), TAFE NSW https://www.tafensw.edu.au/courses/fees/tafensw.htm), TAFE WA (http://www.tafe.wa.edu.au/FutureStudents/Pages/FeeAndCharges.aspx#loc1a).
14 Universities were included based on the share of their state or territory’s nursing graduates that they produced in 2008 (DEEWR, 2008). Institutions were included in order of magnitude (largest to smallest) until 70% of graduates the state or territory were accounted for. The universities included were Charles Sturt University(http://datasearch.uts.edu.au/international/prospective/studying/fees/course_fees.cfm), University of Technology Sydney (http://www.csu.edu.au/division/finserv/fees/future/internat_onshore.html),University of Western Sydney (http://www.uow.edu.au/future/international/apply/fees/index.html), Deakin University (http://www.deakin.edu.au/future‐students/international/fees.php#tuition_fees___1), La Trobe University (http://www.latrobe.edu.au/coursefinder/international/2011/Bachelor‐of‐Nursing‐%28Pre‐registration%29.6584.html), Monash University (http://www.monash.edu.au/study/coursefinder/course/0727/), Victoria University (http://www.vu.edu.au/courses/international/bachelor‐of‐nursing‐hbbn), Griffith University (http://www17.griffith.edu.au/cis/p_cat/fees.asp?ProgCode=1165&FeeType=Undergraduate), Queensland University of Technology (http://www.courses.qut.edu.au/cgi‐bin/WebObjects/Courses.woa/wa/selectMajorFromMain?courseID=9631), The Flinders University of South Australia (http://www.flinders.edu.au/courses/undergrad/bngu/), University of Australia (http://www.unisanet.unisa.edu.au/programs/program.asp?Program=IBNU&Year=2010), University of Tasmania (http://www.international.utas.edu.au/static/HowtoApply/ApplicationsforBachelorofNursing.php), Australian Catholic University (http://www.acu.edu.au/courses/undergraduate/nursing/bachelor_of_nursing/). Information on full fees could not be found for Central Queensland University, The University of Newcastle, University of Southern Queensland, Curtin University of Technology, Edith Cowan University, University of Canberra and Charles Darwin University ‐‐ all of which were eligible for inclusion.
38 Commercial‐in‐Confidence
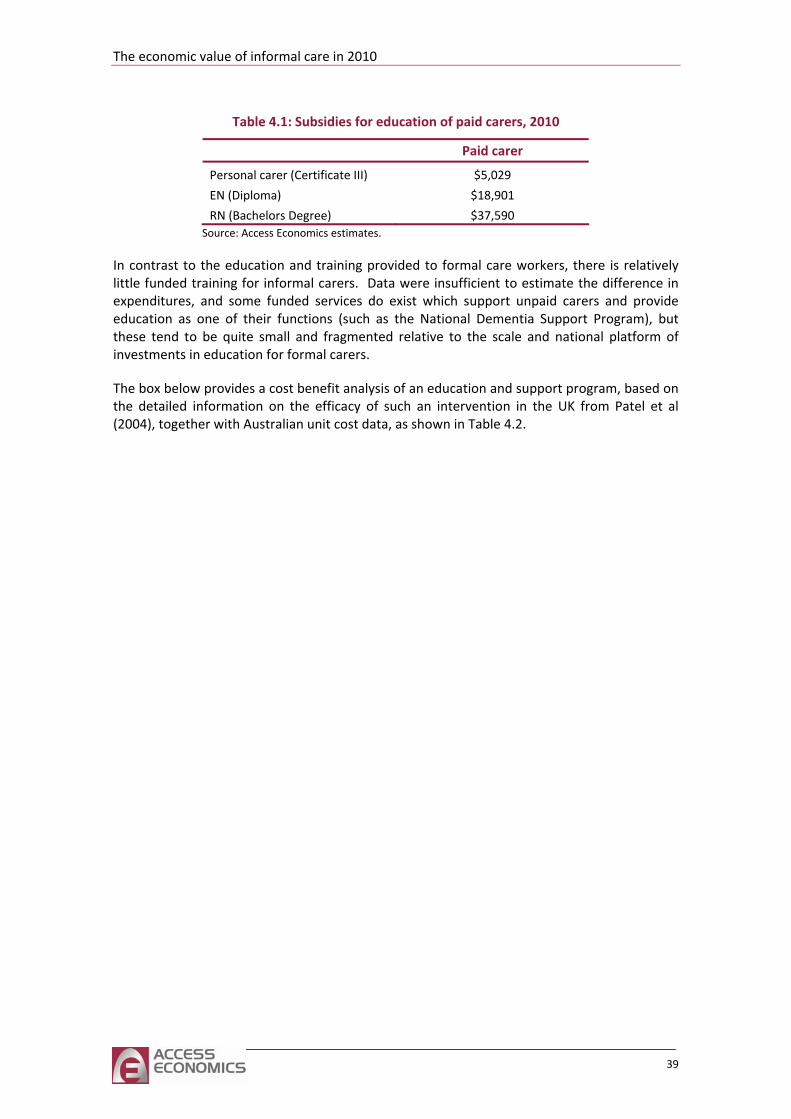
The economic value of informal care in 2010
39
Table 4.1: Subsidies for education of paid carers, 2010
Paid carer
Personal carer (Certificate III) $5,029
EN (Diploma) $18,901
RN (Bachelors Degree) $37,590 Source: Access Economics estimates.
In contrast to the education and training provided to formal care workers, there is relatively little funded training for informal carers. Data were insufficient to estimate the difference in expenditures, and some funded services do exist which support unpaid carers and provide education as one of their functions (such as the National Dementia Support Program), but these tend to be quite small and fragmented relative to the scale and national platform of investments in education for formal carers.
The box below provides a cost benefit analysis of an education and support program, based on the detailed information on the efficacy of such an intervention in the UK from Patel et al (2004), together with Australian unit cost data, as shown in Table 4.2.
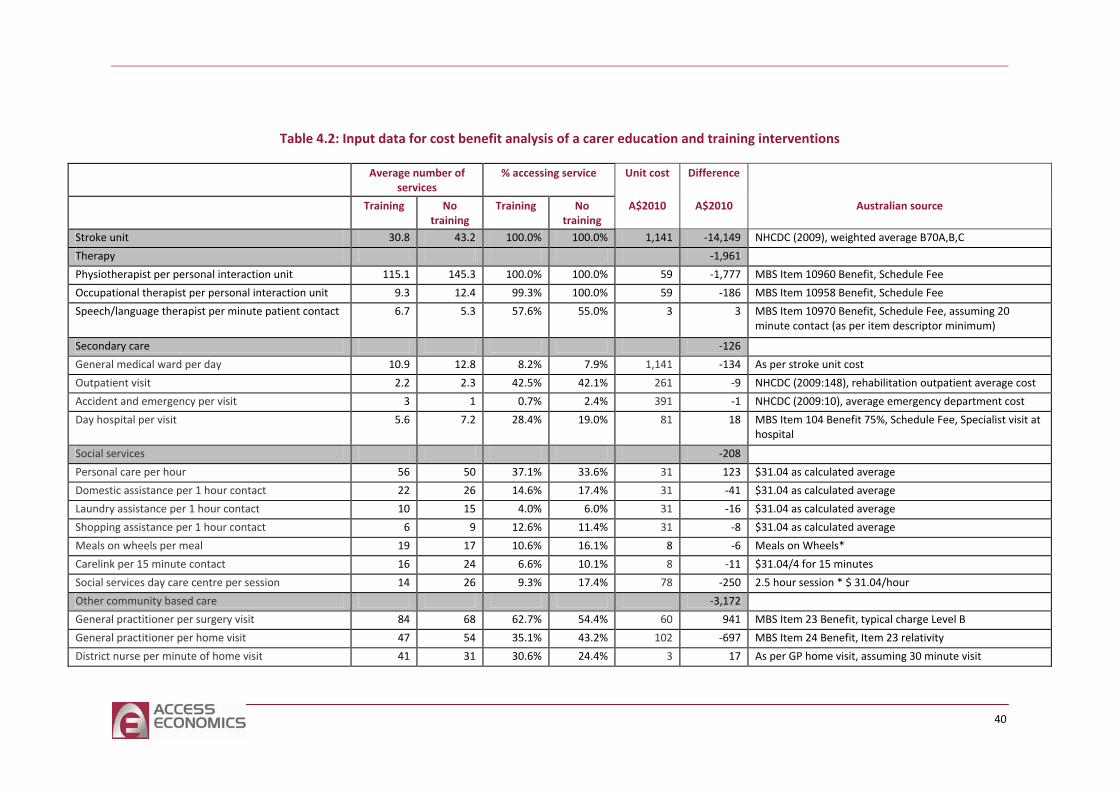
Table 4.2: Input data for cost benefit analysis of a carer education and training interventions
Average number of services
% accessing service Unit cost Difference
Training No training
Training No training
A$2010 A$2010 Australian source
Stroke unit 30.8 43.2 100.0% 100.0% 1,141 ‐14,149 NHCDC (2009), weighted average B70A,B,C
Therapy ‐1,961
Physiotherapist per personal interaction unit 115.1 145.3 100.0% 100.0% 59 ‐1,777 MBS Item 10960 Benefit, Schedule Fee
Occupational therapist per personal interaction unit 9.3 12.4 99.3% 100.0% 59 ‐186 MBS Item 10958 Benefit, Schedule Fee
Speech/language therapist per minute patient contact 6.7 5.3 57.6% 55.0% 3 3 MBS Item 10970 Benefit, Schedule Fee, assuming 20 minute contact (as per item descriptor minimum)
Secondary care ‐126
General medical ward per day 10.9 12.8 8.2% 7.9% 1,141 ‐134 As per stroke unit cost
Outpatient visit 2.2 2.3 42.5% 42.1% 261 ‐9 NHCDC (2009:148), rehabilitation outpatient average cost
Accident and emergency per visit 3 1 0.7% 2.4% 391 ‐1 NHCDC (2009:10), average emergency department cost
Day hospital per visit 5.6 7.2 28.4% 19.0% 81 18 MBS Item 104 Benefit 75%, Schedule Fee, Specialist visit at hospital
Social services ‐208
Personal care per hour 56 50 37.1% 33.6% 31 123 $31.04 as calculated average
Domestic assistance per 1 hour contact 22 26 14.6% 17.4% 31 ‐41 $31.04 as calculated average
Laundry assistance per 1 hour contact 10 15 4.0% 6.0% 31 ‐16 $31.04 as calculated average
Shopping assistance per 1 hour contact 6 9 12.6% 11.4% 31 ‐8 $31.04 as calculated average
Meals on wheels per meal 19 17 10.6% 16.1% 8 ‐ Meals on Wheels* 6
Carelink per 15 minute contact 16 24 6.6% 10.1% 8 ‐11 $31.04/4 for 15 minutes
Social services day care centre per session 14 26 9.3% 17.4% 78 ‐250 2.5 hour session * $ 31.04/hour
Other community based care ‐3,172
General practitioner per surgery visit 84 68 62.7% 54.4% 60 941 MBS Item 23 Benefit, typical charge Level B
General practitioner per home visit 47 54 35.1% 43.2% 102 ‐697 MBS Item 24 Benefit, Item 23 relativity
District nurse per minute of home visit 41 31 30.6% 24.4% 3 17 As per GP home visit, assuming 30 minute visit
40
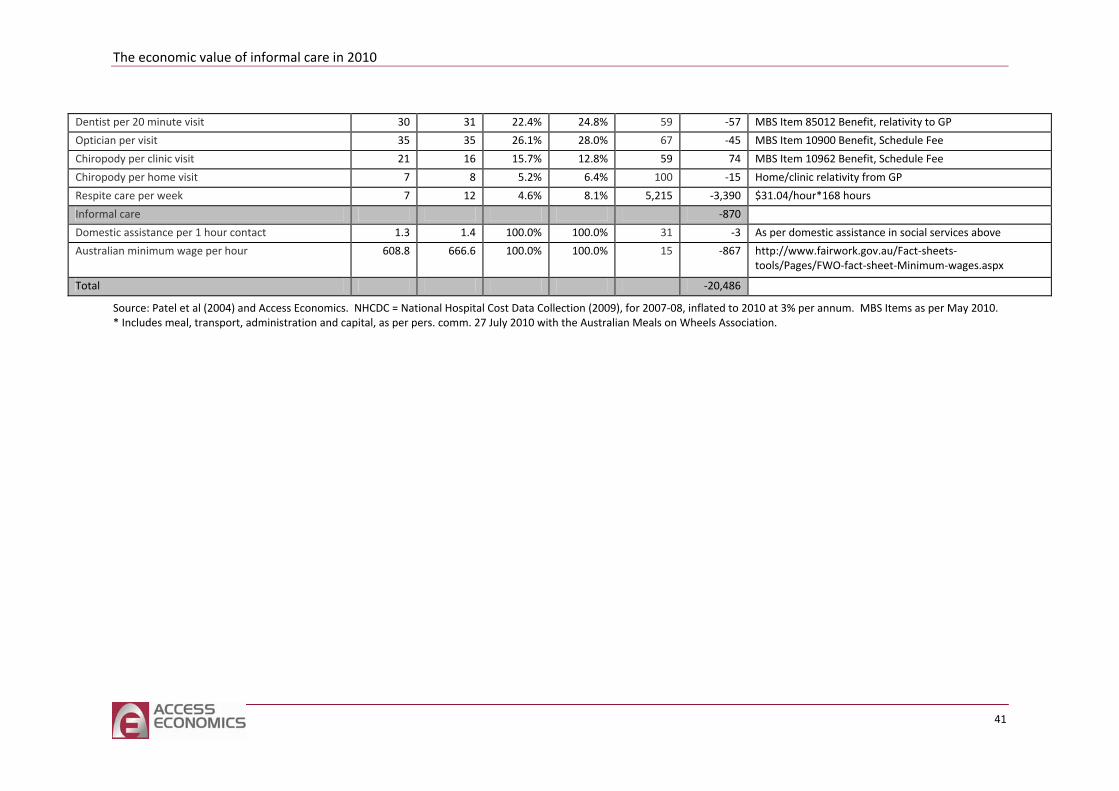
The
economic value of informal care in 2010
41
Dentist per 20 minute visit 30 31 22.4% 24.8% 59 ‐57 MBS Item 85012 Benefit, relativity to GP
Optician per visit 35 35 26.1% 28.0% 67 ‐45 MBS Item 10900 Benefit, Schedule Fee
Chiropody per clinic visit 21 16 15.7% 12.8% 59 74 MBS Item 10962 Benefit, Schedule Fee
Chiropody per home visit 7 8 5.2% 6.4% 100 ‐15 Home/clinic relativity from GP
Respite care per week 7 12 4.6% 8.1% 5,215 ‐3,390 $31.04/hour*168 hours
Informal care ‐870
Domestic assistance per 1 hour contact 1.3 1.4 100.0% 100.0% 31 ‐3 As per domestic assistance in social services above
Australian minimum wage per hour 608.8 666.6 100.0% 100.0% 15 ‐867 http://www.fairwork.gov.au/Fact‐sheets‐tools/Pages/FWO‐fact‐sheet‐Minimum‐wages.aspx
Total ‐20,486
Source: Patel et al (2004) and Access Economics. NHCDC = National Hospital Cost Data Collection (2009), for 2007‐08, inflated to 2010 at 3% per annum. MBS Items as per May 2010. * Includes meal, transport, administration and capital, as per pers. comm. 27 July 2010 with the Australian Meals on Wheels Association.

The economic value of informal care in 2010
Case study: Cost benefit analysis of a carer training program
There are few randomised clinical trials of informal carer training. One UK study randomised 300 stroke patients and their carers into two groups – one receiving training and the other receiving no training. The training comprised instructions in basic skills of moving and handling, facilitation of activities of daily living, and simple nursing tasks. The carers received the training over three to five sessions, lasting 30‐45 minutes each, with a follow up session at home (Patel et al, 2004).
The UK study showed that total health and social care costs over one year for people whose carers received training were significantly lower than for those who did not receive training, saving £4,043 per person per annum on average (in 2000‐01 prices) in this rehabilitative care setting.
We investigated what the impacts would be if Australian cost data were imputed to simulate a similar intervention here in 2010. Using data from the Medicare Benefits Schedule, National Hospital Cost Data Collection, this report and other sources, we estimated the costs saved from utilisation rates and unit cost data shown in Table 4.2 above.
The savings from the intervention were estimated as A$20,486 per person in 2010. Over two thirds (69%) of the savings were from fewer days in hospital, while 15% were savings from reduced use of other community health services such as GP home visits and respite care. A further 10% of the savings were from reduced use of physiotherapy and occupational therapy services. There was also a reduction in the informal care burden, which comprised 6% of the benefits (with the carer’s time valued at the minimum wage in this case, to match the UK method).
The cost of delivering the training ranged from A$342 (three 30‐minute sessions and one home visit) to A$651 (five 45‐minute sessions and one home visit) per trained carer in 2010 prices. Imputing a 100% loading for the cost of initial development of the training material, the benefit cost ratio ranged from 16:1 to 30:1.
The cost benefit analysis reveals that carer training can provide a substantial net benefit – over $19,000 per annum per person – through reducing reliance on formal health sector and community services relative to a situation of no carer training. A similar randomised controlled trial should be conducted in Australia to confirm these modelled findings, potentially across a variety of care settings.
4.3 Comparison of different care models
There is growing interest in the costs and benefits, from both a private and public perspective, of alternative means of providing care services. There is a continuum of care models currently provided in Australia ranging from reliance solely on an informal carer, ‘ageing in place’ with the assistance of an informal carer and some form of subsidised community care package (HACC or CACP), to higher levels of care provided either in the home (EACH, EACH‐D) or in a
43
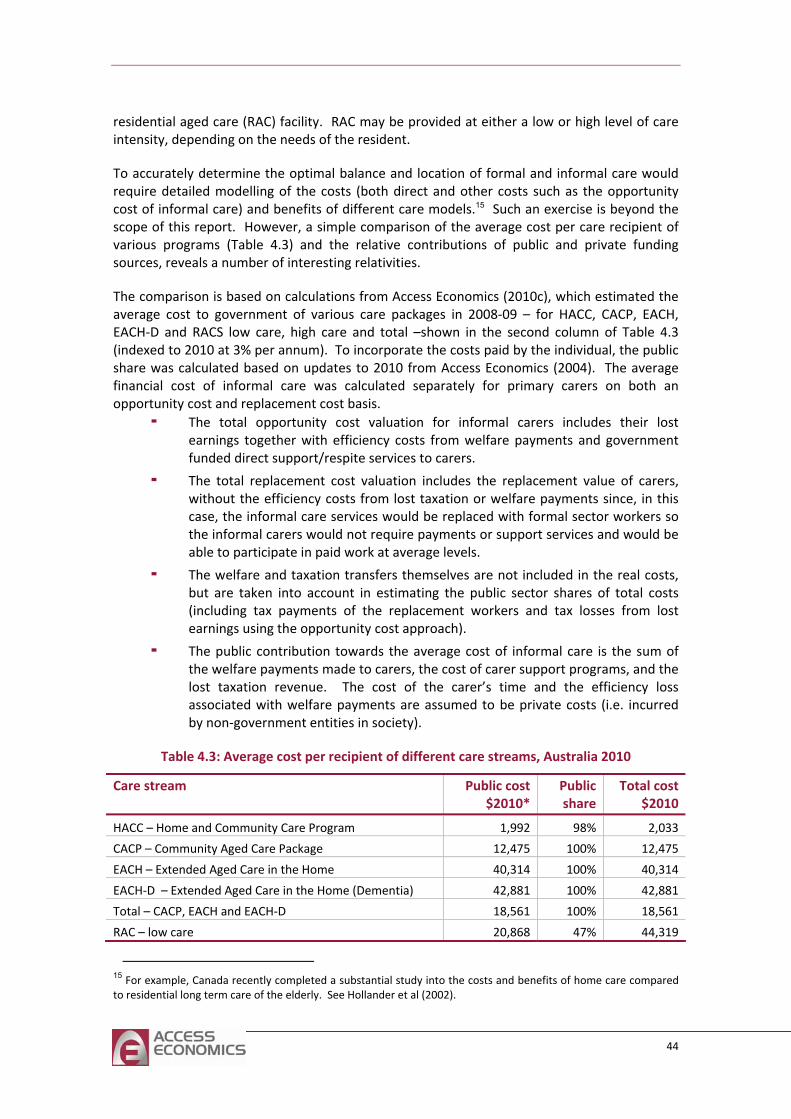
residential aged care (RAC) facility. RAC may be provided at either a low or high level of care intensity, depending on the needs of the resident.
To accurately determine the optimal balance and location of formal and informal care would require detailed modelling of the costs (both direct and other costs such as the opportunity cost of informal care) and benefits of different care models.15 Such an exercise is beyond the scope of this report. However, a simple comparison of the average cost per care recipient of various programs (Table 4.3) and the relative contributions of public and private funding sources, reveals a number of interesting relativities.
The comparison is based on calculations from Access Economics (2010c), which estimated the average cost to government of various care packages in 2008‐09 – for HACC, CACP, EACH, EACH‐D and RACS low care, high care and total –shown in the second column of Table 4.3 (indexed to 2010 at 3% per annum). To incorporate the costs paid by the individual, the public share was calculated based on updates to 2010 from Access Economics (2004). The average financial cost of informal care was calculated separately for primary carers on both an opportunity cost and replacement cost basis.
The total opportunity cost valuation for informal carers includes their lost earnings together with efficiency costs from welfare payments and government funded direct support/respite services to carers.
The total replacement cost valuation includes the replacement value of carers, without the efficiency costs from lost taxation or welfare payments since, in this case, the informal care services would be replaced with formal sector workers so the informal carers would not require payments or support services and would be able to participate in paid work at average levels.
The welfare and taxation transfers themselves are not included in the real costs, but are taken into account in estimating the public sector shares of total costs (including tax payments of the replacement workers and tax losses from lost earnings using the opportunity cost approach).
The public contribution towards the average cost of informal care is the sum of the welfare payments made to carers, the cost of carer support programs, and the lost taxation revenue. The cost of the carer’s time and the efficiency loss associated with welfare payments are assumed to be private costs (i.e. incurred by non‐government entities in society).
Table 4.3: Average cost per recipient of different care streams, Australia 2010
Care stream Public cost $2010*
Public share
Total cost $2010
HACC – Home and Community Care Program 1,992 98% 2,033
CACP – Community Aged Care Package 12,475 100% 12,475
EACH – Extended Aged Care in the Home 40,314 100% 40,314
EACH‐D – Extended Aged Care in the Home (Dementia) 42,881 100% 42,881
Total – CACP, EACH and EACH‐D 18,561 100% 18,561
RAC – low care 20,868 47% 44,319
15 For example, Canada recently completed a substantial study into the costs and benefits of home care compared to residential long term care of the elderly. See Hollander et al (2002).
44
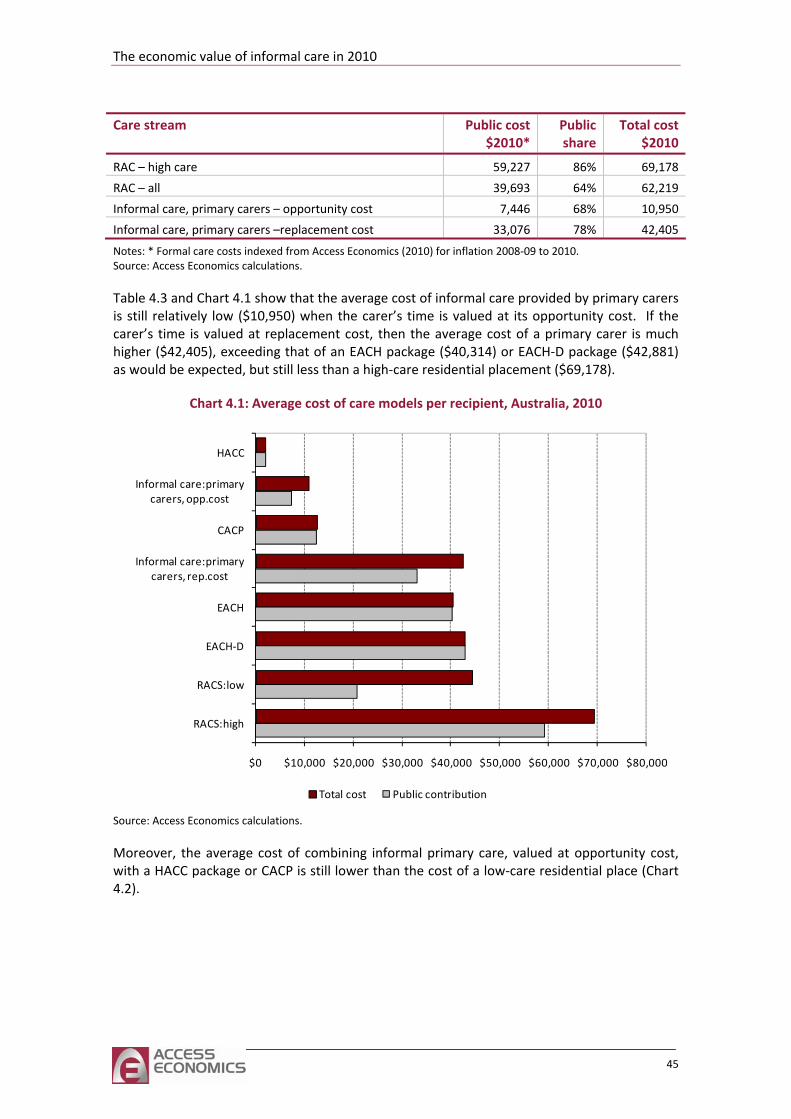
The economic value of informal care in 2010
Care stream Public cost $2010*
Public share
Total cost $2010
RAC – high care 59,227 86% 69,178
RAC – all 39,693 64% 62,219
Informal care, primary carers – opportunity cost 7,446 68% 10,950
Informal care, primary carers –replacement cost 33,076 78% 42,405
Notes: * Formal care costs indexed from Access Economics (2010) for inflation 2008‐09 to 2010. Source: Access Economics calculations.
Table 4.3 and Chart 4.1 show that the average cost of informal care provided by primary carers is still relatively low ($10,950) when the carer’s time is valued at its opportunity cost. If the carer’s time is valued at replacement cost, then the average cost of a primary carer is much higher ($42,405), exceeding that of an EACH package ($40,314) or EACH‐D package ($42,881) as would be expected, but still less than a high‐care residential placement ($69,178).
Chart 4.1: Average cost of care models per recipient, Australia, 2010
$0 $10,000 $20,000 $30,000 $40,000 $50,000 $60,000 $70,000 $80,000
RACS:high
RACS:low
EACH‐D
EACH
Informal care:primary carers, rep.cost
CACP
Informal care:primarycarers, opp.cost
HACC
Total cost Public contribution
Source: Access Economics calculations.
Moreover, the average cost of combining informal primary care, valued at opportunity cost, with a HACC package or CACP is still lower than the cost of a low‐care residential place (Chart 4.2).
45
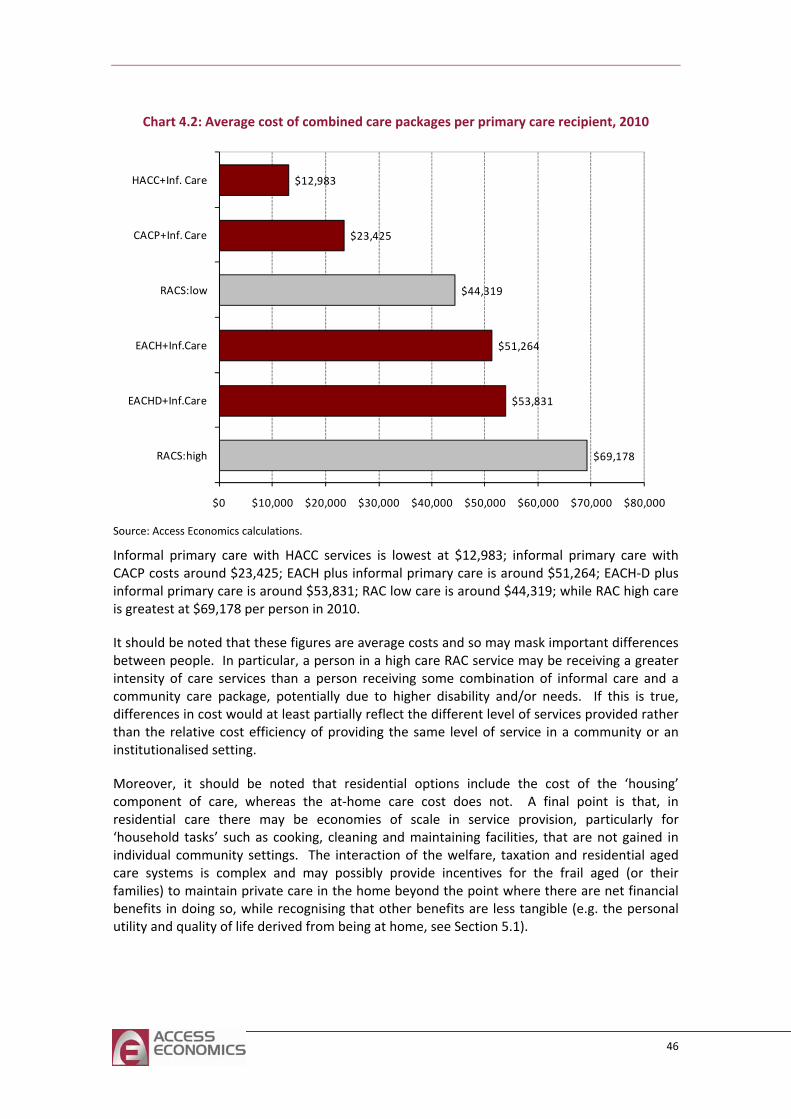
Chart 4.2: Average cost of combined care packages per primary care recipient, 2010
$69,178
$53,831
$51,264
$44,319
$23,425
$12,983
$0 $10,000 $20,000 $30,000 $40,000 $50,000 $60,000 $70,000 $80,000
RACS:high
EACHD+Inf.Care
EACH+Inf.Care
RACS:low
CACP+Inf. Care
HACC+Inf. Care
Source: Access Economics calculations.
Informal primary care with HACC services is lowest at $12,983; informal primary care with CACP costs around $23,425; EACH plus informal primary care is around $51,264; EACH‐D plus informal primary care is around $53,831; RAC low care is around $44,319; while RAC high care is greatest at $69,178 per person in 2010.
It should be noted that these figures are average costs and so may mask important differences between people. In particular, a person in a high care RAC service may be receiving a greater intensity of care services than a person receiving some combination of informal care and a community care package, potentially due to higher disability and/or needs. If this is true, differences in cost would at least partially reflect the different level of services provided rather than the relative cost efficiency of providing the same level of service in a community or an institutionalised setting.
Moreover, it should be noted that residential options include the cost of the ‘housing’ component of care, whereas the at‐home care cost does not. A final point is that, in residential care there may be economies of scale in service provision, particularly for ‘household tasks’ such as cooking, cleaning and maintaining facilities, that are not gained in individual community settings. The interaction of the welfare, taxation and residential aged care systems is complex and may possibly provide incentives for the frail aged (or their families) to maintain private care in the home beyond the point where there are net financial benefits in doing so, while recognising that other benefits are less tangible (e.g. the personal utility and quality of life derived from being at home, see Section 5.1).
46
The economic value of informal care in 2010
5 Conclusions and implications for the future
The previous sections of this report have attempted to identify and place a financial value on current levels of informal care. It is clear that informal carers provide a considerable proportion of Australians’ care needs, in conjunction with formal care providers. However, estimates of the value of informal care may raise a number of related policy questions.
■ Are current models of care the most appropriate method of care provision, both now and in the future?
What will happen to the demand and supply of informal care in future?
How cost effective are different models of care provision, when all the costs and benefits, including the cost of carer time are included?
Would it be more efficient for some informal carers to return to the paid workforce, with care needs met by the formal sector instead?
■ Are carers appropriately remunerated for the value they provide?
How is the burden of care distributed between the carer, their family and the wider community?
What are the most effective means of supporting carers?
Policy issues such as these require consideration of both efficiency and equity criteria. Efficiency considers whether economic resources, including labour, are used in a manner which maximises the welfare of Australians (‘the size of the cake’). Equity, on the other hand, considers how costs and (‘the slices of the cake’).
benefits of resource allocation are distributed among the community
al, 2
ng older age groups;
‘ageing in place’;
fertility);
■ and dispersion of families;
The equity‐efficiency trade off can be complex. This section of the report does not present a comprehensive policy prescription, but notes some of the questions and evidence that will need to be considered by Government.
5.1 Informal care demand and supply
A number of studies have pointed to the potential impact of long term demographic and social trends on the demand and supply of informal care in Australia. These trends include (Jenkins et 003):
■ demographic ageing of the Australian population;
■ higher prevalence of chronic illness and associated disability amo
■ deinstitutionalisation and greater emphasis on
■ increased female labour force participation;
■ increased rates of relationship breakdown;
■ (reduced smaller families and increased childlessness
■ older parent carers of adult children with disabilities;
greater mobility
47
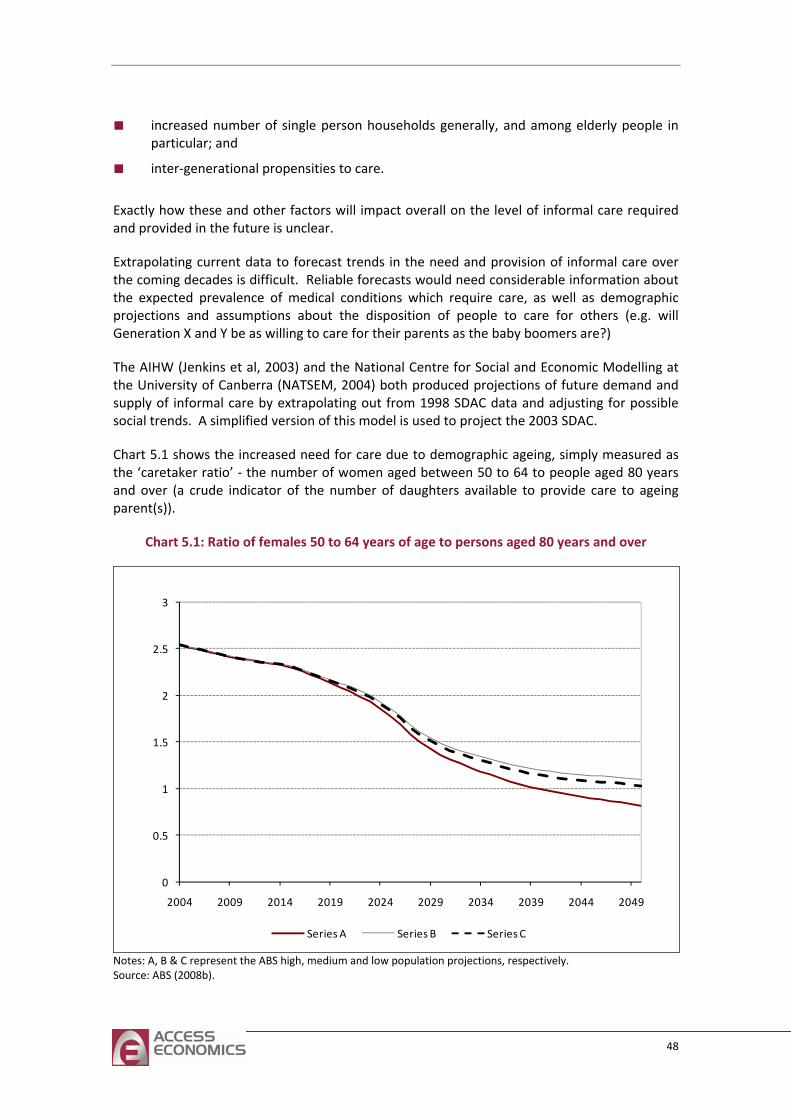
■ increased number of single person households generally, and among elderly people in particular; and
■ inter‐generational propensities to care.
Exactly how these and other factors will impact overall on the level of informal care required and provided in the future is unclear.
Extrapolating current data to forecast trends in the need and provision of informal care over
s. A simplified version of this model is used to project the 2003 SDAC.
Char as the ‘caretaker ratio’ ‐ the number of women aged between 50 to 64 to people aged 80 years
the coming decades is difficult. Reliable forecasts would need considerable information about the expected prevalence of medical conditions which require care, as well as demographic projections and assumptions about the disposition of people to care for others (e.g. will Generation X and Y be as willing to care for their parents as the baby boomers are?)
The AIHW (Jenkins et al, 2003) and the National Centre for Social and Economic Modelling at the University of Canberra (NATSEM, 2004) both produced projections of future demand and supply of informal care by extrapolating out from 1998 SDAC data and adjusting for possible social trend
t 5.1 shows the increased need for care due to demographic ageing, simply measured
and over (a crude indicator of the number of daughters available to provide care to ageing parent(s)).
Chart 5.1: Ratio of females 50 to 64 years of age to persons aged 80 years and over
0
0.5
1
1.5
2
2.5
3
2004 2009 2014 2019 2024 2029 2034 2039 2044 2049
Series A Series B Series C
Notes: A, B & C represent the ABS high, medium and low population projections, respectively. Source: ABS (2008b).
48
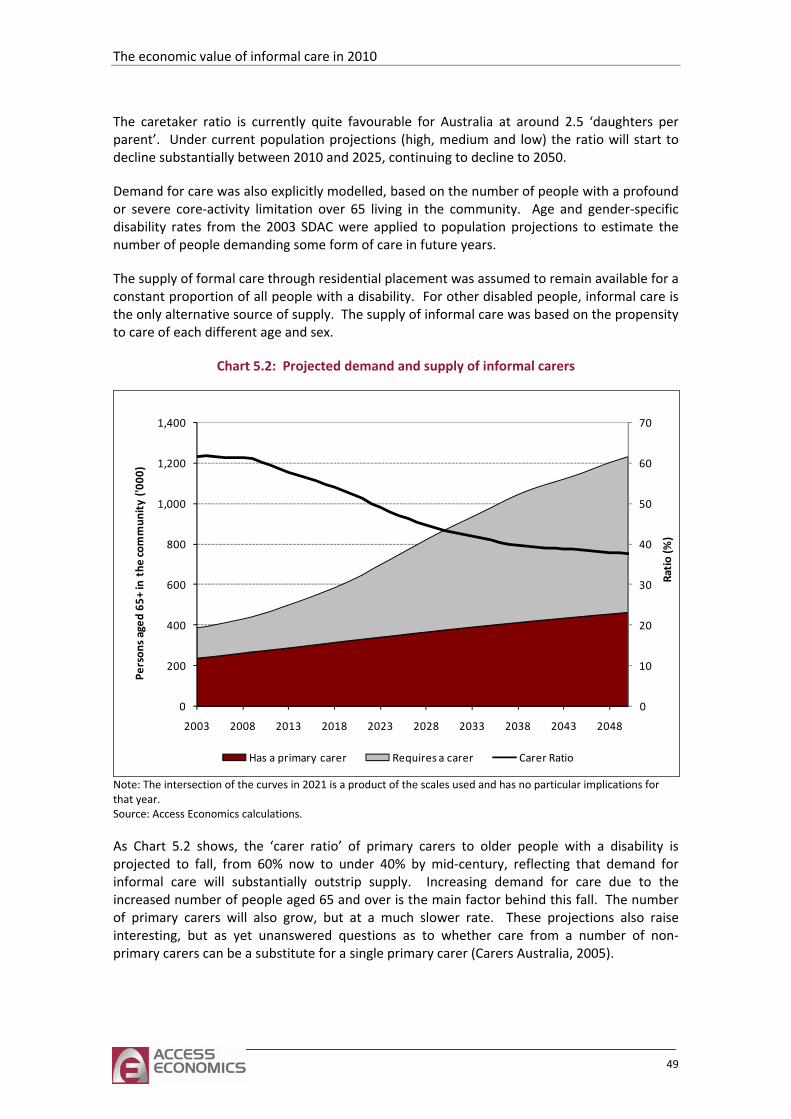
The economic value of informal care in 2010
The caretaker ratio is currently quite favourable for Australia at around 2.5 ‘daughters per parent’. Under current population projections (high, medium and low) the ratio will start to decline substantially between 2010 and 2025, continuing to decline to 2050.
Demand for care was also explicitly modelled, based on the number of people with a profound
The supply of formal care through residential placement was assumed to remain available for a constant propor informal care is the only alternative source of supply. The supply of informal care was based on the propensity
or severe core‐activity limitation over 65 living in the community. Age and gender‐specific disability rates from the 2003 SDAC were applied to population projections to estimate the number of people demanding some form of care in future years.
tion of all people with a disability. For other disabled people,
to care of each different age and sex.
Chart 5.2: Projected demand and supply of informal carers
0
10
20
30
40
50
60
70
0
200
400
600
800
1,000
1,200
1,400
Ratio (%
)
Person
s aged
65+
in the
commun
ity ('0
00)
2003 2008 2013 2018 2023 2028 2033 2038 2043 2048
Has a primary carer Requires a carer Carer Ratio
Note: The intersection of the curves in 2021 is a product of the scales used and has no particular implications for that year. Source: Access Economics calculations.
As Chart 5.2 shows, the ‘carer ratio’ of primary carers to older people with a disability is projected to fall, from 60% now to under 40% by mid‐century, reflecting that demand for informal care will substantially outstrip supply. Increasing demand for care due to the increased number of people aged 65 and over is the main factor behind this fall. The number
Australia, 2005).
of primary carers will also grow, but at a much slower rate. These projections also raise interesting, but as yet unanswered questions as to whether care from a number of non‐primary carers can be a substitute for a single primary carer (Carers
49
Scenario analysis was conducted to show how the projected supply of carers would differ if change reduced or increased the propensity of particular groups in society to provide Specifically, the three scenarios
socialcare. considered were as follows.
who are already in paid employment when the decision to provide care arises are less likely to do so than those who are not. The probability of
Scenario 3 shows the effect of an increasing male life expectancy, resulting in a small increase
rent, or a combination, of
con receivingld
Regarscena
■ An overall decline in the propensity of people to care, represented by a 20% across‐the‐board decrease in carer rates.
■ A decline in the propensity of women to reduce paid employment in order to provide care, represented by a 20% decrease in the proportion of women reducing paid employment to care.
■ An increase in the availability of carers due to converging male and female life expectancy, represented by a 20% increase in carer rates in 65+ age group.
The first scenario (grey line in Chart 5.3), a decline in across the board carer rates, has the largest impact on the deficit of informal carers. By construction, under this scenario there would be 20% less informal carers by 2050. There are many reasons why such a scenario could occur. Higher divorce rates, smaller family size and a decreasing propensity of generation X and Y to care for the elderly are all potential contributors (Access Economics, 2010b).
The second scenario (the dashed black line in Chart 5.3) results in a more moderate decline in the shortage of informal care than scenario 1. Working age females are an important source of informal care, so increasing female workforce participation reduces the hours available to provide informal care., In addition, ageing of the population will result in a tighter labour market, raising wages and thereby increasing the opportunity cost of reducing paid employment to provide unpaid informal care. Carmichael et al (2010) found, using the British Household Panel Survey, that people
choosing not to provide unpaid care increases as wages increase. However, the use of part‐time and other more flexible work arrangements has also increased, potentially providing greater opportunity to combine work and care roles (Howe and Sergeant, 1999). Female workforce participation and preference is likely to continue to change as family circumstances change (Glezer and Wolcott, 1997).
in the availability of care by those over 65. This scenario is based on the premise that spouses are an important source of informal care (although increasing rates of divorce may partially or fully offset such an effect). A higher male life expectancy could increase the supply of informal care, assuming this increase in longevity was associated with an increase in the number of years without or with minimal disablement.
In the base case there is already a deficit in 2010, which is projected to increase under all three scenarios by 2050. This deficit may be a result of several diffefactors. First, there may already be unmet need for informal carers in the community. Se d, the analysis only includes primary carers and an unknown proportion of people may
ratherbe care from one or more non‐primary carers than a primary carer. Finally, it cou be a result of disconnect between data sources as a result of reporting errors.
dless of the accuracy of the initial deficit, the change in the deficit under the different rios is informative. The findings are summarised as follows.
■ An overall decline in the propensity of people to care, represented by a 20% across‐the‐board decrease in carer rates, increased the base case deficit by 12.1% in 2050.
50
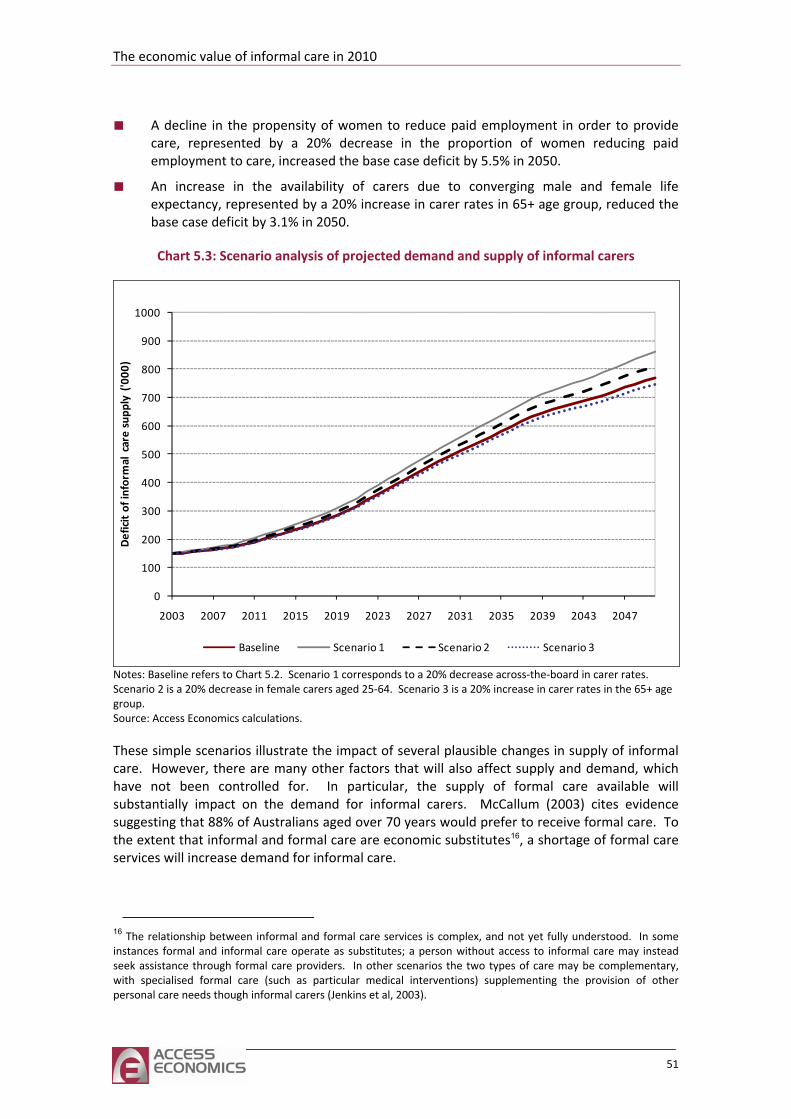
The economic value of informal care in 2010
■ ovide care, represented by a 20% decrease in the proportion of women reducing paid A decline in the propensity of women to reduce paid employment in order to pr
employment to care, increased the base case deficit by 5.5% in 2050.
■ An increase in the availability of carers due to converging male and female life expectancy, represented by a 20% increase in carer rates in 65+ age group, reduced the base case deficit by 3.1% in 2050.
Chart 5.3: Scenario analysis of projected demand and supply of informal carers
0
0
300
400
500
600
700
800
900
1000
ficit of informal care supp
ly ('000
)
10
200De
2003 2007 2011 2015 2019 2023 2027 2031 2035 2039 2043 2047
Baseline Scenario 1 Scenario 2 Scenario 3
Notes: Baseline refers to Chart 5.2. Scenario 1 corresponds to a 20% decrease across‐the‐board in carer rates. Scenario 2 is a 20% decrease in female carers aged 25‐64. Scenario 3 is a 20% increase in carer rates in the 65+ age group. Source: Access Economics calculations.
These simple scenarios illustrate the impact of several plausible changes in supply of informal care. However, there are many other factors that will also affect supply and demand, which have not been controlled for. In particular, the supply of formal care available will substantially impact on the demand for informal carers. McCallum (2003) cites evidence suggesting that 88% of Australians aged over 70 years would prefer to receive formal care. To the extent that informal and formal care are economic substitutes16, a shortage of formal care services will increase demand for informal care.
16 The relationship between informal and formal care services is complex, and not yet fully understood. In some instances formal and informal care operate as substitutes; a person without access to informal care may instead seek assistance through formal care providers. In other scenarios the two types of care may be complementary, with specialised formal care (such as particular medical interventions) supplementing the provision of other personal care needs though informal carers (Jenkins et al, 2003).
51
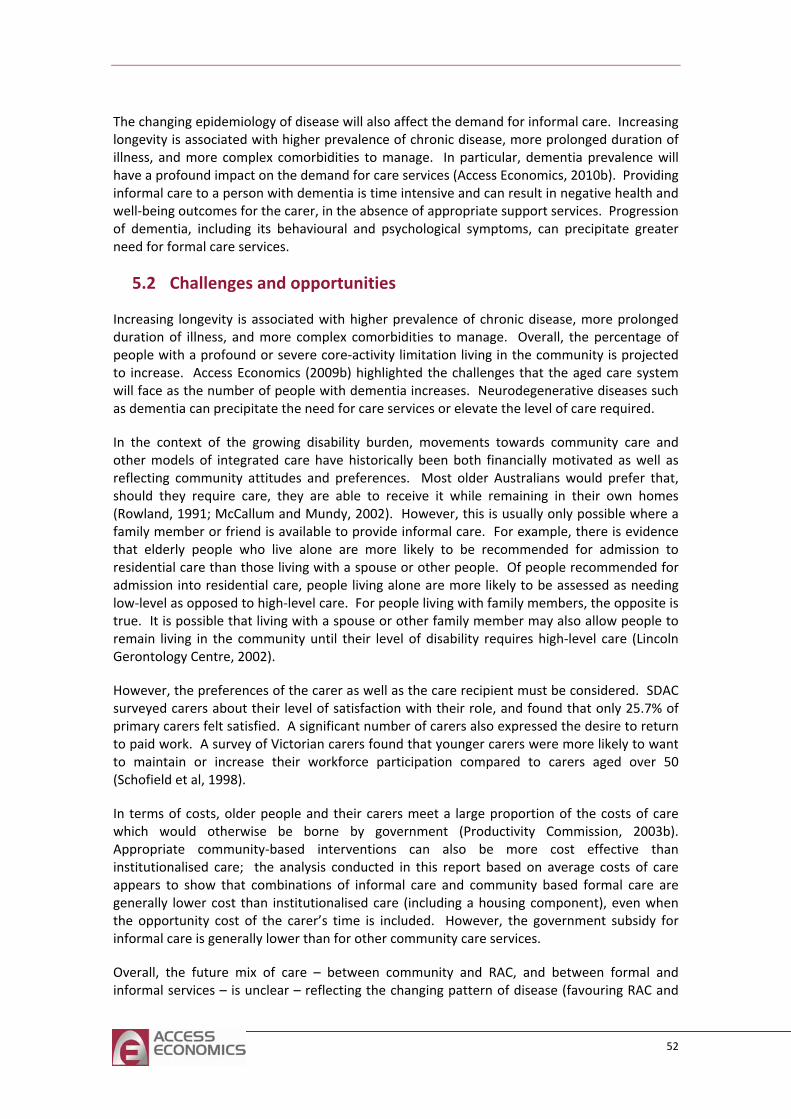
Th fect the demand for informal care. Increasing longevity is associated with higher prevalence of chronic disease, more prolonged duration of
ey are able to receive it while remaining in their own homes (Rowland, 1991; McCallum and Mundy, 2002). However, this is usually only possible where a
living with a spouse or other family member may also allow people to remain living in the community until their level of disability requires high‐level care (Lincoln
c
community care services.
Overall, the future mix of care – between community and RAC, and between formal and informal services – is unclear – reflecting the changing pattern of disease (favouring RAC and
e changing epidemiology of disease will also af
illness, and more complex comorbidities to manage. In particular, dementia prevalence will have a profound impact on the demand for care services (Access Economics, 2010b). Providing informal care to a person with dementia is time intensive and can result in negative health and well‐being outcomes for the carer, in the absence of appropriate support services. Progression of dementia, including its behavioural and psychological symptoms, can precipitate greater need for formal care services.
5.2 Challenges and opportunities
Increasing longevity is associated with higher prevalence of chronic disease, more prolonged duration of illness, and more complex comorbidities to manage. Overall, the percentage of people with a profound or severe core‐activity limitation living in the community is projected to increase. Access Economics (2009b) highlighted the challenges that the aged care system will face as the number of people with dementia increases. Neurodegenerative diseases such as dementia can precipitate the need for care services or elevate the level of care required.
In the context of the growing disability burden, movements towards community care and other models of integrated care have historically been both financially motivated as well as reflecting community attitudes and preferences. Most older Australians would prefer that, should they require care, th
family member or friend is available to provide informal care. For example, there is evidence that elderly people who live alone are more likely to be recommended for admission to residential care than those living with a spouse or other people. Of people recommended for admission into residential care, people living alone are more likely to be assessed as needing low‐level as opposed to high‐level care. For people living with family members, the opposite is true. It is possible that
Gerontology Centre, 2002).
However, the preferences of the arer as well as the care recipient must be considered. SDAC surveyed carers about their level of satisfaction with their role, and found that only 25.7% of primary carers felt satisfied. A significant number of carers also expressed the desire to return to paid work. A survey of Victorian carers found that younger carers were more likely to want to maintain or increase their workforce participation compared to carers aged over 50 (Schofield et al, 1998).
In terms of costs, older people and their carers meet a large proportion of the costs of care which would otherwise be borne by government (Productivity Commission, 2003b). Appropriate community‐based interventions can also be more cost effective than institutionalised care; the analysis conducted in this report based on average costs of care appears to show that combinations of informal care and community based formal care are generally lower cost than institutionalised care (including a housing component), even when the opportunity cost of the carer’s time is included. However, the government subsidy for informal care is generally lower than for other
52
The economic value of informal care in 2010
formal care s ty care) and supply constraints (notably potentially fewer informal carers). The third InterGenerational
will need other
ng on
ervices), shifting social preferences (generally towards communi
Report (Treasury, 2010) concludes that the proportion of services allocated to high care to increase over time and adapt to the special needs of people with dementia and
severe chronic disease. This is expected to result in a much larger relative increase in spendiRAC than on community care (Chart 5.4).
Chart 5.4: Projected Australian Government aged care spending
0.6
0.8
1.4
0.4
1.8
0.2
0.8
1.2
1.6
2
0
Residential aged care Community aged care All aged care
0.4
2009‐10 2049‐50
% of GDP
Source: Access Economics based on Treasury (2010).
It is not clear from the InterGenerational Report how increases in care costs in the future – from 0.8% of GDP today to 1.8% of GDP in 2049‐50 – are to be funded. Rather, the projections show growing fiscal deficits resulting from aged care and health expenditures. Silence on funding deficits is accompanied by silence in the InterGenerational Report on other key issues such as how to meet emerging workforce shortages and sensitivity analysis of the projections if the propensity to provide informal care falls.
The analysis in this report emphasises that carers have their own needs, distinct from those of the care recipient. Clearly there is a need to consider these needs in policy planning for the
that 37.2% of primary carers felt they needed more ng activities. However, needs can vary considerably according to the type
disability son cared for. Carers of people with an intellectual (53%) or bility were most likely to need additional support. Least likely to need
re le with a sensory or speech disability (24%) or a physical
coming decades. The SDAC showedsupport in their cariof of the perpsychological (44%) disamo support were carers of peopdisability (35%).
Priority support for carers comprise:
■ respite care;
53
■ income support;
■ education and training; and
■ preventive health care.
Previous modelling by Access Economics found that increased respite support for family carers of people with dementia could generate a benefit cost ratio of around 7:1 if the respite care reduced the number of people moved into institutional care (Access Economics, 2003). American studies have found that respite care and other interventions aimed at reducing psychological distress in dementia caregivers can delay institutionalisation (Spector and Tampi, 2005). A lot has been accomplished in providing respite care over the past decade, although there remains a need to ensure respite care is uniformly accessible, flexible and appropriate across Australia in the coming years as demand burgeons.
This report has shown that expenditure on carer income support, counselling and training can also produce a net benefit. Almost all of the studies considered by Toseland and Smith (2004) found caregiver education and training programs have small or moderate effects on increasing knowledge about services and resources for carers, improving psychological and social wellbeing of carers and increasing problem solving abilities and reducing pressing problems
eir caring role in ways hich also protect their own health (e.g. lifting techniques). Policy consideration should also given to preventive health checks for informal carers and a personalised health record to
help maintain carers’ health.
Such support for carers – through respite, income support, education and training and preventive health care – will help ensure and enhance future labour productivity across the formal and informal sectors of the economy, as well as meeting Australia’s obligations to optimise wellbeing for the frail aged those disadvantaged by disability.
related to caring. Section 4.2 highlighted the potential returns to carer education and training, together with the relative underinvestment in such programs for informal carers, compared to formal carers.
Training, information and support can assist carers’ capacity to fulfil thwbe
54
The economic value of informal care in 2010
References Access Economics 2010a, Business outlook: December quarter 2009, Canberra, January.
‐ 2010b, The future of aged care in Australia, Report for NSPAC.
‐ 2010c, Caring places: planning for aged care and dementia 2010‐2050, Report for Alzheimer's Australia, http://www.accesseconomics.com.au/publicationsreports/showreport.php?id=239.
‐ 2009a, The economic cost of heart attack and chest pain (Acute Coronary Syndrome), Report for Eli Lilly, June, http://www.accesseconomics.com.au/publicationsreports/showreport.php?id=204&searchfor=2009&searchby=year.
‐ 2009b, Making choices: Future dementia care: projections, problems and preferences, Report for Alzheimer’s Australia, http://www.accesseconomics.com.au/publicationsreports/getreport.php?report=196&id=251, accessed 22 February 2010.
‐ 2007a, The high price of pain, Report for the MBF Foundation in collaboration with the University of Sydney Pain Management Research Institute, November, http://www.accesseconomics.com.au/publicationsreports/showreport.php?id=142&searchfor=2007&searchby=year.
‐ 2007b, Smoking and mental illness: costs, Report for SANE Australia, November, http://www.accesseconomics.com.au/publicationsreports/showreport.php?id=143&searchfor=2007&searchby=year.
‐ 2004, Aged Care Dynamic Cohort Model, Report for the Aged Care Price Review Taskforce (‘The Hogan Review’), April. http://www.health.gov.au/internet/main/publishing.nsf/Content/health‐investinginagedcare‐report‐index.htm~health‐investinginagedcare‐report‐4.htm~health‐investinginagedcare‐report‐4‐1.htm, accessed 27 August 2010.
‐ 2003, The Dementia Epidemic: Economic Impact and Positive Solutions for Australia, Report for Alzheimer’s Australia, http://www.accesseconomics.com.au/publicationsreports/showreport.php?id=35&searchfor=2006&searchby=yearearlier, accessed 23 July 2010.
Australian Bureau of Statistics (ABS) 2010a, Labour force, Australia, February 2010, ABS Cat No 6202.0 Canberra, 11 March.
‐ 2010b, Australian national accounts: national income, expenditure and product, Dec 2009, ABS Cat No 5206.0, 3 March.
‐ 2010c, Average weekly earnings, Australia, February 2010, ABS Cat No 6302.0 Canberra, 20 May.
‐ 2009, Employee earnings and hours, Australia, August 2008, ABS Cat No 6306.0, Canberra, 17 June.
‐ 2008a, A profile of carers in Australia, 2008, ABS Cat No 4448.0, Canberra, 4 October.
55
‐ 2008b, Population projections, Australia, 2006 to 2101, ABS Cat No 3222.0, Canberra, 4 September.
‐ 2006a, ANZSCO ‐ Australian and New Zealand Standard Classification of Occupation, 1st edition, ABS Cat No 1220.0, Canberra.
‐ 2006b, Census of population and housing, http://www.abs.gov.au/websitedbs/D3310114.nsf/home/Census+data, accessed 26 July 2010.
‐ 2005, 2003 Disability, ageing and carers, Australia: caring in the community, ABS Cat No 4430.0.55.003, Canberra, 14 January.
‐ 2004a, 2002‐2003 Labour costs, Australia, ABS Cat No 6348.0.55.001, Canberra, 11 June.
‐ 2004b, 2003 Disability, ageing and carers: summary of findings, Australia, ABS Cat No 4430.0, Canberra, 15 September.
‐ 2004c, Population by age and sex, Australian states and territories, ABS Cat No 3201.0, Canberra, 17 December.
‐ 1998, How Australians use their time 1997, ABS Cat No 4153.0, Canberra.
Australian Institute of Health and Welfare (AIHW) 2009a, Health expenditure Australia 2007‐08, Australian Institute of Health and Welfare, AIHW Cat No HWE 46, Canberra, September.
‐ 2009b, Australia’s welfare 2009, Cat No AUS 117, Canberra.
‐ 2007, Australia’s welfare 2007, Cat No AUS 93, Canberra.
‐ 2005, Health system expenditure on disease and injury in Australia, 2000‐01, 2nd edition, AIHW Cat No HWE 28, Canberra, April.
Begg, S, Vos, T, Barker, B, Stevenson, C, Stanley, L and Lopez, AD 2007, The burden of disease and injury in Australia 2003, Australian Institute of Health and Welfare, PHE 82.
Carers Association of Australia 2000, Warning – caring is a health hazard: results of the 1999 National Survey of Carer Health and Wellbeing, September.
Carers Australia 2005, The ageing population: can we rely on informal, unpaid care to provide? Policy implications of the findings of the National Centre for Social and Economic Modelling Study – ‘Who’s going to care?, Informal care and an ageing population’, Canberra, February.
‐2002, Young carers research report: final report, Department of Family and Community Services, http://fahcsia.gov.au/sa/carers/pubs/YoungCarersReport/Pages/default.aspx, accessed 23 June 2010.
Carers UK 2004, In Poor Health: the impact of caring on health, December.
56
The economic value of informal care in 2010
Carmichael, F, Charles, S and Hulme, C 2010, ‘Who will care? Employment participation and willingness to supply informal care’, Journal of Health Economics, 29:182‐190.
Cass, B, Smyth, C, Hill, T Blaxland, M and Hamilton, M 2009, Young carers in Australia: understanding the advantages and disadvantages of their care giving, Social Policy Research Paper No. 38.
Cormac, I and Tihanyi, P 2006, ‘Meeting the mental and physical healthcare needs of carers’, Advances in Psychiatric Treatment, 12: 162‐172.
Cummins, R, Hughes, J, Tomyn, A, Gibson, A, Woerner, J and Lai, L 2007, Wellbeing of Australians: carer health and wellbeing, Deakin University, http://www.deakin.edu.au/research/acqol/projects/, accessed 22 June 2010.
de Vaus, D, Gray, M and Stanton, D 2003, Measuring the value of unpaid household, caring and voluntary work of older Australians, Australian Institute of Family Studies, Research Paper No 34, Melbourne, October.
Dearden, C and Becker, S 2002, Young carers and education, A report for Carers UK, http://www.carersni.org/Policyandpractice/Research, accessed 23 June 2010.
Department of Employment, Education and Workplace Relations (DEEWR) 2010, Higher education statistics, http://www.deewr.gov.au/HigherEducation/Publications/HEStatistics/Publications/Pages/Home.aspx, accessed 27 May 2010.
Department of Family, Housing, Community Services and Indigenous Affairs (FaHCSIA) 2009a, Annual Report 2008‐09, Canberra.
‐ 2009b, Portfolio additional estimates statements 2009‐10, http://www.fahcsia.gov.au/about/publicationsarticles/corp/BudgetPAES/budget09_10/PAES/Pages/default.aspx, accessed 08 April 2010.
‐ 2008, Annual Report 2007‐08, Canberra, 30 October.
Department of Finance and Deregulation (DOFD) 2009, Best practice regulation guidance note: value of statistical life, http://www.finance.gov.au/obpr/docs/ValuingStatisticalLife.pdf, accessed 27 July 2010.
Department of Health and Ageing 2009, Sheet 5 ‐ National Respite for Carers Program (NRCP) and other Australian Government support for carers, http://www.health.gov.au/internet/main/publishing.nsf/Content/ageing‐publicat‐qcoa‐05info.htm, accessed 08 April 2010.
Etters, L, Goodall, D and Harrison, B 2007, ‘Caregiver burden among dementia patient caregivers: a review of the literature’, Journal of the American Academy of Nurse Practitioners, 20:423‐428.
Glezer, H and Wolcott, I 1997, ‘Work and family values: preferences and practice’ Family Matters, Spring/Summer 48: 27‐29.
Hill, T, Smyth, C, Thomson, C and Cass, B 2009, Young carers: their characteristics and geographical distribution: report to the National Youth Affairs Research Scheme
57
(NYARS), http://www.dest.gov.au/NR/rdonlyres/0B14B588‐C8A3‐4058‐AFF2‐866B99FF04F6/25808/YoungCarers_Final.pdf, accessed 23 June 2010.
Hillman, DR, Scott‐Murphy, A, Antic, R and Pezzullo, L 2006, ‘The economic cost of sleep disorders’, Sleep, 29(3):299‐305.
Hollander, M, Chappell, N, Havens, B, McWilliam, C and Miller, J 2002, Substudy 5 – Study of the costs and outcomes of home care and residential long term care services, A report for the Health Transition Fund, Canada, February, www.homecarestudy.com/reports/full‐text/substudy‐05‐final_report.pdf, accessed 08 April 2010.
Howe, A and Sergeant, H 1999, ‘Strengthening the financing of aged care in Australia’ in Policy Implications of the Ageing of Australia’s Population, Productivity Commission and Melbourne Institute of Applied Economic and Social Research, Conference Proceedings, Canberra.
Industrial Relations Commission of New South Wales 2009, Health and community employees psychologists (state) award, http://www.health.nsw.gov.au/resources/jobs/conditions/awards/pdf/hsu_hc_psychologists.pdf, accessed 26 July 2010.
‐2008, Health professional and medical salaries (state) award, http://www.health.nsw.gov.au/resources/jobs/conditions/awards/pdf/hsu_he_profmed_salaries.pdf, accessed 26 July 2010.
Jenkins, A, Rowland, F, Angus, P, and Hales, C 2003, The future supply of informal care 2003 to 2013: alternative scenarios, Australian Institute of Health and Welfare, AIHW Cat No AGE 32.
Kalra, L, Evans, A, Perez, I, Melbourn, A, Patel, A, Knapp, M and Donaldson, N 2004, ‘Training carers of stroke patients: randomised controlled trial’, British Medical Journal, 328: 1099.
Kasuya, RT, Polgar‐Bailey, P and Takeuchi, R 2000, ‘Caregiver burden and burnout: a guide for primary care physicians’, Postgraduate Medicine, 108(7): 119‐123.
Lattimore, R 1997, Research and development fiscal incentives in Australia: impacts and policy lessons, Paper Presented to the OECD Conference on Policy Evaluation in Innovation, Paris, 26‐27 June, 81:574‐577.
Leigh, A 2010, ‘Informal care and labor market participation’, Labour Economics, 17(1): 140‐149.
Lincoln Gerontology Centre 2002, Aged Care Assessment Program National Minimum Data Set Report, July 2000‐June 2001, La Trobe University, Melbourne.
Magnusson, L, Hanson, E, Brito, L, Berthold, L, Chambers, M and Daly, T 2002, ‘Supporting family carers through the use of information and communication technology – the EU project ACTION’, International Journal of Nursing Studies, 39: 369‐381.
58
http://www.dest.gov.au/NR/rdonlyres/0B14B588�C8A3�4058�AFF2�866B99FF04F6/25808/YoungCarers_Final.pdf

The economic value of informal care in 2010
Mathers C, Vos, T and Stevenson, C 1999, The burden of disease and injury in Australia, Australian Institute of Health and Welfare, AIHW Cat No PHE 17, Canberra, 16 November.
McCallum, J 2003, Submission to the Inquiry into Long Term Strategies to Address the Ageing of the Australian Population over the Next 40 Years, http://www.aph.gov.au/house/committee/ageing/strategies/subs/sub132.pdf, accessed 22 February 2010.
McCallum, J and Mundy, G 2002, Australia’s Aged Care Service System: The Need for an Industry Structure, The Meyer Foundation, Melbourne.
Moore, T, Morrow, R, McArthur, M, Noble‐Carr, D and Gray, J 2006, Reading, writing, and responsibility: young carers and education, Research Report, Institute of Child Protection Studies, Canberra.
National Hospital Cost Data Collection, 2009 NHCDC Cost Report Round 12 (2007‐2008), Department of Health and Ageing, September, available at (http://www.health.gov.au/internet/main/publishing.nsf/Content/0BF59B7DB88A427FCA257609001FCD3D/$File/1_R12CostReport.pdf, and associated data cubes, last accessed 27 July 2010.
NATSEM 2004, Who’s going to care? Informal care and an ageing population, Report prepared for Carers Australia, Canberra, June.
O’Shea, E 2000, The costs of caring for people with dementia and related cognitive impairments, National Council on Ageing and Older People, Centre for Ageing Studies, University of Ireland, Galway.
Patel, A, Knapp, M, Evans, A, Perez, I and Kalra, L 2004, ‘Training care givers of stroke patients: economic evaluation’, British Medical Journal, 328: 1102.
Productivity Commission 2003a, Evaluation of the Pharmaceutical Industry Investment Program, Research Report, AusInfo, Canberra.
‐ 2003b, Productivity Commission submission to the Review of Pricing Arrangements in Residential Aged Care, Canberra, June.
Rowland, D 1991, Ageing in Australia: population trends and social issues, Longman Cheshire, Melbourne.
Schofield, H, Bloch, S, Herman, H, Murphy, B, Nankervis, J and Singh, B 1998, Family Caregivers: Disability, Illness and Ageing, Allen and Unwin, St Leonards, New South Wales.
Sorensen, S, Pinquart M and Duberstein, P 2002, ‘How effective are interventions with caregivers? An updated meta‐analysis’, The Gerontologist, 42(3):356‐372.
Spector, J and Tampi, R 2005, ‘Caregiver depression’, Annals of Long Term Care, 13(4):34‐40.
Toseland, R and Smith, T 2004, Supporting Caregivers through Education and Training, National Family Caregiver Support Program Selected Issue Briefs.
59
Treasury 2010, Australia to 2050: future challenges, http://www.treasury.gov.au/igr/igr2010/report/pdf/IGR_2010.pdf, accessed 22 February 2010.
Warren, J 2007, ‘Young carers: conventional or exaggerated levels of domestic and caring tasks’, Children & Society, 21:136–146.
60