Steve Hubbs & Tiffany Caldwell University of Louisville Clogging in Louisville.
Upload
reese-applewhiteCategory
view
216download
1
The Economic Importance of Arts and Cultural Attractions in the
Louisville Area
Paul Coomes, Ph.D.Professor of Economics, and
National City Research Fellowand
Barry KornsteinSenior Research Associate
University of Louisville
DRAFT: October 15, 2007

Economic importance of arts and cultural attractions in Louisville
About this studyThis file contains the findings from our 2007 study of arts and cultural attractions in Louisville. This updates our 2001 study, which is available online at: http://monitor.louisville.edu/arts/Arts_Report.pdf
The study has two major components – a rollup of activity by individual groups in the Louisville area, and a comparison of activity in Louisville to that in a set of peer metropolitan areas.
See the next slide for a table of contents. The topics shown are hyperlinked to the page containing the relevant findings. You can page down between slides, or jump back to the table of contents by clicking on the home button in the bottom right hand corner.
This study was commissioned by the Arts and Cultural Attractions Council, an industry network of Greater Louisville Inc. Special thanks to Stephen Klein and the executive committee, as well as Lauren Hardwick at GLI. Of course, the study would not have been feasible without the participation of all the local arts and cultural groups, who generously provided internal data, help with interpretation, and assisted in obtaining national comparison data. We greatly appreciate your help. And, as always, we want to acknowledge the generous and ongoing research support from National City, which provides us the resources to deepen and enhance important economic development projects like this.

II. HOW LOUISVILLE COMPARES TO OTHER MARKETS
Performing Arts – Symphony OrchestraPerforming Arts – TheatrePerforming Arts – OperaPerforming Arts – BalletMuseums, Zoos, Historic Sites - SummaryMuseums – ArtMuseums – Science and natural historyMuseums – Children’s Museums – SportsZoos and AquariumsArboretums and Nature CentersHistoric Sites and HousesFinancial data on tax-exempt organizationsPrivate art galleries
APPENDICESA. List of participating organizationsB. Letter and data template used for
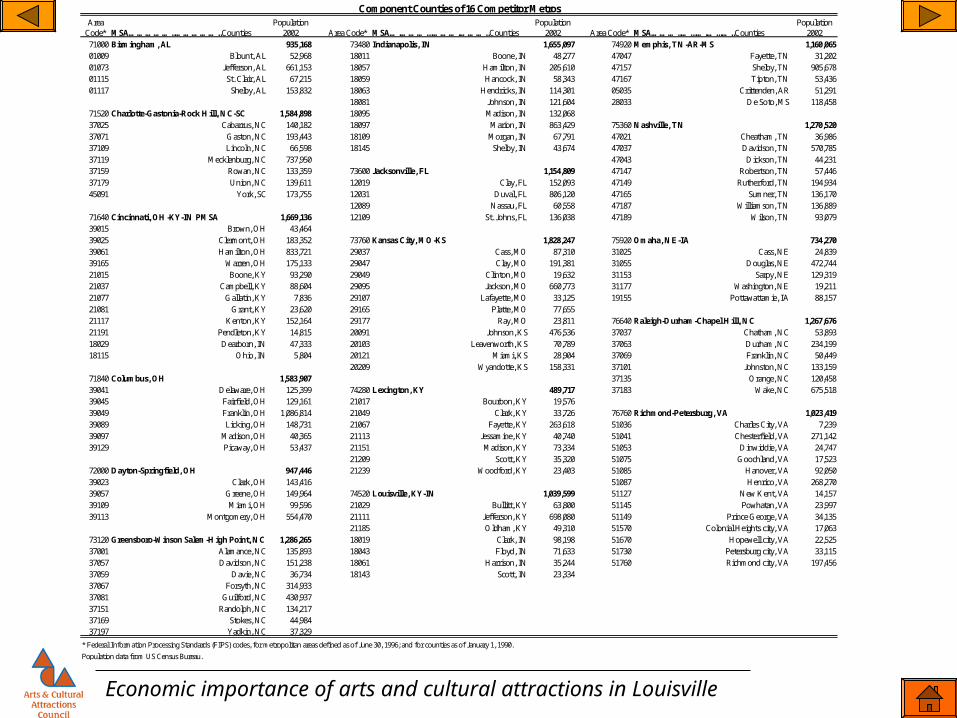
studyC. Comparison Markets – peer MSAs,
component counties, populationEconomic importance of arts and cultural attractions in Louisville
CONTENTS
EXECUTIVE SUMMARY
I. SIZE OF ARTS AND CULTURAL ATTRACTIONS INDUSTRY IN LOUISVILLE Scope and definitionsAttendanceEmploymentVolunteersWages, salaries, benefitsRevenues by typeExpenditures by typeTaxes paidGrowth since 2000
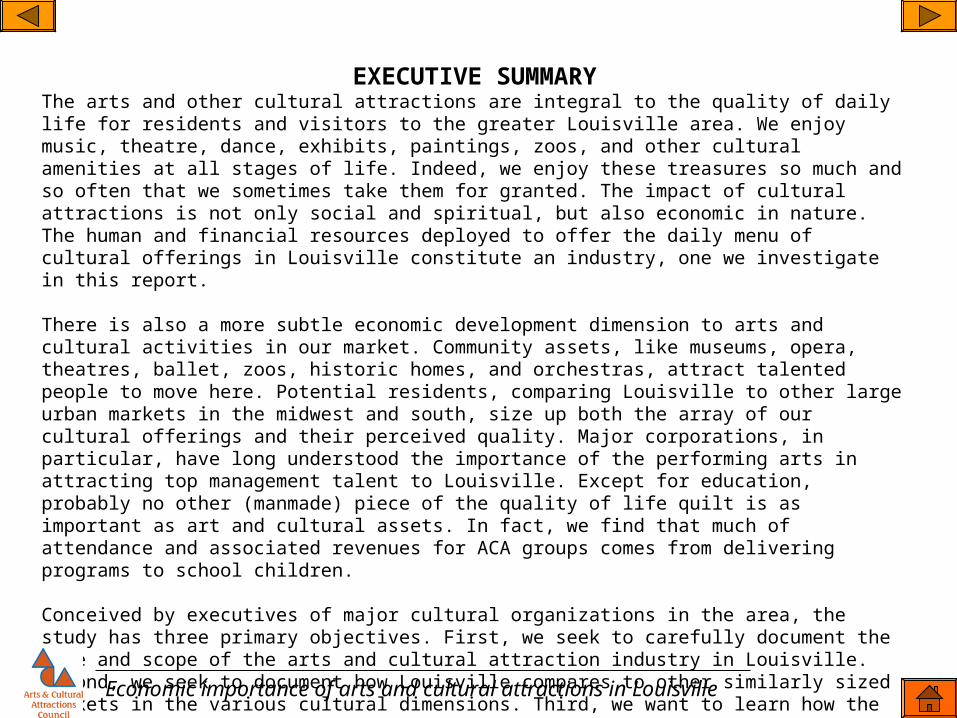
EXECUTIVE SUMMARYThe arts and other cultural attractions are integral to the quality of daily life for residents and visitors to the greater Louisville area. We enjoy music, theatre, dance, exhibits, paintings, zoos, and other cultural amenities at all stages of life. Indeed, we enjoy these treasures so much and so often that we sometimes take them for granted. The impact of cultural attractions is not only social and spiritual, but also economic in nature. The human and financial resources deployed to offer the daily menu of cultural offerings in Louisville constitute an industry, one we investigate in this report.
There is also a more subtle economic development dimension to arts and cultural activities in our market. Community assets, like museums, opera, theatres, ballet, zoos, historic homes, and orchestras, attract talented people to move here. Potential residents, comparing Louisville to other large urban markets in the midwest and south, size up both the array of our cultural offerings and their perceived quality. Major corporations, in particular, have long understood the importance of the performing arts in attracting top management talent to Louisville. Except for education, probably no other (manmade) piece of the quality of life quilt is as important as art and cultural assets. In fact, we find that much of attendance and associated revenues for ACA groups comes from delivering programs to school children.
Conceived by executives of major cultural organizations in the area, the study has three primary objectives. First, we seek to carefully document the size and scope of the arts and cultural attraction industry in Louisville. Second, we seek to document how Louisville compares to other similarly sized markets in the various cultural dimensions. Third, we want to learn how the ‘industry’ has changed since our last study, in 2001.
To this end, we have surveyed 50 top arts and cultural organizations in the Louisville area. They have generously provided attendance, budget, and other economic data, but also many hours of help with interpretation of the information. We have also acquired and organized data from membership associations that track cultural activity in markets across the country. Among the most important and interesting research findings described in this report are:
Economic importance of arts and cultural attractions in Louisville

EXECUTIVE SUMMARY (cont) Louisville area Arts and Cultural Attractions (ACA) organizations are collectively supporting an attendance of at least 4.9 million per year, over four contacts per metro area resident. Further we estimate that about 23 percent of attendees and visitors to ACA organizations reside outside the Louisville metropolitan area. In that regard, the ACA groups are an important component of Louisville’s tourism industry. The largest source of export sales - those to visitors - appears to be from the museums (especially the Louisville Slugger Museum, the Kentucky Derby Museum, the Louisville Science Center, and the Speed Art Museum), performing arts (especially the PNC Broadway Series productions, the Kentucky Center for the Arts, Derby Dinner Playhouse, Actors Theatre, and the Louisville Ballet), and the Zoo.
The ACA organizations have collective annual revenues of around $109 million. Over forty percent of the revenues are generated from ticket sales and concessions. Government grants and private donations account for about one-fourth each. Revenues from other sources, including contracts to deliver programs to school groups, have grown in importance and now account for about eight percent of revenues. We estimate that ACA activities generate at least $5.6 million in tax receipts annually for state and local governments.
These organizations collectively employ about 1,820 persons, and have a combined annual labor cost (including contract labor) of $52 million. Part-time employment rose, while full-time employment fell slightly since our 2001 study. Annual earnings per job of ACA employees average about $23,200, well below the average for all jobs in the Louisville MSA. This partly reflects the heavy reliance on part-time workers by ACA groups.
Attendance overall was up about 14 percent since our 2001 study, with a majority of the net growth due to new organizations. Paid attendance overall was up modestly, about 2 percent, due to paid admissions at the new attractions. Overall revenues and expenditures were up 31 percent, with 19 percentage points due to growth at organizations included in our 2001 study, and the rest due to new organizations. Employment overall was flat, with payroll expenses up 44 percent.
Economic importance of arts and cultural attractions in Louisville

EXECUTIVE SUMMARY (cont)
While there has been overall growth in the ACA economic activity during the current decade, the growth among organizations and sectors varies widely. For example, an important museum saw a decline in attendance, which was more than offset by activity at a new museum – the Frazier International History Museum. Moreover, overall museum revenues grew dramatically, from $19 million in 2000 to $34 million in 2006.
Attendance, both paid and unpaid, was down by about ten percent overall for the performing arts organizations. The Kentucky Center posted strong growth in attendance, but not enough to offset declines for the Louisville Orchestra, the Louisville Ballet, Actors Theatre, and the Kentucky Opera. Despite a drop in attendance, the groups managed to boost revenues, expenses, and payrolls, thanks largely to a 35 percent increase in private contributions.
Louisville’s nature attractions saw an increase in overall attendance of 27 percent, with growth in paid attendance of 10 percent this decade. This sector is dominated by Louisville Zoo, the Falls of Ohio State Park Interpetive Center, and Bernheim Arboretum and Research. Employment was unchanged from 2000, though payroll expenses rose nearly 49 percent, due largely to strong growth at the Zoo (which saw a 16 percent growth in earned revenue).
The number of visitors to Louisville’s historic and heritage sites was essentially unchanged from 2000, as was the overall number of employees in this sector. However, strong growth in grant activity boosted revenues and expenditures by 35 percent overall, led primarily by growth at the Filson Club, Riverside, The Farnsley-Moreman Landing, and Locust Grove.
Relative to fourteen other metropolitan areas in its size class, Louisville ranks very high in sports museum and theatre activity. In most other categories, including art museums, science museums, orchestras, opera, ballet and zoos, Louisville’s ranking falls about where one would expect based upon population size.
Economic importance of arts and cultural attractions in Louisville

Scope and DefinitionsBroadly defined, arts and cultural attractions include any organized activity whose purpose is to enlighten, educate, and entertain local residents and/or visitors. Taken literally, this definition includes such diverse activities as movie theatres, night clubs, bible study groups, and bowling allies. To keep this research project manageable, the Arts and Cultural Attractions (ACA) Research Committee directed us to focus on the following general categories:
Museums: visual art, science, children’s, sports,Performing Arts: orchestra, theatre, ballet, operaHeritage Sites: historic homes, heritage research
facilitiesNature Attractions: zoos, arboretums, gardens, Ohio
River
Economic importance of arts and cultural attractions in Louisville
We have excluded, for example, schools and religious organizations, libraries, city and state parks, sports, rock concerts, and seasonal events. This has the disadvantage of missing some major attractions, like Thunder Over Louisville, Kentucky Kingdom, the Derby, University of Louisville sports, the Louisville Riverbats, and the St. James Art Fair. However, the limited scope does allow us to focus more sharply on the activities of most interest to the sponsors. A listing of the participating organizations is provided as Appendix A. A copy of the survey instrument is included as Appendix B.
For similar reasons, we also had to restrict the types of information collected. Our efforts focused on obtaining good data on attendance, performances, revenues, expenditures, employees, payrolls, and physical assets. We did not attempt to examine marketing or management issues.
The reference time periods for the estimates vary, depending upon the reporting cycles of the organizations. We asked all organizations for their latest accurate information. In some cases, the data refer to the 2006-07 fiscal year; others refer to 2005-06, and a few reported calendar year 2006 data. In all cases, we have used annual totals. In a few cases, where organizations did not respond, we made estimates of activity based on good data from other similar attractions.

3%
35%
32%
30%
Museums
Performing Arts
Nature Attractions
HeritageSites
Attendance at the ACA Organizations
Total = 4.9 million
Economic importance of arts and cultural attractions in Louisville
Total attendance is about 4.9 million annually, of which about 2.8 million were paid admissions.
Most attendees lived in the Louisville MSA, but about 1 million were not residents. The biggest attractors of nonresident visitors are the Zoo, the Kentucky Derby Museum, the Louisville Slugger Museum, the Louisville Science Center, and the Frazier International History Museum.
1,501,830
1,595,314
128,938
1,721,930
810,955
34,198
1,288,578
707,422
Museums Performing Arts Heritage Sites Nature Attractions
Total Attendance
Paid Attendance
Paid v/s Total Attendance

Economic importance of arts and cultural attractions in Louisville
4%16%
15%
59%
Museums
Performing Arts
Nature Attractions
Heritage Sites
100% = 1,846 full- and part-time employees
Employment by ACA Organizations
Collectively the ACA organizations employed 1,846 people, almost equally split between full-time and part-time workers. The performing arts groups are by far the largest employers, with 1,092 artists, production, and administrative people.

Economic importance of arts and cultural attractions in Louisville
Collectively the ACA organizations relied on over 11,000 volunteers, who contributed over 400,000 hours of service. Performing arts groups were the major beneficiaries.
0
1,000
2,000
3,000
4,000
5,000
6,000
7,000
Museums Performing Arts Heritage Sites Nature Attractions
no. o
f V
olun
teer
s
0
50,000
100,000
150,000
200,000
250,000
Vol
unte
er H
ours
no. of volunteers
Annual Volunteer Hours
Number of Volunteers and Annual Volunteer Hours for ACA Groups

Economic importance of arts and cultural attractions in Louisville
Collectively the ACA groups had an annual payroll of $41.0 in wages and salaries, plus $8.4 million in fringe benefits. They had an additional $3.8 million in contract labor costs.
5%
19%
22%
54%
100%= $49.4 mil
Museums
Performing Arts
Nature Attractions
Heritage Sites
Total Payroll and Benefits of the ACA Organizations

Economic importance of arts and cultural attractions in Louisville
Collectively, the ACA groups reported gross income of $109 million. Over half ($56 million) of that was received by performing arts groups, followed by museums ($34 million), nature attractions ($14 million), and historic sites ($5 million).
Nature attractions and performing arts groups received over half their income from ticket sales and concessions, with museums earning on average 42 of their income. Performing arts are the most dependent on private contributions.
42% 6% 28% 26%
51% 5% 37% 11%
17% 8% 27% 44%
55% 18% 11% 14%
0% 10% 20% 30% 40% 50% 60% 70% 80% 90% 100%
Museums
Performing Arts
Hertitage Sites
Nature Attractions
*Earned Income Grants from Govt. Private Contributions Other Revenue
* Earned Income = Revenues from Admission + revenues from concessions + other revenues from sales
Sources of Income of ACA Organizations
Economic importance of arts and cultural attractions in Louisville
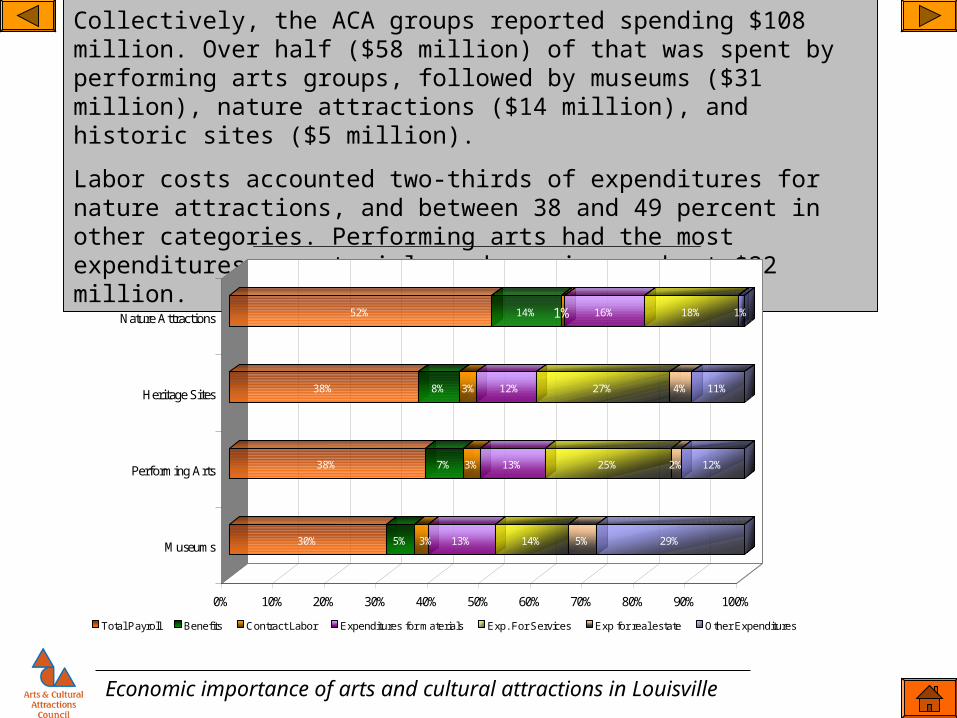
Collectively, the ACA groups reported spending $108 million. Over half ($58 million) of that was spent by performing arts groups, followed by museums ($31 million), nature attractions ($14 million), and historic sites ($5 million).
Labor costs accounted two-thirds of expenditures for nature attractions, and between 38 and 49 percent in other categories. Performing arts had the most expenditures on materials and services, about $22 million.
30% 5% 3% 13% 14% 5% 29%
38% 7% 3% 13% 25% 2% 12%
38% 8% 3% 12% 27% 4% 11%
52% 14% 1% 16% 18% 1%
0% 10% 20% 30% 40% 50% 60% 70% 80% 90% 100%
Museums
Performing Arts
Heritage Sites
Nature Attractions
Total Payroll Benefits Contract Labor Expenditures for materials Exp. For Services Exp for real estate Other Expenditures
Expenditures by the ACA Organizations

Economic importance of arts and cultural attractions in Louisville
We have used the payroll and sales data to estimate the taxes paid by ACA groups to local and state governments. The groups pay about $800,000 annually in occupational taxes to Louisville-Jefferson County, Jefferson County Schools, and TARC. They are also associated with about $4.8 million annually in income and sales taxes to Kentucky and Indiana state governments.
in downtown Louisville $26,472,585rest of Jefferson County $13,098,866
southern Indiana $3,030,749other Kentucky counties $1,387,945
Total $43,990,145
Concessions, gift shop sales, etc $21,746,177
Louisville-Jefferson County Government $494,643Jefferson County School System $237,429Transit Authority of River City $79,143
Kentucky state government $4,375,283Indiana state government $448,699
Total Occupational, Income, and Sales Taxes $5,635,197
State income and sales taxes
Estimated Annual Tax Base and Tax RevenuesLinked to Louisville Arts and Cultural Attractions
Wages and salaries, contract labor, paid by ACA organizations
Local occupational taxes

Economic importance of arts and cultural attractions in Louisville
We have added several new organizations since our 2001 study, including the Frazier International History Museum. Their activity boosted overall attendance above that in our last study. Nature attractions saw the greatest growth in attendance, both paid and total. Performing arts groups saw a decline of about 10 percent in attendance, both paid and total.
For comparison, the population of the Louisville MSA grew by 4.9 percent between 2000 and 2006.
Growth in Attenance, 2000 to 2006paid and unpaid
-400,000
-200,000
0
200,000
400,000
600,000
800,000
1,000,000
Nature attractions Heritage sites Performing arts Museums
New organizations
Organizations included in 2001 Study
Growth in Paid Attenance, 2000 to 2006
-250,000
-200,000
-150,000
-100,000
-50,000
0
50,000
100,000
150,000
Nature attractions Heritage sites Performing arts Museums
New organizations
Organizations included in 2001 Study

Economic importance of arts and cultural attractions in Louisville
Overall employment was about the same as in our 2001 study, with contributions from new groups just offsetting a decline by existing organizations. For comparison, the Louisville MSA had a net loss of 0.5% in total jobs between 2000 and 2006.
Total expenses grew by 31.7% overall, with the greatest growth in museums and performing arts organizations.
For comparison, there was a 20.4% growth in per capita income of Louisville MSA residents between 2000 and 2006; and a 14.9% in the national price level (inflation) for personal consumption expenditures.
Growth in Employees, 2000 to 2006full-time equivalents
-120
-100
-80
-60
-40
-20
0
20
40
60
Nature attractions Heritage sites Performing arts Museums
New organizations
Organizations included in 2001 Study
Growth in Total Expenditures, 2000 to 2006
$0
$5,000,000
$10,000,000
$15,000,000
$20,000,000
$25,000,000
Nature attractions Heritage sites Performing arts Museums
New organizations
Organizations included in 2001 Study

Metropolitan Population and Symphony Orchestra AttendanceLouisville and Eleven Peer MSAs
0
50,000
100,000
150,000
200,000
250,000
300,000
350,000
0 500,000 1,000,000 1,500,000 2,000,000 2,500,000
Population, 2005
Atten
danc
e, 2
005-
06 S
easo
n
Louisville
Source: Orchestra Statistical Report, 2905-2006 Season, American Symphony Orchestra League.
Economic importance of arts and cultural attractions in Louisville
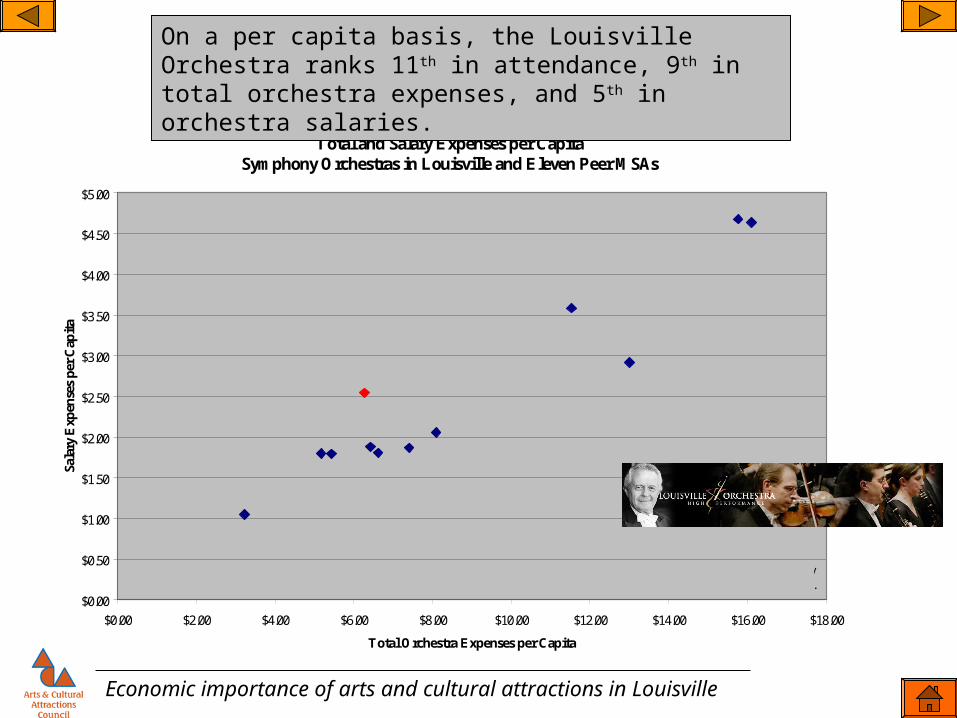
Data on orchestra activity is available for most of Louisville’s competitor markets. The American Symphony League produces statistical reports for twelve of the markets. The Louisville Orchestra ranks 11th in attendance, with 66 attendees per 1,000 residents. It ranks 9th in number of musicians, 8th in annual operating expenses, and 7th in salaries.
Total and Salary Expenses per CapitaSymphony Orchestras in Louisville and Eleven Peer MSAs
$0.00
$0.50
$1.00
$1.50
$2.00
$2.50
$3.00
$3.50
$4.00
$4.50
$5.00
$0.00 $2.00 $4.00 $6.00 $8.00 $10.00 $12.00 $14.00 $16.00 $18.00
Total Orchestra Expenses per Capita
Sala
ry E
xpen
ses pe
r Cap
ita
Louisville
Source: Orchestra Statistical Report, 2905-2006 Season, American Symphony Orchestra League.
Economic importance of arts and cultural attractions in Louisville
On a per capita basis, the Louisville Orchestra ranks 11th in attendance, 9th in total orchestra expenses, and 5th in orchestra salaries.

Metropolitan Population and Symphony Orchestra Attendance54 MSAs
0
200,000
400,000
600,000
800,000
1,000,000
1,200,000
1,400,000
1,600,000
0 2,000,000 4,000,000 6,000,000 8,000,000 10,000,000 12,000,000 14,000,000 16,000,000 18,000,000 20,000,000
Population, 2005
Atten
danc
e, 2
005-
06 S
easo
n
LouisvilleSource: Orchestra Statistical Report, 2905-2006 Season, American Symphony
Orchestra League.
Economic importance of arts and cultural attractions in Louisville
Nationally, Louisville ranks 46th in attendance among the 54 metropolitan areas where orchestra reports are available.

Economic importance of arts and cultural attractions in Louisville
Comparable theatre data is only available for a few prominent companies. Nevertheless, the latest data support prior findings that Louisville truly stands out in theatre activity. Actors Theatre pushes Louisville to the top in terms of performances, attendance, and operating expenses for a market in its size class.Theatre Attendance and Budgets, 2005
$0
$2,000,000
$4,000,000
$6,000,000
$8,000,000
$10,000,000
$12,000,000
0 20,000 40,000 60,000 80,000 100,000 120,000 140,000 160,000 180,000 200,000
Total attendance
Tot
al e
xpen
ses
Louisville
Kansas City
Indianapolis
MemphisDayton
CharlotteSource: Theatre Communications Group; data shown are for
metropolitan area totals, and may include activity at more than one theatre organization.

OperaOpera is the most hierarchical of all
performing arts, with New York accounting for over 30% of all company expenditures and attendance in US;
…add in San Francisco, Chicago, and Los Angeles to account for half of all activity.
The Kentucky Opera in Louisville ranks 33rd in expenditures per capita, 56th in attendance per capita; Louisville MSA ranks 33rd in population size among 69 MSAs for which opera data available.
Economic importance of arts and cultural attractions in Louisville
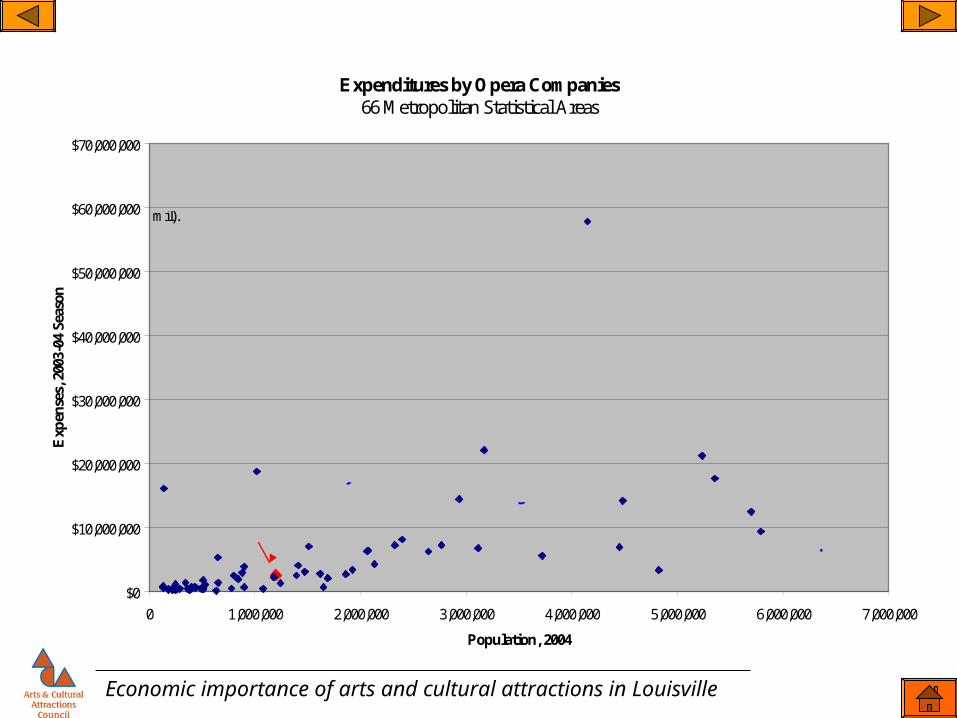
Expenditures by Opera Companies66 Metropolitan Statistical Areas
$0
$10,000,000
$20,000,000
$30,000,000
$40,000,000
$50,000,000
$60,000,000
$70,000,000
0 1,000,000 2,000,000 3,000,000 4,000,000 5,000,000 6,000,000 7,000,000
Population, 2004
Exp
ense
s, 2
003-
04 S
easo
n
Source:Opera America "Professional Opera Survey Report: A Fiscal and Operational Overview of Professional Opera Companies", Level 3, 2003-2004 Season. Not all companies reported.
Omitted for scaling purposes: New York ($230 mil), Los Angeles ($53 mil) and Chicago ($51 mil).
Louisville
Santa FeSalt Lake City
Seattle
San Francisco
Philadephia
Dallas - Ft. Worth
Miami
Houston
Detroit
Atlanta
San Diego
Economic importance of arts and cultural attractions in Louisville

Per Capita Opera Expenditures and Attendance per 1,000 Residents68 Metropolitan Statistical Areas
$0
$2
$4
$6
$8
$10
$12
$14
$16
$18
$20
0 10 20 30 40 50 60 70
Attendance per 1,000 residents
Exp
endi
ture
s pe
r ca
pita
Source:Opera America "Professional Opera Survey Report: A Fiscal and Operational Overview of Professional Opera Companies", Level 3, 2003-2004 Season. Not all companies reported. Santa Fe (595, $116 omitted from this chart to control scale.
Louisville
Salt Lake City
San Francisco
New York
Sarasota
SeattleNapa Valley
Charlottesville, VA
Milwaukee
Economic importance of arts and cultural attractions in Louisville

Metropolitan Statistical Area Population, 2004Total
ExpendituresMainstage Attendance
Expenditures per capita
Attendance per 1,000 residents
Birmingham-Hoover, AL 1,080,135 $410,792 4,872 $0.38 4.5Charlotte-Gastonia-Concord, NC-SC 1,472,619 $3,096,013 22,173 $2.10 15.1Cincinnati-Middletown, OH-KY-IN 2,074,789 $6,409,354 33,963 $3.09 16.4Columbus, OH 1,689,263 $2,088,184 16,206 $1.24 9.6Dayton, OH 843,546 $1,917,428 20,148 $2.27 23.9Indianapolis-Carmel, IN 1,617,406 $2,737,028 13,664 $1.69 8.4Kansas City, MO-KS 1,925,536 $3,401,589 20,991 $1.77 10.9Louisville-Jefferson County, KY-IN 1,200,526 $2,561,789 9,368 $2.13 7.8Memphis, TN-MS-AR 1,244,757 $1,302,386 8,927 $1.05 7.2Nashville-Davidson-Murfreesboro-Franklin, TN 1,393,618 $2,518,253 21,842 $1.81 15.7Omaha-Council Bluffs, NE-IA 802,003 $2,518,253 21,842 $3.14 27.2Source: Opera America "Professional Opera Survey Report: A Fiscal and Operational Overview of Professional Opera Companies", Level 3, 2003-2004 Season.Greensboro is served by the Greensboro Opera Company, but they are not listed in the report.No opera company was found for Jacksonville, FL.The Virginia Opera serves Richmond, Norfolk and other Virginia markets.Raleigh has The Opera Company of North Carolina, but they are not listed in the report.
Louisville and Peer MSAsOpera Companies, 2003-2004 Season
Economic importance of arts and cultural attractions in Louisville

Economic importance of arts and cultural attractions in Louisville
Comparable ballet data is available from Dance America for most of Louisville’s comparison cities. Clearly, ballet budgets are a function of market size, with Louisville activity where one would expect for a city our size. Raleigh and Richmond appear to be above average, while Birmingham and Nashville appear below average.Ballet Company Expenditures vs. MSA Population
$0
$1,000,000
$2,000,000
$3,000,000
$4,000,000
$5,000,000
$6,000,000
0 500,000 1,000,000 1,500,000 2,000,000 2,500,000
MSA Population, 2006
Tot
al e
xpen
ses, F
Y05
Lexington
Greensboro
Birmingham
Dayton Nashville
MemphisLouisville
Indianapolis
RaleighRichmond
Charlotte
Columbus
CincinnatiKansas City
Sources: Dance USA and US Census Bureau

Economic importance of arts and cultural attractions in Louisville
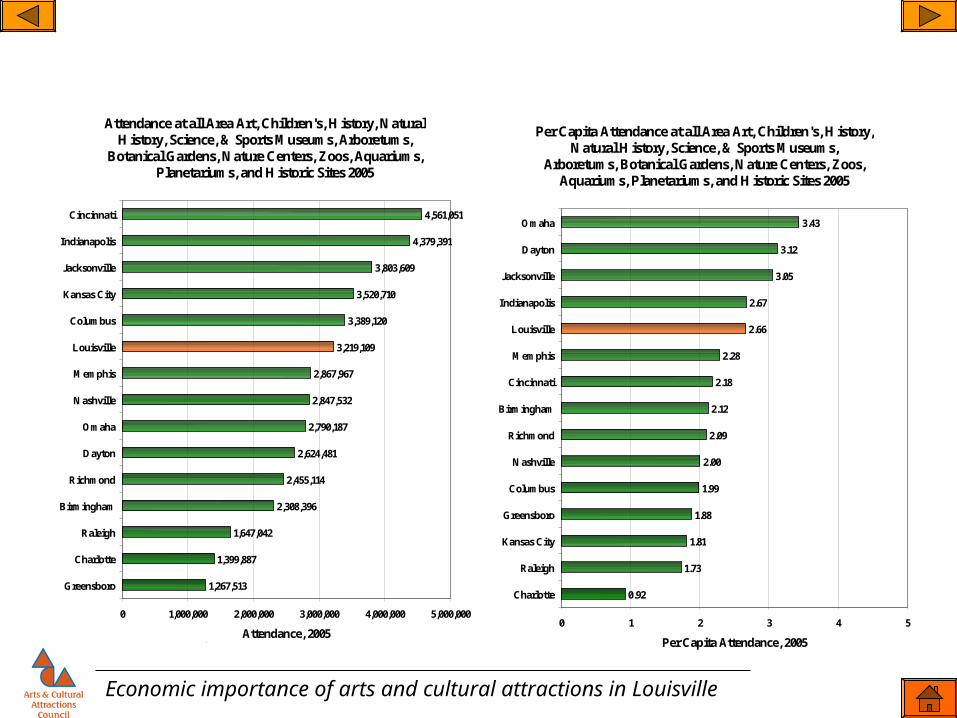
We have used the Official Museum Directory, 2006*, to identify museums, galleries, zoos, historical sites and other attractions located in the fifteen peer markets. We organized the attendance museum data into seven categories: art museums, science and natural history museums and planetariums, children’s museums, sports museums, zoos and aquariums, arboretums and nature centers, historic sites and houses. Attendance figures for each category are shown in the following slides.
We also add attendance across all the categories, to get a measure of overall activity. See next slide. Louisville ranks highly in this regard, primarily due to its large showing in the science museum and sport museum categories. The Louisville Science Center, the Kentucky Derby Museum, and the Louisville Slugger Museum are major attractions, with sufficient attendance to boost Louisville to the top of the rankings among the peer markets for comparable museum types.
Louisville also scores well in nature sites, with attendance above what would be expected for a market with a population of 1.2 million. With no venues, Louisville ranks below average in attendance at aquariums, botanical gardens, and children’s museums.
* While the most comprehensive listing available, the Directory does not have entries for all attractions. For Louisville, important omissions include the Frazier Museum and the Falls of Ohio state park.
Museums, Historical Sites, Zoos
Economic importance of arts and cultural attractions in Louisville
Attendance at all Area Art, Children's, History, Natural History, Science, & Sports Museums, Arboretums,
Botanical Gardens, Nature Centers, Zoos, Aquariums, Planetariums, and Historic Sites 2005
1,267,513
1,399,887
1,647,042
2,308,396
2,455,114
2,624,481
2,790,187
2,847,532
2,867,967
3,219,109
3,389,120
3,520,710
3,803,609
4,379,391
4,561,051
0 1,000,000 2,000,000 3,000,000 4,000,000 5,000,000
Greensboro
Charlotte
Raleigh
Birmingham
Richmond
Dayton
Omaha
Nashville
Memphis
Louisville
Columbus
Kansas City
Jacksonville
Indianapolis
Cincinnati
Attendance, 2005Source: The Official Musuem Directory, 2006.
Per Capita Attendance at all Area Art, Children's, History, Natural History, Science, & Sports Museums,
Arboretums, Botanical Gardens, Nature Centers, Zoos, Aquariums, Planetariums, and Historic Sites 2005
0.92
1.73
1.81
1.88
1.99
2.00
2.09
2.12
2.18
2.28
2.66
2.67
3.05
3.12
3.43
0 1 2 3 4 5
Charlotte
Raleigh
Kansas City
Greensboro
Columbus
Nashville
Richmond
Birmingham
Cincinnati
Memphis
Louisville
Indianapolis
Jacksonville
Dayton
Omaha
Per Capita Attendance, 2005Source: The Official Musuem Directory, 2006.

Economic importance of arts and cultural attractions in Louisville
Attendance at all Area Art Museums and Galleries, 2005
190,522
216,795
222,051
227,724
235,200
259,228
277,604
278,752
283,053
296,394
442,400
457,645
471,692
686,339
729,286
0 150,000 300,000 450,000 600,000 750,000
Richmond
Memphis
Greensboro
Birmingham
Jacksonville
Raleigh
Omaha
Louisville
Charlotte
Dayton
Kansas City
Columbus
Indianapolis
Nashville
Cincinnati
Attendance, 2005Source: The Official Musuem Directory, 2006.
Louisville ranks eighth in total art museum attendance among the fifteen metropolitan areas, and ninth on a per capita basis. The Speed Art Museum accounts for most of the attendance in Louisville. The figures also include attendance at the Kentucky Museum of Art and Craft, the Hite Gallery, the Carnegie Center for Art and History. Nashville now tops the per capita ranking, boosted by 301,000 attendees at the new Frist Center alone.
Per Capita Attendance at all Area Art Museumsand Galleries, 2005
0.16
0.17
0.19
0.19
0.21
0.23
0.23
0.27
0.27
0.29
0.33
0.34
0.35
0.35
0.48
0.0 0.1 0.2 0.3 0.4 0.5 0.6
Richmond
Memphis
Charlotte
Jacksonville
Birmingham
Kansas City
Louisville
Columbus
Raleigh
Indianapolis
Greensboro
Omaha
Cincinnati
Dayton
Nashville
Per Capita Attendance, 2005Source: The Official Musuem Directory, 2006.

Economic importance of arts and cultural attractions in Louisville
Louisville ranks second in attendance in the category of Science Museums, Natural History Museums, and Planetariums.. Figures include attendance at the Louisville Science Center and at the Gheens Planetarium (UL). Raleigh’s North Carolina Museum of Natural Science had over 700,000 visitors..Charlotte’s Discovery Place had attendance of 525,000.Attendance at all Area Science and Natural History
Museums and Planetariums, 2005
0
20,000
95,000
165,000
200,000
292,807
300,000
376,650
400,000
410,848
505,000
534,850
591,794
641,000
703,000
0 150,000 300,000 450,000 600,000 750,000
Omaha
Indianapolis
Jacksonville
Greensboro
Memphis
Dayton
Nashville
Birmingham
Kansas City
Richmond
Cincinnati
Columbus
Charlotte
Louisville
Raleigh
Attendance, 2005Source: The Official Musuem Directory, 2006.
Per Capita Attendance at all Area Science and Natural History Museums and Planetariums, 2005
0.00
0.01
0.08
0.16
0.21
0.21
0.24
0.24
0.31
0.35
0.35
0.35
0.39
0.53
0.74
0.0 0.2 0.4 0.6 0.8 1.0
Omaha
Indianapolis
Jacksonville
Memphis
Kansas City
Nashville
Cincinnati
Greensboro
Columbus
Birmingham
Dayton
Richmond
Charlotte
Louisville
Raleigh
Per Capita Attendance, 2005Source: The Official Musuem Directory, 2006.
Economic importance of arts and cultural attractions in Louisville
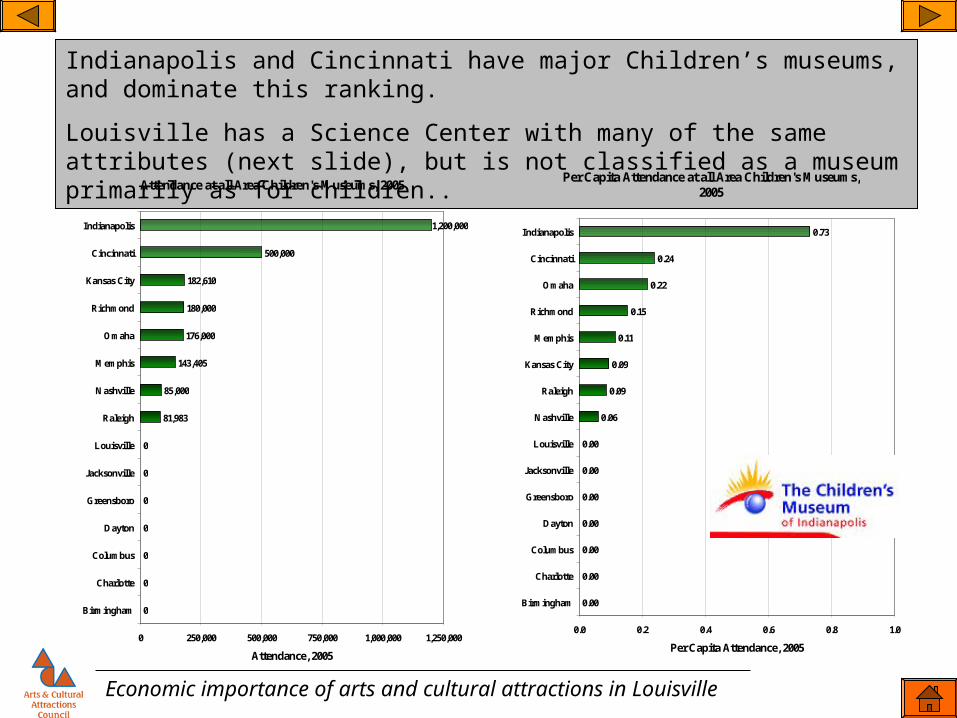
Indianapolis and Cincinnati have major Children’s museums, and dominate this ranking.
Louisville has a Science Center with many of the same attributes (next slide), but is not classified as a museum primarily as for children..Attendance at all Area Children's Museums, 2005
0
0
0
0
0
0
0
81,983
85,000
143,405
176,000
180,000
182,610
500,000
1,200,000
0 250,000 500,000 750,000 1,000,000 1,250,000
Birmingham
Charlotte
Columbus
Dayton
Greensboro
Jacksonville
Louisville
Raleigh
Nashville
Memphis
Omaha
Richmond
Kansas City
Cincinnati
Indianapolis
Attendance, 2005Source: The Official Musuem Directory, 2006.
Per Capita Attendance at all Area Children's Museums, 2005
0.00
0.00
0.00
0.00
0.00
0.00
0.00
0.06
0.09
0.09
0.11
0.15
0.22
0.24
0.73
0.0 0.2 0.4 0.6 0.8 1.0
Birmingham
Charlotte
Columbus
Dayton
Greensboro
Jacksonville
Louisville
Nashville
Raleigh
Kansas City
Memphis
Richmond
Omaha
Cincinnati
Indianapolis
Per Capita Attendance, 2005Source: The Official Musuem Directory, 2006.

Economic importance of arts and cultural attractions in Louisville
Per Capita Attendance at all AreaSports Related Museums, 2005
0.00
0.00
0.00
0.00
0.00
0.00
0.00
0.00
0.00
0.01
0.02
0.03
0.20
0.21
0.32
0.0 0.2 0.4 0.6 0.8 1.0
Charlotte
Cincinnati
Dayton
Kansas City
Memphis
Nashville
Omaha
Raleigh
Richmond
Columbus
Birmingham
Greensboro
Jacksonville
Indianapolis
Louisville
Per Capita Attendance, 2005Source: The Official Musuem Directory, 2006.
Louisville tops the list in terms of attendance at Sports museums, with two major attractions: the Kentucky Derby Museum and the Slugger Museum. The only sports museums among the peers with comparable attendance are the Indianapolis Motor Speedway Hall of Fame Museum (350,000), and the World Golf Hall of Fame (250,000) in Jacksonville.

Economic importance of arts and cultural attractions in Louisville
Eleven of the comparison markets have zoos. Charlotte, with a population of 1.5 million, is easily the largest metro area without a zoo. Cincinnati and Omaha top the rankings in terms of attendance, with Omaha standing out due to its small population size (812,000). Louisville ranks in the middle of the metros. Because of the scheduling of special events, 2005 was an off year for the Louisville Zoo, which had attendance of over 810,000 in 2006-07.Attendance at all Area Zoos and Aquariums, 2005
0
0
0
0
450,000
470,000
494,033
700,000
750,000
810,000
827,880
1,200,000
1,407,259
1,600,662
1,700,000
0 300,000 600,000 900,000 1,200,000 1,500,000 1,800,000
Charlotte
Dayton
Raleigh
Richmond
Birmingham
Kansas City
Nashville
Greensboro
Louisville
Memphis
Jacksonville
Indianapolis
Columbus
Omaha
Cincinnati
Attendance, 2005Source: The Official Musuem Directory, 2006.Cincinnati includes a conservative estimate of Newport Aquarium attendance.
Per Capita Attendance at all Area Zoos and Aquariums, 2005
0.00
0.00
0.00
0.00
0.24
0.35
0.41
0.62
0.64
0.66
0.73
0.81
0.82
1.04
1.97
0.0 0.5 1.0 1.5 2.0
Charlotte
Dayton
Raleigh
Richmond
Kansas City
Nashville
Birmingham
Louisville
Memphis
Jacksonville
Indianapolis
Cincinnati
Columbus
Greensboro
Omaha
Per Capita Attendance, 2005Source: The official Musuem Directory, 2006.Cincinnati includes a conservative estimate ofNewport Aquarium attendance.

Economic importance of arts and cultural attractions in Louisville
One finds a similar pattern when looking only at zoos, and using data from the Association of Zoos and Aquariums for 2005. Louisville and Memphis are nearly identical in zoo activity and population size. Omaha and Greensboro stand out in terms of zoo activity in a smaller market, while Kansas City, Nashville have below average zoo activity. Charlotte and Richmond have private zoos, with no data published.
Zoo Attendance and Annual Budgets, 2005
$0
$5,000,000
$10,000,000
$15,000,000
$20,000,000
$25,000,000
$30,000,000
0 200,000 400,000 600,000 800,000 1,000,000 1,200,000 1,400,000 1,600,000
Attendance
Bud
get
Source: Association of Zoos and Aquariums, 2007 Directory.
Dayton
Cincinnati
Columbus
Omaha
Indianapolis
Jacksonville
Memphis
Greensboro
Louisville
Kansas City
Birmingham
Nashville
Economic importance of arts and cultural attractions in Louisville
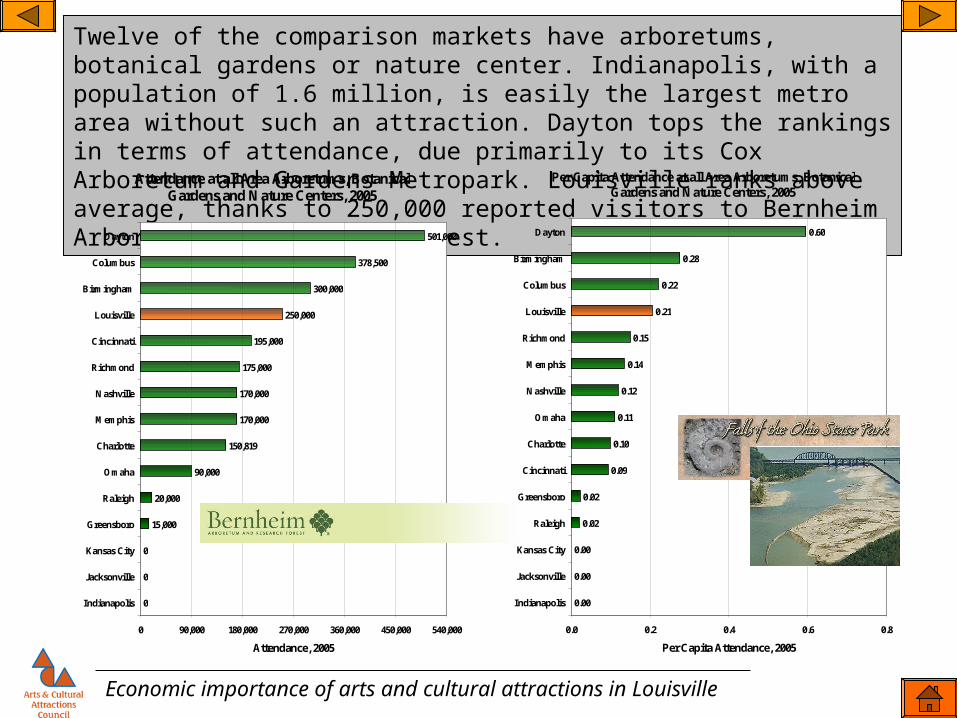
Twelve of the comparison markets have arboretums, botanical gardens or nature center. Indianapolis, with a population of 1.6 million, is easily the largest metro area without such an attraction. Dayton tops the rankings in terms of attendance, due primarily to its Cox Arboretum and Gardens Metropark. Louisville ranks above average, thanks to 250,000 reported visitors to Bernheim Arboretum and Research Forest.
Attendance at all Area Arboretums, Botanical Gardens and Nature Centers, 2005
0
0
0
15,000
20,000
90,000
150,819
170,000
170,000
175,000
195,000
250,000
300,000
378,500
501,000
0 90,000 180,000 270,000 360,000 450,000 540,000
Indianapolis
Jacksonville
Kansas City
Greensboro
Raleigh
Omaha
Charlotte
Memphis
Nashville
Richmond
Cincinnati
Louisville
Birmingham
Columbus
Dayton
Attendance, 2005Source: The Official Musuem Directory, 2006.
Per Capita Attendance at all Area Arboretums, Botanical Gardens and Nature Centers, 2005
0.00
0.00
0.00
0.02
0.02
0.09
0.10
0.11
0.12
0.14
0.15
0.21
0.22
0.28
0.60
0.0 0.2 0.4 0.6 0.8
Indianapolis
Jacksonville
Kansas City
Raleigh
Greensboro
Cincinnati
Charlotte
Omaha
Nashville
Memphis
Richmond
Louisville
Columbus
Birmingham
Dayton
Per Capita Attendance, 2005Source: The Official Musuem Directory, 2006.

Economic importance of arts and cultural attractions in Louisville
All of the comparison markets have historic sites and houses. Jacksonville tops the rankings in terms of attendance, with eight listed attractions. The largest are the Fort Matanzas National Monument (700,000 visitors) and the Castillo de San Marcos National Monument (650,000). Eleven sites are listed for the Louisville area, with my Old Kentucky Home state park posting the greatest attendance (100,0000).
Attendance at all Area Historic Sites & Houses, 2005
20,000
39,000
72,443
76,504
104,595
150,000
186,500
191,780
305,949
346,752
655,458
661,075
1,052,672
1,080,769
1,825,314
0 400,000 800,000 1,200,000 1,600,000 2,000,000
Greensboro
Raleigh
Columbus
Cincinnati
Charlotte
Birmingham
Omaha
Dayton
Indianapolis
Louisville
Nashville
Memphis
Kansas City
Richmond
Jacksonville
Attendance, 2005Source: The Official Musuem Directory, 2006.
Per Capita Attendance at all Area Historic Sites& Houses, 2005
0.03
0.04
0.04
0.04
0.07
0.14
0.19
0.23
0.23
0.29
0.46
0.53
0.54
0.92
1.46
0.0 0.2 0.4 0.6 0.8 1.0 1.2 1.4 1.6
Greensboro
Cincinnati
Raleigh
Columbus
Charlotte
Birmingham
Indianapolis
Dayton
Omaha
Louisville
Nashville
Memphis
Kansas City
Richmond
Jacksonville
Per Capita Attendance, 2005Source: The Official Musuem Directory, 2006.
Economic importance of arts and cultural attractions in Louisville
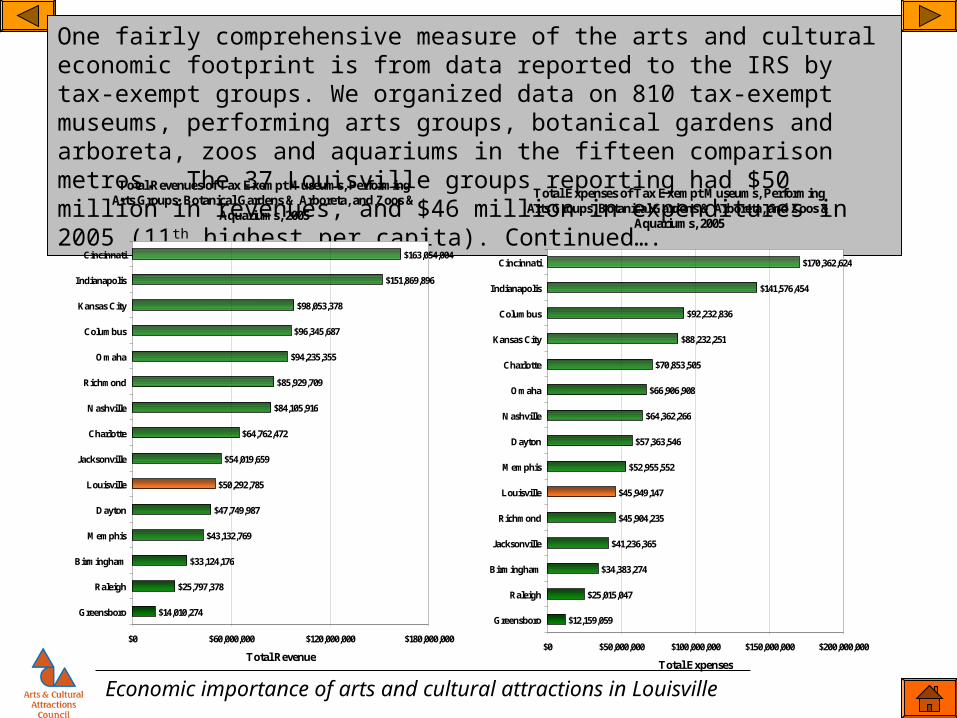
One fairly comprehensive measure of the arts and cultural economic footprint is from data reported to the IRS by tax-exempt groups. We organized data on 810 tax-exempt museums, performing arts groups, botanical gardens and arboreta, zoos and aquariums in the fifteen comparison metros. The 37 Louisville groups reporting had $50 million in revenues, and $46 million in expenditures in 2005 (11th highest per capita). Continued….
Total Revenues of Tax Exempt Museums, Performing Arts Groups, Botanical Gardens & Arboreta, and Zoos &
Aquariums, 2005
$14,010,274
$25,797,378
$33,124,176
$43,132,769
$47,749,987
$50,292,785
$54,019,659
$64,762,472
$84,105,916
$85,929,709
$94,235,355
$96,345,687
$98,053,378
$151,869,896
$163,054,004
$0 $60,000,000 $120,000,000 $180,000,000
Greensboro
Raleigh
Birmingham
Memphis
Dayton
Louisville
Jacksonville
Charlotte
Nashville
Richmond
Omaha
Columbus
Kansas City
Indianapolis
Cincinnati
Total Revenue
Source: National Center for Charitable Statistics, Dataweb, Core Data on Public Charities, 2005.
Total Expenses of Tax Exempt Museums, Performing Arts Groups, Botanical Gardens & Arboreta, and Zoos &
Aquariums, 2005
$12,159,059
$25,015,047
$34,383,274
$41,236,365
$45,904,235
$45,949,147
$52,955,552
$57,363,546
$64,362,266
$66,906,908
$70,853,505
$88,232,251
$92,232,836
$141,576,454
$170,362,624
$0 $50,000,000 $100,000,000 $150,000,000 $200,000,000
Greensboro
Raleigh
Birmingham
Jacksonville
Richmond
Louisville
Memphis
Dayton
Nashville
Omaha
Charlotte
Kansas City
Columbus
Indianapolis
Cincinnati
Total Expenses
Source: National Center for Charitable Statistics, Dataweb, Core Data on Public Charities, 2005.
Economic importance of arts and cultural attractions in Louisville
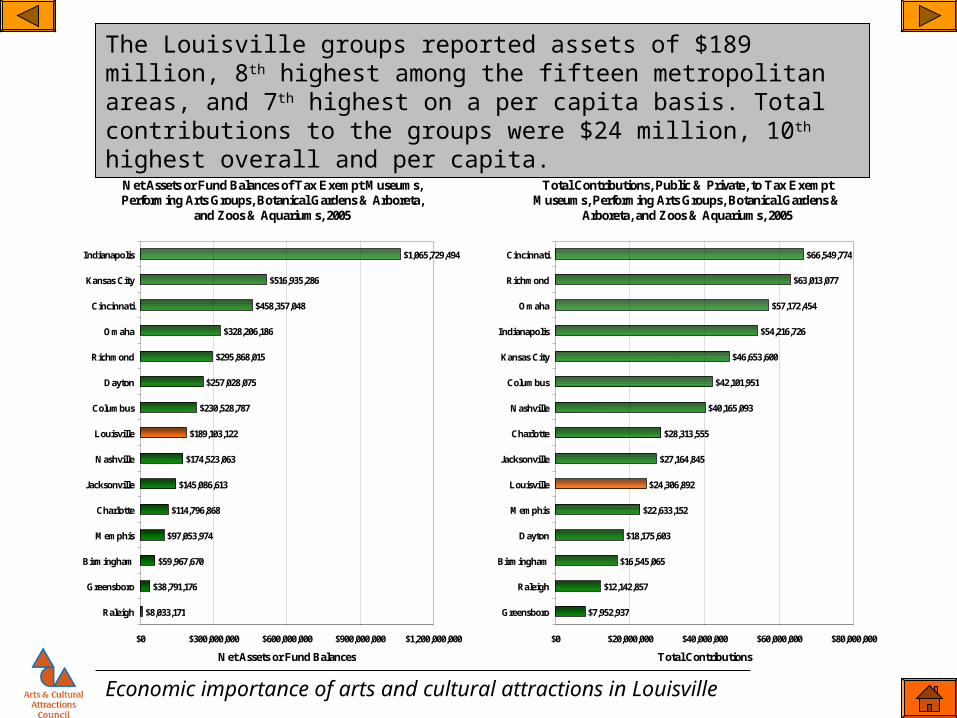
The Louisville groups reported assets of $189 million, 8th highest among the fifteen metropolitan areas, and 7th highest on a per capita basis. Total contributions to the groups were $24 million, 10th highest overall and per capita.
Net Assets or Fund Balances of Tax Exempt Museums, Performing Arts Groups, Botanical Gardens & Arboreta,
and Zoos & Aquariums, 2005
$8,033,171
$38,791,176
$59,967,670
$97,053,974
$114,796,868
$145,086,613
$174,523,063
$189,103,122
$230,528,787
$257,028,075
$295,868,015
$328,206,186
$458,357,048
$516,935,286
$1,065,729,494
$0 $300,000,000 $600,000,000 $900,000,000 $1,200,000,000
Raleigh
Greensboro
Birmingham
Memphis
Charlotte
Jacksonville
Nashville
Louisville
Columbus
Dayton
Richmond
Omaha
Cincinnati
Kansas City
Indianapolis
Net Assets or Fund Balances
Source: National Center for Charitable Statistics, Dataweb, Core Data on Public Charities, 2005.
Total Contributions, Public & Private, to Tax Exempt Museums, Performing Arts Groups, Botanical Gardens &
Arboreta, and Zoos & Aquariums, 2005
$7,952,937
$12,142,857
$16,545,065
$18,175,603
$22,633,152
$24,306,892
$27,164,845
$28,313,555
$40,165,093
$42,101,951
$46,653,600
$54,216,726
$57,172,454
$63,013,077
$66,549,774
$0 $20,000,000 $40,000,000 $60,000,000 $80,000,000
Greensboro
Raleigh
Birmingham
Dayton
Memphis
Louisville
Jacksonville
Charlotte
Nashville
Columbus
Kansas City
Indianapolis
Omaha
Richmond
Cincinnati
Total Contributions
Source: National Center for Charitable Statistics, Dataweb, Core Data on Public Charities, 2005.

Economic importance of arts and cultural attractions in Louisville
B. DeemerCanoeCarnegie Center for Art and HistoryCarr + Waite StudiosccHillCelia’s @ MellwoodGayle Cerlan / Jacque Parsley Gallery and StudioChapman Friedman Gallery (2)Chez Moi GalleryCobalt ArtworksMary Craik GalleryCrescent Hill GalleryDunbar & Bryant Art StudioEdenside GalleryFischer GalleryFlame RunGalerie HertzGallery at Actors TheatreGallery JanjobeGallery at The Kentucky CenterGallery Nulu
Garner - Furnish StudioGlassworks GalleryHess GalleryHidden Hill Nursery / Sculpture GardenHite Art Institute (2)Kaviar Forge & GalleryKentucky Museum of Art and CraftLionheart GalleryLouisville Visual Art AssociationMad About ArtMellwood Arts & Entertainment CenterMerridian Fine ArtObjects of DesirePaul Paletti GalleryPresents GalleryPYRO GalleryDavid Schuster CreationsSpeed Art MuseumSwanson Reed Contemporary21C MuseumZephyr Gallery
According to LOOK, a consortium of area art galleries, there are currently 44 galleries in Louisville. Some of these are counted in other categories, such as the museums and the activity at the Kentucky Center, Actors Theatre, and University of Louisville. Several establishments are more than art galleries, including the studios, Glassworks, Kaviar, Hidden Hill. The First Friday Gallery Hop and the Frankfort Avenue Trolley Hop, hosted by many of these galleries, have become cultural attractions as well.

Economic importance of arts and cultural attractions in Louisville
Most art galleries are privately owned and small, and hence there is little publicly available data on their economic activity.
The last economic census shows 14 art gallery establishments in the Louisville metropolitan area, with combined sales of $3.8 million. They employed 51 people, with annual payroll of $707,000.
Louisville ranks 13th among the comparison metros in terms of number of galleries per capita. All the metros but Omaha are below the national average, and Louisville has only about one-half the concentration as the US overall. Continued…….
Number of Retail Art Dealers per Million Residents
Louisville and Comparison MSAs
9.8
11.8
11.9
12.7
13.3
13.9
14.2
15.1
15.2
15.4
15.7
16.0
17.1
20.5
24.3
22.0
0 5 10 15 20 25 30
Memphis
Dayton
Louisville
Cincinnati
Nashville
Raleigh
Charlotte
Richmond
Greensboro
Kansas City
Columbus
Birmingham
Indianapolis
Jacksonville
Omaha
United States
Source: US Census Bureau, 2002 Economic Census. Data for NAICS industry 45392, Art Dealers.
Economic importance of arts and cultural attractions in Louisville
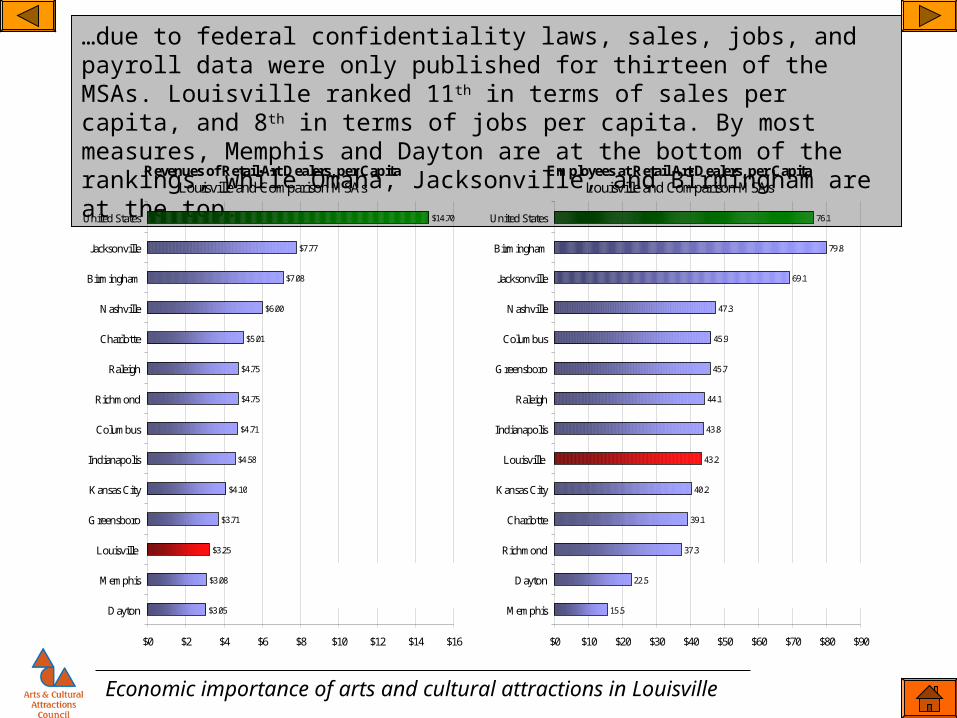
…due to federal confidentiality laws, sales, jobs, and payroll data were only published for thirteen of the MSAs. Louisville ranked 11th in terms of sales per capita, and 8th in terms of jobs per capita. By most measures, Memphis and Dayton are at the bottom of the rankings, while Omaha, Jacksonville, and Birmingham are at the top.
Revenues of Retail Art Dealers, per CapitaLouisville and Comparison MSAs
$3.05
$3.08
$3.25
$3.71
$4.10
$4.58
$4.71
$4.75
$4.75
$5.01
$6.00
$7.08
$7.77
$14.70
$0 $2 $4 $6 $8 $10 $12 $14 $16
Dayton
Memphis
Louisville
Greensboro
Kansas City
Indianapolis
Columbus
Richmond
Raleigh
Charlotte
Nashville
Birmingham
Jacksonville
United States
Source: US Census Bureau, 2002 Economic Census. Data for NAICS industry 45392, Art Dealers.
Employees at Retail Art Dealers, per CapitaLouisville and Comparison MSAs
15.5
22.5
37.3
39.1
40.2
43.2
43.8
44.1
45.7
45.9
47.3
69.1
79.8
76.1
$0 $10 $20 $30 $40 $50 $60 $70 $80 $90
Memphis
Dayton
Richmond
Charlotte
Kansas City
Louisville
Indianapolis
Raleigh
Greensboro
Columbus
Nashville
Jacksonville
Birmingham
United States
Source: US Census Bureau, 2002 Economic Census. Data for NAICS industry 45392, Art Dealers.

Economic importance of arts and cultural attractions in Louisville
Appendix A.
Museums Performing Arts
Callahan Museum: American Printing House for the Blind Actors Theatre
Carnegie Center for Art & History Blue Apple Players
Frazier International History Museum Choral Arts Society
Hite Galleries, University of Louisville Clifton Center
Howard Steamboat Museum Comedy Caravan
Jeffersontown Historical Museum Derby Dinner Playhouse
Kentucky Museum of Art and Craft Fund for the Arts
Kentucky Derby Museum Kentucky Center for the Performing Arts
Kentucky Railway Museum Kentucky Shakespeare Festival
Louisville Science Center Louisville Ballet
Louisville Slugger Museum Kentucky Opera (KCA)
Louisville Visual Art Association Kentucky Watercolor Society
Portland Museum Louisville Orchestra
Speed Art Museum Mellwood Arts & Entertainment Center
Music Theatre Louisville (amphitheatre)
Heritage and Cultural Sites Ogle Cultural and Community Center (IUS)
Cathedral Heritage Foundation Palace Theatre
Crane House PNC Bank Broadway Series
Farmington Historic Home Stage One: The Louisville Children's Theatre, Inc.
Filson Club The Louisville Chorus
Locust Grove Walden Theatre
National Society of the Sons of the American Revolution
My Old Kentucky Home State Park Nature Attractions
Riverside, The Farnsley-Moreman Landing Bernheim Arboretum and Research
Thomas Edison House Botanica
Whitehall Falls of the Ohio State Park Interpretive Center
Louisville Zoo
Yew Dell Gardens
Arts and Cultural Organizations Included in Study
Economic importance of arts and cultural attractions in Louisville
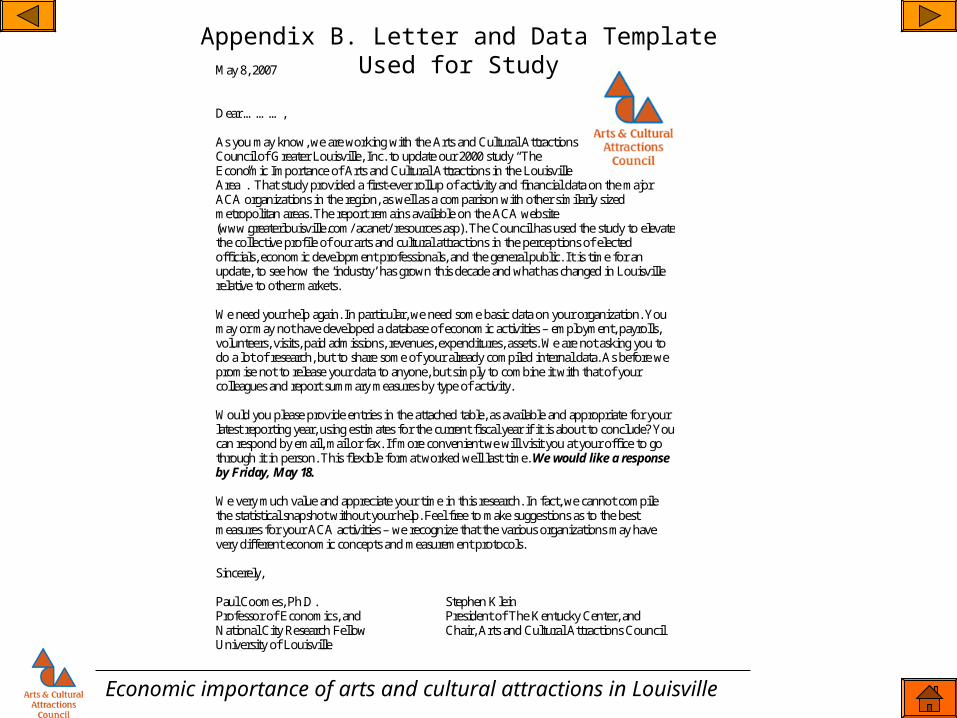
Appendix B. Letter and Data Template Used for StudyMay 8, 2007
Dear ………, As you may know, we are working with the Arts and Cultural Attractions Council of Greater Louisville, Inc. to update our 2000 study “The Economic Importance of Arts and Cultural Attractions in the Louisville Area”. That study provided a first-ever rollup of activity and financial data on the major ACA organizations in the region, as well as a comparison with other similarly sized metropolitan areas. The report remains available on the ACA website (www.greaterlouisville.com/ acanet/ resources.asp). The Council has used the study to elevate the collective profile of our arts and cultural attractions in the perceptions of elected officials, economic development professionals, and the general public. It is time for an update, to see how the ‘industry’ has grown this decade and what has changed in Louisville relative to other markets. We need your help again. In particular, we need some basic data on your organization. You may or may not have developed a database of economic activities – employment, payrolls, volunteers, visits, paid admissions, revenues, expenditures, assets. We are not asking you to do a lot of research, but to share some of your already compiled internal data. As before we promise not to release your data to anyone, but simply to combine it with that of your colleagues and report summary measures by type of activity. Would you please provide entries in the attached table, as available and appropriate for your latest reporting year, using estimates for the current fiscal year if it is about to conclude? You can respond by email, mail or fax. If more convenient we will visit you at your office to go through it in person. This flexible format worked well last time. We would like a response by Friday, May 18. We very much value and appreciate your time in this research. In fact, we cannot compile the statistical snapshot without your help. Feel free to make suggestions as to the best measures for your ACA activities – we recognize that the various organizations may have very different economic concepts and measurement protocols. Sincerely, Paul Coomes, Ph.D. Stephen Klein Professor of Economics, and President of The Kentucky Center, and National City Research Fellow Chair, Arts and Cultural Attractions Council University of Louisville

Economic importance of arts and cultural attractions in Louisville
Appendix B. Letter and Data Template Used for Study (cont)
NAME:
ORGANIZATION:
Reference Year *
* please specify calendar or fiscal year range
from admissions/ ticket sales
Visits/ attendance annually, paid and unpaid from concessions
Paid visits/ attendance from other sales
Estimated % of visitors that are not residents* from government grants
* not residents of 13-county Louisville MSA from private grants and contributions
from investment income
Average monthly full-time employment other
Average monthly part-time employment Total annual revenues
Estimate of FTE of the part-time workforce
Total annual payroll, excluding fringe benefits for personnel
Fringe benefits for materials, supplies, equipment
Annual contract labor costs for services (utilities, advertising, legal, etc)
for real estate (rent, mortgage)
Number of volunteers (individuals) annually other
Annual volunteer hours Total annual expenditures
Insured value of real estate, equipment Square feet of office space utilized
Value of financial assets Parking spots controlled
Please email to [email protected], or fax to 852.7672, or mail to Paul Coomes, College of Business, University of Louisville, Louisville KY 40292. Call with questions, 852.4841. Thanks.
Annual Budget Summary
Expenditures
Revenues
FootprintAssets
Workforce and payrolls
Services
Economic importance of arts and cultural attractions in Louisville
Area Code* MSA……………..……………..Counties
Population 2002 Area Code* MSA….………...……….………..Counties
Population 2002 Area Code* MSA………..…...….…...…..Counties
Population 2002
71000 Birmingham, AL 935,168 73480 Indianapolis, IN 1,655,097 74920 Memphis, TN-AR-MS 1,160,06501009 Blount, AL 52,968 18011 Boone, IN 48,277 47047 Fayette, TN 31,20201073 Jefferson, AL 661,153 18057 Hamilton, IN 205,610 47157 Shelby, TN 905,67801115 St. Clair, AL 67,215 18059 Hancock, IN 58,343 47167 Tipton, TN 53,43601117 Shelby, AL 153,832 18063 Hendricks, IN 114,301 05035 Crittenden, AR 51,291
18081 Johnson, IN 121,604 28033 De Soto, MS 118,45871520 Charlotte-Gastonia-Rock Hill, NC-SC 1,584,898 18095 Madison, IN 132,06837025 Cabarrus, NC 140,182 18097 Marion, IN 863,429 75360 Nashville, TN 1,270,52037071 Gaston, NC 193,443 18109 Morgan, IN 67,791 47021 Cheatham, TN 36,98637109 Lincoln, NC 66,598 18145 Shelby, IN 43,674 47037 Davidson, TN 570,78537119 Mecklenburg, NC 737,950 47043 Dickson, TN 44,23137159 Rowan, NC 133,359 73600 Jacksonville, FL 1,154,809 47147 Robertson, TN 57,44637179 Union, NC 139,611 12019 Clay, FL 152,093 47149 Rutherford, TN 194,93445091 York, SC 173,755 12031 Duval, FL 806,120 47165 Sumner, TN 136,170
12089 Nassau, FL 60,558 47187 Williamson, TN 136,88971640 Cincinnati, OH-KY-IN PMSA 1,669,136 12109 St. Johns, FL 136,038 47189 Wilson, TN 93,07939015 Brown, OH 43,46439025 Clermont, OH 183,352 73760 Kansas City, MO-KS 1,828,247 75920 Omaha, NE-IA 734,27039061 Hamilton, OH 833,721 29037 Cass, MO 87,310 31025 Cass, NE 24,83939165 Warren, OH 175,133 29047 Clay, MO 191,381 31055 Douglas, NE 472,74421015 Boone, KY 93,290 29049 Clinton, MO 19,632 31153 Sarpy, NE 129,31921037 Campbell, KY 88,604 29095 Jackson, MO 660,773 31177 Washington, NE 19,21121077 Gallatin, KY 7,836 29107 Lafayette, MO 33,125 19155 Pottawattamie, IA 88,15721081 Grant, KY 23,620 29165 Platte, MO 77,65521117 Kenton, KY 152,164 29177 Ray, MO 23,811 76640 Raleigh-Durham-Chapel Hill, NC 1,267,67621191 Pendleton, KY 14,815 20091 Johnson, KS 476,536 37037 Chatham, NC 53,89318029 Dearborn, IN 47,333 20103 Leavenworth, KS 70,789 37063 Durham, NC 234,19918115 Ohio, IN 5,804 20121 Miami, KS 28,904 37069 Franklin, NC 50,449
20209 Wyandotte, KS 158,331 37101 Johnston, NC 133,15971840 Columbus, OH 1,583,907 37135 Orange, NC 120,45839041 Delaware, OH 125,399 74280 Lexington, KY 489,717 37183 Wake, NC 675,51839045 Fairfield, OH 129,161 21017 Bourbon, KY 19,57639049 Franklin, OH 1,086,814 21049 Clark, KY 33,726 76760 Richmond-Petersburg, VA 1,023,41939089 Licking, OH 148,731 21067 Fayette, KY 263,618 51036 Charles City, VA 7,23939097 Madison, OH 40,365 21113 Jessamine, KY 40,740 51041 Chesterfield, VA 271,14239129 Picaway, OH 53,437 21151 Madison, KY 73,334 51053 Dinwiddie, VA 24,747
21209 Scott, KY 35,320 51075 Goochland, VA 17,52372000 Dayton-Springfield, OH 947,446 21239 Woodford, KY 23,403 51085 Hanover, VA 92,05039023 Clark, OH 143,416 51087 Henrico, VA 268,27039057 Greene, OH 149,964 74520 Louisville, KY-IN 1,039,599 51127 New Kent, VA 14,15739109 Miami, OH 99,596 21029 Bullitt, KY 63,800 51145 Powhatan, VA 23,99739113 Montgomery, OH 554,470 21111 Jefferson, KY 698,080 51149 Prince George, VA 34,135
21185 Oldham, KY 49,310 51570 Colonial Heights city, VA 17,06373120 Greensboro-Winson Salem-High Point, NC 1,286,265 18019 Clark, IN 98,198 51670 Hopewell city, VA 22,52537001 Alamance, NC 135,893 18043 Floyd, IN 71,633 51730 Petersburg city, VA 33,11537057 Davidson, NC 151,238 18061 Harrison, IN 35,244 51760 Richmond city, VA 197,45637059 Davie, NC 36,734 18143 Scott, IN 23,33437067 Forsyth, NC 314,93337081 Guilford, NC 430,93737151 Randolph, NC 134,21737169 Stokes, NC 44,98437197 Yadkin, NC 37,329
* Federal Information Processing Standards (FIPS) codes, for metropolitan areas defined as of June 30, 1996; and for counties as of January 1, 1990.
Population data from US Census Bureau.
Component Counties of 16 Competitor Metros